Visual Abstract
Keywords: antiandrogen, response assessment, CRPC, radiopharmaceutical, prognosis
Abstract
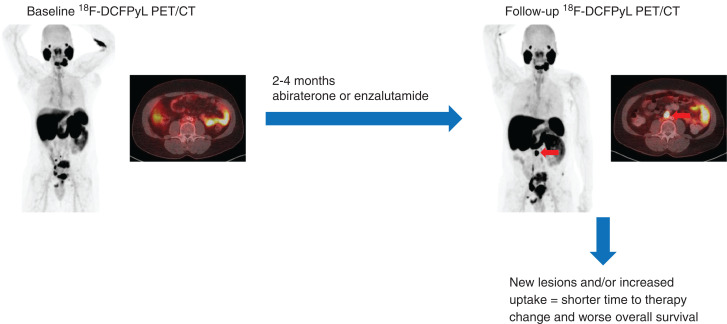
PET with small molecules targeting prostate-specific membrane antigen (PSMA) is being adopted as a clinical standard for prostate cancer imaging. In this study, we evaluated changes in uptake on PSMA-targeted PET in men starting abiraterone or enzalutamide. Methods: This prospective, single-arm, 2-center, exploratory clinical trial enrolled men with metastatic castration-resistant prostate cancer initiating abiraterone or enzalutamide. Each patient was imaged with 18F-DCFPyL at baseline and within 2–4 mo after starting therapy. Patients were followed for up to 48 mo from enrollment. A central review evaluated baseline and follow-up PET scans, recording change in SUVmax at all disease sites and classifying the pattern of change. Two parameters were derived: the δ-percent SUVmax (DPSM) of all lesions and the δ-absolute SUVmax (DASM) of all lesions. Kaplan–Meier curves were used to estimate time to therapy change (TTTC) and overall survival (OS). Results: Sixteen evaluable patients were accrued to the study. Median TTTC was 9.6 mo (95% CI, 6.9–14.2), and median OS was 28.6 mo (95% CI, 18.3–not available [NA]). Patients with a mixed-but-predominantly-increased pattern of radiotracer uptake had a shorter TTTC and OS. Men with a low DPSM had a median TTTC of 12.2 mo (95% CI, 11.3–NA) and a median OS of 37.2 mo (95% CI, 28.9–NA), whereas those with a high DPSM had a median TTTC of 6.5 mo (95% CI, 4.6–NA, P = 0.0001) and a median OS of 17.8 mo (95% CI, 13.9–NA, P = 0.02). Men with a low DASM had a median TTTC of 12.2 mo (95% CI, 11.3–NA) and a median OS of NA (95% CI, 37.2 mo–NA), whereas those with a high DASM had a median TTTC of 6.9 mo (95% CI, 6.1–NA, P = 0.003) and a median OS of 17.8 mo (95% CI, 13.9–NA, P = 0.002). Conclusion: Findings on PSMA-targeted PET 2–4 mo after initiation of abiraterone or enzalutamide are associated with TTTC and OS. Development of new lesions or increasing intensity of radiotracer uptake at sites of baseline disease are poor prognostic findings suggesting shorter TTTC and OS.
There is interest in the use of PET radiotracers targeting the prostate-specific membrane antigen (PSMA) to improve imaging of men with prostate cancer (PCa) (1). PSMA is a transmembrane type II glycoprotein that is overexpressed on most PCa cells (2). Over the last 5 years, PSMA-targeted imaging has been used for initial staging of men with high-risk PCa (3), restaging of men with biochemical failure after attempted curative local therapy (4), and selection of men with metastatic disease for treatment with PSMA-targeted endoradiotherapy (5).
There are few data on the prognostic value of PSMA-targeted PET and the use of PSMA ligands for following response to therapy in men with PCa. For first-line systemic treatment with androgen deprivation therapy, the interplay between androgen signaling and PSMA expression can lead to increased PSMA on the cell surface and a short-term flare phenomenon on PSMA-targeted PET (6,7). Long-term androgen deprivation therapy tends to produce decreasing lesion conspicuity (8). Some studies have reported a flare in castration-resistant PCa after initiation of second-generation antiandrogen agents (abiraterone or enzalutamide) (9,10), whereas others suggest that increasing uptake on PSMA-targeted PET reflects progression and worsening disease (11). There is increasing interest in following patients with PCa using serial PSMA-targeted PET, and an approach to determining progression was recently introduced (12).
The aim of this prospective, single-arm, 2-center, exploratory clinical trial was to evaluate the ability of PSMA-targeted PET to determine progression relative to conventional imaging with bone scanning and CT. A post hoc analysis was also used to provide pilot data on the association of metrics of response and survival between baseline and short-interval follow-up PSMA-targeted PET/CT using 18F-DCFPyL (13) in men with castration-resistant PCa starting treatment with abiraterone or enzalutamide.
MATERIALS AND METHODS
This study was registered with ClinicalTrials.gov (NCT02856100 and NCT02691169) and was performed under the auspices of a U.S. Food and Drug Administration investigational new drug application (IND121064) and a Health Canada clinical trial application (control no. 190215). The study was approved by the institutional review boards at both McMaster University and Johns Hopkins Hospital.
Patients
The inclusion criteria for the study were as follows: an age of at least 18 y; histologically or cytologically confirmed prostate adenocarcinoma without neuroendocrine differentiation or small cell features; a plan to start abiraterone or enzalutamide within 1–7 d after baseline 18F-DCFPyL PET/CT; documented progressive metastatic PCa as assessed by the treating clinician, with either a rising level of serum prostate-specific antigen (PSA) on 2 determinations at least 1 wk apart or radiographic progression; ongoing androgen deprivation, with a serum testosterone level of less than 50 ng/dL; an Eastern Cooperative Oncology Group performance status of no more than 2; a hemoglobin level of at least 90 g/L; a platelet count of more than 100,000/μL; a serum albumin level of at least 30 g/L; a serum creatinine level of less than 1.5 times the upper limit of normal or a calculated creatinine clearance of at least 60 mL/min; and a serum potassium level of at least 3.5 mmol/L.
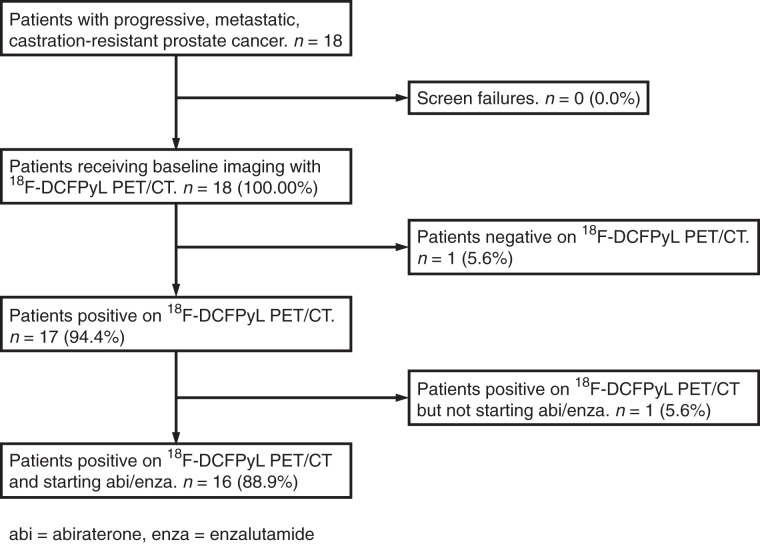
The exclusion criteria were as follows: abnormal liver function with a serum bilirubin level of at least 1.5 times the upper limit of normal or an aspartate transaminase or alanine aminotransferase level of at least 2.5 times the upper limit of normal; uncontrolled hypertension; active viral hepatitis or chronic liver disease; a history of pituitary or adrenal dysfunction; clinically significant heart disease; other malignancies, except nonmelanoma skin cancer; known brain metastases; a history of gastrointestinal disorders that would interfere with absorption of orally administered hormonal agents; unresolved acute toxicities due to prior therapy; and current enrollment in an investigational drug or device study or participation in such a study within 30 d. Figure 1 shows a Standards for Reporting Diagnostic Accuracy (STARD) diagram of this study.
FIGURE 1.
STARD diagram of study.
Imaging Protocol
Baseline 18F-DCFPyL PET/CT was performed within 7 d of initiating abiraterone or enzalutamide therapy. Follow-up PET/CT was done between 2 and 4 mo after initiation of therapy. 18F-DCFPyL was synthesized according to current good manufacturing practices as previously described (14). Patients were asked to be nil per os for 4 h before radiotracer administration. 18F-DCFPyL (333 MBq [9 mCi]) was administered intravenously 60 ± 10 min before imaging. PET/CT from the mid thighs through the skull vertex was performed on one of several scanners: a 128-slice Biograph mCT (Siemens Healthineers), a 16-slice Biograph (Siemens Healthineers), or a 64-slice Discovery RX (GE Healthcare). The scanners were operated in 3-dimensional emission mode with CT attenuation correction. Standard ordered-subset expectation maximization reconstructions were used. All images were transferred to a central workstation for review. The baseline PET/CT is hereafter referred to as PET1 and follow-up PET/CT scan as PET2.
Within 2 wk of PET1 or PET2, respectively, baseline and follow-up conventional imaging (bone scanning and contrast-enhanced CT of the chest, abdomen, and pelvis) were performed.
Clinical Follow-up
PSA was assessed at baseline and at the time of follow-up imaging. The PSA response to therapy was considered significantly decreased (>50% PSA decrease), stable (≤50% decrease), or increased. Time to therapy change (TTTC, a surrogate for clinical progression) and overall survival (OS) were determined by review of the electronic medical record. TTTC was calculated as the number of days the patient was on a second-generation antiandrogen therapy until the primary treating oncologist determined that progression had occurred (based on standard-of-care imaging or laboratory or clinical assessment), the patient died, or the patient was lost to follow-up. OS was calculated as the number of days from initiation of second-generation antiandrogen therapy to death, loss to follow-up, or final date of censoring. Data were censored on April 20, 2020, 48 mo after the start of the study.
Image Analysis
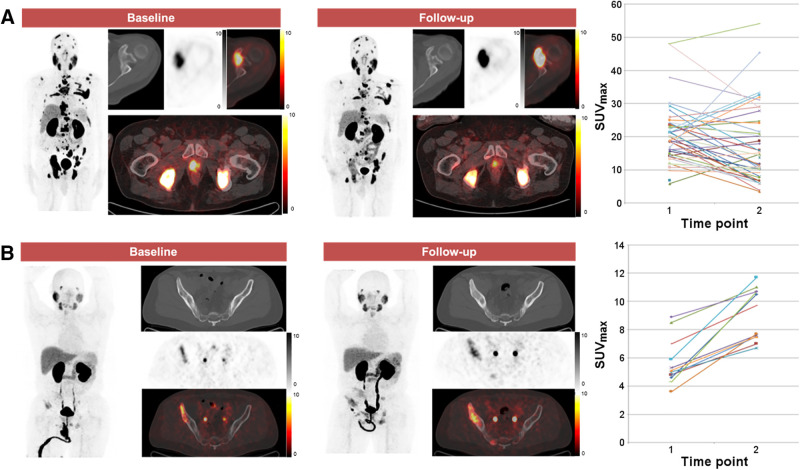
A consensus central review was performed, with all images analyzed by 3 board-certified nuclear medicine physicians with experience in the interpretation of PSMA-targeted PET. The images were analyzed using an XD3 workstation (Mirada Medical). For each PET exam, the total number of 18F-DCFPyL–positive disease sites, in addition to the location, size, and avidity (SUVmax) of each lesion, was recorded. The total tumor burden was defined as the total number of sites of 18F-DCFPyL–positive disease. The change in avidity (SUVmax) for each lesion between PET1 and PET2, and the appearance of new lesions, were determined. The overall change in avidity between PET1 and PET2 was then classified into 1 of 5 categories: all-increased (all lesions increased in avidity), mixed-but-predominantly-increased (>50% of lesions increased in avidity, Fig. 2), mixed (same number of lesions increased in avidity as decreased in avidity), mixed-but-predominantly-decreased (>50% lesions decreased in avidity), and all-decreased (all lesions decreased in avidity). We defined 2 additional 18F-DCFPyL PET parameters to semiquantitatively reflect change from PET1 to PET2. The first is Δ-percent SUVmax (DPSM), or the sum of the percentage change in SUVmax between PET1 and PET2 for 18F-DCFPyL–positive disease sites (not including new lesions):
FIGURE 2.
Examples of patterns of change in 18F-DCFPyL uptake. (A) 72-y-old man with extensive metastatic castration-resistant PCa who developed mixed-but-predominantly-decreased pattern of uptake on PET2. This patient had TTTC of 9.3 mo and OS of 26.6 mo. (B) 52-y-old man with more limited metastatic castration-resistant PCa in whom pattern of all-increased uptake on PET2 was observed. This patient had TTTC of 7.1 mo and OS of 14.1 mo. In each subpanel, the maximum-intensity-projection image of the PET is shown followed by representative axial CT, PET, and PET/CT fused images.
The second is Δ-absolute SUVmax (DASM), or the sum of the absolute SUVmax change between PET1 and PET2 for 18F-DCFPyL–positive disease sites (not including new lesions):
The conventional imaging obtained at the time of PET1 and PET2 was reviewed by the same readers. Using RECIST, version 1.1, and Prostate Cancer Clinical Trials Working Group 3 criteria all patients were classified as having response, stable disease, or progression at the PET2 time point.
Statistical Methods
Continuous variables are reported as median and interquartile range (IQR). Patients were classified into high and low groups based on median values. The cutoffs for DPSM, DASM, and number of lesions at baseline were 33, 556, and 13, respectively. To compare 18F-DCFPyL PET/CT with conventional imaging, we treated DASM and DPSM above the median for this patient cohort as evidence of progression on PET. Kaplan–Meier curves were used to estimate TTTC and OS probabilities, and the univariate Cox proportional-hazards model was used to compare differences in TTTC and OS between the high and low groups. Kaplan–Meier curves were used instead of cumulative probability curves for TTTC because no deaths occurred before changes in therapy. All statistical tests were 2-sided, and statistical significance was set at a P value of less than or equal to 0.05. Analyses were performed in R, version 3.6.2 (15).
Results
Patients
Between April 2016 and December 2016, 18 Caucasian men were enrolled (8 at Johns Hopkins and 10 through McMaster University–affiliated hospitals). One (6%) of the 18 had no visible lesions on either 18F-DCFPyL PET/CT scan and was excluded. Another (6%) underwent the PET1 scan but was not started on abiraterone or enzalutamide and was also excluded. For the 16 men who were analyzed, the median age was 71.5 y (IQR, 66.8–72.0 y). Serum PSA at the time of PET1 was 24.0 ng/mL (IQR, 12.1–47.1 ng/mL). Fourteen (88%) of the 16 men were started on abiraterone, and 2 (13%) were started on enzalutamide. Although not in the exclusion criteria, none of the patients had previously received either chemotherapy or a prior second-generation antiandrogen agent. Additional details are included in Table 1.
TABLE 1.
Selected Demographic and Clinical Information for Patients Included in Analysis
| Parameter | Data |
|---|---|
| Age (y) | 71.5 (66.8–72.0) |
| Caucasian race | 100% |
| PSA (ng/mL) | |
| PET1 | 24.0 (12.1–47.1) |
| PET2 | 11.0 (6.1–27.0) |
| Interval between PET1 and PET2 (d) | 84 (70–91.5) |
| Therapy initiated | |
| Abiraterone | 88% |
| Enzalutamide | 13% |
Qualitative data are percentages based on 16-patient sample size; continuous data are median and IQR. Mention of race is relevant in the context of prostate cancer because Black patients tend to have more aggressive underlying biology of disease and less access to health care in the United States.
Clinical Follow-up
After therapy initiation, 10 (62.5%) of the 16 men had a serum PSA decrease, and in 8 (80%) of these 10 the decrease was more than 50%. For these 10 men, the median PSA at the first follow-up was 8.8 ng/dL (IQR, 5.5–13.4 ng/dL) and the median TTTC was 16.6 mo (IQR, 11.2–22.0 mo). Six men (38%) had a rise in PSA; for these men, the PSA at the first follow-up was 41.2 ng/mL (IQR, 17.3–54.3 ng/mL) and TTTC was 5.4 mo (IQR, 3.8–6.8 mo).
As of the final censoring date (April 20, 2020): 10 men had died, 4 remained alive, and 2 had been lost to follow-up. Of the 4 men who were still alive, 2 remained on therapy with abiraterone. The median time of follow-up was 28.2 mo (IQR, 18.4–38.9 mo).
18F-DCFPyL PET/CT Image Analysis
Table 2 summarizes the clinical parameters and the corresponding PET findings.
TABLE 2.
Selected Clinical and Imaging Data for Patients in This Study
| Patient | Change in PSA (%) | DASM | DPSM | Overall change in avidity between PET1 and PET2 | Conventional imaging radiologic progression | TTTC (mo) | OS (mo) |
|---|---|---|---|---|---|---|---|
| 1 | −71.8 | +227.6 | +3558.4 | Mixed but predominantly increased | Yes | 10.3 | 18.6 |
| 2 | −1.6 | −29.9 | −462.5 | All decreased | No | 43.6 | 43.6 |
| 3 | −53.3 | −4.3 | −38.4 | Mixed | No | 42.2 | 42.2 |
| 4 | +146.5 | +29.5 | +1637.9 | Mixed but predominantly increased | Yes | 3.5 | 33.3 |
| 5 | +63.5 | +98.8 | +1124.3 | Mixed but predominantly increased | Yes | 4.6 | 17.7 |
| 6 | +146.9 | +74.8 | +2517.7 | Mixed but predominantly increased | Yes | 3.3 | 7.1 |
| 7 | −57.7 | +16.0 | +87.2 | All increased | No | 12.8 | 37.8 |
| 8 | −88.5 | +40.5 | +804.0 | All increased | Yes | 7.1 | 14.1 |
| 9 | +87.5 | +4.5 | +13.2 | All increased | No | 11.9 | 47.8 |
| 10 | −65.5 | +13.4 | +87.3 | Mixed | No | 14.4 | 45.8 |
| 11 | −93.7 | +3.5 | +114.2 | Mixed | No | 11.4 | 29.1 |
| 12 | +135.7 | +171.8 | +3107.9 | Mixed but predominantly increased | Yes | 6.2 | 13.4 |
| 13 | −44.4 | +36.6 | +308.6 | All Increased | No | 10.4 | 29.4 |
| 14 | −88.4 | −138.4 | −566.3 | Mixed but predominantly decreased | Yes | 9.3 | 26.6 |
| 15 | +75.0 | +275.1 | +3223.7 | Mixed but predominantly decreased | No | 7.0 | 22.5 |
| 16 | −68.2 | +76.6 | +1542.2 | All increased | No | 7.0 | 27.4 |
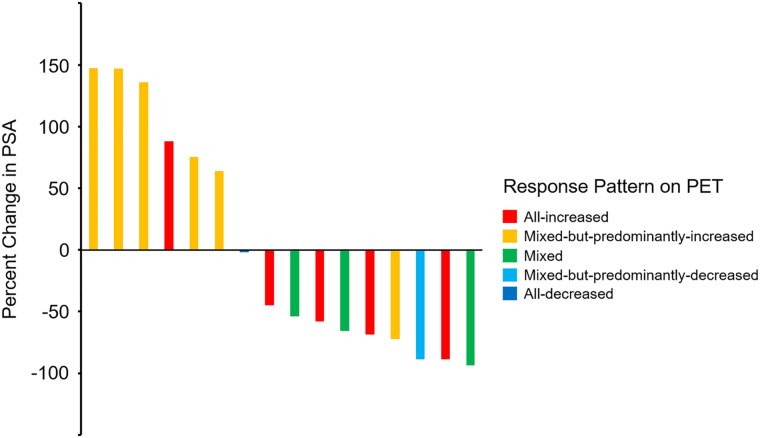
Most of the men in our study, 12 (67%) of initial 18, had a high baseline 18F-DCFPyL–avid metastatic tumor burden (5 or more 18F-DCFPyL–positive lesions on PET1). Five (31%) had an all-increased pattern; 6 (38%), a mixed-but-predominantly-increased pattern; 3 (19%), a mixed pattern; 1 (6%), a mixed-but-predominantly-decreased pattern; and 1 (6%), an all-decreased pattern. A waterfall plot depicting the percentage change in PSA that occurred relative to the change in patterns of 18F-DCFPyL uptake between PET1 and PET2 is shown in Figure 3.
FIGURE 3.
Waterfall plot demonstrating changes in PSA, color-coded according to changes in patterns of uptake on PET. Patient with smallest percentage change in PSA from baseline (seventh patient from left) is coded “all-decreased.”
Nine (56%) of the 16 men who were analyzed had new sites of radiotracer uptake on PET2, and 5 (56%) had increased PSA. The median TTTC for the 9 men with new 18F-DCFPyL PET–positive metastases was 7.0 mo (IQR, 4.6–9.3 mo). In comparison, of the 7 men without new 18F-DCFPyL PET–positive metastases, only 1 (14%) had an increased PSA, and the median TTTC was 12.8 mo (IQR, 11.2–28.3 mo). All men (6/6, 100%) with increased PSA had either a mixed-but-predominantly-increased pattern (5/6, 83%) or an all-increased pattern (1/6, 17%) of PSMA-avid disease.
There were 6 men with mixed-but-predominantly-increased uptake on PET2, and this finding was associated with an unfavorable response to therapy, with a median TTTC of 5.4 mo (IQR, 3.8–6.8 mo). All had a high baseline tumor burden and a positive DPSM and DASM. Most subjects, 5 (83%) of 6, with a mixed-but-predominantly-increased pattern had an increased PSA and new 18F-DCFPyL PET–positive sites of suspected metastases on follow-up. However, 1 man with an all-decreased pattern and a high metastatic tumor burden on baseline PET1 had a favorable therapy response with a prolonged TTTC (43.6 mo), a negative DPSM (−462.5), and a negative DASM (−29.9).
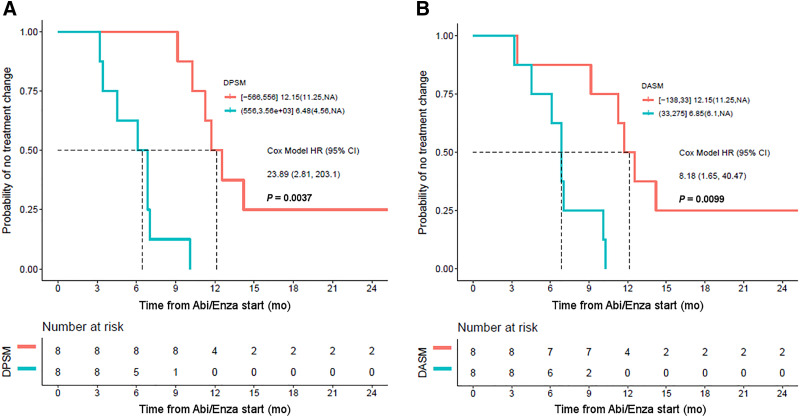
Across all men, the median TTTC was 9.6 mo (95% CI, 6.9–14.2 mo). Men with a positive and high (increasing avidity from PET1 to PET2) DPSM and DASM had an unfavorable therapy response with a shorter TTTC. As illustrated in Figure 4, there was a significant difference (P = 0.0001) in TTTC for men with an 18F-DCFPyL PET–positive disease burden above the median DPSM (6.5 mo; 95% CI, 4.6 mo–NA) versus those below the median (12.2 mo; 95% CI, 11.3 mo–NA). The Cox model hazard ratio for high DPSM was 23.9 (95% CI, 2.8–203.1). In regard to DASM, for those men above the median the TTTC was 6.9 mo (95% CI, 6.1 mo–NA), versus 12.2 mo (95% CI, 11.3 mo–NA) for those below the median (P = 0.003). The Cox model hazard ratio for high DASM was 8.2 (95% CI, 1.7–40.5).
FIGURE 4.
(A) Kaplan–Meier curve demonstrating that DPSM is associated with TTTC, with high DPSM corresponding to patients with shorter TTTC (blue curve) and low DPSM corresponding to patients with longer TTTC (orange curve). (B) Similar results were found with DASM. Abi/Enza = abiraterone/enzalutamide; HR = hazard ratio.
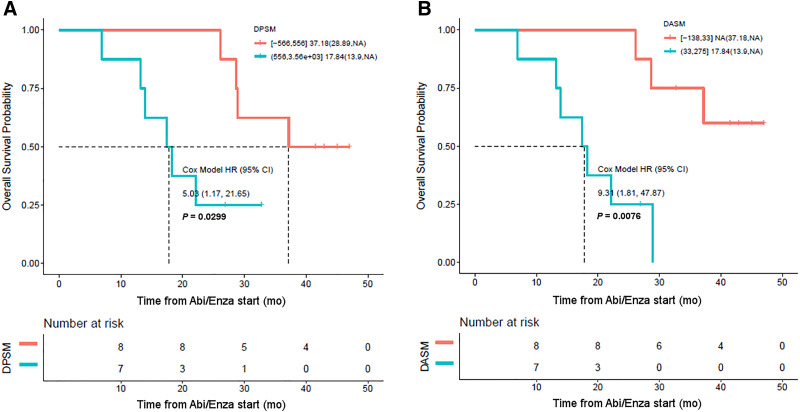
DPSM and DASM were also associated with OS (Fig. 5). Median OS across all patients was 28.6 mo (95% CI, 18.3 mo–NA). However, the median OS for men with an 18F-DCFPyL PET–positive disease burden above the median DPSM was 17.8 mo (95% CI, 13.9 mo–NA), whereas the median OS for men below the median DPSM was 37.2 mo (95% CI, 28.9 mo–NA, P = 0.02; Fig. 5). The median OS for men with an 18F-DCFPyL PET–positive disease burden above the median DASM was 17.8 mo (95% CI, 13.9 mo–NA), whereas for those below the median DASM it was NA (95% CI, 37.2 mo–NA), which was significant (P = 0.002). The Cox model hazard ratio for high DASM was 9.3 (95% CI, 1.8–47.9).
FIGURE 5.
(A) Kaplan–Meier curve demonstrating that DPSM is associated with OS, with high DPSM corresponding to patients with shorter OS (blue curve) and low DPSM corresponding to patients with longer OS (orange curve). (B) Similar results were found with DASM. Abi/Enza = abiraterone/enzalutamide; HR = hazard ratio.
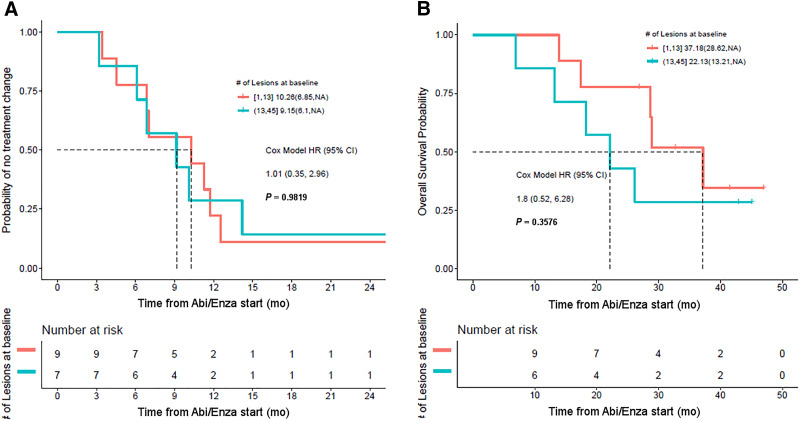
Stratifying patients by tumor burden suggests that the number of lesions at baseline was not associated with TTTC (Fig. 6). Although the separation of the survival curves suggests a longer OS based on a low number of lesions at baseline, this difference did not reach significance (P = 0.35).
FIGURE 6.
(A) Kaplan–Meier curves showing no difference in TTTC in patients with high PSMA-avid tumor burden at baseline (blue curve) and low PSMA-avid tumor burden at baseline (red curve). (B) Patients with lower baseline tumor burden also did not have significantly better OS. Abi/Enza = abiraterone/enzalutamide; HR = hazard ratio.
Comparison to Conventional Imaging
Seven (44%) of 16 patients had progression by both RECIST 1.1 and the criteria of the Prostate Cancer Clinical Trials Working Group 3 on conventional imaging contemporaneous with PET2, whereas 7 (44%) had stable disease and 2 (13%) had a partial response. Of the 6 patients with rising PSA at the time of PET2, 4 (67%) had progression on conventional imaging. Of the 10 patients with decreasing PSA at the time of PET2, 3 (30%) had progression on conventional imaging.
Of the 5 patients who had an all-increased pattern of uptake on PET2, 1 (20%) demonstrated evidence of progression on conventional imaging. Of the 6 patients with mixed-but-predominantly-increased uptake on PET2, 5 (83%) had progression on conventional imaging. None of the patients with a mixed pattern of uptake had progression on conventional imaging. The 1 patient with a mixed-but-predominantly-decreased pattern of uptake on PET2 had progression on conventional imaging, and the 1 patient with an all-decreased pattern of uptake did not have progression on conventional imaging.
Of the 8 patients with a TTTC longer than the median, 1 (13%) had evidence of progression on conventional imaging at the time of PET2. Of the 8 patients with a TTTC shorter than the median, 6 (75%) had progression on conventional imaging. Of the 8 patients with an OS longer than the median, 1 (13%) also had progression on conventional imaging. Finally, of the 8 patients with an OS shorter than the median, 6 (75%) had progression on conventional imaging.
We considered a TTTC below the median as evidence of early progression. For detecting early progression, 18F-DCFPyL PET had a sensitivity of 88%, specificity of 88%, and overall accuracy of 88%, and conventional imaging had a sensitivity of 63%, specificity of 75%, and overall accuracy of 69%.
Discussion
PSMA-targeted PET is being increasingly used to evaluate PCa at the time of staging (3), to evaluate biochemical recurrence (4), and to guide therapy (5). However, to date, there are mixed data on the meaning of patterns of changing uptake with therapy on PSMA-targeted PET. The available data suggest there can be a complex interplay between androgen-targeted therapy, androgen receptor signaling, PSMA expression, and patient response to therapy in some imaging contexts (Table 3) (10,11).
TABLE 3.
Key Findings from Literature Regarding Presence or Absence of Flare Phenomenon on PSMA-Targeted PET on Initiation of Androgen-Axis Targeted Therapeutic Agents
| Study | Patients (n) | Therapy initiated | Key results |
|---|---|---|---|
| Hope (7) | 1 | ADT | Flare on 4-wk follow-up scan |
| Afshar-Oromieh (8) | 10 | ADT | Long-term ADT, decreased conspicuity of lesions |
| Aggarwal (10) | 8 | ADT in 4 patients, enzalutamide in 4 patients | Variably observed heterogeneous flare |
| Emmett (19) | 15 | ADT in 8 patients, enzalutamide or abiraterone in 7 patients | Mix of flare and true progression |
| Plouznikoff (11) | 26 | Enzalutamide or abiraterone | No evidence of flare |
ADT = androgen deprivation therapy.
Most of our subjects with castration-resistant PCa had a mixed PET response 2–4 mo after initiation of a second-generation antiandrogen agent, suggesting biologic heterogeneity between metastatic sites. We found that the imaging biomarkers associated with an unfavorable response to therapy on short-interval follow-up 18F-DCFPyL PET/CT included new sites of 18F-DCFPyL PET–positive metastatic disease and overall increasing lesion uptake. The derived metrics DPSM and DASM were both associated with TTTC and OS: men with a net increase in 18F-DCFPyL uptake across sites of disease on short-interval follow-up PET had a shorter TTTC and OS. Baseline 18F-DCFPyL–avid tumor burden alone was not associated with outcomes. We also found that the sensitivity, specificity, and overall accuracy of 18F-DCFPyL for detecting early progression (as defined by a short TTTC) were superior to those of conventional imaging.
The subset of 6 men with mixed but predominantly increasing 18F-DCFPyL uptake at sites of disease from PET1 to PET2 had the worst outcomes. These patients all had positive DPSM and DASM parameters; most had new lesions as well as increasing PSA at follow-up. Five of the next 6 patients with the shortest TTTC had increasing uptake at all sites of disease. Most of those men presented with concurrently increased PSA at follow-up, suggesting that although some sites of disease may be increasing in avidity because of flare, increasing overall uptake suggests disease progression. Granted, there do appear to be men who have increased uptake on PSMA-targeted PET after therapy initiation, in the context of an initial decrease in PSA, who may have a flare phenomenon (10). However, increased uptake or more conspicuous lesions on PSMA-targeted PET after the initiation of a second-generation antiandrogen must be interpreted with caution. Lastly, patients with a mixed or mixed-but-predominantly decreasing pattern of uptake had a relatively prolonged TTTC and OS.
Interval changes in PSMA-targeted PET avidity and metastatic pattern in patients starting second-generation antiandrogen agents are likely multifactorial. The changes may be due to modulation of PSMA expression by androgen receptor signaling (6), tumor cell death as a result of response to therapy (8), loss of PSMA expression as cells differentiate toward a neuroendocrine phenotype (16), loss of PSMA expression in advanced adenocarcinoma (17), or alternative splicing variants and other aberrations that limit the interaction of androgen signaling with PSMA (18). Because of this inherent complexity, correlation with pathology and tissue sampling may be helpful in future studies.
The primary limitation of this study was the relatively small sample size. Additional larger, prospective studies with long-term follow-up are needed to more definitively address the causes of the uptake patterns observed with PSMA-targeted PET. Further, the endpoint of TTTC does not necessarily reflect progression, although it should be a reliable surrogate for clinical progression barring an intolerable toxicity. The use of both DPSM and DASM could be viewed as overly complex, however both of these metrics can be derived with relative ease with modern software and we were unable to statistically demonstrate that one was superior to the other. Lastly, given the exposure limitations allowed by the Food and Drug Administration for investigational radiotracers, only 2 time points could be obtained in this study. Additional PET scans at later time points would be helpful to understand the prognostic implications of changes in PSMA-targeted radiotracer uptake with time.
Conclusion
Short-interval follow-up PET (2–4 mo) after initiation of treatment with a second-generation antiandrogen improves detection of progression. Men with increased uptake or new lesions on early interval PET may be experiencing progression rather than flare and may require alternative therapy.
DISCLOSURE
Funding for this study was received from the Movember Foundation, the Prostate Cancer Foundation Young Investigator Award, and National Institutes of Health grants CA134675, CA184228, EB024495, and CA183031. Martin Pomper is a coinventor on a U.S. patent covering 18F-DCFPyL and as such is entitled to a portion of any licensing fees and royalties generated by this technology. This arrangement has been reviewed and approved by the Johns Hopkins University in accordance with its conflict-of-interest policies. Steven Rowe and Steve Cho are consultants for Progenics Pharmaceuticals, Inc., the licensee of 18F-DCFPyL. Michael Gorin has served as a consultant for Progenics Pharmaceuticals, Inc. Martin Pomper, Michael Gorin, and Steven Rowe have received research funding from Progenics Pharmaceuticals, Inc. No other potential conflict of interest relevant to this article was reported.
KEY POINTS
QUESTION: Can PSMA-targeted PET detect early progression and provide prognostic information about men starting abiraterone or enzalutamide?
PERTINENT FINDINGS: PSMA-targeted PET improves detection of progression relative to conventional imaging. New lesions or increasing apparent tumor burden on PSMA-targeted PET are poor prognostic findings.
IMPLICATIONS FOR PATIENT CARE: Men starting treatment with abiraterone or enzalutamide who have an increasing number of lesions or increased uptake in existing lesions on PSMA-targeted PET may need alternative therapy.
REFERENCES
- 1. Rowe SP, Gorin MA, Allaf ME, et al. PET imaging of prostate-specific membrane antigen in prostate cancer: current state of the art and future challenges. 2016;19:223–230. [DOI] [PMC free article] [PubMed] [Google Scholar]
- 2. Bostwick DG, Pacelli A, Blute M, et al. Prostate specific membrane antigen expression in prostatic intra-epithelial neoplasia and adenocarcinoma: a study of 184 cases. Cancer. 1998;82:2256–2261. [DOI] [PubMed] [Google Scholar]
- 3. Gorin MA, Rowe SP, Patel HD, et al. Prostate specific membrane antigen targeted 18F-DCFPyL positron emission tomography/computerized tomography for the preoperative staging of high risk prostate cancer: results of a prospective, phase II, single center study. J Urol. 2018;199:126–132. [DOI] [PMC free article] [PubMed] [Google Scholar]
- 4. Markowski MC, Sedhom R, Fu W, et al. PSA and PSA doubling time predict findings on 18F-DCFPyL PET/CT in patients with biochemically-recurrent prostate cancer. J Urol. 2020;204:496–502. [DOI] [PMC free article] [PubMed] [Google Scholar]
- 5. Hofman MS, Violet J, Hicks RJ, et al. [177Lu]-PSMA-617 radionuclide treatment in patients with metastatic castration-resistant prostate cancer (LuPSMA trial): a single-centre, single-arm, phase 2 study. Lancet Oncol. 2018;19:825–833. [DOI] [PubMed] [Google Scholar]
- 6. Evans MJ, Smith-Jones PM, Wongvipat J, et al. Noninvasive measurement of androgen receptor signaling with a positron-emitting radiopharmaceutical that targets prostate-specific membrane antigen. Proc Natl Acad Sci USA. 2011;108:9578–9582. [DOI] [PMC free article] [PubMed] [Google Scholar]
- 7. Hope TA, Truillet C, Ehman EC, et al. 68Ga-PSMA-11 PET imaging of response to androgen receptor inhibition: first human experience. J Nucl Med. 2017; 58:81–84. [DOI] [PMC free article] [PubMed] [Google Scholar]
- 8. Afshar-Oromieh A, Debus N, Uhrig M, et al. Impact of long-term androgen deprivation therapy on PSMA ligand PET/CT in patients with castration-sensitive prostate cancer. Eur J Nucl Med Mol Imaging. 2018;45:2045–2054. [DOI] [PMC free article] [PubMed] [Google Scholar]
- 9. Zukotynski KA, Valliant J, Bénard F, et al. Flare on serial prostate-specific membrane antigen-targeted 18F-DCFPyL PET/CT examinations in castration-resistant prostate cancer: first observations. Clin Nucl Med. 2018;43:213–216. [DOI] [PMC free article] [PubMed] [Google Scholar]
- 10. Aggarwal R, Wei X, Kim W, et al. Heterogeneous flare in prostate-specific membrane antigen positron emission tomography tracer uptake with initiation of androgen pathway blockade in metastatic prostate cancer. Eur Urol Oncol. 2018;1:78–82. [DOI] [PubMed] [Google Scholar]
- 11. Plouznikoff N, Artigas C, Sideris S, et al. Evaluation of PSMA expression changes on PET/CT before and after initiation of novel antiandrogen drugs (enzalutamide or abiraterone) in metastatic castration-resistant prostate cancer patients. Ann Nucl Med. 2019;33:945–954. [DOI] [PubMed] [Google Scholar]
- 12. Fanti S, Hadaschik B, Herrmann K. Proposal for systemic-therapy response-assessment criteria at the time of PSMA PET/CT imaging: the PSMA PET progression criteria. J Nucl Med. 2020;61:678–682. [DOI] [PMC free article] [PubMed] [Google Scholar]
- 13. Szabo Z, Mena E, Rowe SP, et al. Initial evaluation of [18F]DCFPyL for prostate-specific membrane antigen (PSMA)-targeted PET imaging of prostate cancer. Mol Imaging Biol. 2015;17:565–574. [DOI] [PMC free article] [PubMed] [Google Scholar]
- 14. Ravert HT, Holt DP, Chen Y, et al. An improved synthesis of the radiolabeled prostate-specific membrane antigen inhibitor [18F]DCFPyL. J Labelled Comp Radiopharm. 2016;59:439–450. [DOI] [PMC free article] [PubMed] [Google Scholar]
- 15. The R project for statistical computing. R Project website. https://www.R-project.org/. Accessed May 25, 2021.
- 16. Tosoian JJ, Gorin MA, Rowe SP, et al. Correlation of PSMA-targeted 18F-DCFPyL PET/CT findings with immunohistochemical and genomic data in a patient with metastatic neuroendocrine prostate cancer. Clin Genitourin Cancer. 2017;15:e65–e68. [DOI] [PMC free article] [PubMed] [Google Scholar]
- 17. Sheikhbahaei S, Werner RA, Solnes LB, et al. Prostate-specific membrane antigen (PSMA)-targeted PET imaging of prostate cancer: an update on important pitfalls. Semin Nucl Med. 2019;49:255–270. [DOI] [PubMed] [Google Scholar]
- 18. Antonarakis ES, Lu C, Wang H, et al. AR-V7 and resistance to enzalutamide and abiraterone in prostate cancer. N Engl J Med. 2014;371:1028–1038. [DOI] [PMC free article] [PubMed] [Google Scholar]
- 19. Emmett L, Yin C, Crumbaker M, et al. Rapid modulation of PSMA expression by androgen deprivation: serial 68Ga-PSMA-11 PET in men with hormone-sensitive and castrate-resistant prostate cancer commencing androgen blockade. J Nucl Med. 2019;60:950–954. [DOI] [PubMed] [Google Scholar]


