Abstract
Background
Cardiovascular diseases remain the leading cause of morbidity and mortality worldwide, most of which are caused by atherosclerosis. Discerning processes that participate in macrophage-to-foam cell formation are critical for understanding the basic mechanisms underlying atherosclerosis. To explore the molecular mechanisms of foam cell formation, differentially expressed proteins were identified.
Methods
Human peripheral blood mononuclear cells were stimulated with macrophage colony-stimulating factor, and obtained macrophages were transformed into foam cells by oxidized low-density lipoprotein. Tandem mass tag (TMT) labeling combined with mass spectrometry was performed to find associations between foam cell transformation and proteome profiles.
Results
Totally, 5146 quantifiable proteins were identified, among which 1515 and 182 differentially expressed proteins (DEPs) were found in macrophage/monocyte and foam cell/macrophage, respectively. Subcellular localization analysis revealed that downregulated DEPs of macrophages/monocytes were mostly located in the nucleus, whereas upregulated DEPs of foam cells/macrophages were mostly extracellular or located in the plasma membrane. Functional analysis of DEPs demonstrated that cholesterol metabolism-related proteins were upregulated in foam cells, whereas immune response-related proteins were downregulated in foam cells. The protein interaction network showed that the DEPs with the highest interaction scores between macrophages and foam cells were mainly concentrated in lysosomes and the endoplasmic reticulum.
Conclusions
Proteomics analysis suggested that cholesterol metabolism was upregulated, while the immune response was suppressed in foam cells. KEGG enrichment analysis and protein-protein interaction analysis indicated that DEPs located in the endoplasmic reticulum and lysosomes might be key drivers of foam cell formation. These data provide a basis for identifying the potential proteins associated with the molecular mechanism underlying macrophage transformation to foam cells.
Supplementary Information
The online version contains supplementary material available at 10.1186/s12953-021-00183-x.
Keywords: Atherosclerosis, Macrophage, Foam cell, Proteome
Background
Despite extensive efforts to study its pathogenesis and develop effective drugs, atherosclerosis remains the leading cause of mortality and disability worldwide. Atherosclerosis is responsible for coronary artery disease, stroke, and peripheral vascular diseases in the human population [1]. As a progressive disease, atherosclerosis is characterized by the accumulation of lipids and fibrous elements in the arterial intima [2]. Foam cells are key components of atherosclerotic plaque and play an important role in all atherosclerotic lesions, from the earliest fatty streak formations to the most advanced atheromas. In the early stages of atherosclerosis, foam cell accumulation in the arterial wall forms fatty streaks, the first sign of atherosclerosis, which is visible without magnification [3]. In the last phase of atherosclerosis, foam cells can become necrotic and are encapsulated by a thin fibrous cap that can rupture, resulting in thrombosis and vessel occlusion [4].
Macrophages serve as an important source of foam cell formation [5]. Atherosclerosis is initiated by the recruitment of circulating monocytes into the injured vessel intima. Under the stimulation of chemokines and adhesion factors, including P-selectin, VCAM-1(vascular cell adhesion molecule-1), ICAM-1(intercellular cell adhesion molecule-1), MCP-1 (monocyte chemoattractant protein 1), and M-CSF (monocyte colony-stimulating factor) [6], circulating monocytes move into the sub-endothelium of vessel walls and differentiate into macrophages, which subsequently transform into foam cells after engulfing oxidized low-density lipoproteins (ox-LDL) or other modified lipoproteins [7]. Given these important findings, macrophage-derived foam cell formation has emerged as an attractive target for therapeutic intervention and imaging of disease progression. Of note, an inducing factor is necessary for the differentiation of circulating monocytes into macrophages. M-CSF, an important factor in the development, chemotaxis, proliferation, differentiation, and activation of monocytes and macrophages is the most commonly used growth factor for in vitro studies [8, 9]. In vivo, low-density lipoproteins (LDL) are oxidized in atherosclerotic lesions in both humans and transgenic apolipoprotein Ε-deficient mice, whereas plasma LDL is normally not oxidized; the in vitro incubation of macrophages with ox-LDL and not with native LDL led to cholesterol ester accumulation [10–12]. ox-LDL was shown to enhance the uptake of modified lipoproteins via the macrophage scavenger receptor [13]. Therefore, macrophages incubated with ox-LDL to induce foam cells are a common method for studying atherosclerosis in vitro.
In general, the process of macrophage endocytosis of ox-LDL to form foam cells involves cholesterol uptake, esterification, and cholesterol efflux [14]. Macrophages serve as scavenger cells containing scavenger receptors, including CD36 and SR-A, which can recognize and bind to modified lipoproteins for cellular degradation and storage. After ox-LDL endocytosis by macrophages, the cholesterol ester (CE) carried by these particles is hydrolyzed to free cholesterol (FC) in the lysosomes, which is subsequently released into the cytosol. To prevent FC-associated cell toxicity [15], FC in the cytosol is either excluded by ATP-binding cassette transporters, including ABCA1 and ABCG1, or re-esterified by ACAT1 in the endoplasmic reticulum and stored as CE in cytoplasmic lipid droplets (LDs). CE in LDs is hydrolyzed to FC by neutral cholesterol ester hydrolases (nCEHs) or autophagy [16]. Excessive CE accumulates in macrophages, resulting in the formation of foam cells.
Although many proteins have been confirmed to affect the formation of macrophage-derived foam cells, limited information on the overall profiles of differentially expressed proteins (DEPs) expressed during the monocyte-to-macrophage and macrophage-to-foam cell transitions is currently available. Tandem mass tag (TMT)-based proteomics technology enabled more comprehensive and accurate data acquisition, contributing toward elucidating the pathological mechanisms associated with various biological processes. DEPs expressed in response to stimulation may be key molecules affecting pathological processes. Here, we explored the biological processes and potential targets influencing foam cell formation, the main components of atherosclerotic lesions, using in vitro TMT proteomics-based protein profile identification and quantification of human peripheral blood mononuclear cells (PBMCs).
Methods
PBMC isolation
Blood samples from healthy male volunteers (age range, 18–21 years) were collected into an EDTA anticoagulant tube. For precision and mass accuracy analyses, blood samples were pooled from 20 individual samples. First, the blood samples were diluted with PBS (1/1 v/v), carefully loaded onto a Ficoll gradient, and centrifuged at 400×g for 30 min at room temperature. PBMCs were collected at the interface and washed three times with PBS (at 400×g for 10 min). Next, monocytes were purified by positive selection using specific monoclonal antibodies, anti-human CD14 magnetic particles (Catalog No. 557769; BD Biosciences, CA, USA) coupled to magnetic beads. Finally, positive cells were resuspended in RPMI-1640 medium (Hyclone, UT, USA) containing penicillin and streptomycin. The study was approved by the Ethics Committee of the Xi’an Jiaotong University Health Science Center (No. 2018–485).
Cell culture
Monocytes isolated from blood were seeded in cell culture plates at a density of 1 × 10⁶ /mL and grown in RPMI 1640 medium containing 10% fetal serum (v/v), penicillin (100 units/mL), and streptomycin (100 μg/mL) and kept at 37 °C in an atmosphere of 5% CO2. To induce macrophages, monocytes were cultured for 7 d in the presence of 100 ng/mL recombinant human macrophage colony-stimulating factor (M-CSF) (Catalog No. 300–25, PeproTech, France). The purity of monocytes and macrophages was evaluated by flow cytometry. For foam cell formation, macrophages were incubated with 50 μg/mL ox-LDL (Yiyuan Bio-technologies, Guangzhou, China) in culture medium for 48 h, and oil red O staining was used to identify whether foam cells were successfully induced.
Flow cytometry
To detect the efficiency of monocyte transformation into macrophages, monocytes and macrophages were incubated with specific antibodies against CD11b (Catalog No. 561688, BD Biosciences), and positive cells were detected using flow cytometry. In brief, cells were harvested, washed, and the cell suspension was adjusted to a concentration of 1 × 10⁶ cells/mL in ice-cold PBS, 10% fetal calf serum, and 1% sodium azide. We added 1 μg/mL of PE-conjugated CD11b to the cell suspension, which was then incubated for 30 min in the dark at room temperature. The cells were washed three times, centrifuged at 400×g for 5 min, and resuspended in ice-cold PBS, 10% fetal calf serum, and 1% sodium azide. Cells were stored in the dark at 4 °C until analysis.
Oil red O staining
As foam cells uptake lipids during their formation, oil red O staining was used to identify foam cells. After the culture medium was discarded, cells were washed twice with PBS and fixed with formalin for 10 min. The solution was rinsed with PBS for 1 min and then with 60% isopropanol for 15 s. Cells were then exposed to oil red O for 1 min in the dark at 37 °C, rinsed with 60% isopropanol for 15 s, and then washed three times with PBS for 3 min each. Finally, after being sealed, cells were observed under a Nikon light microscope.
Protein extraction and digestion
Cell samples were sonicated three times on ice using a high-intensity ultrasonic processor (Scientz) in lysis buffer (8 M urea, 1% Protease Inhibitor Cocktail). The remaining debris was removed by centrifugation at 12,000×g at 4 °C for 10 min. Finally, the supernatant was collected, and the protein concentration was determined using a BCA kit according to the manufacturer’s instructions. For digestion, the protein solution was reduced with 5 mM dithiothreitol for 30 min at 56 °C and alkylated with 11 mM iodoacetamide for 15 min at room temperature in the dark. The protein sample was then diluted by adding 100 mM TEAB to a urea concentration of less than 2 M. Finally, trypsin was added at a 1:50 trypsin-to-protein mass ratio for the first digestion overnight and 1:100 trypsin-to-protein mass ratio for a second 4 h digestion.
TMT labeling and HPLC fractionation
After trypsin digestion, the peptides were desalted using a Strata X C18 SPE column (Phenomenex, CA, USA) and vacuum-dried. The peptide was reconstituted in 0.5 M TEAB and processed according to the manufacturer’s protocol for the TMT kit. The tryptic peptides were fractionated into 18 fractions by high pH reverse-phase HPLC using Agilent 300 Extend C18 column (5 μm particles, 4.6 mm ID, 250 mm length). Briefly, peptides were separated into 80 fractions with a 2 to 60% acetonitrile gradient in 10 mM ammonium bicarbonate at pH 10, over 80 min. Then, peptides were combined into 18 fractions and dried by vacuum centrifuging. Three replicates per condition were performed. Nine TMT labels (126, 127 N,127C,128 N, 128C, 129 N, 130C, 131) were used per run and 18 TMT runs were performed.
LC-MS/MS analysis
The tryptic peptides were dissolved in solvent A (an aqueous solution containing 0.1% formic acid and 2% acetonitrile) and directly loaded onto chromatographic column ReproSil-Pur Basic C18 (1.9 μm particles, 100 μm ID, 25 cm length). The gradient ranged from 9 to 26% solvent B (an aqueous solution containing 0.1% formic acid and 90% acetonitrile) over 40 min, 26 to 35% in 14 min, and was increased to 80% in 3 min, then hold at 80% for the last 3 min, all at a constant flow rate of 350 nL/min on an EASY-nLC 1000 UPLC system.
The peptides were subjected to NSI source (the standard source accompanying the Q Exactive TM Plus) followed by tandem mass spectrometry (MS/MS) in Q Exactive™ Plus (Thermo) coupled online to the UPLC. The electrospray voltage applied was 2.1 kV. The m/z scan range was 350 to 1800 for a full scan, and intact peptides were detected in the Orbitrap at a resolution of 70,000. Peptides were then selected for MS/MS using the NCE setting as 28, and the fragments were detected in the Orbitrap at a resolution of 35,000. The data-dependent procedure that we performed alternated between one MS scan followed by 20 MS/MS scans with a 15.0 s dynamic exclusion. Automatic gain control (AGC) was set at 5E4. The fixed first mass was set to 100 m/z.
Database search
The resulting MS/MS data were processed using the MaxQuant search engine (v.1.5.2.8). Tandem mass spectra were searched against the human SwissProt database (downloaded on 16 August 2018) concatenated with a reverse decoy database. Trypsin/P was used as a cleavage enzyme, allowing up to two missing cleavages. The mass tolerance for precursor ions was set as 20 ppm in the first search and 5 ppm in the main search, and the mass tolerance for fragment ions was set as 0.02 Da. Cys carbamidomethyl was specified as a fixed modification, and Met acetylation and oxidation were specified as variable modifications. FDR was adjusted to < 1%, and the minimum score for modified peptides was set at > 40.
Bioinformatics analysis
The proteomic results were analyzed using multiple approaches. The Gene Ontology (GO) annotation proteome was derived from the UniProt-GOA database (http://www.ebi.ac.uk/GOA/). Wolfpsort, a subcellular localization prediction, was used to predict subcellular localization. The Kyoto encyclopedia of genes and genomes (KEGG) database was used to annotate protein pathways. First, the KEGG online service tool, KAAS, was used to annotate the protein’s KEGG database description. The annotation results were mapped to the KEGG pathway database using the KEGG online service tool, KEGG mapper. GO annotation and KEGG database were used to identify DEP enrichment by a two-tailed Fisher’s exact test to test the enrichment of the DEPs against all identified proteins. Protein-protein interaction (PPI) network analysis was conducted using STRING version 11.0 (https://string-db.org/). The STRING-generated network was visualized and edited using Cytoscape version 3.8.2.
Results
Sample preparation
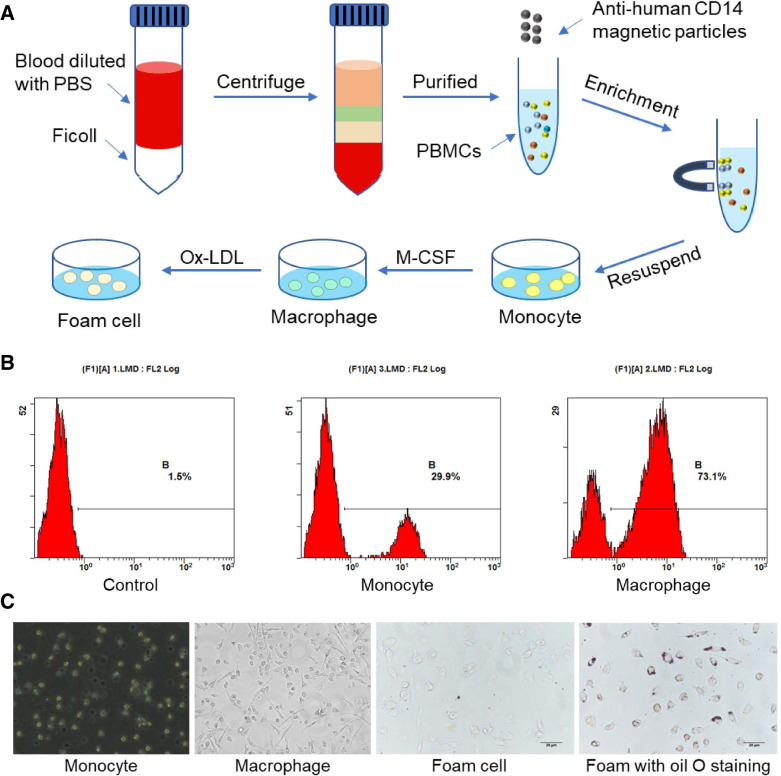
We isolated PBMCs from whole blood and cultured them in vitro to obtain monocytes, macrophages, and foam cells induced by M-CSF and ox-LDL; the sampling procedure is shown in Fig. 1A. Before testing by mass spectrometry, monocytes were purified with CD14 microbeads as CD14 is a monocyte surface marker, and macrophages were identified by flow cytometry using CD11b antibodies. The results showed that the CD11b + population increased from 29.9 to 73.1% after M-CSF induction (Fig. 1B). Moreover, macrophages in samples were adherent cells. Macrophages phagocytose lipids to form foam cells. The results showed that ox-LDL-induced cells, stained with oil red O, presented red lipid droplets (Fig. 1C).
Fig. 1.
Collection and identification of cell samples. A Procedure for collecting human peripheral blood mononuclear cells (PBMCs), monocytes, macrophages, and foam cells. B Macrophages were identified with CD11b antibodies using flow cytometry. C Representative images of cell morphology of monocytes, macrophages, foam cells, and oil red O stained-foam cells
Overview of protein identification on TMT technology
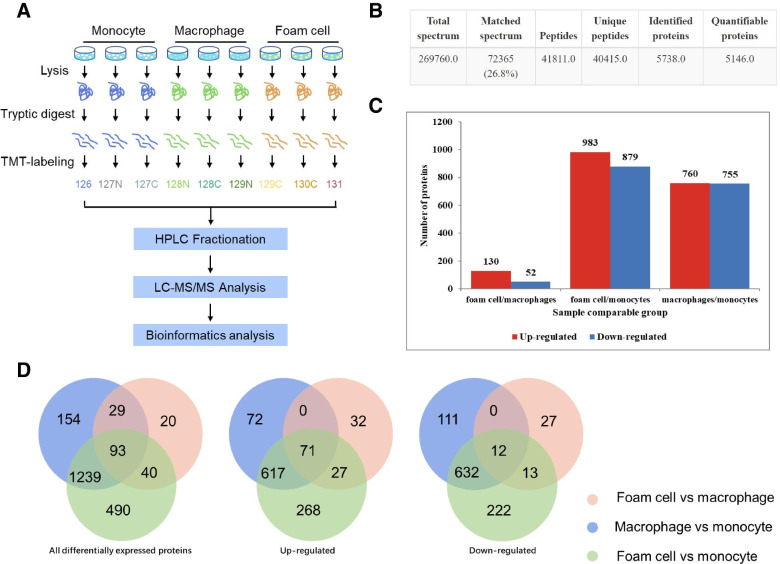
Total proteins obtained from monocytes, macrophages, and foam cells were separately analyzed for LC-MS/MS identification with three replicates (Fig. 2A). Quality control was performed to check the MS data. Results indicated that the MS data satisfied the subsequent advanced analysis (see Additional file 1). We uploaded raw data to ProteomeXchange via the PRIDE database (Project accession: PXD028363). Altogether, 5738 proteins were identified; of these, 5146 proteins were quantified (Fig. 2B, Additional file 2). Compared with foam cells/macrophages, the foam cells/monocytes and macrophages/monocytes had more DEPs at the same differential multiple (Additional file 3). To control the number of proteins analyzed by bioinformatics within the appropriate range, we defined DEPs as proteins expressed when foam cells/monocytes, macrophages/monocytes, or foam cells/macrophages had a fold change > 1.5 or < 0.67 and p < 0.05 (p-value was calculated by the two-sample two-tailed T-test method). According to this definition, there were 1515 (760 upregulated and 755 downregulated), 182 (130 upregulated and 52 downregulated), and 1862 (983 upregulated and 879 downregulated) DEPs in macrophages/monocytes, foam cells/macrophages, and foam cells/monocytes, respectively (Fig. 2C). Figure 2D shows the number of DEPs shared by the three groups.
Fig. 2.
Overview of differentially expressed proteins (DEPs). A Schematic illustration of the proteomic analytical steps. B Summary of qualitative data identified in monocytes, macrophages, and foam cells. C Number of DEPs in foam cell/macrophage, foam cell/monocyte, and macrophage/monocyte. D Venn diagram showing the overlap in foam cell/macrophage, foam cell/monocyte, and macrophage/monocyte
Subcellular localization of DEPs
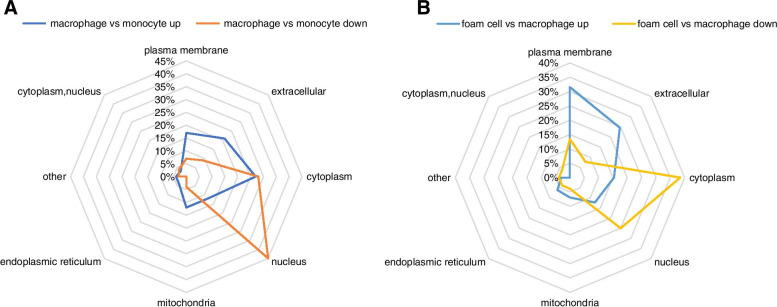
Subcellular localization is the main determinant of protein function. Here, we used Wolfpsort, a subcellular localization prediction software, to predict the subcellular localization of DEPs. Subcellular localization showed that upregulated DEPs in macrophages/monocytes were mainly found in the cytoplasm, followed by the extracellular and plasma membrane. In contrast, downregulated DEPs were mainly found in the nucleus (Fig. 3A). Upregulated DEPs in foam cells/macrophages were primarily found in the cell membrane and extracellular matrix and downregulated DEPs primarily occupied the cytoplasm and nucleus (Fig. 3B).
Fig. 3.
Subcellular location of differentially expressed proteins (DEPs). A Subcellular location of DEPs in monocytes and macrophages. B Subcellular location of DEPs in foam cells and macrophages
Functional enrichment analysis of DEPs
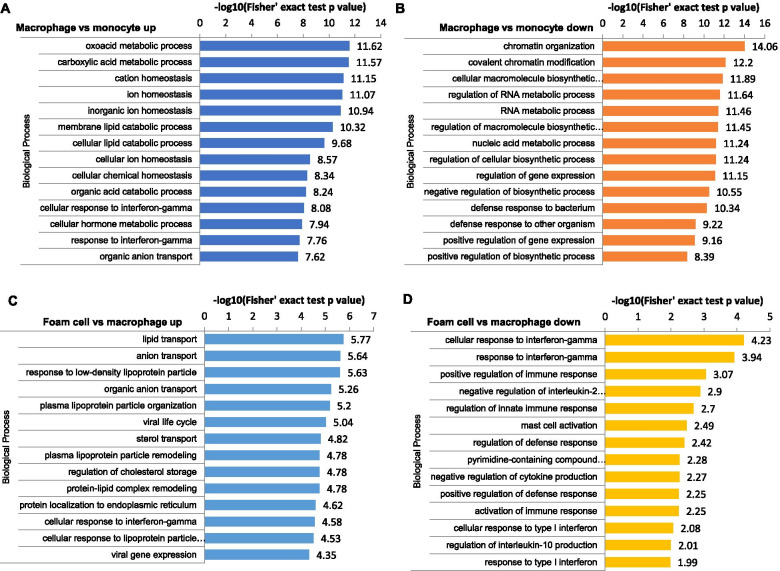
To better investigate the biological function of DEPs, we performed a comparative analysis based on GO enrichment and the KEGG pathway enrichment. A Fisher’s exact test p-value was obtained to evaluate the enrichment analysis with the quantified proteins as references. As shown in Fig. 4, during the monocyte-to-macrophage transformation, upregulated DEPs were enriched in the biological processes related to immune responses, and downregulated DEPs were enriched in the biological processes related to chromatin. For DEPs of foam cells/macrophages, results indicated that upregulated proteins were enriched in the biological process of lipid transport and response to LDL particles. In contrast, downregulated proteins were involved with cellular response to interferon-gamma and positive regulation of immune response.
Fig. 4.
Gene Ontology (GO)-based functional enrichment analysis of differentially expressed proteins (DEPs). GO-based functional enrichment analysis of DEPs in the macrophage/monocyte (A, B); GO-based functional enrichment analysis of DEPs in the foam cell/macrophage (C, D)
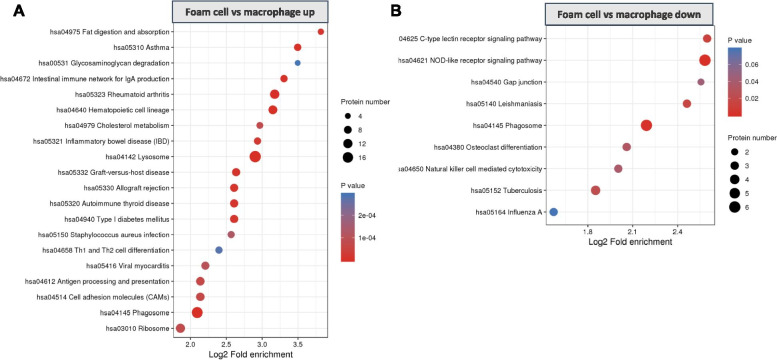
The KEGG pathway enrichment analysis indicated that upregulated DEPs of macrophages/monocytes were significantly enriched in antigen processing and presentation, lysosome, and phagocytosis pathways; the downregulated proteins were enriched in DNA replication (Additional file 4). For foam cells/macrophages, the KEGG pathway enrichment analysis showed that proteins involved in cholesterol metabolism and lysosome were upregulated in foam cells/macrophages. In contrast, proteins in the NOD-like receptor signaling pathway and the C-type lectin receptor signaling pathway were significantly downregulated (Fig. 5).
Fig. 5.
KEGG pathway enrichment analysis of differentially expressed proteins in foam cell/macrophage
Interaction network of DEPs
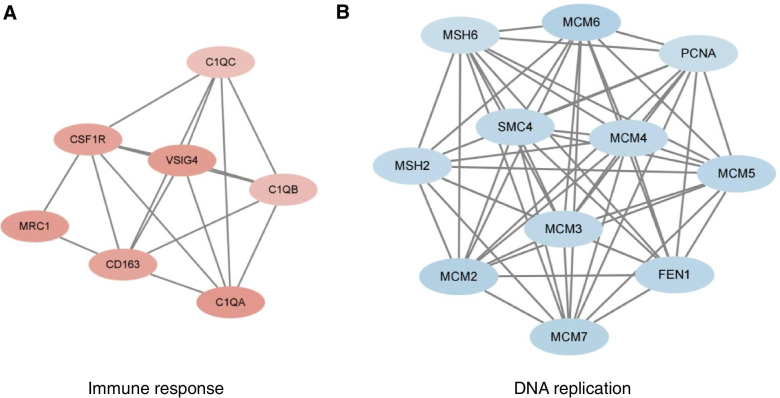
To better comprehend the interactions between the DEPs, STRING analysis combined with Cytoscape software was used to visualize the PPI networks. Notably, PPI analysis of DEPs in macrophages/monocytes was performed on the proteins with fold change > 2, because the number of proteins with fold change > 1.5 was too large. The PPI analysis indicated extensive interactions among DEPs of macrophages/monocytes. Molecular Complex Detection (MCODE), a graph-theoretic clustering algorithm, captured the modules with strong interacting proteins. As shown in Fig. 6A, interactions among upregulated proteins from the macrophages/monocytes were mostly immune response-related, whereas downregulated proteins were related to DNA replication. Furthermore, we performed a PPI network analysis on selected GO terms, including receptor-mediated endocytosis, immune effector process, and ion transport. The identified nodes with high interaction scores that might be potential targets for future research are listed in Additional file 5.
Fig. 6.
Top two modules from the protein-protein interaction network according to the Molecular Complex Detection (MCODE) score in macrophage/monocyte. A, the upregulated proteins in macrophages; B, the downregulated proteins in macrophages
DEPs located in the lysosome and endoplasmic reticulum
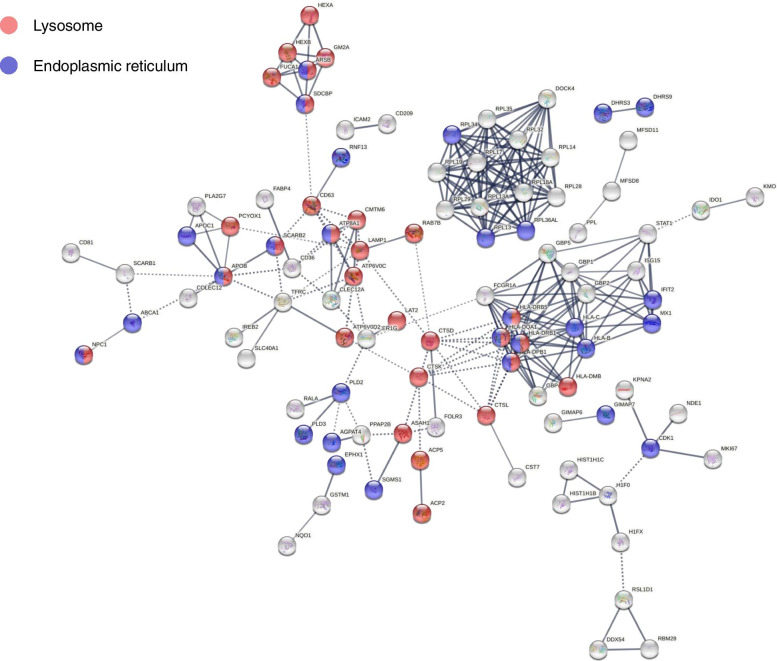
According to GO analysis, in addition to lysosomes, the proteins located in the endoplasmic reticulum were also widely enriched in the top 50 proteins with the strongest interaction in the foam cell/macrophage group (Additional file 6). Next, we mapped the distribution of all foam cell/macrophage DEPs in the lysosomes and endoplasmic reticulum in the interaction network (Fig. 7). In total, of the 182 DEPs, 38 were located in the lysosome (see Table 1), and 40 were located in the endoplasmic reticulum (see Table 2).
Fig. 7.
Interaction network of foam cells/macrophages differentially expressed proteins located in lysosomes and endoplasmic reticulum
Table 1.
List of differentially expressed proteins (foam cell/macrophage) located in the lysosome
| Protein accession | Protein description | Gene name | Fold change |
|---|---|---|---|
| P13761 | HLA class II histocompatibility antigen, DRB1-7 beta chain | HLA-DRB1 | 11.602 |
| P04114 | Apolipoprotein B-100 | APOB | 7.521 |
| Q8N8Y2 | V-type proton ATPase subunit d 2 | ATP6V0D2 | 2.817 |
| P13686 | Tartrate-resistant acid phosphatase type 5 | ACP5 | 2.518 |
| P04066 | Tissue alpha-L-fucosidase | FUCA1 | 2.247 |
| Q95IE3 | HLA class II histocompatibility antigen, DRB1-12 beta chain | HLA-DRB1 | 2.234 |
| P20039 | HLA class II histocompatibility antigen, DRB1-11 beta chain | HLA-DRB1 | 2.107 |
| Q86WA9 | Sodium-independent sulfate anion transporter | SLC26A11 | 2.067 |
| P11279 | Lysosome-associated membrane glycoprotein 1 | LAMP1 | 2.002 |
| Q9NX76 | CKLF-like MARVEL transmembrane domain-containing protein 6 | CMTM6 | 1.985 |
| P43235 | Cathepsin K | CTSK | 1.884 |
| P01909 | HLA class II histocompatibility antigen, DQ alpha 1 chain | HLA-DQA1 | 1.882 |
| P27449 | V-type proton ATPase 16 kDa proteolipid subunit | ATP6V0C | 1.87 |
| Q14108 | Lysosome membrane protein 2 | SCARB2 | 1.844 |
| O15118 | NPC intracellular cholesterol transporter 1 | NPC1 | 1.786 |
| P08962 | CD63 antigen | CD63 | 1.76 |
| Q8N357 | Solute carrier family 35 member F6 | SLC35F6 | 1.748 |
| P11117 | Lysosomal acid phosphatase | ACP2 | 1.705 |
| P07339 | Cathepsin D | CTSD | 1.681 |
| Q96AH8 | Ras-related protein Rab-7b | RAB7B | 1.677 |
| P07686 | Beta-hexosaminidase subunit beta | HEXB | 1.674 |
| P28068 | HLA class II histocompatibility antigen, DM beta chain | HLA-DMB | 1.67 |
| P17900 | Ganglioside GM2 activator | GM2A | 1.619 |
| Q96NW4 | Ankyrin repeat domain-containing protein 27 | ANKRD27 | 1.619 |
| P15848 | Arylsulfatase B | ARSB | 1.597 |
| Q30154 | HLA class II histocompatibility antigen, DR beta 5 chain | HLA-DRB5 | 1.582 |
| P07711 | Cathepsin L1 | CTSL | 1.574 |
| Q8IY95 | Transmembrane protein 192 | TMEM192 | 1.566 |
| O00115 | Deoxyribonuclease-2-alpha | DNASE2 | 1.564 |
| Q9Y2Q0 | Phospholipid-transporting ATPase IA | ATP8A1 | 1.553 |
| Q9UHG3 | Prenylcysteine oxidase 1 | PCYOX1 | 1.539 |
| Q13510 | Acid ceramidase | ASAH1 | 1.538 |
| P06865 | Beta-hexosaminidase subunit alpha | HEXA | 1.518 |
| P04440 | HLA class II histocompatibility antigen, DP beta 1 chain | HLA-DPB1 | 1.517 |
| O00560 | Syntenin-1 | SDCBP | 1.51 |
| P51688 | N-sulphoglucosamine sulphohydrolase | SGSH | 1.505 |
| Q9GZY6 | Linker for activation of T-cells family member 2 | LAT2 | 0.572 |
| A6NI72 | Putative neutrophil cytosol factor 1B | NCF1B | 0.53 |
Table 2.
List of DEPs (foam cell/macrophage) located in the endoplasmic reticulum
| Protein accession | Protein description | Gene name | Fold change |
|---|---|---|---|
| P13761 | HLA class II histocompatibility antigen, DRB1-7 beta chain | HLA-DRB1 | 11.602 |
| P04114 | Apolipoprotein B-100 | APOB | 7.521 |
| P05090 | Apolipoprotein D | APOD | 5.59 |
| Q99541 | Perilipin-2 | PLIN2 | 4.709 |
| P02654 | Apolipoprotein C-I | APOC1 | 2.729 |
| O95477 | ATP-binding cassette sub-family A member 1 | ABCA1 | 2.568 |
| Q95IE3 | HLA class II histocompatibility antigen, DRB1-12 beta chain | HLA-DRB1 | 2.234 |
| P20039 | HLA class II histocompatibility antigen, DRB1-11 beta chain | HLA-DRB1 | 2.107 |
| Q86WA9 | Sodium-independent sulfate anion transporter | SLC26A11 | 2.067 |
| Q9BPW9 | Dehydrogenase/reductase SDR family member 9 | DHRS9 | 2.032 |
| Q9H2F3 | 3 beta-hydroxysteroid dehydrogenase type 7 | HSD3B7 | 1.992 |
| O75911 | Short-chain dehydrogenase/reductase 3 | DHRS3 | 1.966 |
| P30499 | HLA class I histocompatibility antigen, Cw-1 alpha chain | HLA-C | 1.909 |
| P01909 | HLA class II histocompatibility antigen, DQ alpha 1 chain | HLA-DQA1 | 1.882 |
| Q14108 | Lysosome membrane protein 2 | SCARB2 | 1.844 |
| Q95365 | HLA class I histocompatibility antigen, B-38 alpha chain | HLA-B | 1.815 |
| O14939 | Phospholipase D2 | PLD2 | 1.79 |
| O15118 | NPC intracellular cholesterol transporter 1 | NPC1 | 1.786 |
| P20591 | Interferon-induced GTP-binding protein Mx1 | MX1 | 1.776 |
| Q9NRZ5 | 1-acyl-sn-glycerol-3-phosphate acyltransferase delta | AGPAT4 | 1.688 |
| O43567 | E3 ubiquitin-protein ligase RNF13 | RNF13 | 1.683 |
| P49207 | 60S ribosomal protein L34 | RPL34 | 1.653 |
| Q96NN9 | Apoptosis-inducing factor 3 | AIFM3 | 1.636 |
| P07099 | Epoxide hydrolase 1 | EPHX1 | 1.615 |
| Q969Q0 | 60S ribosomal protein L36a-like | RPL36AL | 1.604 |
| P15848 | Arylsulfatase B | ARSB | 1.597 |
| O00767 | Acyl-CoA desaturase | SCD | 1.594 |
| Q30154 | HLA class II histocompatibility antigen, DR beta 5 chain | HLA-DRB5 | 1.582 |
| P09913 | Interferon-induced protein with tetratricopeptide repeats 2 | IFIT2 | 1.575 |
| Q8IV08 | Phospholipase D3 | PLD3 | 1.564 |
| Q9Y2Q0 | Phospholipid-transporting ATPase IA | ATP8A1 | 1.553 |
| P04440 | HLA class II histocompatibility antigen, DP beta 1 chain | HLA-DPB1 | 1.517 |
| P26373 | 60S ribosomal protein L13 | RPL13 | 1.513 |
| O00560 | Syntenin-1 | SDCBP | 1.51 |
| Q16850 | Lanosterol 14-alpha demethylase | CYP51A1 | 0.594 |
| Q86VZ5 | Phosphatidylcholine:ceramide cholinephosphotransferase 1 | SGMS1 | 0.583 |
| P30504 | HLA class I histocompatibility antigen, Cw-4 alpha chain | HLA-C | 0.536 |
| A6NI72 | Putative neutrophil cytosol factor 1B | NCF1B | 0.53 |
| Q8NHV1 | GTPase IMAP family member 7 | GIMAP7 | 0.513 |
| P06493 | Cyclin-dependent kinase 1 | CDK1 | 0.366 |
Discussion
Monocytes and macrophages are key cells in the initiation and progression of atherosclerosis. When blood vessels are damaged, monocytes in the blood are recruited to the subcutaneous vessels under the action of cytokines to form macrophages, which phagocytose lipids and form foam cells; this is the basic process of the formation of atherosclerotic lesions [17]. In addition, macrophages can affect the progression of atherosclerosis through inflammation [18]. Several studies have demonstrated that protein expression changes in macrophages affect atherosclerosis, such as CD36 and FABP [19, 20]. Therefore, it is plausible to consider macrophages as targets to identify potential therapeutic targets to treat or prevent atherosclerosis. Several studies have used proteomics to identify DEPs in monocytes, macrophages, and foam cells; however, due to technical limitations, the number of identified proteins is extremely limited, insufficient to comprehensively display the changes in protein expression during the process of cell transformation that characterizes atherosclerosis [21–24]. In this study, we performed protein quantification based on TMT analysis of human PBMCs, monocyte-derived macrophages induced by M-CSF, and foam cells formed from macrophages exposed to oxidized low-density lipoprotein. Through the functional enrichment and network interaction analysis of DEPs, we provided extensive molecular profiling to analyze the molecular network and highlighted changes in the expression of proteins in the lysosome and endoplasmic reticulum after macrophage phagocytosis of ox-LDL.
In our study, downregulated DEPs of macrophages/monocytes were significantly enriched in the cell cycle (Additional file 4), suggesting that monocyte differentiation into macrophages significantly altered the proliferative ability of monocytes, favoring an inverse relationship between cellular proliferation and differentiation. This finding is consistent with the previous understanding that considers macrophages as terminally differentiated immune cells that develop from monocytes and are unable to re-enter the cell cycle [25]. Moreover, KEGG pathway enrichment showed that, in macrophages, phagocytosis, antigen processing, and presentation were enhanced compared to monocytes. It is well known that phagocytosis and adaptive immunity are critical features of macrophages. These results support the reliability of our high-throughput proteomic data.
Atherosclerosis is a chronic inflammatory disease of the vessel wall, primarily driven by an innate immune response through myeloid cells, such as monocytes and macrophages. It is clear that the adaptive immune system in atherosclerosis can be pro- or anti-inflammatory, and thus pro- or anti-atherogenic [26]. It is generally believed that cholesterol accumulation induces macrophages to undergo inflammatory responses. However, our results suggest that the immune response was weakened in lipid-loaded macrophages, as downregulated DEPs were enriched in the C-type lectin receptor and the NOD-like receptor signaling pathways (Fig. 5), involved in the innate immune response and inflammatory activation [27, 28]. These results are consistent with the point revealed from single-cell RNA sequencing analysis of CD45+ leukocytes from the murine atherosclerotic aorta, showing that lipid-loaded macrophages are not likely to drive lesion inflammation [29]. Transcriptomic analysis by Spann et al. also demonstrated that foam cell formation was associated with suppression, rather than activation, of inflammatory gene expression [30], and our results support this discovery at the protein level.
Foam cell formation involves the disruption of normal macrophage cholesterol metabolism, which is governed by a homeostatic mechanism that controls the uptake, intracellular metabolism, and efflux of cholesterol [31]. As anticipated, the proteins related to cholesterol metabolism, including CD36, MSR1, LIPA, NPC1, and ABCA1, were upregulated in foam cells compared to macrophages (Additional file 3).
As the sites of cholesterol hydrolysis and esterification, lysosomes and the endoplasmic reticulum are pivotal in regulating lipid metabolism. Our results showed that strong protein-protein interactions were enriched in lysosomes and the endoplasmic reticulum. Several DEPs (Additional file 3), such as LAMP1 [32], CTSK [33], PLD2 [34], PLIN2 [35], identified in lysosomes and endoplasmic reticulum have been shown to affect foam cell formation. Recently, the impact of macrophage autophagy on cholesterol efflux has drawn increasing attention. Cholesterol efflux from macrophages is the first and potentially most important step in reverse cholesterol transport, a process especially relevant to atherosclerosis and the regression of atherosclerotic plaques [14]. LDs are delivered to lysosomes via autophagy, where lysosomal acid lipase hydrolyzes LD/CE to generate FC, usually for ABCA1-dependent efflux; this process is specifically induced upon macrophage cholesterol loading [16]. These findings suggest that attention to the endoplasmic reticulum and lysosomal proteins may provide potential targets for reducing foam cell formation and, thus, ameliorating atherosclerosis.
Conclusions
To the best of our knowledge, our study provides the most comprehensive comparative proteomics data of monocytes, macrophages, and foam cells in early atherosclerosis. The results showed that cholesterol metabolism was upregulated in foam cells, while the immune response was downregulated in foam cells compared with macrophages. Moreover, functional enrichment analysis and protein network interaction analysis revealed the pivotal role of lysosomes and endoplasmic reticulum in macrophage cholesterol metabolism. Further research of DEPs during foam cell formation will help us gain deeper insights into the pathophysiology of atherosclerosis and develop novel therapeutic alternatives.
Supplementary Information
Additional file 1. The correlation and coefficient of variation for biological replicates. (A) Coefficient of variation. (B) Pearson correlation coefficient of three replications.
Additional file 2. List of MS data and proteins identified in monocyte, macrophage, and foam cell by TMT- based quantitative proteomics.
Additional file 3. List of differentially expressed proteins (fold change > 1.5, p < 0.05) in macrophage/monocyte, foam cell/ macrophage, and foam cell/monocyte.
Additional file 4. Kyoto encyclopedia of genes and genomes (KEGG) enrichment analysis of differentially expressed proteins in macrophage/ monocyte.
Additional file 5. High interaction nodes obtained by protein-protein interaction (PPI) analysis of Gene Ontology (GO)-based functional enrichment terms in the foam cell/macrophage group.
Additional file 6. The differentially expressed proteins located in the endoplasmic reticulum or lysosome with the top 50 strongest interactions.
Acknowledgments
Not applicable.
Abbreviations
- CE
Cholesterol ester
- DEPs
Differentially expressed proteins
- FC
Free cholesterol
- GO
Gene Ontology
- KEGG
Kyoto encyclopedia of genes and genomes
- LDL
Low-density lipoproteins
- LDs
Lipid droplets
- M-CSF
Monocyte colony-stimulating factor
- MS
Mass spectrometry
- ox-LDL
Oxidized low-density lipoproteins
- PBMCs
Peripheral blood mononuclear cells
- PPI
Protein-protein interaction
- TMT
Tandem mass tag
Authors’ contributions
EQL, SHZ and LB designed the experiments, YLZ and RW wrote and.
improved the manuscript, YLZ, LYJ, LYJ, CYZ, WBC executed the experiments, WRW and NA helped in polishing the language. All authors read and approved the final manuscript.
Funding
This research was funded by the Science Plan Project of Shaanxi Province, grant number 2020PT-001, and the Natural Science Foundation of Shaanxi Province, grant number 2019JQ-599.
Availability of data and materials
All data generated or analyzed during this study are included in this published article and its supplementary information files.
Declarations
Ethics approval and consent to participate
The study was approved by the Ethics Committee of the Xi’an Jiaotong University Health Science Center (No. 2018-485).
Consent for publication
Not applicable.
Competing interests
The authors declare that they have no competing interests.
Footnotes
Publisher’s Note
Springer Nature remains neutral with regard to jurisdictional claims in published maps and institutional affiliations.
References
- 1.Benjamin EJ, Muntner P, Alonso A, Bittencourt MS, Callaway CW, Carson AP, et al. Heart disease and stroke statistics-2019 update: a report from the American Heart Association. Circulation. 2019;139:e56–e528. doi: 10.1161/CIR.0000000000000659. [DOI] [PubMed] [Google Scholar]
- 2.Lusis AJ. Atherosclerosis. Nature. 2000;407:233–241. doi: 10.1038/35025203. [DOI] [PMC free article] [PubMed] [Google Scholar]
- 3.Stary HC, Chandler AB, Glagov S, Guyton JR, Insull W, Jr, Rosenfeld ME, et al. A definition of initial, fatty streak, and intermediate lesions of atherosclerosis. A report from the committee on vascular lesions of the council on arteriosclerosis, American Heart Association. Circulation. 1994;89:2462–2478. doi: 10.1161/01.CIR.89.5.2462. [DOI] [PubMed] [Google Scholar]
- 4.Otsuka F, Yasuda S, Noguchi T, Ishibashi-Ueda H. Pathology of coronary atherosclerosis and thrombosis. Cardiovasc Diagn Ther. 2016;6:396–408. doi: 10.21037/cdt.2016.06.01. [DOI] [PMC free article] [PubMed] [Google Scholar]
- 5.Maguire EM, Pearce SWA, Xiao Q. Foam cell formation: a new target for fighting atherosclerosis and cardiovascular disease. Vasc Pharmacol. 2019;112:54–71. doi: 10.1016/j.vph.2018.08.002. [DOI] [PubMed] [Google Scholar]
- 6.Mestas J, Ley K. Monocyte-endothelial cell interactions in the development of atherosclerosis. Trends Cardiovasc Med. 2008;18:228–232. doi: 10.1016/j.tcm.2008.11.004. [DOI] [PMC free article] [PubMed] [Google Scholar]
- 7.Li AC, Glass CK. The macrophage foam cell as a target for therapeutic intervention. Nat Med. 2002;8:1235–1242. doi: 10.1038/nm1102-1235. [DOI] [PubMed] [Google Scholar]
- 8.Jin X, Kruth HS. Culture of macrophage colony-stimulating factor differentiated human monocyte-derived macrophages. J Vis Exp. 2016;112:54244. doi: 10.3791/54244. [DOI] [PMC free article] [PubMed] [Google Scholar]
- 9.Chitu V, Yeung YG, Yu W, Nandi S, Stanley ER. Measurement of macrophage growth and differentiation. Curr Protoc Immunol. 2011;14:1–26. doi: 10.1002/0471142735.im1420s92. [DOI] [PMC free article] [PubMed] [Google Scholar]
- 10.Steinberg D, Parthasarthy S, Carew TE, Khoo JC, Witztum JL. Beyond cholesterol. Modifications of low-density lipoprotein that increase its atherogenicity. N Engl J Med. 1989;320:915–924. doi: 10.1056/NEJM198901053200122. [DOI] [PubMed] [Google Scholar]
- 11.Parthasarathy S, Quinn MT, Steinberg D. Is oxidized low density lipoprotein involved in the recruitment and retention of monocyte/macrophages in the artery wall during the initiation of atherosclerosis? Basic Life Sci. 1988;49:375–380. doi: 10.1007/978-1-4684-5568-7_58. [DOI] [PubMed] [Google Scholar]
- 12.Quinn MT, Parthasarathy S, Fong LG, Steinberg D. Oxidatively modified low density lipoproteins: a potential role in recruitment and retention of monocyte/macrophages during atherogenesis. Proc Natl Acad Sci U S A. 1987;84:2995–2998. doi: 10.1073/pnas.84.9.2995. [DOI] [PMC free article] [PubMed] [Google Scholar]
- 13.Kunjathoor VV, Febbraio M, Podrez EA, Moore KJ, Andersson L, Koehn S, et al. Scavenger receptors class A-I/II and CD36 are the principal receptors responsible for the uptake of modified low density lipoprotein leading to lipid loading in macrophages. J Biol Chem. 2002;277:49982–49988. doi: 10.1074/jbc.M209649200. [DOI] [PubMed] [Google Scholar]
- 14.Ouimet M, Marcel YL. Regulation of lipid droplet cholesterol efflux from macrophage foam cells. Arterioscler Thromb Vasc Biol. 2012;32:575–581. doi: 10.1161/ATVBAHA.111.240705. [DOI] [PubMed] [Google Scholar]
- 15.Maxfield FR, van Meer G. Cholesterol, the central lipid of mammalian cells. Curr Opin Cell Biol. 2010;22:422–429. doi: 10.1016/j.ceb.2010.05.004. [DOI] [PMC free article] [PubMed] [Google Scholar]
- 16.Ouimet M, Franklin V, Mak E, Liao X, Tabas I, Marcel YL. Autophagy regulates cholesterol efflux from macrophage foam cells via lysosomal acid lipase. Cell Metab. 2011;13:655–667. doi: 10.1016/j.cmet.2011.03.023. [DOI] [PMC free article] [PubMed] [Google Scholar]
- 17.Bobryshev YV. Monocyte recruitment and foam cell formation in atherosclerosis. Micron. 2006;37:208–222. doi: 10.1016/j.micron.2005.10.007. [DOI] [PubMed] [Google Scholar]
- 18.Moore KJ, Sheedy FJ, Fisher EA. Macrophages in atherosclerosis: a dynamic balance. Nat Rev Immunol. 2013;13:709–721. doi: 10.1038/nri3520. [DOI] [PMC free article] [PubMed] [Google Scholar]
- 19.Febbraio M, Guy E, Silverstein RL. Stem cell transplantation reveals that absence of macrophage CD36 is protective against atherosclerosis. Arterioscler Thromb Vasc Biol. 2004;24:2333–2338. doi: 10.1161/01.ATV.0000148007.06370.68. [DOI] [PubMed] [Google Scholar]
- 20.Makowski L, Boord JB, Maeda K, Babaev VR, Uysal KT, Morgan MA, et al. Lack of macrophage fatty-acid-binding protein aP2 protects mice deficient in apolipoprotein E against atherosclerosis. Nat Med. 2001;7:699–705. doi: 10.1038/89076. [DOI] [PMC free article] [PubMed] [Google Scholar]
- 21.Kang JH, Ryu HS, Kim HT, Lee SJ, Choi UK, Park YB, et al. Proteomic analysis of human macrophages exposed to hypochlorite-oxidized low-density lipoprotein. Biochim Biophys Acta. 2009;1794:446–458. doi: 10.1016/j.bbapap.2008.11.015. [DOI] [PubMed] [Google Scholar]
- 22.Kang JH, Kim HT, Choi MS, Lee WH, Huh TL, Park YB, et al. Proteome analysis of human monocytic THP-1 cells primed with oxidized low-density lipoproteins. Proteomics. 2006;6:1261–1273. doi: 10.1002/pmic.200500290. [DOI] [PubMed] [Google Scholar]
- 23.Fach EM, Garulacan LA, Gao J, Xiao Q, Storm SM, Dubaquie YP, et al. In vitro biomarker discovery for atherosclerosis by proteomics. Mol Cell Proteomics. 2004;3:1200–1210. doi: 10.1074/mcp.M400160-MCP200. [DOI] [PubMed] [Google Scholar]
- 24.Castagna A, Polati R, Bossi AM, Girelli D. Monocyte/macrophage proteomics: recent findings and biomedical applications. Expert Rev Proteomics. 2012;9:201–215. doi: 10.1586/epr.12.11. [DOI] [PubMed] [Google Scholar]
- 25.Röszer T. Understanding the Biology of Self-Renewing Macrophages. Cells. 2018;7:103. [DOI] [PMC free article] [PubMed]
- 26.Wolf D, Ley K. Immunity and inflammation in atherosclerosis. Circ Res. 2019;124:315–327. doi: 10.1161/CIRCRESAHA.118.313591. [DOI] [PMC free article] [PubMed] [Google Scholar]
- 27.Saxena M, Yeretssian G. NOD-like receptors: master regulators of inflammation and cancer. Front Immunol. 2014;5:327. doi: 10.3389/fimmu.2014.00327. [DOI] [PMC free article] [PubMed] [Google Scholar]
- 28.Kingeter LM, Lin X. C-type lectin receptor-induced NF-κB activation in innate immune and inflammatory responses. Cell Mol Immunol. 2012;9:105–112. doi: 10.1038/cmi.2011.58. [DOI] [PMC free article] [PubMed] [Google Scholar]
- 29.Kim K, Shim D, Lee JS, Zaitsev K, Williams JW, Kim KW, et al. Transcriptome analysis reveals nonfoamy rather than foamy plaque macrophages are proinflammatory in atherosclerotic murine models. Circ Res. 2018;123:1127–1142. doi: 10.1161/CIRCRESAHA.118.312804. [DOI] [PMC free article] [PubMed] [Google Scholar]
- 30.Spann NJ, Garmire LX, McDonald JG, Myers DS, Milne SB, Shibata N, et al. Regulated accumulation of desmosterol integrates macrophage lipid metabolism and inflammatory responses. Cell. 2012;151:138–152. doi: 10.1016/j.cell.2012.06.054. [DOI] [PMC free article] [PubMed] [Google Scholar]
- 31.McLaren JE, Michael DR, Ashlin TG, Ramji DP. Cytokines, macrophage lipid metabolism and foam cells: implications for cardiovascular disease therapy. Prog Lipid Res. 2011;50:331–347. doi: 10.1016/j.plipres.2011.04.002. [DOI] [PubMed] [Google Scholar]
- 32.Qiao L, Wang HF, Xiang L, Ma J, Zhu Q, Xu D, et al. Deficient chaperone-mediated autophagy promotes lipid accumulation in macrophage. J Cardiovasc Transl Res. 2020;14:661–669. doi: 10.1007/s12265-020-09986-3. [DOI] [PMC free article] [PubMed] [Google Scholar]
- 33.Lutgens E, Kutgens SPM, Faber BCG, Heeneman S, Gijbels MMJ, De Winther MPJ, et al. Disruption of the cathepsin K gene reduces atherosclerosis progression and induces plaque fibrosis but accelerates macrophage foam cell formation. Circulation. 2006;113:98–107. doi: 10.1161/CIRCULATIONAHA.105.561449. [DOI] [PubMed] [Google Scholar]
- 34.Ganesan R, Henkels KM, Wrenshall LE, Kanaho Y, Paolo GD, Frohman MA, et al. Oxidized LDL phagocytosis during foam cell formation in atherosclerotic plaques relies on a PLD2-CD36 functional interdependence. J Leukoc Biol. 2018;103:867–883. doi: 10.1002/JLB.2A1017-407RR. [DOI] [PMC free article] [PubMed] [Google Scholar]
- 35.Paul A, Chang BHJ, Li L, Yechoor VK, Chan L. Deficiency of adipose differentiation-related protein impairs foam cell formation and protects against atherosclerosis. Circ Res. 2008;102:1492–1501. doi: 10.1161/CIRCRESAHA.107.168070. [DOI] [PMC free article] [PubMed] [Google Scholar]
Associated Data
This section collects any data citations, data availability statements, or supplementary materials included in this article.
Supplementary Materials
Additional file 1. The correlation and coefficient of variation for biological replicates. (A) Coefficient of variation. (B) Pearson correlation coefficient of three replications.
Additional file 2. List of MS data and proteins identified in monocyte, macrophage, and foam cell by TMT- based quantitative proteomics.
Additional file 3. List of differentially expressed proteins (fold change > 1.5, p < 0.05) in macrophage/monocyte, foam cell/ macrophage, and foam cell/monocyte.
Additional file 4. Kyoto encyclopedia of genes and genomes (KEGG) enrichment analysis of differentially expressed proteins in macrophage/ monocyte.
Additional file 5. High interaction nodes obtained by protein-protein interaction (PPI) analysis of Gene Ontology (GO)-based functional enrichment terms in the foam cell/macrophage group.
Additional file 6. The differentially expressed proteins located in the endoplasmic reticulum or lysosome with the top 50 strongest interactions.
Data Availability Statement
All data generated or analyzed during this study are included in this published article and its supplementary information files.


