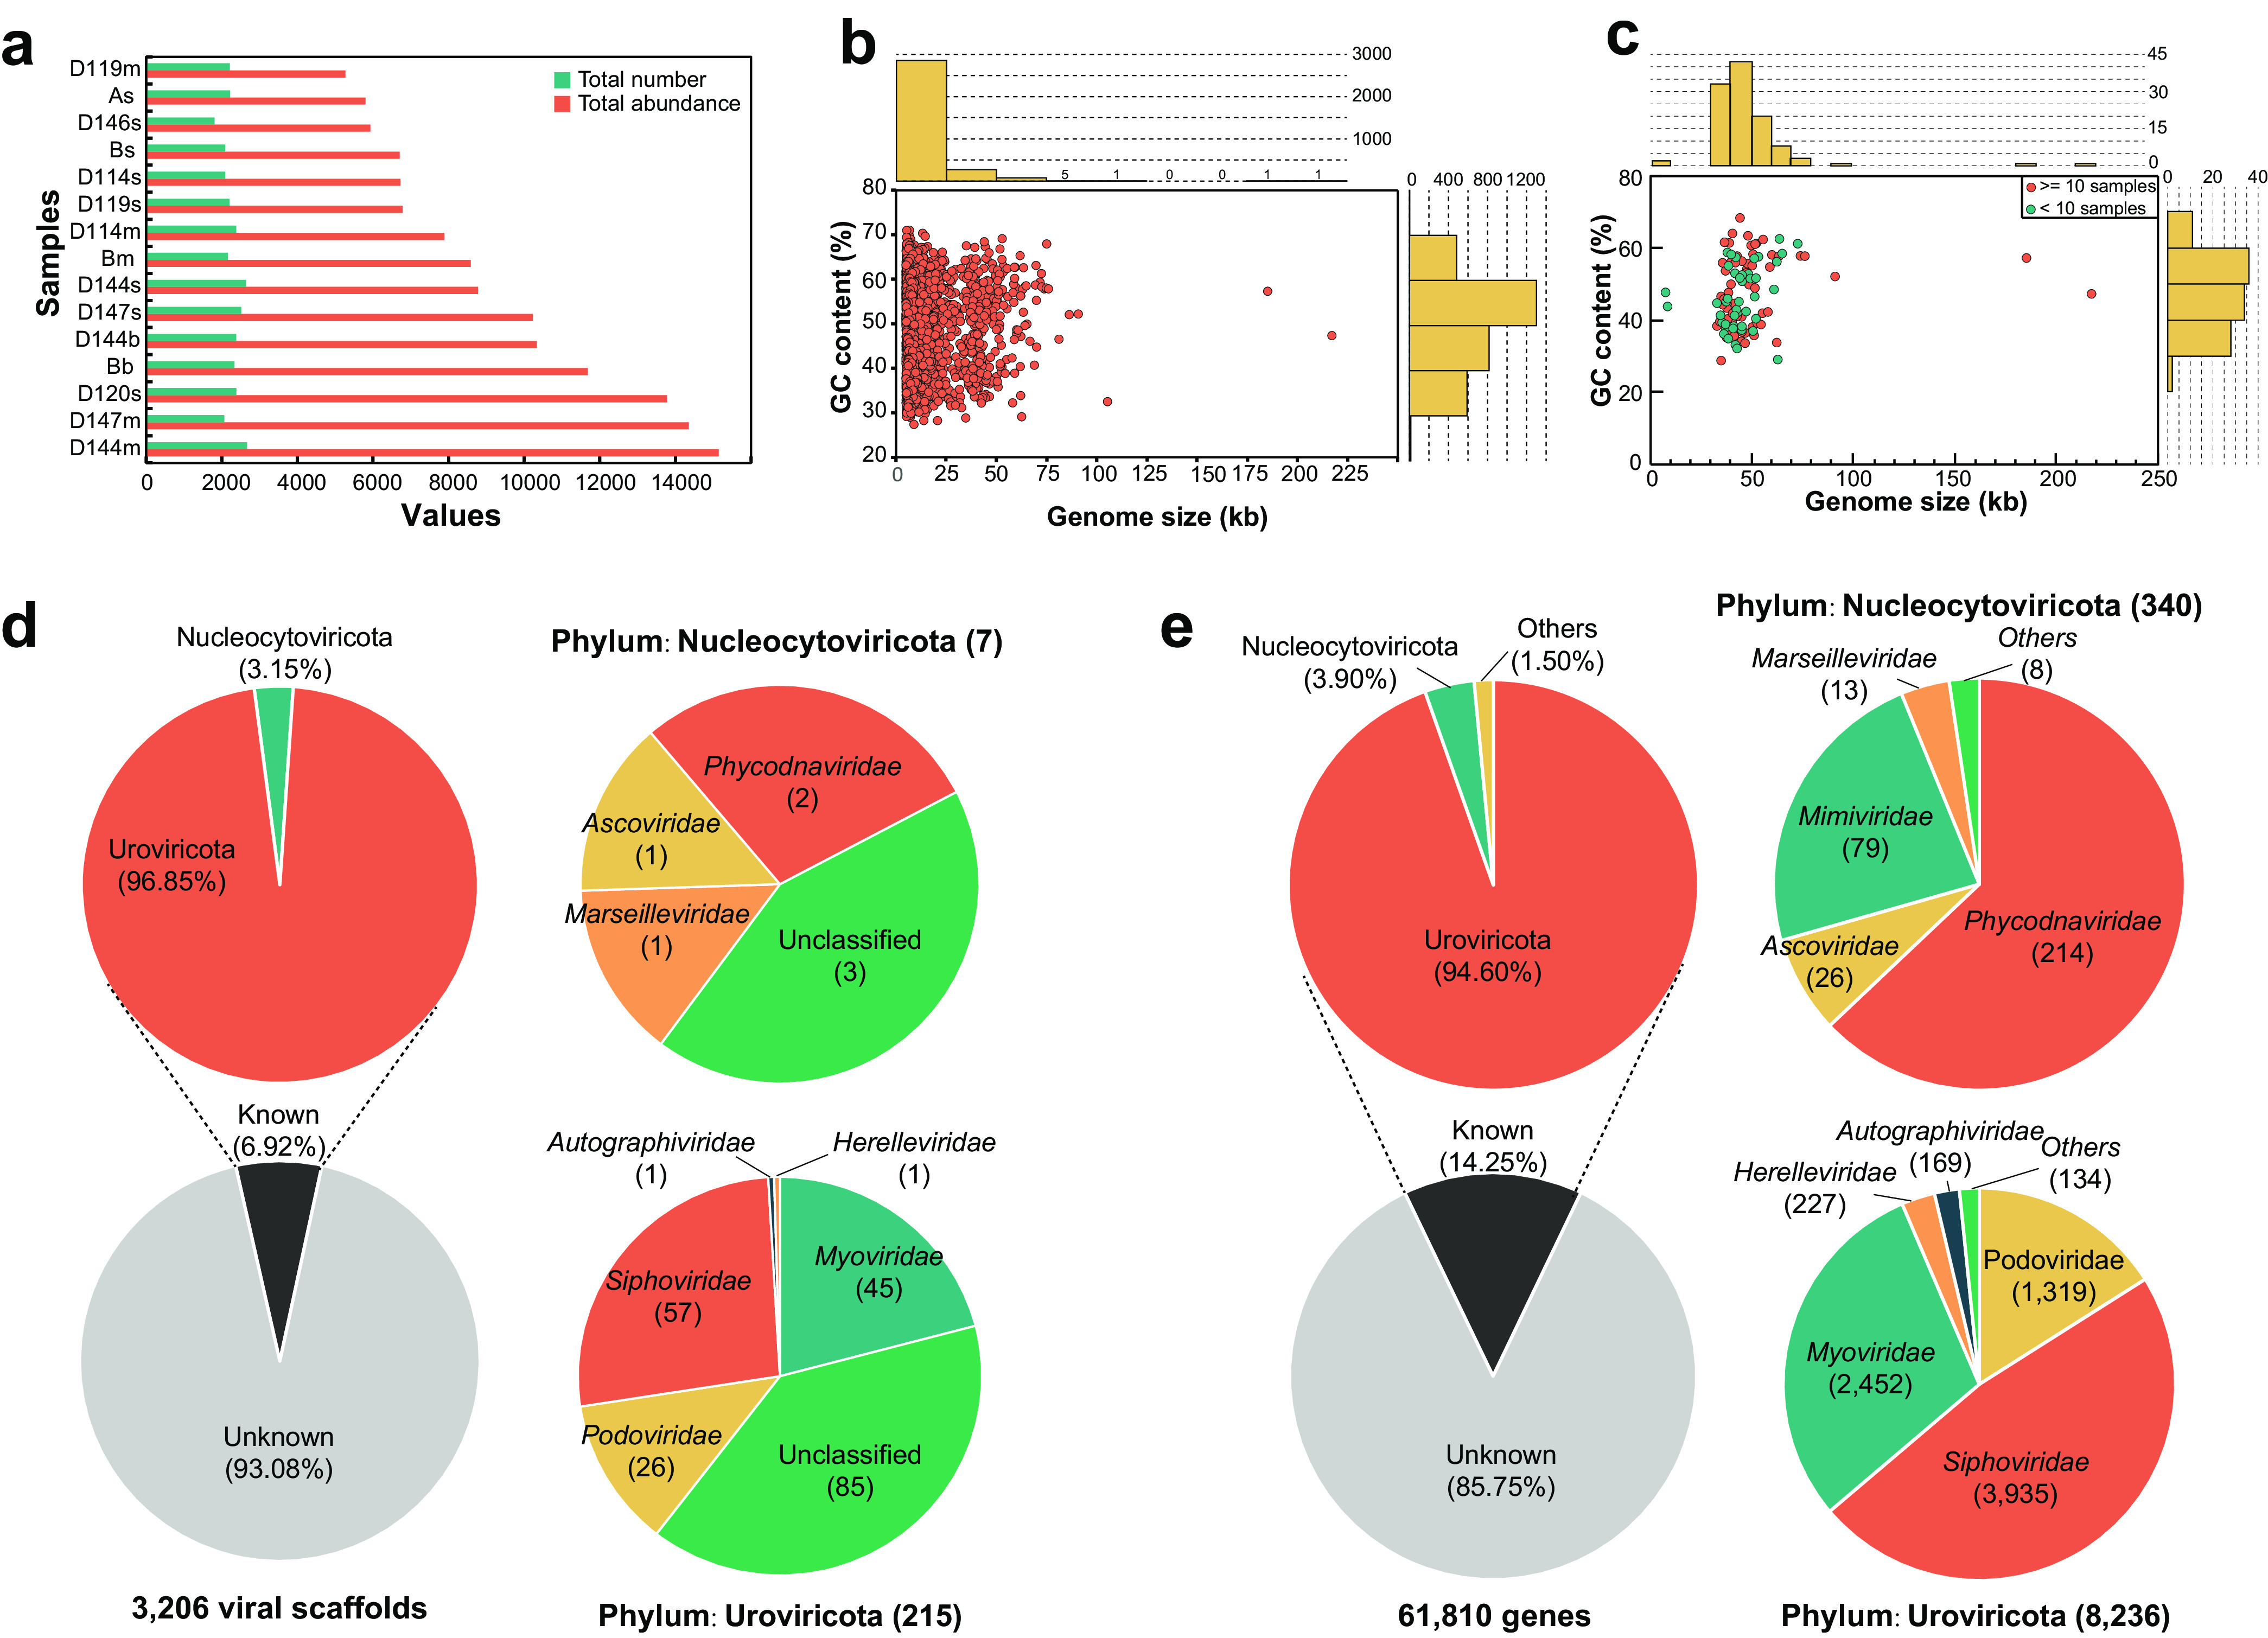
FIG 2.

Profiles of MTS-VSs and their taxonomic assignments. (a) Total number (green) and abundance (red) of VSs (x axis) in each sediment sample (y axis). The samples are shown by increasing richness. (b) Distribution of genome size and GC content (percent) of 3,206 viral scaffolds. Each circle represents one viral scaffold. (c) Distribution of genome size and GC content (percent) of 111 high-quality viral scaffolds. Each circle represents one circular viral scaffold. The red circles represent the viruses that exist in 10 or more samples, whereas the others are represented by green circles. (d) Taxonomic assignments of all viral scaffolds. (e) Taxonomic assignments of all predicted viral protein-coding sequences.
