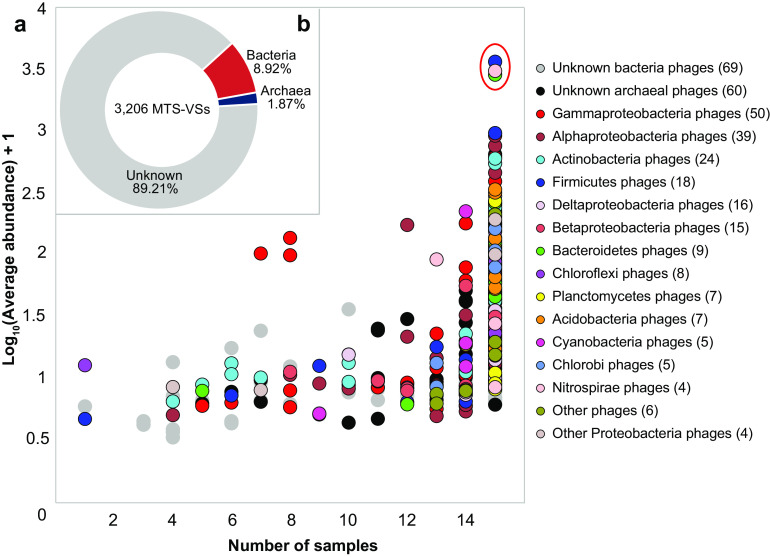
FIG 7.
Host prediction of the MTS viruses. (a) Taxonomic affiliation of MTS-VSs sorted by distribution (x axis) and average abundance (y axis), according to host prediction. Here, the average relative abundance (y axis) of an MTS-VS is defined as the mean relative abundance of this viral scaffold across all samples. The numbers of viral scaffolds with predicted hosts of the same phylum are shown in parentheses. The three circles within the red oval represent the most abundant viral scaffolds with predicted hosts, and these exist in all the samples. (b) Proportion of MTS-VSs with predicted hosts.

