

Abstract
Background:
Across many settings, lack of virologic control remains common in people with HIV (PWH) due to late presentation and lack of retention in care. This contributes to neuronal damage and neurocognitive impairment, which remain prevalent. More evidence is needed to understand these outcomes in both PWH and people without HIV (PWOH).
Methods:
We recruited PWH initiating antiretroviral therapy (ART) as well as PWOH at two sites in the United States. 108 adults were enrolled (56 PWOH and 52 PWH), most of whom had a second assessment at least 24 weeks later (193 total assessments). Tumor necrosis factor alpha (TNFα), monocyte chemotactic protein-1 (MCP-1), neopterin, soluble CD14, and neurofilament light chain protein (NFL) were measured in plasma and cerebrospinal fluid (CSF). Using multivariate models including Bayesian Model Averaging (BMA), we analyzed factors associated with global neuropsychological (NP) performance (NPT-9) and CSF NFL at baseline and over time.
Results:
At baseline, higher CSF MCP-1 and plasma sCD14 were associated with worse NPT-9 in PWH, while CSF HIV RNA decrease was the only marker associated with improved NPT-9 over time. Among PWH, higher CSF neopterin was most closely associated with higher NFL. Among PWOH, higher CSF MCP-1 was most closely associated with higher NFL. Following ART initiation, decrease in CSF MCP-1 was most closely associated with NFL decrease.
Conclusion:
Monocyte-associated CSF biomarkers are highly associated with neuronal damage in both PWH and PWOH. More research is needed to evaluate if therapies targeting monocyte-associated inflammation may ameliorate HIV-associated neurobehavioral diseases.
Keywords: HIV, AIDS, cerebrospinal fluid, cognitive disorders
Introduction
With the widespread use of combination antiretroviral therapy (ART), people with human immunodeficiency virus (HIV) (PWH) are living longer with improved quality of life.1 Despite these advances, HIV has been linked to a persistent increase in systemic as well as central nervous system (CNS) inflammation.2,3 Greater systemic inflammation in PWH is associated with adverse clinical outcomes, including increased mortality.4 Like other adverse clinical outcomes such as cardiovascular disease during HIV,5 recent research suggests that the development of HIV-associated neurocognitive disorder (HAND) despite ART may also be inflammatory mediated.6 While HIV-associated dementia (HAD) incidence has decreased in the ART era, the milder neurocognitive impairment phenotypes of HAND are still prevalent overall,7 and therefore a more thorough understanding of cognition during HIV infection is needed.
ART initiation has long been associated with neurocognitive improvement in PWH, dating back to trials with zidovudine monotherapy that showed significant improvement compared to placebo.8 Since then, studies of combination ART regimens have similarly shown significant neurocognitive improvement.9 Likewise, decreases in neuronal damage (as reflected by the neuronal marker neurofilament light chain) have been demonstrated in longitudinal studies after virologic suppression with ART.10–12 However, it is less clear if either cognition or neuronal damage in the absence of ART are associated with inflammation independently of HIV RNA levels. It is also not clear if improvements in neurocognitive performance and neuronal damage after initiation of ART are associated with decrease in inflammation independently of HIV RNA decrease. These remain important issues given that lack of durable virologic suppression and late presentation to care are still common among HIV-infected populations in several countries worldwide.13–15 More broadly, treatment studies of HAND as well as other neuro-inflammatory diseases are often initially supported by the effect of an intervention on inflammatory markers.16 However, the longitudinal course of many cerebrospinal fluid (CSF) biomarkers in healthy PWOH is mostly unknown,17 making the interpretation of CSF biomarker change in HIV and other disease states difficult.
Several soluble inflammatory biomarkers have been associated with HAND as well as other neurological diseases. These include Tumor Necrosis Factor Alpha (TNFα), Neopterin, soluble CD14 (sCD14), Monocyte Chemotactic Protein-1 (MCP-1), and Neurofilament Light Chain.18–24 More broadly, these markers of monocyte-associated inflammation have been linked to many other neurological diseases. Examples include amyotrophic lateral sclerosis. (ALS), Alzheimer’s disease (AD), Parkinsonian syndromes, and meningitis.25–31 In terms of neuronal damage, NFL is a major structural component of myelinated axons and elevated levels of NFL in the CSF is an indicator of axonal damage. CSF NFL elevation has been associated with HAD as well as the progression of AD.32,33 Higher CSF NFL can be found in PWH despite virological suppression compared to PWOH when matched for life-style factors.34
Our group sought to analyze baseline and longitudinal biomarkers from CSF and plasma in both PWH and PWOH to evaluate the relationship between inflammation and the outcomes of cognition and neuronal damage, including after initiation of ART. We hypothesized that CNS inflammation would be associated with neuronal damage and neuropsychological (NP) performance independently of HIV RNA levels before ART. We also hypothesized that there would be an association between attenuation of CNS inflammation and improvement in NP performance and neuronal damage during ART, again independent of HIV RNA decrease. Lastly, we hypothesized that compared to PWH initiating ART, CNS inflammation and neuronal damage in PWOH would remain unchanged over time.
Methods
Study participants:
Two groups were analyzed. The first was a group of healthy PWOH who were assessed in ongoing observational projects at the HIV Neurobehavioral Research Program at the University of California, San Diego. For the purposes of the current analysis, individuals were excluded for any of the following characteristics: 1) Serious neuropsychiatric comorbidities including traumatic brain injury, schizophrenia or other psychotic disorder, stroke, or seizure disorder, 2) Substance abuse or dependence in the previous five years as defined by diagnostic and statistical manual of mental disorders version four (DSM-IV) criteria35, 3) history of syphilis with serofast RPR titer of greater than 1:8. PWOH were assessed between 2003 and 2013.
The second group was composed of PWH at the clinical research site of the Emory University Center for AIDS Research (CFAR). Eligible participants were either ART naïve or off ART for at least six months with plans to start ART. PWH were excluded from this project for the same reasons as PWOH with the addition of current or past AIDS-related opportunistic disease of the CNS. PWH then initiated ART with an a priori plan of measuring changes in neuropsychological performance and biomarkers over time in a primary analysis. The goal of the project was to identify biomarkers associated with NP performance and neuronal damage before and during ART. PWH were enrolled between 2011 and 2017. The study was approved by the Institutional Review Board at both institutions and written consent was obtained from all participants. The protocols were performed in accordance with the Helsinki Declaration.
Neuropsychological and laboratory testing:
The neuropsychological (NP) test battery used for the HIV+ participants included nine tests that are used commonly in studies of HAND.36 Please see supplemental text part I for details of this testing. Briefly, a composite global NP test score (NPT-9) was then calculated by average of individual T scores. To assess change in blood and CSF biomarkers, PWH were invited for a second visit 24–48 weeks after starting ART, while PWOH underwent a second visit approximately 48 weeks later as part of observational research studies. For the longitudinal NP assessments, score adjustment for practice effects was made by using median practice effect data from prior work.37 For the purposes of the multivariate analyses, only those HIV+ participants who had a significant decrease in plasma HIV RNA (defined by decrease of at least one log10 at their second visit) and were not lost to followup were analyzed at the second visit.
Blood plasma and CSF were collected and processed using the same protocol and stored at −80°C. HIV RNA concentrations were measured in plasma and CSF using the Abbott laboratories m2000 Real Time HIV-1 assay system (reverse transcriptase polymerase chain reaction), with lowest limit of HIV detection was 40 copies/milliliter (ml). The following biomarkers were measured using commercially available ELISAs as per manufacturer’s protocol: neopterin (Thermo Scientific), NFL (Uman diagnostics), and sCD14 (R&D systems). TNFα and MCP-1 were measured through multiplex bead assay (EMD Millipore via Luminex xMAP platform). Levels of each biomarker from both plasma and CSF were measured with the exception of NFL (for which only CSF levels were measured). For the sCD14 assay, only samples from the HIV+ participants were available. Each marker was measured in duplicate and all coefficients of variation were <20%.
Statistical analysis:
Patient demographic and clinical characteristics were compared between PWH and PWOH at baseline. Linear regression was first performed to evaluate the outcomes of NPT-9 and NFL at baseline and over time in PWH and to evaluate the outcome of NFL at baseline in PWOH. We then used Bayesian Model Averaging (BMA)38 for final model selection. Due to length considerations see supplemental text part II for description of statistical analysis.
Results
Baseline analysis:
At baseline there were 56 PWOH and 52 PWH, whose median estimated duration of HIV was nine years. Fifteen PWH (28.8%) were ART naïve, while the remainder were ART experienced with a median 12 months off ART. Mean NPT-9 among PWH was 44.9 (standard deviation=8.1). Twenty-three (44%) of PWH had GDS impairment at baseline. As seen in Table 1, PWH were slightly older and more likely to be African-American. Plasma concentrations of neopterin, MCP-1, and TNFα were all significantly higher in PWH than in PWOH at baseline, differences which persisted when accounting for differences in demographics (p=0.006 or less). CSF concentrations of neopterin, MCP-1, and TNFα were also significantly higher in PWH. These differences persisted (p=0.004 or less) after adjustment for demographic differences as well as differences in CSF RBC and CSF protein, except for CSF TNFα, which became not significantly different (p=0.15) between the two groups.
Table 1: Participant Demographic/Disease Characteristics at baseline:
Reported as either median (interquartile range) or number [% of column group]
| Demographic/Disease Variable | HIV+ (n=52) | HIV negative (n=56) | Unadjusted P-valuea | Adjusted P-valueb |
|---|---|---|---|---|
| Age in years | 44 (34–50) | 37 (24–48) | 0.022 | |
|
| ||||
| Male sex | 42 [80.8%] | 43 [76.8%] | 0.646 | |
|
| ||||
| Race/Ethnicity | < 0.001 | |||
| White | 7 [13.5%] | 24 [42.9%] | ||
| African/American | 45 [86.5%] | 13 [23.2%] | ||
| Hispanic | 0 [0%] | 15 [26.8%] | ||
| Other | 0 [0%] | 2 [3.6%] | ||
|
| ||||
| Co-morbidities | ||||
| Hypertension | 5 [9.6%] | 8 [14.3%] | 0.560 | |
| Diabetes Mellitus | 1 [1.9%] | 6 [10.7%] | 0.110 | |
| Hepatitis C | 4 [7.7%] | 0 [0%] | 0.051 | |
|
| ||||
| Laboratory Results | ||||
| Creatininec | 0.9 (0.8–1.1) | 0.9 (0.7–1.0) | 0.130 | |
| CD4+ (absolute) | 76 (28–274) | - | - | |
| CD4+ (%) | 8 (4–21) | - | - | |
| Plasma HIV RNAd | 4.8 (4.1–5.3) | - | - | |
| CSF WBCe | 1 (0–6) | 2 (1–3) | 0.447 | |
| CSF RBCe | 0 (0–1) | 1 (0–19) | < 0.001 | |
| CSF Proteinc | 38 (33–50) | 30 (24–38) | < 0.001 | |
| CSF HIV RNAd | 3.2 (2.1–3.8) | - | ||
|
| ||||
| Plasma biomarkers | ||||
| Neopterin | 14.9 (10.4–30.3) | 4.8 (4.5–5) | < 0.001 | < 0.001 |
| MCP-1 | 341 (207–502) | 225 (201–308) | 0.003 | < 0.001 |
| TNFα | 24.7 (18.5–36.2) | 18.5 (11.4–25.4) | < 0.001 | 0.006 |
| sCD14 | 1480985 (1197521–2049568) | - | - | - |
|
| ||||
| CSF biomarkers | ||||
| Neopterin | 17.6 (10.9–35.3) | 4.0 (3.8–4.4) | < 0.001 | < 0.001 |
| MCP-1 | 1824 (1375–2706) | 1217 (1009–1437) | < 0.001 | 0.004 |
| TNFa | 3.6 (2.6–5.9) | 2.1 (1.7–2.6) | < 0.001 | 0.152 |
| sCD14 | 87140 (55692–138814) | - | - | |
Significant P values (<0.05) are in bold font.
P-values for the test of group difference. Wilcoxon rank sum test is used for continuous data, and Fisher’s exact test is used for categorical (binary) data.
P-values for the coefficient of HIV group indicator (HIV+ vs. HIV negative) from a linear regression model: i) adjusted by age and race for Plasma biomarkers; ii) and adjusted by age, race, and CSF RBC plus CSF protein for CSF biomarkers.
milligrams/deciliter
opies/milliliter log10 transformed
cells/microliter; biomarkers units= picograms/milliliter, except for neopterin which= nanomole/liter
Supplemental table A shows the associations at baseline between biomarkers and NPT-9 in PWH after adjusting for age, race/ethnicity, and sex. In addition to plasma HIV RNA, the following biomarkers had a significant negative relationship with NPT-9: Unit increases (see table for scales) in CSF MCP-1 (2.34 [95% CI: −3.52 to −1.17]), CSF neopterin (1.71 [95% CI: −2.93 to −0.49]), plasma neopterin (1.62 [95% CI: −2.74 to −0.51]), and plasma sCD14 (0.65 [95% CI: −1.03 to −0.26]). As seen in the second and third part of supplemental table A, these markers retained a significant negative association with NPT-9 when adjusting for plasma or CSF HIV RNA.
Supplemental table B shows the demographic-adjusted associations at baseline between inflammation biomarkers and CSF NFL in both PWH and PWOH. 10-fold higher CSF HIV (one log10) was associated with 65% (e/3=1.647; 95% CI: 1.283 to 2.114) higher NFL. Higher CSF MCP-1, CSF neopterin, and CSF sCD14 were significantly associated with higher NFL in both models that adjusted for plasma HIV RNA as well as models that adjusted for CSF HIV RNA (all p-values < 0.001). In PWOH, 1,000 pg/ml higher CSF MCP-1 was associated with 86% (e/3=1.864; 95% CI: 1.307 to 2.659; p-value < 0.001) higher NFL. Higher CSF TNFα and CSF neopterin were also significantly associated with higher NFL in this group.
Table 2 lists the final sets of covariates that had PEPs over 0.5 in the BMA analyses that assessed baseline association between NPT-9/NFL outcomes and all possible combinations of biomarkers and demographic variables in the multiple linear regression model. Higher CSF MCP-1 and plasma sCD14 both had weak negative associations with NPT-9 in PWH (PEP=0.623 and 0.619, respectively). Also in PWH, CSF neopterin was the most important covariate for explaining the variability in the NFL (PEP = 0.904). Specifically, for every for every 10 nmol/l increase in the CSF neopterin, there was 35% (E[β|Data] = 0.301, SD[β|Data] = 0.140, expE[β|Data] = 1.351) increase in the NFL, adjusting for all biomarkers and demographic variables. In PWOH, age and CSF MCP-1 were strongly associated with NFL (PEP’s > 0.95), controlling for other covariates.
Table 2:
Results of BMA method for assessing association of NPT9 (top panel) or natural log transformed CSF NFL (bottom two panels) with a set of covariates at baseline E(P|Data) denotes the posterior weighted average of the model-specific point estimates of the coefficient across all possible multiple linear regression models that can be formed using 13 covariatesa in HIV+ (n=51) and 9 covariatesb in HIVnegative (n=54) participants. SD[β|Data] denotes the posterior standard deviation of β. Only the covariates with posterior effect probability (PEP), P(P ≠ 0 |D), greater than 0.5 are reported.
| Covariate | Unit | E[P|Data] (SD[P|Data]) | exp(E[P|Data]) | P(P ≠ 0|Data) |
|---|---|---|---|---|
| Outcome is NPT9 in HIV+ participants | ||||
| CSF MCP-1 | Per 1,000 pg/ml increase | −0.533 (0.743) | - | 0.623 |
| Plasma sCD14 | Per 100,000 pg/ml increase | −0.126 (0.171) | - | 0.619 |
| Outcome is CSF NFL (natural log transformed) | ||||
| CSF MCP-1 | Per 1,000 pg/ml increase | 0.164 (0.145) | 1.178 | 0.648 |
| Plasma MCP-1 | Per 1,000 pg/ml increase | −0.834 (0.704) | 0.434 | 0.667 |
| CSF Neopterin | Per 10 nmol/l increase | 0.301 (0.140) | 1.351 | 0.904 |
| Outcome is CSF NFL (natural log transformed) in HIVnegative participants | ||||
| Age | Per 1-year increase | 0.018 (0.007) | 1.018 | 0.968 |
| CSF MCP-1 | Per 1,000 pg/ml increase | 0.517 (0.187) | 1.677 | 0.969 |
| CSF Neopterin | Per 10 nmol/l increase | 0.517 (0.739) | 1.678 | 0.508 |
| CSF TNFa | Per 10 pg/ml increase | 0.892 (0.974) | 2.441 | 0.618 |
PEPs higher than 0.75 are in bold font.
Abbreviations: SD = standard deviation; BMA = Bayesian Model Averaging; PEP = Posterior Effect Probability; pg = picograms; ml = milliliter; nmol = nanomole
Age, race, gender, CSF MCP-1, Plasma MCP-1, CSF Neopterin, Plasma Neopterin, CSF TNFa, Plasma TNFa, CSF sCD14, Plasma sCD14, CSF HIV RNA and Plasma HIV RNA.
Age, race, gender, CSF MCP-1, Plasma MCP-1, CSF Neopterin, Plasma Neopterin, CSF TNFa and Plasma TNFa.
Lastly, in unadjusted analysis at baseline, there was a significant negative relationship (Beta= −0.054, p=0.003) between NFL as independent variable and NPT-9 as dependent variable among PWH. In the adjusted analysis incorporating age, sex, and race, the negative relationship between NFL and NPT-9 at baseline remained significant (Beta= −0.053, p= 0.003).
Longitudinal analysis:
All PWH were started on ART with at least three drugs (two nucleoside reverse transcriptase inhibitors plus either a boosted protease inhibitor, a non-nucleoside reverse transcriptase inhibitor, or an integrase inhibitor). 31 participants who were retained at the second visit and had a decrease in plasma HIV RNA of at least 1 log10 were analyzed (six participants did not have a plasma HIV RNA decrease of at least 1 log10 at the second visit and the rest were lost to followup). Median time between visits among these 31 participants was 201 days. 90.3% achieved plasma HIV RNA <200 copies/ml at the second visit. Even accounting for practice effects, NPT-9 in this group improved significantly from a mean of 44.5 to a mean of 48.3 (p<0.0001). As seen in Table 3 (top half), all biomarkers of inflammation and neuronal damage decreased significantly from first (baseline) to second visits in PWH. 54 PWOH had biomarkers measured at a second longitudinal time point (with the exception of NFL which was measured from 53). Median interval between first and second visits was 386 days. In contrast to PWH, none of the biomarkers in PWOH changed significantly over time (bottom half of table 3), with the possible exception of CSF TNFα, for which there was a trend towards increase (p=0.05). Figure 1 shows the NFL change over time between PWH (blue) and PWOH (red). Specifically, despite a significant decrease after ART initiation, CSF NFL concentrations were significantly higher among PWH compared to PWOH at both time points (p<0.0001 for each). In unadjusted analysis at the second visit, there was also a significant negative relationship (Beta= −0.036, p=0.020) between NFL as independent variable and NPT-9 as dependent variable among PWH. After adjustment for age, race, and sex, this relationship weakened to a trend (Beta= −0.023, p=0.095).
Table 3: Biomarkers at the two longitudinal time points.
For HIV+ participants (top half, n=31), median interval= 201 days after commencing suppressive cART.
For HIVneg participants (bottom half, n=54), median interval= 386 days
| HIV+ group | Visit 1 (baseline) median (IQR) | Visit 2 median (IQR) | P-value for inter-visit difference |
| CSF MCP-1 | 2272 (1486–3155) | 1365 (1117–2048) | <0.0001 |
| Plasma MCP-1 | 406 (200–539) | 256 (193–348) | 0.0004 |
| CSF Neopterin | 29.1 (12.4–42.7) | 9.5 (6.4–11.1) | <0.0001 |
| Plasma Neopterin | 19.3 (11.7–31.0) | 7.8 (5.9–10.8) | <0.0001 |
| CSF TNFα | 4.1 (3.0–8.9) | 2.9 (1.9–4.01) | 0.0001 |
| Plasma TNFα | 30.8 (22.6–40.8) | 16.3 (12.0–28.3) | <0.0001 |
| CSF NFL | 825 (653–1850) | 724 (483–1308) | <0.0001 |
| Plasma sCD14 | 1714142 (1330812–2005375) | 1196219 (1003495–1561693) | 0.0001 |
| CSF sCD14 | 92167 (64087–150763) | 67867 (43447–93544) | 0.0001 |
| HIVneg group | Visit 1 (baseline) median (IQR) | Visit 2 median (IQR) | P-value for inter-visit difference a |
| CSF MCP-1 | 1208 (1002–1403) | 1175 (990–1504) | 0.70 |
| Plasma MCP-1 | 224.5 (200.8–308.0) | 243.5 (202.0–301.5) | 0.46 |
| CSF Neopterin | 4.0 (3.8–4.4) | 4.0 (3.7–4.5) | 0.40 |
| Plasma Neopterin | 4.8 (4.5–5.1) | 4.8 (4.5–5.8) | 0.93 |
| CSF TNFα | 2.1 (1.7–2.6) | 2.3 (2.0–2.7) | 0.05 |
| Plasma TNFα | 17.6 (11.4–24.0) | 16.5 (12.3–29.2) | 0.98 |
| CSF NFL | 277 (213–411) | 264 (213–405) | 0.65 |
Notes: Significant P values (<0.05) are in bold font.
Abbreviations: IQR= interquartile range
Matched pairs comparisons using Wilcoxon signed-rank test.
Figure 1:
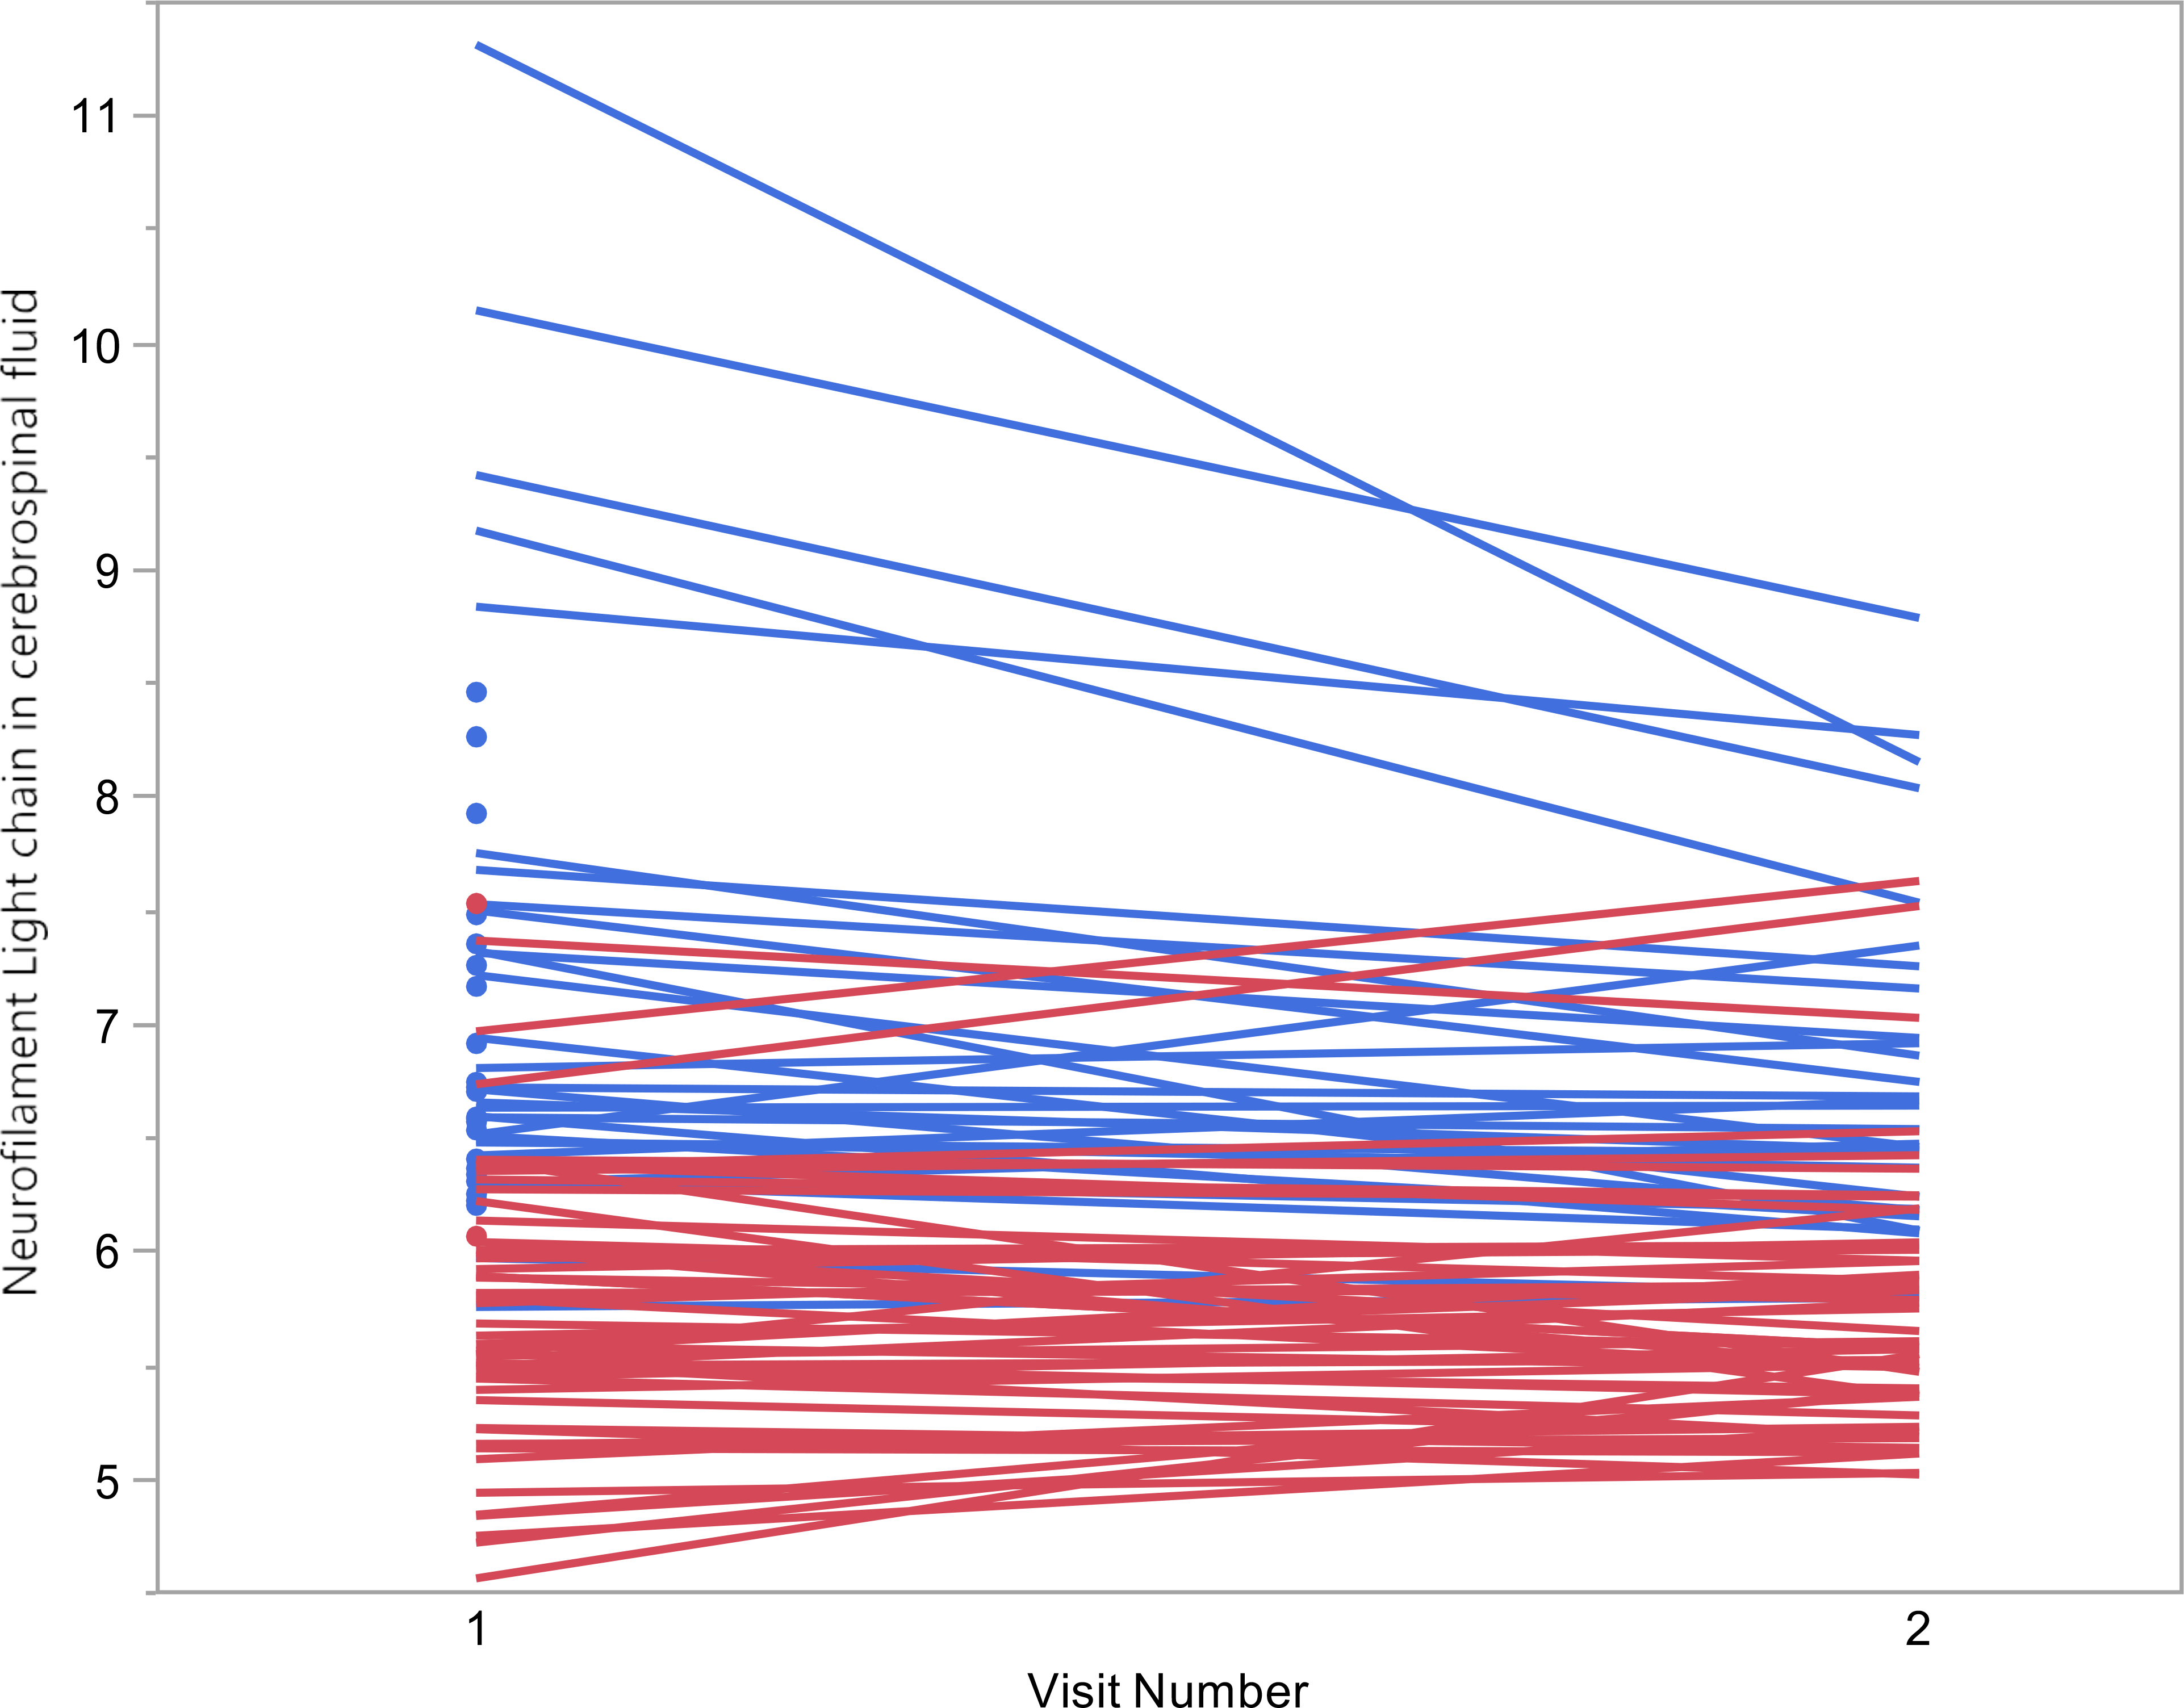
Change in Neurofilament light chain (NFL) over time. CSF NFL values displayed in natural log transformed scale. Blue= HIV+ participants; Red= HIVnegative participants. CSF NFL values are higher for HIV+ compared to HIVnegative at both time points (both p<0.0001). CSF NFL values decreased with cART in HIV+ (p<0.0001) but no significant change over time in HIVnegatives (p=0.65)
Table 4 (top portion) shows the results of linear regression analyses of adjusted association between biomarker change and NFL change between the two visits in PWH (i.e., biomarker change vs. NFL change). For example, 1,000 pg/ml greater decrease in CSF MCP-1 between the two visits led to 25% (ef]=0.75; 95% CI: 0.65 to 0.87; p < 0.001) decrease in the ratio between the second and first visits NFL measurements (translating to overall decrease in NFL). When all demographic variables and biomarker changes were simultaneously considered using BMA (bottom panel of Table 4), CSF MCP-1 change (PEP = 0.843) was the most important biomarker for explaining the change in NFL across the two visits.
Table 4.
(Top panel) Results of linear regression analyses for association of change in natural log transformed CSF NFL between two visits (loge CSF NFL at second visit - loge CSF NFL at baseline) with change in each CSF/plasma biomarker between the two visits in HIV+ participants (Bottom panel) Results of BMA method for assessing association of change in natural log transformed CSF NFL between two visits with a set of covariates. E(P|Data) denotes the posterior weighted average of the model-specific point estimates of the coefficient across all possible multiple linear regression models that can be formed using 13 covariatesa in HIV+ participants. SD[β|Data] denotes the posterior standard deviation of β. Only the covariates with posterior effect probability (PEP), P(P ≠ 0 |D), greater than 0.5 are reported.
| One biomarker per each model b | ||||
| Biomarker | Unit | P (SE) | P [95% CI] | P |
| CSF MCP-1 | Per 1,000 pg/ml greater decrease between two visits | −0.287 (0.069) | 0.750 [0.651, 0.865] | < 0.001 |
| Plasma MCP-1 | Per 1,000 pg/ml greater decrease between two visits | −0.076 (0.708) | 0.926 [0.215, 3.996] | 0.915 |
| CSF Neopterin | Per 10 nmol/l greater decrease between two visits | −0.319 (0.060) | 0.727 [0.642, 0.823] | < 0.001 |
| Plasma Neopterin | Per 10 nmol/l greater decrease between two visits | −0.162 (0.149) | 0.850 [0.625, 1.157] | 0.288 |
| CSF TNFa | Per 10 pg/ml greater decrease between two visits | −0.305 (0.223) | 0.737 [0.465, 1.167] | 0.184 |
| Plasma TNFa | Per 10 pg/ml greater decrease between two visits | −0.015 (0.116) | 0.985 [0.774, 1.252] | 0.895 |
| CSF sCD14 | Per 100,000 pg/ml greater decrease between two visits | −0.889 (0.242) | 0.411 [0.249, 0.678] | 0.001 |
| Plasma sCD14 | Per 100,000 pg/ml greater decrease between two visits | −0.042 (0.024) | 0.958 [0.912, 1.007] | 0.094 |
| CSF HIV RNA | Per 10-fold greater decrease between two visits | −0.162 (0.158) | 0.851 [0.615, 1.178] | 0.316 |
| Plasma HIV RNA | Per 10-fold greater decrease between two visits | −0.298 (0.166) | 0.742 [0.527, 1.045] | 0.085 |
| All clinical variables and biomarker change data considered by BMA method | ||||
| Covariate | Unit | E[P|Data] (SD[P|Data]) | exp(E[P|Data]) | P(P ≠ 0 |D) |
| CSF MCP-1 | Per 1,000 pg/ml greater decrease between two visits | −0.247 (0.138) | 0.781 | 0.843 |
| CSF sCD14 | Per 100,000 pg/ml greater decrease between two visits | −0.346 (0.327) | 0.708 | 0.639 |
Significant P values (<0.05) and PEPs higher than 0.75 are in bold font.
Abbreviations: CI = confidence interval; BMA = Bayesian Model Averaging; PEP = Posterior Effect Probability
Age, race, gender, CSF MCP-1, Plasma MCP-1, CSF Neopterin, Plasma Neopterin, CSF TNFa, Plasma TNFa, CSF sCD14, Plasma sCD14, CSF HIV RNA and Plasma HIV RNA (all CSF and Plasma biomarkers are changes between two visits).
All models are adjusted for age, race, and gender.
Supplemental table C shows the results of linear regression analyses (top section) of adjusted association between biomarker values at baseline and NFL change over time between the two visits in PWH (i.e., baseline biomarker vs. NP change). In these models, the associations between baseline biomarkers and NFL change were similar to the biomarker change analysis from table 4, with the addition of baseline CSF HIV RNA (a 1.0 log10 copies/mL lower CSF HIV RNA at baseline was associated with greater NP improvement over time). As seen in the bottom section of supplemental table C showing the BMA results, the association between NFL change and baseline CSF MCP-1 was similar to change in CSF MCP-1 over time. However, in contrast to table 4, higher baseline CSF neopterin was significantly associated with greater CSF NFL decrease over time, though the relationship was relatively weak.
Associations between biomarker change and NPT-9 change among PWH were similarly assessed in supplemental table D (top portion), but only decrease in CSF HIV RNA was significantly associated with improvement in NPT-9 (Beta = 2.29 per 1.0 log10 copies/mL more decrease; 95% CI: 4.09 to 0.48; p=0.015). No covariates were identified to have PEPs greater than 0.5 in the BMA analysis of the relationships between biomarker change and NPT change, and there were no significant associations between baseline biomarker values and NPT change over time (supplemental table E).
Discussion
Evidence continues to grow showing that inflammation plays a role in HAND and many other neuropsychological diseases. Therefore, more evidence is needed to better understand the relationship between neuro-inflammation and outcomes such as cognition and neuronal damage over time. In this prospective study, we studied several soluble inflammatory biomarkers that have been associated with HAND and many other neurological diseases. These included TNFα, neopterin, sCD14, MCP-1, and NFL.18–24
Evidence that describes the temporal change of inflammatory CSF markers over time in healthy people is lacking. This evidence is needed to put change during treatment of disease states into context. In this study, we demonstrated that these plasma and CSF biomarkers do not change significantly (with the possible exception of CSF TNFα) over approximately one year of follow-up in a cohort of over 50 PWOH. The lack of NFL change among PWOH in our study suggests that NFL concentrations are stable over the course of one year, though it should be noted that another study that followed healthy people over a longer period of time (median follow-up of 2.1 years) showed a slight but statistically significant increase in NFL concentration.39 The lack of change in PWOH contrasted with the changes that occurred in PWH after initiation of ART, which resulted in decrease in all markers that were tested. The changes in PWH confirm prior studies showing decreases in CSF NFL, neopterin, MCP-1, and TNFα over time after ART initiation.12,40–42 The finding of a decrease in CSF sCD14 with ART in the current study, while not surprising, adds another monocyte-associated inflammatory marker to this literature of change during ART.
Regarding outcomes, we found that biomarkers of higher monocyte-associated inflammation (specifically CSF MCP-1 and plasma sCD14) were more closely associated with worse global NP performance than HIV RNA levels in PWH. While studies in the pre-ART era identified an association between CSF MCP-1 and HAD, these associations either did not account for HIV RNA levels or became non-significant when accounting for them.43,44 Also in unadjusted analyses, other studies have shown an association between higher plasma sCD14 and worse NP performance.45 The findings from the current study provide evidence that monocyte-associated inflammation may contribute more to poor neurocognition than HIV RNA levels during untreated HIV. However, in the longitudinal analysis of NP change, only decrease in CSF HIV RNA was significantly associated with NP improvement. This suggests that factors that contribute to NP improvement with ART are different than the factors that contribute to NP performance prior to treatment. We acknowledge that loss to follow-up and lack of medication adherence made the HIV+ analysis cohort smaller at the second visit, meaning that our power to detect a relationship between change in inflammation and change in cognition may have been limited. More research is needed to evaluate the potential relationship between change in inflammation and NP change after initiation of ART.
NFL, a specific marker of neuronal damage, is another outcome we measured in this study. At baseline, we found a significant association between higher levels of multiple CSF inflammatory markers and higher NFL, even when accounting for HIV RNA levels. CSF levels of YKL-40, a marker of astroglial activation, have also been found to be associated with neuronal damage during HIV, providing more evidence of a detrimental relationship between inflammation and neuronal damage during HIV.46 Interestingly, the association between CSF monocyte-associated markers and neuronal damage was significant even in PWOH, particularly in the case of CSF MCP-1. Monocyte-associated CNS inflammation has a relationship with neuronal damage in other disease states.47 While CSF MCP-1 and CSF neopterin were associated with NFL in both PWH and PWOH, the association was stronger for neopterin in PWH and stronger for MCP-1 in PWOH. The reasons for this are not completely clear, but it is possible that neopterin is more specific to the neuronal damage that occurs in the HIV-infected brain. Specifically, it has been established that CSF neopterin concentrations are higher in PWH than PWOH, even among individuals with long term virologic suppression.3 In the current study, not only were CSF neopterin concentrations higher at baseline in PWH (see table 1), but they remained higher at the second visit despite ART initiation (median 9.5 nmol/l versus median 4.0 nmol/l, p<0.001). Neopterin is produced by activated cells of the monocyte lineage, which are the resident immune cells of the CNS and the main potential HIV reservoir in the CNS. Activation of microglia (a cell of the monocyte lineage) has also been shown to be elevated in PWH despite effective ART.48 Activated immune cells of the CNS, particularly microglia, are known to drive neurodegeneration.49 Taken together, these factors may explain why neopterin appears to be more strongly associated with neuronal damage in PWH. MCP-1, in contrast, is a chemokine involved in monocyte chemotaxis, but it does not necessarily reflect monocyte activation in the same way that neopterin does. Large studies of PWH on suppressive ART have found no differences in blood MCP-1 concentrations compared to PWOH.50 In contrast to neopterin, CSF MCP-1 concentrations were not significantly different between PWH and PWOH at the second visit in our study (p=0.07). This may stem from the fact that a broader array of cells can produce MCP-1, including astrocytes and endothelial cells.51 Monocyte activation is much more substantial in PWH than in PWOH since no CNS pathogen is driving an immune response in PWOH. PWOH therefore likely have fewer monocyte-derived macrophages – and therefore less neopterin – in the CNS than PWH, but their astrocytes and endothelial cells (and other cell types) still produce MCP-1. Our findings are consistent with this difference between PWH and PWOH: neopterin is more strongly associated with NFL in PWH but MCP-1 is more strongly associated with NFL in PWOH, even though the latter may occur at a subclinical level.
We acknowledge that the significance of this finding in relatively healthy PWOH is not clear. The primary aim of the manuscript was to compare changes in body fluid biomarkers over time in PWH to changes in PWOH. As such, we selected PWOH for being cognitively asymptomatic and for having stored biospecimens available for assay. Even though we did not select them to have undergone neuropsychological testing, 40 of the 55 PWOH (72.7%) had testing at the first visit and 34 (61.8%) at the second visit. Considering these limitations, we did not include these neuropsychological data in this biomarker-focused manuscript. It is possible that the relationship between inflammation and neuronal damage occurs at a sub-clinical level in disease free individuals and progresses to clinical disease over time. A larger prospective study would be needed to determine this.
In a seeming contradiction, we observed that higher MCP-1 in plasma was associated with lower CSF NFL in PWH. This apparent paradox could occur since chemokines attract cells, such as monocytes, along a gradient of increasing concentrations toward the site of production.52,53 While this happens on a cellular level, a large or persistent gradient that is sufficient to cause a pathologic degree of monocyte migration into the CNS could be reflected by higher concentrations of a chemokine like MCP-1 in CSF and lower concentrations in blood, as seen in our analyses.
We acknowledge other limitations of our study. PWH at baseline were not taking ART, and therefore these baseline data may not be generalizable to PWH on long term ART. The CD4+ count at baseline was low, which may not be generalizable to PWH who are started on ART early in the HIV disease course. However, it should be noted that both late presentation to care and lack of virologic control are still common in parts of the world (including the southeastern United States),13 and this explains the profile of the cohort we enrolled for this study. PWH and PWOH differed in some demographic characteristics (including age and race/ethnicity). Though the biomarker levels were different between the two groups even when accounting for these differences, the groups would ideally be fully matched. While the NP testing battery in this study covered multiple domains, the analysis did not include an assessment of functional impairment, which is also needed to diagnose HAND.54 We also acknowledge that the PWH group at the second visit was smaller, which reduced power. Despite this, the current study supports the hypothesis that monocyte-associated CNS inflammation plays an important role in HIV (and possibly in healthy PWOH). More research is needed to further define this inflammation and to determine if targeted therapies may be indicated.
Supplementary Material
Acknowledgments
Study sponsorship:
National Institutes of Health R21 MH085610 (Principal Investigator: S. Letendre), R01 MH058076 (Principal Investigator: R. Ellis), R01 MH107345 (Co-Principal Investigators: R. Heaton, S. Letendre), K23 MH095679, R21 MH118092, R01 AG062387 (Principal Investigator: A. Anderson), and K24 MH097673 (Principal Investigator: S. Letendre).
The study was also supported by the Emory Center for AIDS Research (NIH P30AI050409) The study was also supported by grants from the Swedish and European Research Councils, Swedish State Support for Clinical Research (ALFGBG), the Knut and Alice Wallenberg Foundation, the Torsten Soderberg Foundation, P30AI050409 (Emory Center for AIDS Research), the Swedish Research Council (#2017-00915), the Swedish Alzheimer Foundation (#AF-742881), Hjarnfonden, Sweden (#FO2017-0243), and a grant (#ALFGBG-715986 and #ALFGBG-717531) from the Swedish state under the agreement between the Swedish government and the County Councils, the ALF-agreement.
source of funding
K Blennow has served as a consultant or at advisory boards for Axon, Biogen, CogRx, Lilly, MagQu, Novartis and Roche Diagnostics, and is a co-founder of Brain Biomarker Solutions in Gothenburg AB, a GU Venture-based platform company at the University of Gothenburg, all unrelated to the work presented in this paper.
Footnotes
Conflicts of interest
A Anderson reports no conflicts
J Jang reports no conflicts
K Easley reports no conflicts
D Fuchs reports no conflicts
M Gisslen reports no conflicts
H Zetterberg reports no conflicts
R Ellis reports no conflicts
D Franklin reports no conflicts
R Heaton reports no conflicts
I Grant reports no conflicts
S Letendre reports no conflicts
References
- 1.Lifson AR, Grund B, Gardner EM, et al. Improved quality of life with immediate versus deferred initiation of antiretroviral therapy in early asymptomatic HIV infection. Aids 2017;31:953–63. [DOI] [PMC free article] [PubMed] [Google Scholar]
- 2.Neuhaus J, Jacobs DR Jr., Baker JV, et al. Markers of inflammation, coagulation, and renal function are elevated in adults with HIV infection. The Journal of infectious diseases 2010;201:1788–95. [DOI] [PMC free article] [PubMed] [Google Scholar]
- 3.Ulfhammer G, Eden A, Mellgren A, et al. Persistent central nervous system immune activation following more than 10 years of effective HIV antiretroviral treatment. Aids 2018;32:2171–8. [DOI] [PubMed] [Google Scholar]
- 4.Duprez DA, Neuhaus J, Kuller LH, et al. Inflammation, coagulation and cardiovascular disease in HIV-infected individuals. PloS one 2012;7:e44454. [DOI] [PMC free article] [PubMed] [Google Scholar]
- 5.Tibuakuu M, Fashanu OE, Zhao D, et al. GlycA, a novel inflammatory marker, is associated with subclinical coronary disease. Aids 2019;33:547–57. [DOI] [PMC free article] [PubMed] [Google Scholar]
- 6.Zayyad Z, Spudich S. Neuropathogenesis of HIV: from initial neuroinvasion to HIV-associated neurocognitive disorder (HAND). Current HIV/AIDS reports 2015;12:16–24. [DOI] [PMC free article] [PubMed] [Google Scholar]
- 7.Heaton RK, Clifford DB, Franklin DR Jr., et al. HIV-associated neurocognitive disorders persist in the era of potent antiretroviral therapy: CHARTER Study. Neurology 2010;75:2087–96. [DOI] [PMC free article] [PubMed] [Google Scholar]
- 8.Schmitt FA, Bigley JW, McKinnis R, Logue PE, Evans RW, Drucker JL. Neuropsychological outcome of zidovudine (AZT) treatment of patients with AIDS and AIDS-related complex. The New England journal of medicine 1988;319:1573–8. [DOI] [PubMed] [Google Scholar]
- 9.Robertson KR, Robertson WT, Ford S, et al. Highly active antiretroviral therapy improves neurocognitive functioning. Journal of acquired immune deficiency syndromes 2004;36:562–6. [DOI] [PubMed] [Google Scholar]
- 10.Anderson AM, Easley KA, Kasher N, et al. Neurofilament light chain in blood is negatively associated with neuropsychological performance in HIV-infected adults and declines with initiation of antiretroviral therapy. Journal of neurovirology 2018;24:695–701. [DOI] [PMC free article] [PubMed] [Google Scholar]
- 11.Yilmaz A, Blennow K, Hagberg L, et al. Neurofilament light chain protein as a marker of neuronal injury: review of its use in HIV-1 infection and reference values for HIV-negative controls. Expert Rev Mol Diagn 2017;17:761–70. [DOI] [PubMed] [Google Scholar]
- 12.Mellgren A, Price RW, Hagberg L, Rosengren L, Brew BJ, Gisslen M. Antiretroviral treatment reduces increased CSF neurofilament protein (NFL) in HIV-1 infection. Neurology 2007;69:1536–41. [DOI] [PubMed] [Google Scholar]
- 13.Colasanti JA, Armstrong WS. Challenges of reaching 90-90-90 in the Southern United States. Current opinion in HIV and AIDS 2019;14:471–80. [DOI] [PubMed] [Google Scholar]
- 14.Fomundam HN, Tesfay AR, Mushipe SA, et al. Prevalence and predictors of late presentation for HIV care in South Africa. S Afr Med J 2017;107:1058–64. [DOI] [PMC free article] [PubMed] [Google Scholar]
- 15.Komninakis SV, Mota ML, Hunter JR, Diaz RS. Late Presentation HIV/AIDS Is Still a Challenge in Brazil and Worldwide. AIDS Res Hum Retroviruses 2018;34:129–31. [DOI] [PubMed] [Google Scholar]
- 16.Dinarello CA. Anti-inflammatory Agents: Present and Future. Cell 2010;140:935–50. [DOI] [PMC free article] [PubMed] [Google Scholar]
- 17.Tarnaris A, Toma AK, Chapman MD, et al. The longitudinal profile of CSF markers during external lumbar drainage. J Neurol Neurosurg Psychiatry 2009;80:1130–3. [DOI] [PubMed] [Google Scholar]
- 18.Brenchley JM, Price DA, Schacker TW, et al. Microbial translocation is a cause of systemic immune activation in chronic HIV infection. Nature medicine 2006;12:1365–71. [DOI] [PubMed] [Google Scholar]
- 19.Dhillon NK, Williams R, Callen S, Zien C, Narayan O, Buch S. Roles of MCP-1 in development of HIV-dementia. Front Biosci 2008;13:3913–8. [DOI] [PMC free article] [PubMed] [Google Scholar]
- 20.Gendelman HE, Zheng J, Coulter CL, et al. Suppression of inflammatory neurotoxins by highly active antiretroviral therapy in human immunodeficiency virus-associated dementia. The Journal of infectious diseases 1998;178:1000–7. [DOI] [PubMed] [Google Scholar]
- 21.Hagberg L, Cinque P, Gisslen M, et al. Cerebrospinal fluid neopterin: an informative biomarker of central nervous system immune activation in HIV-1 infection. AIDS research and therapy 2010;7:15. [DOI] [PMC free article] [PubMed] [Google Scholar]
- 22.Marcotte TD, Deutsch R, Michael BD, et al. A Concise Panel of Biomarkers Identifies Neurocognitive Functioning Changes in HIV-Infected Individuals. Journal of neuroimmune pharmacology : the official journal of the Society on NeuroImmune Pharmacology 2013. [DOI] [PMC free article] [PubMed] [Google Scholar]
- 23.McArthur JC, Hoover DR, Bacellar H, et al. Dementia in AIDS patients: incidence and risk factors. Multicenter AIDS Cohort Study. Neurology 1993;43:2245–52. [DOI] [PubMed] [Google Scholar]
- 24.Quasney MW, Zhang Q, Sargent S, Mynatt M, Glass J, McArthur J. Increased frequency of the tumor necrosis factor-alpha-308 A allele in adults with human immunodeficiency virus dementia. Annals of neurology 2001;50:157–62. [PubMed] [Google Scholar]
- 25.Chen X, Hu Y, Cao Z, Liu Q, Cheng Y. Cerebrospinal Fluid Inflammatory Cytokine Aberrations in Alzheimer’s Disease, Parkinson’s Disease and Amyotrophic Lateral Sclerosis: A Systematic Review and Meta-Analysis. Front Immunol 2018;9:2122. [DOI] [PMC free article] [PubMed] [Google Scholar]
- 26.Fominykh V, Brylev L, Gaskin V, et al. Neuronal damage and neuroinflammation markers in patients with autoimmune encephalitis and multiple sclerosis. Metab Brain Dis 2019. [DOI] [PubMed] [Google Scholar]
- 27.Gille B, De Schaepdryver M, Dedeene L, et al. Inflammatory markers in cerebrospinal fluid: independent prognostic biomarkers in amyotrophic lateral sclerosis? J Neurol Neurosurg Psychiatry 2019. [DOI] [PubMed] [Google Scholar]
- 28.Jeppsson A, Wikkelso C, Blennow K, et al. CSF biomarkers distinguish idiopathic normal pressure hydrocephalus from its mimics. J Neurol Neurosurg Psychiatry 2019. [DOI] [PMC free article] [PubMed] [Google Scholar]
- 29.Mathiesen T, Fuchs D, Wachter H, von Holst H. Increased CSF neopterin levels in subarachnoid hemorrhage. J Neurosurg 1990;73:69–71. [DOI] [PubMed] [Google Scholar]
- 30.Prasad R, Kapoor R, Srivastava R, Mishra OP, Singh TB. Cerebrospinal fluid TNF-alpha, IL-6, and IL-8 in children with bacterial meningitis. Pediatr Neurol 2014;50:60–5. [DOI] [PubMed] [Google Scholar]
- 31.Starhof C, Winge K, Heegaard NHH, Skogstrand K, Friis S, Hejl A. Cerebrospinal fluid pro-inflammatory cytokines differentiate parkinsonian syndromes. J Neuroinflammation 2018;15:305. [DOI] [PMC free article] [PubMed] [Google Scholar]
- 32.Gisslen M, Hagberg L, Brew BJ, Cinque P, Price RW, Rosengren L. Elevated cerebrospinal fluid neurofilament light protein concentrations predict the development of AIDS dementia complex. The Journal of infectious diseases 2007;195:1774–8. [DOI] [PubMed] [Google Scholar]
- 33.Zetterberg H, Skillback T, Mattsson N, et al. Association of Cerebrospinal Fluid Neurofilament Light Concentration With Alzheimer Disease Progression. JAMA neurology 2016;73:60–7. [DOI] [PMC free article] [PubMed] [Google Scholar]
- 34.Jessen Krut J, Mellberg T, Price RW, et al. Biomarker evidence of axonal injury in neuroasymptomatic HIV-1 patients. PloS one 2014;9:e88591. [DOI] [PMC free article] [PubMed] [Google Scholar]
- 35.WorldHealthOrganization. Composite International Diagnostic Interview, Version 2.1. 1997.
- 36.Robertson K, Yosief S. Neurocognitive assessment in the diagnosis of HIV-associated neurocognitive disorders. Seminars in neurology 2014;34:21–6. [DOI] [PubMed] [Google Scholar]
- 37.Cysique LA, Franklin D Jr., Abramson I, et al. Normative data and validation of a regression based summary score for assessing meaningful neuropsychological change. Journal of clinical and experimental neuropsychology 2011;33:505–22. [DOI] [PMC free article] [PubMed] [Google Scholar]
- 38.Hoeting JM D; Raftery A; Volinsky C Bayesian Model Averaging: A Tutorial. Statistical Science 1999;14:382–417. [Google Scholar]
- 39.Lleo A, Alcolea D, Martinez-Lage P, et al. Longitudinal cerebrospinal fluid biomarker trajectories along the Alzheimer’s disease continuum in the BIOMARKAPD study. Alzheimers Dement 2019;15:742–53. [DOI] [PubMed] [Google Scholar]
- 40.Eden A, Price RW, Spudich S, Fuchs D, Hagberg L, Gisslen M. Immune activation of the central nervous system is still present after >4 years of effective highly active antiretroviral therapy. The Journal of infectious diseases 2007;196:1779–83. [DOI] [PubMed] [Google Scholar]
- 41.Abdulle S, Mellgren A, Brew BJ, et al. CSF neurofilament protein (NFL) -- a marker of active HIV-related neurodegeneration. J Neurol 2007;254:1026–32. [DOI] [PubMed] [Google Scholar]
- 42.Krebs SJ, Slike BM, Sithinamsuwan P, et al. Sex differences in soluble markers vary before and after the initiation of antiretroviral therapy in chronically HIV-infected individuals. Aids 2016;30:1533–42. [DOI] [PMC free article] [PubMed] [Google Scholar]
- 43.Cinque P, Vago L, Mengozzi M, et al. Elevated cerebrospinal fluid levels of monocyte chemotactic protein-1 correlate with HIV-1 encephalitis and local viral replication. Aids 1998;12:1327–32. [DOI] [PubMed] [Google Scholar]
- 44.Kelder W, McArthur JC, Nance-Sproson T, McClernon D, Griffin DE. Beta-chemokines MCP-1 and RANTES are selectively increased in cerebrospinal fluid of patients with human immunodeficiency virus-associated dementia. Annals of neurology 1998;44:831–5. [DOI] [PubMed] [Google Scholar]
- 45.Lyons JL, Uno H, Ancuta P, et al. Plasma sCD14 is a biomarker associated with impaired neurocognitive test performance in attention and learning domains in HIV infection. Journal of acquired immune deficiency syndromes 2011;57:371–9. [DOI] [PMC free article] [PubMed] [Google Scholar]
- 46.Hermansson L, Yilmaz A, Axelsson M, et al. Cerebrospinal fluid levels of glial marker YKL-40 strongly associated with axonal injury in HIV infection. J Neuroinflammation 2019;16:16. [DOI] [PMC free article] [PubMed] [Google Scholar]
- 47.Varvel NH, Neher JJ, Bosch A, et al. Infiltrating monocytes promote brain inflammation and exacerbate neuronal damage after status epilepticus. Proceedings of the National Academy of Sciences of the United States of America 2016;113:E5665–74. [DOI] [PMC free article] [PubMed] [Google Scholar]
- 48.Vera JH, Garvey LJ, Allsop JM, et al. Alterations in cerebrospinal fluid chemokines are associated with maraviroc exposure and in vivo metabolites measurable by magnetic resonance spectroscopy. HIV clinical trials 2012;13:222–7. [DOI] [PubMed] [Google Scholar]
- 49.Lull ME, Block ML. Microglial activation and chronic neurodegeneration. Neurotherapeutics : the journal of the American Society for Experimental NeuroTherapeutics 2010;7:354–65. [DOI] [PMC free article] [PubMed] [Google Scholar]
- 50.Wada NI, Jacobson LP, Margolick JB, et al. The effect of HAART-induced HIV suppression on circulating markers of inflammation and immune activation. Aids 2015;29:463–71. [DOI] [PMC free article] [PubMed] [Google Scholar]
- 51.Bozzelli PL, Yin T, Avdoshina V, Mocchetti I, Conant KE, Maguire-Zeiss KA. HIV-1 Tat promotes astrocytic release of CCL2 through MMP/PAR-1 signaling. Glia 2019;67:1719–29. [DOI] [PMC free article] [PubMed] [Google Scholar]
- 52.Eugenin EA, Berman JW. Chemokine-dependent mechanisms of leukocyte trafficking across a model of the blood-brain barrier. Methods 2003;29:351–61. [DOI] [PubMed] [Google Scholar]
- 53.Gendelman HE, Ding S, Gong N, et al. Monocyte chemotactic protein-1 regulates voltage-gated K+ channels and macrophage transmigration. Journal of neuroimmune pharmacology : the official journal of the Society on NeuroImmune Pharmacology 2009;4:47–59. [DOI] [PMC free article] [PubMed] [Google Scholar]
- 54.Antinori A, Arendt G, Becker JT, et al. Updated research nosology for HIV-associated neurocognitive disorders. Neurology 2007;69:1789–99. [DOI] [PMC free article] [PubMed] [Google Scholar]
Associated Data
This section collects any data citations, data availability statements, or supplementary materials included in this article.