

ABSTRACT
CREG1 is a small glycoprotein which has been proposed as a transcription repressor, a secretory ligand, a lysosomal, or a mitochondrial protein. This is largely because of lack of antibodies for immunolocalization validated through gain- and loss-of-function studies. In the present study, we demonstrate, using antibodies validated for immunofluorescence microscopy, that CREG1 is mainly localized to the endosomal-lysosomal compartment. Gain- and loss-of-function analyses reveal an important role for CREG1 in both macropinocytosis and clathrin-dependent endocytosis. CREG1 also promotes acidification of the endosomal-lysosomal compartment and increases lysosomal biogenesis. Functionally, overexpression of CREG1 enhances macroautophagy/autophagy and lysosome-mediated degradation, whereas knockdown or knockout of CREG1 has opposite effects. The function of CREG1 in lysosomal biogenesis is likely attributable to enhanced endocytic trafficking. Our results demonstrate that CREG1 is an endosomal-lysosomal protein implicated in endocytic trafficking and lysosomal biogenesis.
Abbreviations: AIFM1/AIF: apoptosis inducing factor mitochondria associated 1; AO: acridine orange; ATP6V1H: ATPase H+ transporting V1 subunit H; CALR: calreticulin; CREG: cellular repressor of E1A stimulated genes; CTSC: cathepsin C; CTSD: cathepsin D; EBAG9/RCAS1: estrogen receptor binding site associated antigen 9; EIPA: 5-(N-ethyl-N-isopropyl)amiloride; ER: endoplasmic reticulum; GFP: green fluorescent protein; HEXA: hexosaminidase subunit alpha; IGF2R: insulin like growth factor 2 receptor; LAMP1: lysosomal associated membrane protein 1; M6PR: mannose-6-phosphate receptor, cation dependent; MAPK1/ERK2: mitogen-activated protein kinase 1; MTORC1: mechanistic target of rapamycin kinase complex 1; PDIA2: protein disulfide isomerase family A member 2; SQSTM1/p62: sequestosome 1; TF: transferrin; TFEB: transcription factor EB
KEYWORDS: Autophagy, endocytosis, gene targeting, hepatocytes, immunofluorescence
Introduction
CREG (Cellular repressor of E1A stimulated genes) was cloned in yeast two-hybrid screening of a Drosophila cDNA library [1]. It was initially described as a transcription repressor that antagonized the transcription and cellular transformation induced by the adenovirus E1A oncoprotein. Later CREG was found to be a glycoprotein that could be secreted into cell culture media [2]. Two paralogs have been identified in the CREG family, CREG1 and CREG2 [3]. CREG1 mRNA is ubiquitously expressed while CREG2 was only detected in the brain [2]. CREG1 has a signal peptide (amino acids 1–31 in human and mice, 1–23 in Drosophila) and one or more N-glycosylation sites (three in human, N160, N193, and N216; two in mice, N160 and N216; and one in Drosophila, N87) [2,4]. It is modified by N-glycosylation and the cleavage of the signal peptide and a portion of the N terminus after translation [5]. Cell culture studies demonstrated that overexpression of CREG1 inhibited cell proliferation and induced differentiation [2,6,7]. CREG1 has also been suggested as cooperative with CDKN2A/p16ink4a to promote senescence of fibroblasts isolated from patients with cancer-predisposing Li-Fraumeni syndrome [8]. More recently, overexpression of CREG1 in C3H10T1/2 cells was shown to induce brown adipogenesis [9]. However, the mechanisms underlying these biological activities are unknown.
Despite the efforts to understand its biological activities, CREG1 localization remains controversial. Immunofluorescence staining with anti-CREG1 antisera made in house detected CREG1 in the perinuclear region in a pattern similar to endoplasmic reticulum (ER) and Golgi distributions when overexpressed in HeLa cells [2]. By transfection of fibroblasts with CREG1 fused with GFP at its C terminus, Schahs et al. showed that CREG1-GFP colocalized with the lysosomal enzyme CTSD (cathepsin D) [5]. Similarly, exogenously expressed Drosophila CREG-GFP was also detected in lysosomes in S2 cells [4]. Recently, CREG1 was shown to partially colocalize with mitochondrial UCP1 (uncoupling protein 1) [10]. In addition, CREG1 could be detected in conditioned media, serum, and urine [2,11–13]. Therefore, it has been suggested as a secretory protein.
Morphological evidence for CREG1 localization in lysosomes is supported by mass spectrometric analysis of lysosomal proteins. Carbohydrate chains in a majority of soluble lysosomal proteins consist of the mannose 6-phosphate (M6P) tag, which is recognized by M6P receptors [14]. There are two such receptors, the 46-kD cation-dependent M6PR (mannose-6-phosphate receptor, cation dependent) and the 300-kD cation-independent IGF2R (insulin like growth factor 2 receptor). CREG1 binds to IGF2R in far-western blot analysis [15]. Journet et al. used IGF2R affinity purification and mass spectrometry to identify CREG1 from conditioned media of human monocytic U937 cells, which were induced to secrete lysosomal proteins by NH4Cl [16,17]. Proteomic analysis of lysosomes isolated from the mouse liver suggested CREG1 to be a lysosomal protein [18].
Macroautophagy/autophagy is an evolutionarily conserved lysosome pathway that degrades cytoplasmic components and organelles [19]. It is critical for embryonic development and normal physiology, and its dysregulation is associated with various diseases, including neurodegeneration, diabetes, and cancer. However, the role of CREG1 in autophagy is poorly understood. In this study, we validated CREG1 antibodies for immunostaining and demonstrate that CREG1 is localized to the endosomal-lysosomal compartment. Gain- and loss-of-function analyses reveal that CREG1 promotes lysosomal biogenesis, acidification, and degradation, thereby accelerating autophagic flux. These effects are likely mediated by enhanced endocytic trafficking.
Results
CREG1 is an endosomal-lysosomal protein highly expressed in the liver, lung, fat, and immune organs/cells
Creg1 mRNA was shown to be ubiquitously expressed in adult mouse tissues with the highest expression level detected in the liver [2]. To determine CREG1 protein expression in mouse tissues, we performed immunoblot analysis on tissue lysates as well as leukocytes. The CREG1 protein was highly expressed in the spleen, liver, lung, and white adipose tissues as well as leukocytes and bone marrow (Figure 1A). In these tissues, CREG1 was mainly detected as a ~ 22 kDa band. However, in the heart the major band is ~17 kDa. Previous studies showed that CREG1 was localized to the ER, lysosome, or mitochondria using house made or uncharacterized, commercially available antibodies [2,5,10]. To screen for CREG1 antibodies suitable for immunostaining, we employed LO2 human hepatocytes, which express relatively low level of endogenous CREG1 and are easy to transfect using cationic lipid transfection reagents. LO2 cells have been re-cloned in our laboratory based on a cobblestone epithelial morphology and higher expression levels of mRNAs for ALB (albumin), F10 (coagulation factor X), and HNF4A (hepatic nuclear factor 4 alpha) (Figure S1). We transfected the re-cloned hepatocytes (clone 19) with C-terminally MYC-tagged human CREG1. Ten days after transfection, mixed populations containing both transfected and untransfected cells were co-immunostained for MYC-tag and CREG1. Among the 13 CREG1 antibodies tested, monoclonal antibody 30R was able to detected MYC-tag-positive cells (Figure 1B). Surprisingly, the MYC-tag mainly colocalized with the ER marker CALR (calreticulin) in the transfected cells, whereas the 30R epitope mainly colocalized with the lysosomal marker LAMP1 (Person’s coefficient = 0.83 ± 0.07, Overlap coefficient = 0.91 ± 0.03, n = 15), the late endosomal marker RAB7 (Person’s coefficient = 0.87 ± 0.05, Overlap coefficient = 0.96 ± 0.02, n = 15), and the early endosomal marker RAB5 (Person’s coefficient = 0.85 ± 0.04, Overlap coefficient = 0.95 ± 0.01, n = 15). There was slight colocalization of the 30R epitope with the Golgi marker EBAG9/RCAS1 (estrogen receptor binding site associated antigen 9) and no overlap with the mitochondrial marker AIFM1 (apoptosis inducing factor mitochondria associated 1). These results suggest that overexpressed, C-terminally MYC-tagged CREG1 mainly resides in ER where it is synthesized. As it exits from the ER and is trafficked to endosomes and lysosomes, the MYC-tag is likely to be cleaved. This notion is supported by immunoblot analysis of the cells stably transfected with CREG1-MYC, which demonstrated cleavage of the MYC-tag and the N-terminal signal peptide (Figure 1C) as detected with antibodies against the MYC-tag, the CREG1 N terminus (Abcam, ab59719), or the C-terminal region (ab191909). The 30R epitope was not detected in the ER by immunostaining but present in MYC-tagged CREG1 by immunoblotting, as it was likely being masked by CREG1 carbohydrate chains or its interacting proteins in the ER.
Figure 1.
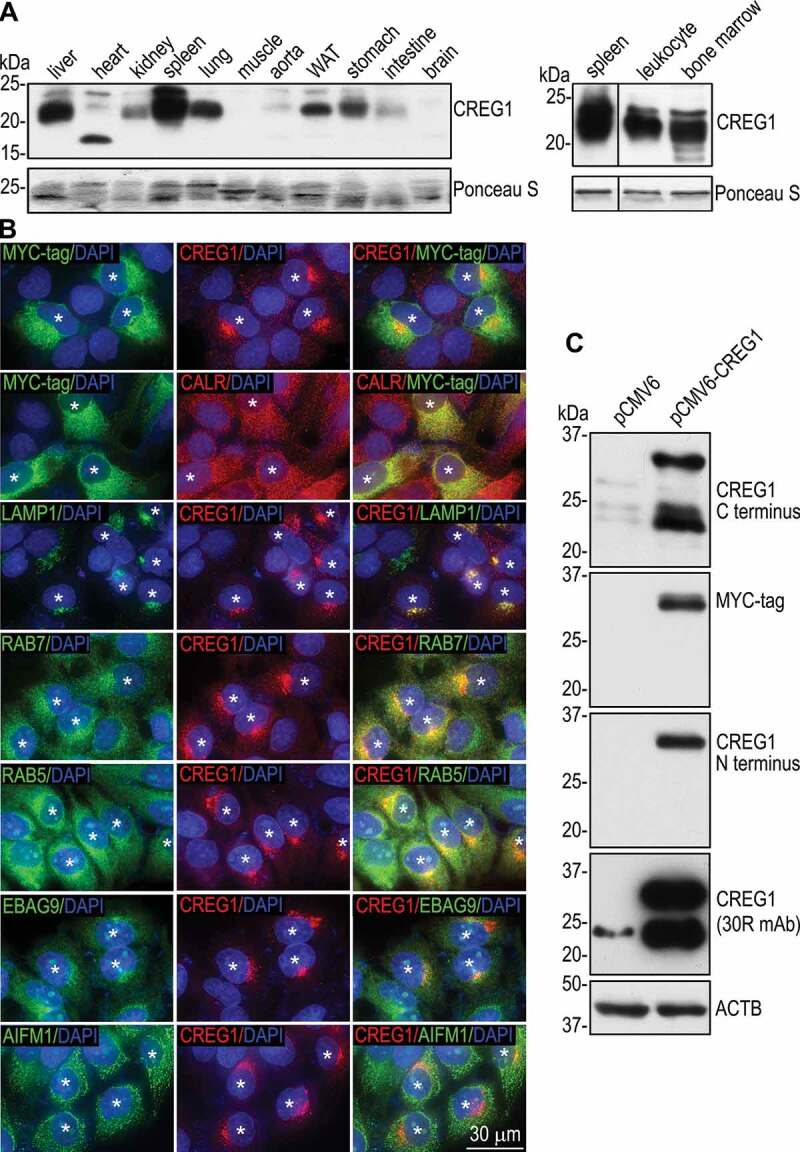
CREG1 is localized at the endosomal-lysosomal compartment. (A) Tissues were isolated from C57BL/6J mice and analyzed by immunoblotting for CREG1. Ponceau S staining for proteins on PVDF membranes revealed protein loading for each lane. WAT: white adipose tissue. The spleen lane in the right panel was cropped from the same blot as those of leukocyte and bone marrow and separated with a black line. In the right panel, protein samples that slightly migrated into separating gels were transferred to PVDF membranes, stained with Ponceau S, and served as loading controls. (B) LO2 human hepatocytes were transfected with C-terminally MYC-tagged human CREG1 cDNA in the pCMV6 vector. Ten-days after transfection, cultures containing both transfected and untransfected cells were immunostained with antibodies to MYC-tag, human CREG1, and markers for subcellular organelles. The nucleus was counterstained with DAPI. Asterisk symbols indicate the transfected cells. (C) LO2 cells stably transfected with pCMV6-CREG1 or pCMV6 alone were subjected to immunoblotting using antibodies against the C-terminal region of CREG1 (ab191909), MYC-tag, the CREG1 N-terminal region (ab59719), and the 30R epitope (sc-100,695). ACTB/β-actin served as a loading control
To verify the findings in LO2 cells, we also transfected HEK293 cells, which are easy to transfect and contain abundant lysosomes, with C-terminally MYC-tagged human CREG1. Similarly, the MYC-tag was mainly detected in the ER, whereas the CREG1 30R epitope was associated with the lysosome (Figure S2). There was no overlapping staining between CREG1 and markers for the Golgi and mitochondria. When N-terminally MYC-tagged wild-type CREG1 was introduced into HEK293 cells, it was detected as a single band of 34 kDa with CREG1 antibody and was also targeted to the lysosome as well as evidenced by colocalization with LAMP1 (Figures S3A and B). On the contrary, N-terminally MYC-tagged CREG1 with mutations of the 3 N-glycosylation sites to alanine (N160A/N193A/N216A), which is 24 kDa, was mainly detected in the ER using both MYC-tag and CREG1 30R antibodies (Figures S3A and C). In some cells, CREG1 was detected as large inclusion bodies in dilated lysosomes. These results suggest that N-glycosylation, rather than cleavage of the signal peptide, is required for CREG1 trafficking from the ER to the endosomal-lysosomal compartment.
We also stably overexpressed a CREG1-GFP fusion protein in LO2 cells. Live cell imaging demonstrated that the CREG1-GFP fusion protein colocalized with neither LysoTracker nor MitoTracker (Figure S4A). This observation was confirmed by immunostaining for lysosomal LAMP1 and mitochondrial AIFM1 (Figure S4B). CREG1-GFP did not overlap with the Golgi marker GOLGA2 (golgin A2) either. Instead, it colocalized with the ER marker CALR. These results suggested that similar to C-terminally MYC-tagged CREG1, the CREG1-GFP fusion protein resides in the ER but not Golgi, lysosomes, or mitochondria. Immunoblot analysis revealed that GFP was also partly cleaved from the CREG1-GFP fusion protein (Figure S4C). The cleaved GFP is likely degraded in lysosomes under acidic conditions [20,21]. Similarly, when the CREG1-GFP fusion protein was transiently expressed in HEK293 cells, most GFP fluorescence was not detected in lysosomes or mitochondria (Figure S5A). Instead, it overlapped with CALR immunofluorescence (Figure S5B). However, strong CREG1 (the 30R epitope) expression was detected in GFP-positive cells in a lysosomal pattern. To test whether CREG1-GFP is only transiently associated with lysosomes, we performed a time-course recording of live fluorescent images. We were able to detect transient and partial colocalization of CREG1-GFP with LysoTracker Red (Figure S5C). This result supports the notion that CREG1-GFP is transported to the endosomal-lysosomal compartment with GFP subsequently cleaved off and degraded.
To rule out whether the MYC-tag and GFP affect the targeting of exogenously expressed CREG1, we stably transfected LO2 cells with pLPCX-CREG1-IRES-GFP which expresses CREG1 and GFP separately. Immunostaining of the transfected cells using the 30R monoclonal antibody detected strong punctate fluorescence clustered near the nucleus, whereas the 30R epitope level was very low in LO2 cells stably transfected with GFP alone (Figure S4D). Similar to that observed in pCMV6-CREG1-MYC transfected cells, untagged CREG1 partially colocalized with RAB5, RAB7, and LAMP1. These results suggest that the 30R monoclonal antibody detects tag-less and tag-cleaved CREG1 in the endosomal-lysosomal system.
The overexpression experiments suggest that CREG1 is mainly targeted to the endosomal-lysosomal compartment. To confirm this finding, we immunostained endogenous CREG1 in LO2 hepatocytes. As shown in Figure 2A, CREG1 largely colocalized with EEA1 (early endosomal antigen 1), RAB7, and LAMP1. There was minimal colocalization of CREG1 with ER and Golgi markers and no colocalization with mitochondrial AIFM1 (Figure S6). These results suggest that CREG1 is an endosomal-lysosomal protein.
Figure 2.
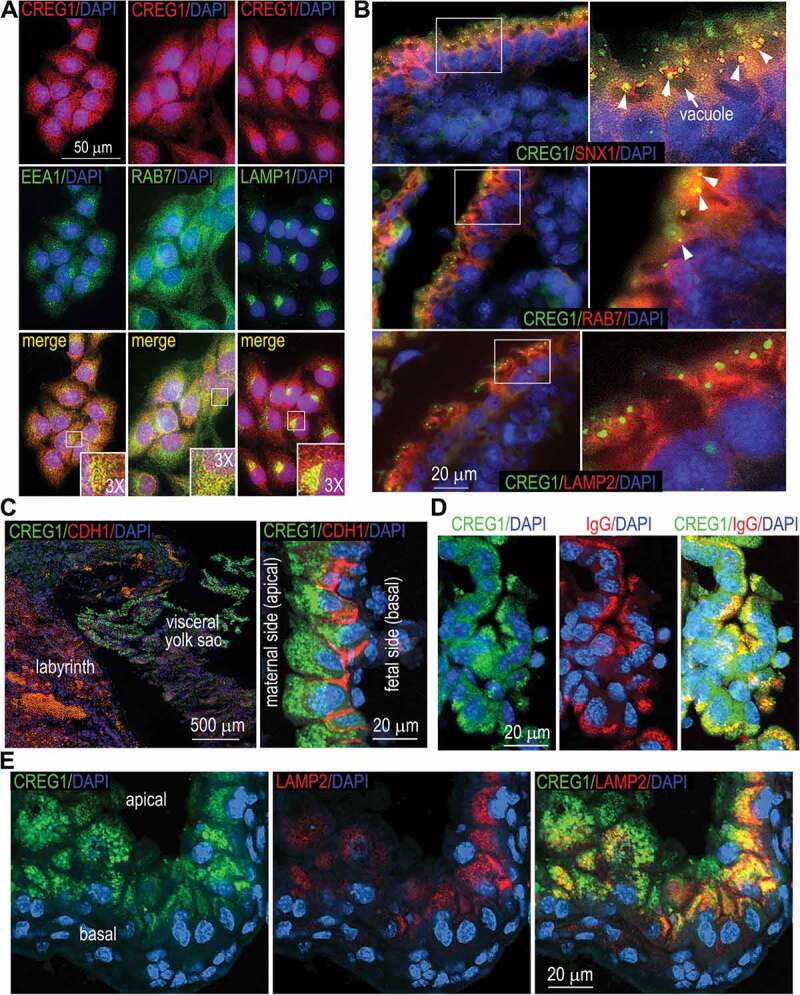
Localization of endogenous CREG1. (A) LO2 cells were coimmunostained for CREG1 and the early endosomal marker EEA1, the late endosomal marker RAB7, and LAMP1. Insets are 3× magnifications of the boxed regions. (B) E7.5 mouse embryos were coimmunostained for CREG1 and SNX1 (sorting nexin 1; an early endosome marker), RAB7, and LAMP2. The panels on the right are magnified images of the boxed regions in the images on the left. Arrowheads indicate colocalization of CREG1 with the organelle markers (in yellow). (C) E16.5 mouse embryos were coimmunostained for CREG1 and CDH1/E-cadherin (cadherin 1); the nucleus was counterstained with DAPI. The right panel is a confocal image with the optical section thickness of 0.5 µm. (D) Confocal images of coimmunostaining of E16.5 visceral yolk sac for CREG1 and immunoglobulin G (IgG). CREG1 was localized with internalized IgG on the apical side of the endoderm. (E) Confocal images show colocalization of CREG1 with the lysosomal marker LAMP2 toward the basal side of the visceral endoderm
A prior study showed that the mRNAs of Creg1 are detected as early as embryonic day 7 (E7) in mouse embryos and highly expressed at E15 and E17 stages [2]. To determine the localization of CREG1 during mouse embryonic development, we coimmunostained E7.5 mouse embryos with antibodies to CREG1 and markers of endosomal and lysosomal compartments. CREG1 was highly expressed in visceral endoderm cells in a punctate pattern. It was localized on the apical side of vacuoles, where it partially colocalized with the early endosomal marker SNX1 (sorting nexin 1) and late endosomal RAB7 (Figure 2B). CREG1 rarely colocalized with the lysosomal marker LAMP2. At late stages of visceral yolk sac development, the endosomal compartment is well developed and composed of tubular and vesicular structures [22]. CREG1 was expressed in high levels in a vesicular pattern on the apical side of endoderm cells in the E16.5 visceral yolk sac (Figure 2C). The visceral endoderm is mainly involved in nutrient uptake and degradation to provide the conceptus with amino acids and other nutrients (histotrophic nutrition) [23]. To fulfil these functions, visceral endoderm cells develop numerous, prominent vacuoles (containing lysosomal proteins) on the apical side and undergo active internalization of maternal immunoglobulins via macropinocytosis and other forms of endocytosis [24,25]. Therefore, we coimmunostained the visceral yolk sac for CREG1 and immunoglobulin G (IgG). We observed colocalization of internalized IgG with CREG1 on the apical side of endoderm cells (Figure 2D). CREG1 also colocalized with the lysosomal membrane protein LAMP2 toward the basal side of the visceral endoderm (Figure 2E). Taken together, these results suggest that CREG1 may play an important role in endocytosis as well as endosomal sorting and trafficking.
CREG1 promotes macropinocytosis, clathrin-dependent endocytosis, and endocytic trafficking
To determine whether CREG1 is involved in macropinocytosis and other forms of endocytosis in hepatocytes, LO2 cells stably transfected with either human CREG1 or the control vector were incubated with TRITIC-dextran, a widely used tracer for macropinocytosis, and Alexa Fluor 488-transferrin (TF), which is internalized by cells via clathrin-dependent endocytosis. CREG1 overexpression significantly increased the uptake of these tracers by LO2 cells (Figure 3A-D). Of note, internalized Alexa Fluor 488-TF colocalized with exogenously expressed CREG1 (Figure 3E). This suggests that CREG1 travels together with Alexa Fluor 488-TF-containing vesicles along the endocytic route. To test if CREG1 promotes endocytic trafficking, we performed a pulse-chase experiment. Internalized Alexa Fluor 488-TF was mainly detected in RAB5-positive early endosomes in LO2 cells overexpressing CREG1 after a 30-min chase period (Figure 3F). After 60 min, Alexa Fluor 488-TF largely disappeared, likely due to degradation in lysosomes. In contrast, Alexa Fluor 488-TF was detected in a sub-plasma membrane region in control cells after chasing for 30 min and reached early endosomes by 60 min. We also performed loss-of-function analysis by knocking down the expression of CREG1 in mouse AML12 hepatocytes, which express higher levels of CREG1 than LO2 cells (Figure 3G). shRNA-mediated stable depletion of CREG1 significantly reduced the internalization of FITC-labeled bovine serum albumin (a tracer for macropinocytosis) and Alexa Fluor 488-TF (Figure 3H-K). Taken together, these results suggest that CREG1 promotes macropinocytosis, clathrin-dependent endocytosis, and endocytic trafficking.
Figure 3.
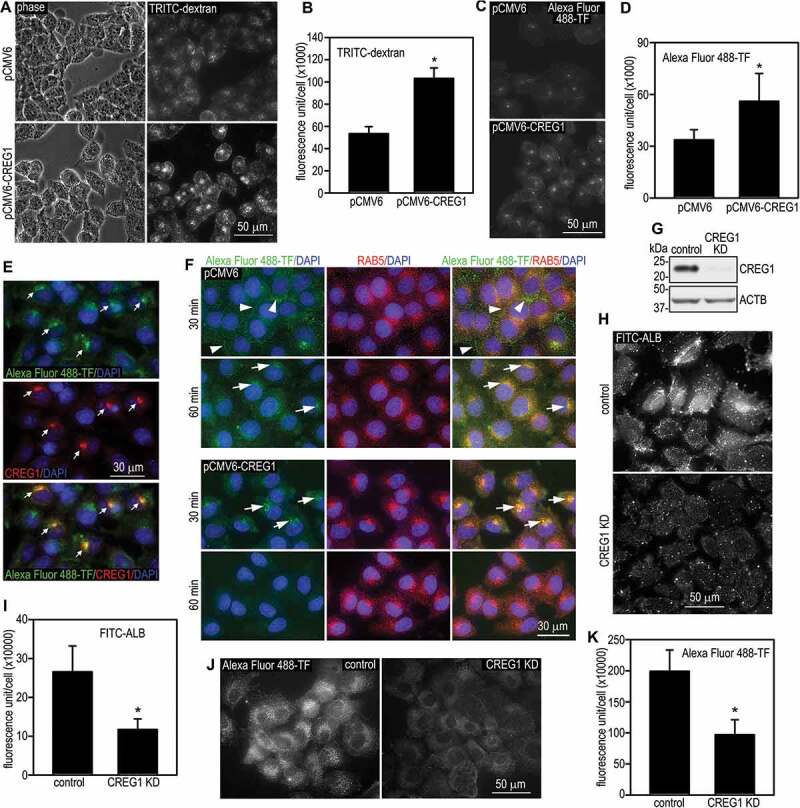
CREG1 promotes endocytic trafficking. (A) LO2 cells stably transfected with human CREG1 cDNA (pCMV6-CREG1) or the vector alone were incubated with 100 µg/ml TRITIC-dextran for 30 min. The cells were then fixed with 3% paraformaldehyde and internalized TRITIC-dextran was visualized by fluorescence microscopy. (B) Fluorescence intensity of internalized TRITIC-dextran was quantified using ImageJ software. N = 30 for each group, *P < 0.001. (C) LO2 cells stably transfected with pCMV6-CREG1 or the empty vector were incubated with 50 µg/ml Alexa Fluor 488-TF (transferrin) for 30 min. Endocytosis of Alexa Fluor 488-TF was visualized by fluorescence microscopy. (D) Fluorescence intensity of internalized Alexa Fluor 488-TF was quantified and plotted. N = 30 for each group, *P < 0.001. (E) Mixed populations of CREG1-transfected and untransfected LO2 cells were incubated with 50 µg/ml Alexa Fluor 488-TF for 30 min. Cells were fixed and stained for CREG1. Arrows indicate colocalization of CREG1 with internalized Alexa Fluor 488-TF in the transfected cells. (F) LO2 cells were incubated with 50 µg/ml Alexa Fluor 488-TF at 4°C for 15 min, washed, and chased at 37°C for 30 or 60 min. The cells were then fixed and immunostained for RAB5. Arrowheads point to the accumulation of Alexa Fluor 488-TF at a subplasma membrane region. Arrows indicate colocalization of Alexa Fluor 488-TF with RAB5. (G) AML12 mouse hepatocytes were stably transfected with control or Creg1 shRNA (CREG1 knockdown, CREG1 KD). The cells were analyzed by immunoblotting for CREG1. ACTB served as a loading control. (H) CREG1 knockdown and control cells were incubated with 200 µg/ml FITC-ALB (albumin), fixed, and photographed by fluorescence microscopy. (I) Fluorescence intensity of internalized FITC-ALB was quantified. N = 30 for each group, *P < 0.001. (J) AML12 cells were incubated with 50 µg/ml Alexa Fluor 488-TF for 30 min and photographed by fluorescence microscopy. (K) Internalized Alexa Fluor 488-TF was quantified and plotted. N = 30 for each group, *P < 0.001
CREG1 increases lysosomal biogenesis
Overexpression of CREG1 increases endocytic trafficking and colocalization of CREG1 with lysosomal markers. This suggests that CREG1 may promote lysosomal biogenesis. To test this hypothesis, we analyzed lysosomal proteins by immunoblotting. Overexpression of CREG1 in human hepatocytes increased the expression of LAMP1, ATP6V1H (ATPase H+ transporting V1 subunit H, vacuolar-ATPase H), CTSC (cathepsin C), preproCTSD, and CTSD (cathepsin D) (Figure 4A). In contrast, the level of the Golgi marker EBAG9 and the ER marker PDIA2 (protein disulfide isomerase family A member 2) was unchanged. There was also no obvious change in the level of lysosomal enzyme HEXA (hexosaminidase subunit alpha) after CREG1 overexpression. The upregulation of the lysosomal proteins is likely to occur post-transcriptionally because their mRNA transcripts were not increased (Figure 4B). Selective labeling for acidic organelles with LysoTracker showed increased fluorescence intensity in those LO2 cells that overexpressed CREG1 when compared with the vector controls (Figure 4C and 4D). The enhanced LysoTracker labeling may result from increased acidity and/or increased clustering of lysosomes. In accordance with these findings, knockdown of CREG1 in AML12 mouse hepatocytes reduced the expression of LAMP1, ATP6V1H, CTSD, and HEXA (Figure 4E). In contrast, the mRNA transcripts for these proteins were either unchanged or slightly increased (Figure 4F). Fluorescence intensity of LysoTracker labeling was also reduced in CREG1 knockdown cells compared with the cells stably transfected with the control shRNA (Figure 4G and 4H).
Figure 4.
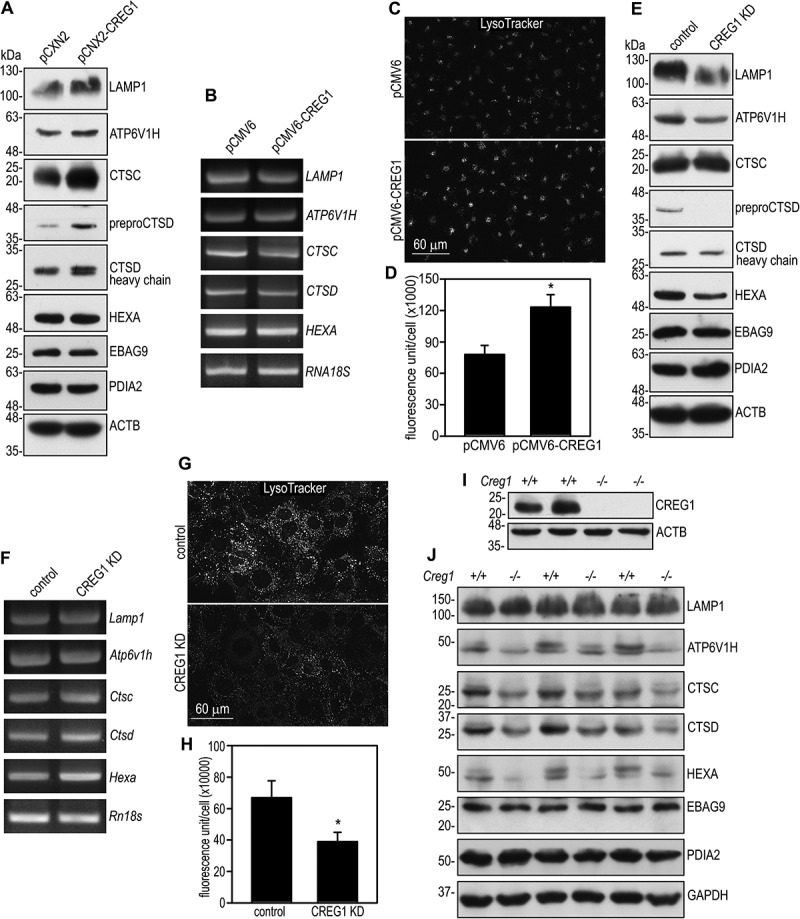
CREG1 promotes lysosomal biogenesis. (A) LO2 cells stably transfected with pCMV6-CREG1 and control cells were analyzed by immunoblotting for lysosomal proteins and markers for the endoplasmic reticulum and the Golgi apparatus. ACTB served as a loading control. (B) Lysosomal mRNA levels in LO2 cells stably transfected with pCMV6-CREG1 or pCMV6 were analyzed by RT-PCR. RNA18S rRNA served as a loading control. (C) LO2 cells were incubated with 50 nM LysoTracker for 10 min, washed with PBS, and photographed by fluorescence microscopy. (D) Fluorescence intensity was quantified and plotted. N = 30 for each group. *P < 0.001. (E) AML12 cells with stable CREG1 knockdown (KD) and control cells were subjected to immunoblot analysis. ACTB served as a loading control. (F) Lysosomal gene transcripts in CREG1 knockdown and control AML12 cells were analyzed by RT-PCR. Rn18s rRNA served as a loading control. (G) CREG1 knockdown and control AML12 cells were incubated with LysoTracker for 10 min, washed with PBS, and photographed by fluorescence microscopy. (H) Fluorescence intensity was quantified and plotted. N = 30 for each group. *P < 0.001. (I) Immunoblots show absence of CREG1 in the liver of creg1-/- mice. ACTB served as a loading control. (J) Liver tissues of Creg1+/+ and creg1-/- mice (lanes 1 and 2, 3 and 4, and 5 and 6 were samples from littermates) were analyzed by immunoblotting for lysosomal proteins. GAPDH served as a loading control
To further confirm the regulation of lysosomal biogenesis by CREG1 in vivo, we generated Creg1 floxed mice using CRISPR technology by inserting loxP sites to flank exon 1 through 3, which encode the entire open reading frame. We crossed Creg1fl/fl mice with UBC-Cre/ERT2 mice to obtain Creg1fl/fl;UBC-Cre/ERT2 mice, which were injected peritoneally with tamoxifen (150 mg/kg for 5 days) at 8 weeks of age to delete the Creg1 gene. We further bred creg1 knockout mice with wild-type C57BL/6 mice, which yield Creg1+/- mice. Intercross between the Creg1+/- mice produced creg1-/- mice in numbers slightly reduced from the values predicted by Mendelian principles. We examined the expression of lysosomal proteins in the liver of creg1-/- mice. As shown in Figure 4I and 4J, ablation of Creg1 reduced the expression of ATP6V1H, CTSC, CTSD, and HEXA. Unlike that observed in cultured CREG1 knockdown hepatocytes, LAMP1 expression was not markedly changed in creg1 knockout livers. Taken together, gain- and loss-of-function analyses suggest that CREG1 plays an important role in lysosomal biogenesis.
CREG1 facilitates acidification of the endosomal-lysosomal compartment
Acidification of endosomes is essential for the dissociation of internalized ligand-receptor complexes and the recycling of the receptors back to the plasma membrane [26]. It is also required for the separation of soluble lysosomal proteins from M6P receptors and their subsequent delivery to the lysosome. The pH of the lysosomal lumen is approximately 5, which is optimal for the enzymatic activity of lysosomal hydrolases. Overexpression of CREG1 increases the expression of the vacuolar-type ATPase, which pumps protons across the lysosome membrane to acidify the endosomal-lysosomal compartment and other organelles. We labeled intracellular acidic organelles with acridine orange (AO) and LysoSensor in live cells [27]. AO emits fluorescence in a pH-dependent fashion at low concentrations. Similarly, unlike the LysoTracker reagent, LysoSensor exhibits a pH-dependent increase in fluorescence intensity upon acidification. Incubation of LO2 cells with 5 µg/ml AO for 10 min readily labeled perinuclear vesicular compartments, which are similar to the distribution of late endosomes and lysosomes (Figure 5A). Overexpression of CREG1 significantly increased AO fluorescence intensity (Figure 5B). LysoSensor fluorescence was slightly diffused compared with the AO distributions in the control cells (Figure 5C). Overexpression of CREG1 not only increased the fluorescence intensity of LysoSensor, but also promoted the clustering of the fluorescence-labeled vesicles (Figure 5C and 5D). In line with the gain-of-function analysis, shRNA-mediated depletion of CREG1 in mouse hepatocytes reduced the fluorescence intensity of AO- and LysoSensor-labeled vesicles (Figure 5E-H). These results suggest that CREG1 promotes acidification of the endosomal-lysosomal compartment.
Figure 5.
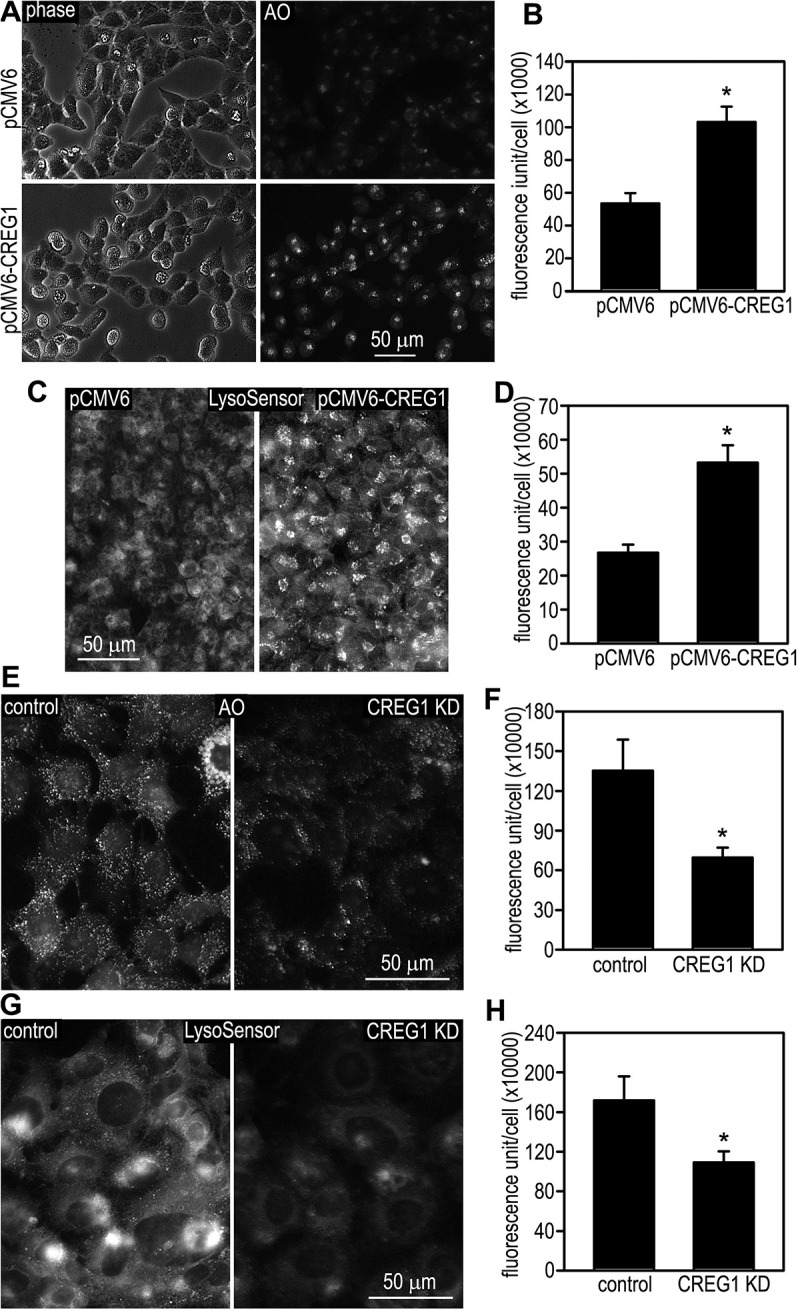
CREG1 promotes acidification of the endosomal-lysosomal compartment. (A) LO2 cells stably transfected with pCMV6-CREG1 or the empty vector were incubated with 5 µg/ml acridine orange (AO) for 10 min, washed with phosphate-buffered saline (PBS), and examined by fluorescence microscopy. (B) Fluorescence intensity of the cells labeled with AO was quantified and plotted. N = 30 for each group, *P < 0.001. (C) LO2 cells stably transfected with pCMV6-CREG1 or the vector alone were incubated with 1 µM LysoSensor green DND-189 for 30 min. Cells were washed with PBS and examined by fluorescence microscopy. (D) Fluorescence intensity of LysoSensor-labeled cells was quantified. N = 30 for each group, *P < 0.001. (E) Control and stable CREG1 knockdown (KD) AML12 cells were incubated with 5 µg/ml AO for 10 min, washed with PBS, and observed by fluorescence microscopy. (F) Fluorescence intensity of AO-labeled cells was quantified. N = 30 for each group, *P < 0.001. (G) AML12 cells were incubated with 1 µM LysoSensor green DND-189 for 30 min. Cells were washed and examined by fluorescence microscopy. (H) Fluorescence intensity of LysoSensor-labeled cells was quantified. N = 30 for each group, *P < 0.001
CREG1 promotes autophagy and lysosome-mediated protein degradation
The main function of the lysosome is to digest both materials engulfed from outside of the cells through endocytosis/phagocytosis as well as obsolete components of the cell itself via autophagy. To determine whether CREG1-induced lysosomal biogenesis and acidification have an impact on lysosomal function, we first analyzed autophagy induced by amino acid deprivation by immunostaining for SQSTM1/p62 (sequestosome 1). SQSTM1 is localized to ubiquitin-positive protein aggregates and delivers ubiquitinated cargoes for autophagic degradation via binding to MAP1LC3 (microtubule associated protein 1 light chain 3)-II [28]. SQSTM1 is widely used as a marker for autophagic flux and impaired autophagy leads to SQSTM1 accumulation. We detected high levels of SQSTM1 in the cytoplasm of LO2 cells in a punctate pattern (Figure 6A and 6B). Incubation of the cells in Earl’s balanced salt solution in the absence of fetal bovine serum and amino acids for 2 h slightly reduced SQSTM1 fluorescence. Overexpression of CREG1 caused a significant reduction of SQSTM1 aggregates. This was confirmed by immunoblot analysis, which demonstrated a reduction of the SQSTM1 protein after amino acid starvation in CREG1-overexpressing cells compared with LO2 cells transfected with the vector alone (Figure 6C). The reduction of SQSTM1 was blocked by treatment with chloroquine, which inhibits lysosomal activity. This suggests that CREG1 overexpression-induced reduction of SQSTM1 results from accelerated lysosomal degradation. In line with these findings, overexpression of CREG1 also caused reduction of MAP1LC3-II. This was again inhibited by chloroquine treatment (Figure 6C). Taken together, these results demonstrate that overexpression of CREG1 promotes autophagy mainly by enhancing lysosome-mediated degradation.
Figure 6.
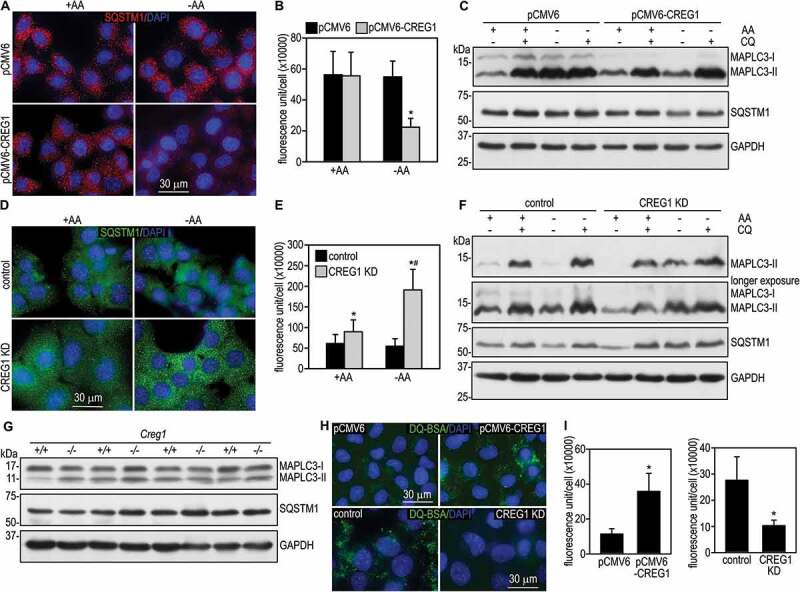
CREG1 promotes autophagy and lysosome-mediated degradation. (A) LO2 cells stably transfected with pCMV6-CREG1 or the empty vector were cultured in either complete medium (+AA) or Earl’s balanced salt solution without amino acids and serum (EBSS, -AA) for 2 h. Cells were immunostained for SQSTM1. The nucleus was counterstained with DAPI. (B) The fluorescence intensity of SQSTM1 was quantified using ImageJ and plotted. N = 30 for each group. *P < 0.001 vs pCMV6-CREG1 + AA and pCMV6 – AA. (C) The above cells were cultured in either complete medium or EBSS in the presence or absence of 100 µM chloroquine (CQ) for 2 h. Cells were lysed in SDS lysis buffer and analyzed by immunoblotting for MAPLC3 and SQSTM1. GAPDH served as a loading control. (D) CREG1 knockdown (KD) and control AML12 cells were cultured in either complete medium or EBSS for 2 h and then immunostained for SQSTM1. The nucleus was counterstained with DAPI. (E) The fluorescence intensity of SQSTM1 was quantified and plotted. N = 30 for each group. *P < 0.001 vs control. #P < 0.001 vs CREG1 KD + AA. (F) CREG1 knockdown and control cells treated with or without chloroquine in the presence or absence of amino acids and serum were subjected to immunoblot analysis. GAPDH served as a loading control. (G) Liver tissues of Creg1+/+ and creg1-/- mice (lanes 1 and 2, 3 and 4, 5 and 6, and 7 and 8 were samples from littermates) were analyzed by immunoblotting for MAPLC3 and SQSTM1. GAPDH served as a loading control. (H) CREG1-overexpressing and knockdown hepatocytes as well as the corresponding control cells were incubated with 10 µg/ml DQ Green BSA (DQ-BSA) for 5 h. Cells were then fixed and nuclei were counterstained with DAPI. Degraded DQ-BSA was visualized in green by fluorescence microscopy. (I) The fluorescence intensity of DQ-BSA was quantified and plotted. N = 50 for each group. *P < 0.001
Next, we examined the effect of CREG1 depletion on autophagy. To this end, we immunostained CREG1 knockdown AML12 hepatocytes for SQSTM1 after amino acid starvation. As shown in Figure 6D and 6E, SQSTM1 fluorescence was slightly reduced in the absence of amino acids. In contrast, knockdown of CREG1 markedly increased punctate SQSTM1 staining in the cytoplasm both in the presence and absence of serum and amino acids. Inhibition of lysosomal activity by chloroquine did not cause a further increase in SQSTM1 accumulation as revealed by immunoblot analysis (Figure 6F). Similarly, MAP1LC3-II levels were much higher in CREG1 knockdown cells than in control cells. These results suggest that depletion of CREG1 inhibits autophagy, which likely stems from reduced autolysosomal degradation.
To confirm the role of CREG1 in autophagy in vivo, we utilized immunoblotting to analyze the expression of MAP1LC3 and SQSTM1 in the liver of creg1-/- mice fasted overnight. We observed an increase in MAP1LC3-II and SQSTM1 in creg1-/- livers compared with the livers of wild-type in the same litter (Figure 6G). This may result from reduced autolysosomal degradation and consequent accumulation of these proteins in the absence of CREG1.
To further explore whether CREG1 also regulates the degradation of internalized materials from outside of the cells, we incubated CREG1-overexpressing and knockdown hepatocytes with DQ-bovine serum albumin (DQ-BSA), which can be engulfed by the cell via macropinocytosis. In the DQ-BSA conjugate, BSA is labeled with such a high molecular ratio of green fluorescent BODIPY FL that fluorescence is self-quenched. Cleavage of the self-quenched DQ-BSA in lysosomes generates highly fluorescent fragments. Overexpression of CREG1 enhanced the degradation of internalized DQ-BSA as evidenced by increased fluorescence intensity in a punctate pattern in the cytoplasm (Figure 6H and 6I). On the contrary, knockdown of CREG1 reduced DQ-BSA fluorescence. These results suggest that CREG1 also promotes lysosome-mediated degradation of engulfed foreign materials.
Enhanced endocytic trafficking contributes to CREG1-mediated lysosomal biogenesis
M6P receptors bind to M6P residues on lysosomal hydrolases and deliver them to the lysosome. Disruption of these interactions, such as genetic ablation of M6P receptors, leads to secretion of the lysosomal enzymes [29]. On the contrary, factors that enhance these interactions can facilitate the trafficking of M6P-bearing hydrolases to the lysosome [14]. CREG1 also contains M6P on its carbohydrate chains and has been shown to bind to IGF2R in far western blot analysis [15]. If the CREG1-IGF2R interaction facilitates the binding of IGF2R with M6P-bearing lysosomal hydrolases, it would reduce the secretion and promote the biogenesis of the lysosomal proteins. To test this possibility, we first determined whether CREG1 interacts with IGF2R in human hepatocytes and HEK293 cells. Immunofluorescence microscopy showed that CREG1 partially colocalized with IGF2R (Figure 7A). Coimmunoprecipitation analysis of LO2 cells and HEK293 cells overexpressing human CREG1 revealed that IGF2R interacted with CREG1 with a molecular weight of 24 kDa, which corresponds to N terminus-processed and MYC-tag-cleaved CREG1 (Figure 7B and 7C). N-terminal intact and C-terminally MYC-tagged CREG1 (localized at the ER as detected by immunofluorescence microscopy), which is 34 kDa, did not coimmunoprecipitated with IGF2R. Next, we addressed whether CREG1 overexpression inhibits the secretion of HEXA, which is highly dependent on its interaction with IGF2R [29]. To this end, we immunoprecipitated HEXA from conditioned media of LO2 cells and quantified secreted HEXA by immunoblotting. As shown in Figure 7D and 7E, overexpression of CREG1 did not significantly alter the secretion of HEXA into culture media. Taken together, these results suggest that the interaction of CREG1 with IGF2R neither alters the trafficking route nor inhibits the secretion of lysosomal hydrolases.
Figure 7.
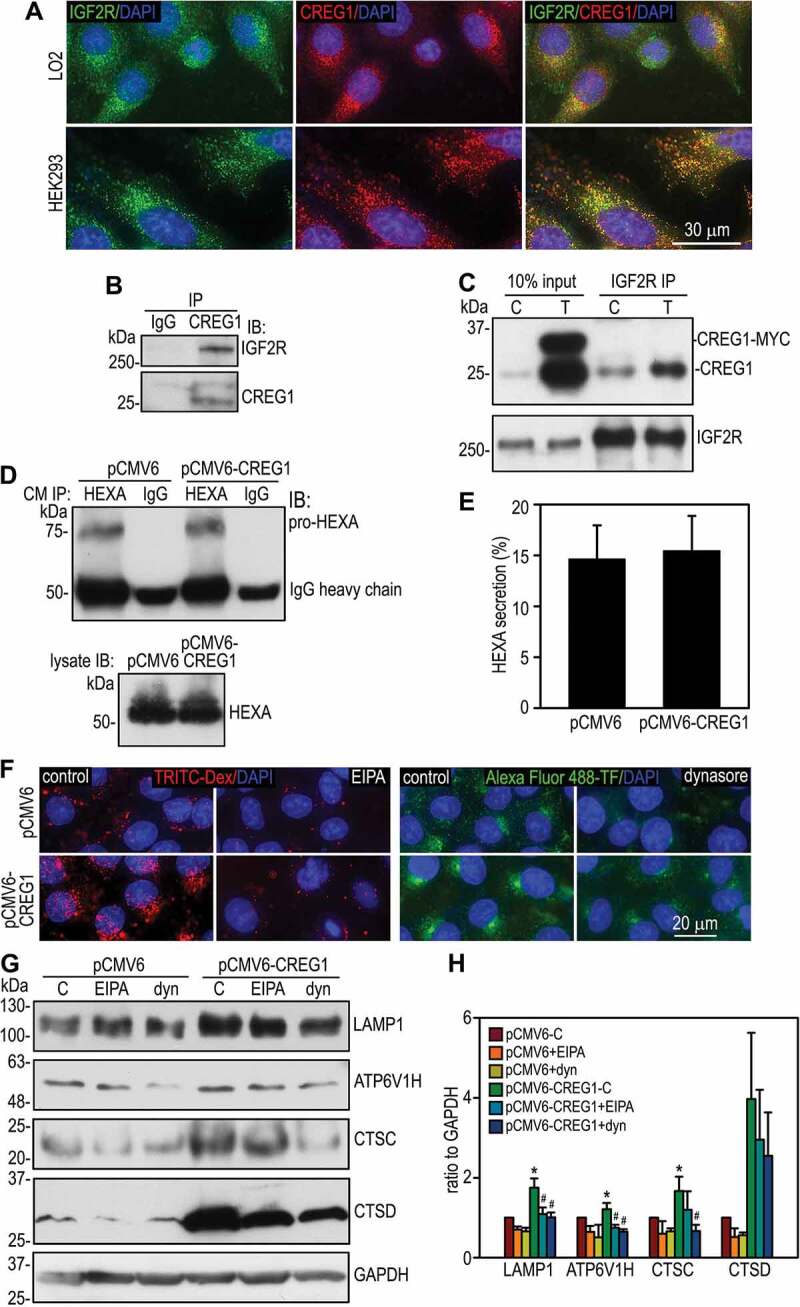
The effect of inhibition of macropinocytosis and dynamin-dependent endocytic trafficking on the expression of lysosomal proteins. (A) LO2 hepatocytes and HEK293 cells were transfected with pCMV6-CREG1 or the vector alone and cultured for 10 days. Cells were coimmunostained for CREG1 and IGF2R. (B) LO2 cells were immunoprecipitated (IP) with anti-CREG1 monoclonal antibody or pre-immune IgG. Immunoblotting was used to detect for IGF2R. (C) HEK293 cells stably transfected with pCMV6-CREG1 (T) or the vector alone (C) were immunoprecipitated with anti-IGF2R polyclonal antibody and immunoblots were probed for CREG1 and IGF2R. (D) Confluent LO2 cells were cultured in RPMI-1640 medium for 24 h. Conditioned media were immunoprecipitated with HEXA antibody or pre-immune IgG. Immunoblots were analyzed with the same antibody. Cell lysates were also analyzed by immunoblotting. (E) The percentage of HEXA in the conditioned media were plotted. N = 3, P = 0.785. (F) LO2 cells stably transfected with pCMV6-CREG1 or the empty vector were pre-incubated with the macropinocytosis inhibitor 5-(n-ethyl-n-isopropyl)amiloride (EIPA), dynasore (dyn, an inhibitor for dynamin-dependent endocytosis), or the vehicle control for 30 min. The cells were then labeled with TRITC-dextran (Dex) or Alexa Fluor 488-TF for 30 min. Treatment of the cells with EIPA and dynasore inhibited the internalization of TRITIC-Dex and Alexa Fluor 488-TF, respectively. (G) LO2 cells were treated with EIPA, dynasore, or the vehicle control (C) for 24 h and then harvested for immunoblot analysis. GAPDH served as a loading control. (H) The blots were quantified by densitometry and plotted as a ratio to GAPDH. N = 3, *P < 0.05 vs pCMV6-C, #P < 0.05 vs pCMV6-CREG1-C
Endocytosis is a major input of the lysosomal degradation pathway. Endosomal vesicles are responsible for the delivery of lysosomal membranes, including proteins and other components, and soluble proteins from the Golgi to the lysosome. To determine whether enhanced endocytosis contributes to CREG1 overexpression-induced lysosomal biogenesis, we treated LO2 hepatocytes with the sodium-proton exchanger inhibitor 5-(N-ethyl-N-isopropyl) amiloride (EIPA), which inhibits macropinocytosis, or the dynamin inhibitor dynasore, which inhibits clathrin-dependent endocytosis [30,31]. The effective inhibition of macropinocytosis by EIPA was confirmed by reduced internalization of TRITC-dextran (decreased to 28.7 and 40.0% of the vehicle control in pCMV6- and pCMV6-CREG1-transfected cells, respectively, p < 0.01) (Figure 7F). Similarly, the effective inhibition of clathrin-dependent endocytosis by dynasore was confirmed by reduced internalization of Alexa Fluor 488-TF (decreased to 34.1 and 42.2% of the vehicle control in pCMV6- and pCMV6-CREG1-transfected cells, respectively, p < 0.01). Both inhibitors significantly reduced the protein expression of LAMP1, ATP6V1H, and CTSC in CREG1-overexpressing cells, with a more prominent effect exerted by dynasore treatment (Figure 7G and 7H). Although EIPA and dynasore also inhibited the expression of the lysosomal proteins in control cells, no statistically significant effect was shown (Figure 7H). These results suggest that enhanced endocytic trafficking may contribute to CREG1-mediated lysosomal biogenesis.
Discussion
In the present study, we demonstrate that CREG1 is localized to the endosomal-lysosomal compartment using antibodies validated for immunofluorescence microscopy (Figure S7). Gain- and loss-of-function experiments revealed that CREG1 enhances both macropinocytosis and clathrin-dependent endocytosis. CREG1 also promotes acidification of the endosomal-lysosomal compartment and increases lysosomal biogenesis. Functionally, overexpression of CREG1 enhances autophagy and lysosome-mediated degradation, whereas knockdown or knockout of CREG1 has opposite effects. Mechanistically, the effect of CREG1 overexpression on lysosomal biogenesis is likely attributable to enhanced endocytic trafficking. Our results suggest that CREG1 is an endosomal-lysosomal protein implicated in endocytic trafficking and lysosomal biogenesis.
Prior studies reported that CREG1 was localized at the ER, lysosomes, or mitochondria. These studies were carried out either by the expression of CREG1 fused with GFP at its C terminus (CREG1-GFP) or with antibodies made in house [2,5,10]. We expressed CREG1-MYC in both LO2 and HEK293 cells and found that the MYC-tag was cleaved off from CREG1. Similarly, CREG1-GFP expressed in LO2 cells was also partly cleaved as assessed by immunoblotting. This is likely to occur when CREG1-MYC or CREG1-GFP is transported from the ER and the Golgi to the late endosome and the lysosome. Therefore, the expression of CREG1-GFP may not be suitable for detecting the localization of CREG1 because its retention in the ER. We screened commercially available CREG1 antibodies for immunostaining in both LO2 and HEK293 cells overexpressing C-terminally MYC-tagged human CREG1. Coimmunostaining of the cells with anti-MYC-tag and anti-human CREG1 monoclonal antibody (clone 30R) detected MYC-tagged CREG1 mainly in the ER. Whereas the 30R epitope was detected at very high levels in lysosomes in the cells overexpressing CREG-MYC, it was detected only at low levels in untransfected cells. Immunoblot analysis of cells stably transfected with MYC-tagged human CREG1 revealed two major bands. The band with molecular weight of 34 kDa is reactive to the MYC-tag antibody and antibodies against both the N terminus and the C terminus of human CREG1. The lower band of approximately 24 kDa was only detected with the antibody against the C-terminal part of human CREG1. These results suggest that the full length C-terminal MYC-tagged CREG1, which is detected in the ER with the MYC-tag antibody, is likely to be processed with the N-terminal signal peptide and the C-terminal MYC-tag removed when transported to endosomes and lysosomes. Surprisingly, the 30R epitope is not detected at the ER; this is likely because it is masked by carbohydrate chains and/or CREG1-interacting proteins. Similarly, the CREG1-GFP fusion protein expressed in LO2 and HEK293 cells was mainly detected in the ER. Time course recording demonstrates transient presence of CREG1-GFP in lysosomes. This is likely due to the removal and degradation of GFP from the fusion protein. When CREG1 and GFP were expressed separately by transfection of LO2 cells with pLPCX-CREG1-IRES-GFP, the untagged CREG1 partially colocalized with LAMP1. Therefore, the expression of CREG1-GFP may not be a reliable method to lively trace CREG1. We failed to detect colocalization of either endogenous or overexpressed CREG1 with mitochondrial markers in human hepatocytes and HEK293 cells. This result indicates that CREG1 is not a mitochondrial protein. In addition to lysosomes, endogenous CREG1 is also likely a residential protein in the endosomal compartments since it mainly colocalizes with early and late endosomal markers in mouse endoderm cells. Expression of N-terminally Flag-tagged wild-type and glycosylation mutant CREG1 in HEK293 cells suggests N-glycosylation, but not cleavage of the signal peptide, is required for CREG1 trafficking from the ER to the endosomal-lysosomal compartment.
Studies on CREG1 biological activities have been focused on cell proliferation and differentiation [32]. Its functions in the endosomal-lysosomal system had been largely unexplored. In the present studies, we demonstrate that CREG1 promotes clathrin-dependent and -independent endocytosis as well as intracellular vesicular trafficking. This is supported by the observations that overexpression of CREG1 increased the internalization of fluorescent dextran and transferrin. Internalized transferrin was initially found at RAB5-positive early endosomes and colocalized with exogenously expressed CREG1. Pulse-chase experiments demonstrated that the transition from early endosomes to degradation is accelerated by CREG1 overexpression. By contrast, shRNA-mediated knockdown of CREG1 inhibited both clathrin-dependent and -independent endocytosis. These results suggest that CREG1 plays an important role in endocytic trafficking. In this regard, it may be worthwhile to explore whether the reported effects of CREG1 on growth inhibition and cellular differentiation result from endocytosis-mediated removal of growth factors and their receptors [33].
LysoTracker labeling of lysosomes suggests that overexpression of CREG1 increases vesicular density. CREG1 knockdown has inhibitory effects. The protein levels of lysosomal membrane proteins and hydrolases positively correlate with the fluorescent intensity of LysoTracker labeling. In contrast, the expression of ER and Golgi marker proteins are not altered by CREG1 overexpression or knockdown. These results indicate that CREG1 promotes lysosomal biogenesis. These cell culture findings are supported by the analysis of the liver lysosomal proteins in creg1 knockout mice, which demonstrated reduced expression of lysosomal hydrolases and ATP6V1H. CREG1 also positively regulates acidification of endosomal-lysosomal compartments as assessed using the pH sensitive fluorescent probes LysoSensor and acridine orange. Since acidification of the lysosomal lumen is driven by the action of vacuolar ATPase, CREG1-mediated upregulation of vacuolar ATPase may contribute to its effect on lysosomal pH. The increased lysosomal biogenesis and acidification can enhance lysosomal function. Indeed, nutrient depletion-induced autophagic flux and pulse-chase with BODIPY-labeled albumin suggest that CREG1 also promotes lysosomal degradation.
Lysosomal biogenesis is mainly controlled by transcription factor EB (TFEB)-regulated transcription of lysosomal genes and endocytic delivery of newly synthesized lysosomal proteins [34]. Promoter analysis of lysosome- and autophagy-related genes revealed that they share a 10-base GTCACGTGAC E-box-like palindromic sequence, termed the coordinated lysosomal expression and regulation (CLEAR) element [35]. TFEB binds to CLEAR elements and induces the expression of all the CLEAR network genes, and therefore acts as a master regulator of lysosomal biogenesis. The transcriptional activity of TFEB is controlled by MTOR (mechanistic target of rapamycin kinase) complex 1 (MTORC1)- and MAPK1 (mitogen-activated protein kinase 1)-mediated phosphorylation [36]. Under nutrient-rich conditions, MTORC1 and MAPK1 phosphorylate TFEB and cause its retention in the cytoplasm. Nutrient depletion inhibits MTORC1 and MAPK1 activity, suppresses TFEB phosphorylation, and thus promotes its nuclear translocation and transcriptional activities. In this study, we did not observe a parallel change in lysosomal gene transcription in the gain- and loss-of-function analyses of CREG1. On the contrary, when the lysosomal proteins are increased by CREG1 overexpression, their mRNA levels are often decreased. The negative correlation between protein and mRNA levels is also observed in shRNA-mediated CREG1 knockdown. This change in the mRNA levels likely results from negative feedback to transcriptional regulation. Our results suggest that CREG1 is unlikely to regulate lysosomal biogenesis at the transcription level.
Lysosomal proteins are synthesized in the ER and modified in the Golgi, from where they are delivered to the lysosome via endocytic vesicles [34]. Most soluble lysosomal proteins bear M6P tags at the terminus of their carbohydrate chains, which can be recognized by one of the two M6P receptors [14]. These receptors bind to lysosomal proteins at the Golgi and the cargo-receptor complex is sorted into clathrin-coated vesicles. These are transported to early endosomes and then to late endosomes. In the late endosome, the cargoes separate from M6P receptors and are delivered to the lysosome through either fusion of the late endosome with the lysosome or a kiss-and-run process [34]. Free M6P receptors at late endosomes are retrieved back to the Golgi for reuse. The importance of M6P receptors in the transportation of soluble lysosomal proteins is underscored by the fact that loss of IGF2R, the cation-dependent M6P receptor, or both significantly increased the secretion of lysosomal enzymes into culture media [29]. Furthermore, gene mutations that inhibit the addition of M6P tags cause mucolipidosis II (also known as “I cell disease’), a life-threatening lysosomal storage disease [37]. CREG1 has been shown to bind to IGF2R likely also through M6P on its carbohydrate chains [5,15]. We confirmed that CREG1 interacts with IGF2R in hepatocytes and HEK293 cells by coimmunoprecipitation and coimmunostaining. However, the significance of this interaction in the trafficking of lysosomal enzymes has not been explored. IGF2R contains 15 M6P receptor homology (MRH) domains with domains 3, 5, and 9 binding to M6P [38]. The effect of CREG1’s interaction with IGF2R may follow several pathways. CREG1 could compete with lysosomal enzymes and thus inhibit their binding to IGF2R. Alternatively, CREG1 binding to one of the M6P-interacting domains could increase the affinity of other two domains for lysosomal hydrolases. CREG1 could also be a bystander without influence on lysosomal trafficking. We used lysosomal secretion as a readout and observed that overexpression of CREG1 has no effect on HEXA secretion, which is significantly increased in the absence of IGF2R [29]. These results suggest that CREG1 binding to IGF2R is unlikely to have a significant impact on the delivery of lysosomal enzymes.
In this study, we found that overexpression and knockdown/knockout of CREG1 affect both lysosomal membrane proteins and hydrolases. Delivery of newly synthesized membrane proteins (LAMP1 and LAMP2, ATP6V1H, etc.) is independent of the M6P-IGF2R interaction. Instead, these proteins carry endocytic peptide signals at their C terminus and bind to clathrin adaptor AP1 and AP2 [39]. Our results suggest that CREG1 may intrinsically act on the endocytic pathway to control protein trafficking to lysosomes. This hypothesis is supported by the observation that overexpression of CREG1 promotes clathrin-dependent endocytic trafficking of internalized transferrin. Furthermore, pharmacological inhibition of macropinocytosis and dynamin-dependent endocytic trafficking attenuated the upregulation of both lysosomal membrane proteins and hydrolases that is induced by CREG1 overexpression. The present study demonstrates a new function of CREG1 in lysosomal biogenesis and function. The underlying molecular mechanisms by which CREG1 controls endocytic trafficking warrant further investigation.
In this study, we used the analog of amiloride EIPA to inhibit macropinocytosis. The inhibitory effect is mainly attributed to decreased subplasma membrane pH and consequent inactivation of RAC1 and CDC42 signaling [40]. However, Na+/H+ exchangers are responsible for the maintenance of sodium and pH balance and thus are involved in many cellular functions. Na+/H+ exchanger inhibitors have been reported to alter the localization of early endosomes and lysosomes. Therefore, in addition to its effect on macropinocytosis, EIPA may inhibit lysosomal biogenesis by regulating endosomal and lysosomal movement.
The physiological function of CREG1 remains enigmatic. We showed that CREG1 is highly expressed in the visceral endoderm in mouse embryos and colocalizes with internalized maternal immunoglobulins. Endosomes that contain the internalized immunoglobulins and other nutrients are engulfed by and digested in apical vacuoles via microautophagy [24,25]. This process is essential for the nutrition and development of early embryos in rodents [23]. Given that CREG1 is enriched in endosomes and partially colocalizes with LAMP2-positive vacuoles, and given that overexpression of CREG1 promotes endocytic trafficking, these results suggest that CREG1 may play a critical role in microautophagy in the visceral endoderm.
Materials and Methods
Antibodies, plasmids, and chemical reagents
Rabbit monoclonal antibodies (mAb) to EEA1 (3288, RRID:AB_2096811), LAMP1 (9091, RRID:AB_2687579), EBAG9/RCAS1 (12,290, RRID:AB_2800310), AIFM1 (5318, RRID:AB_10634755), PDIA2 (3501, RRID:AB_2156433), RAB5 (3547, RRID:AB_2300649), RAB7 (9367, RRID:AB_1904103), MAP1LC3A/B (12,741, RRID:AB_2728823), and MYC-tag (2278, RRID:AB_490778), and mouse mAb to RAB7 (95,746, RRID:AB_2800252) were purchased from Cell Signaling Technology. Mouse mAb to CDH1/E-cadherin (cadherin 1; 612,130, RRID:AB_399,501) was purchased from BD Biosciences. Mouse mAbs to CREG1 (clone 30R, sc-100,695, RRID:AB_2084104), ATP6V1H (clone C-8, sc-166,227, RRID:AB_2062714), CTSC (clone D-6, sc-74,590, RRID:AB_2086955), CTSD (clone C-5, sc-377,124), and HEXA (clone E-2, sc-376,735) were obtained from Santa Cruz Biotechnology. Flag-tag (F3165, RRID:AB_259529) and ACTB/β-actin (A5441, RRID:AB_476744) mAbs were obtained from Sigma. Rabbit anti-CREG1 pAbs (ab191909 and ab59719) were obtained from Abcam. Rat anti-mouse LAMP1 (1D4B, RRID:AB_528127) and LAMP2 mAb (ABL-93, RRID:AB_2134767) were purchased from Developmental Studies Hybridoma Bank. Mouse anti-SQSTM1/p62 mAb (clone 2 C11, H00008878-M01, RRID:AB_437085) was purchased from Abnova. Rabbit anti-mouse CREG1 antibody (PAQ264Mu01) was purchased from Cloud-Clone Corp. Rabbit anti-MAP1LC3 pAb was kindly provided by Masako Sakai of National Institute of Genetics (Mishima, Japan). Cy3- (711–165-152 and 715–165-151), Cy5- (711–175-152 and 715–175-151), and horseradish peroxidase-conjugated donkey anti-rabbit and mouse antibodies (711–035-152 and 715–035-150) were obtained from Jackson ImmunoResearch. Alexa Fluor 488-conjugated donkey anti-rabbit and mouse antibodies were obtained from Thermo Fisher Scientific (A-21,206 and A-21,202).
The cDNAs for human wild-type CREG1 (HsCREG1) was provided by Dr. Grace Gill of Tufts University (Boston, MA) and subcloned into pcDNA3.1 (Thermo Fisher Scientific, V80020) with an N-terminal MYC-tag. Glycosylation mutant (N160A/N193A/N216A) CREG1 was generated using the QuickChange II mutagenesis kit (Aligent Technologies, 200,523). For the expression of the CREG1-GFP fusion protein and tag-less CREG1, the HsCREG1 cDNA was subcloned in frame from pcDNA3.1 to pEGFP-N3 and pLPCX-IRES-GPF, respectively. pCMV6-CREG1, pCMV6, and the shRNA plasmids targeting mouse Creg1 as well as the scrambled control were purchased from Origene Technologies (RC201654, PS100001, and TF510293, respectively). The shRNA sequence that produced the most effective CREG1 knockdown is CCGCGCTGGTGGCACTACTGGTGTCGCCG. All the cDNA constructs were confirmed by DNA sequencing.
LysoTracker Red DND-99 (L7528), LysoSensor Green DND-189 (L7535), and MitoTracker Red CMXRos (M7512) were purchased from Thermo Fisher Scientific and used at final concentrations of 50 nM, 1 µM, and 50 nM, respectively. TRITC-Dextran (T1162) and FITC-bovine serum albumin (A9771) were purchased from Sigma and used at final concentrations of 100 and 200 µg/ml, respectively. Alexa Fluor 488-human TF/transferrin (009–540-050, RRID:AB_2337106) was purchased from Jackson ImmunoResearch and used at the final concentration of 50 µg/ml. DQ Green BSA (D12050) was purchased from Thermo Fisher Scientific and used at the final concentration of 10 µg/ml. Dynasore hydrate (D7693) and 5-(N-ethyl-N-isopropyl)amiloride (EIPA, A3085) were purchased from Sigma and used at final concentrations of 200 and 150 µM, respectively.
Cell culture
Mouse hepatocyte cell line AML12 was purchased from ATCC (CRL-2254) and cultured in DMEM/F12 medium supplemented with 10% fetal bovine serum (FBS), 10 µg/ml insulin, 5.5 µg/ml TF, 5 ng/ml selenium (Thermo Fisher Scientific, 41,400,045) and 40 ng/ml dexamethasone. Human hepatocyte cell line LO2 was purchased from the Type Culture Collection of the Chinese Academy of Sciences (HL-7702, RRID: CVCL_6926) and cultured in RPMI-1640 medium containing 10% FBS. The cells were cloned by limited dilution and clonal cells were selected based on the expression of human hepatic mRNAs for ALB, F10, and HNF4A (Figure S1).
Stable transfection of hepatocytes
For stable expression of CREG1, LO2 cells were transfected with pCMV6-human CREG1-MYC or pCMV6 alone using Lipofectamine 3000 reagent (Thermo Fisher Scientific, L3000001). Stable cell clones were enriched by the treatment with 500 µg/ml G418 for 7 days and then selected by the limited dilution method. The clonal cells that expressed CREG1 were confirmed by immunostaining and immunoblotting for MYC-tag and CREG1. For stable knockdown of CREG1, specific shRNAs targeting mouse Creg1 and the scrambled control in the pRFP-C-RS vector were introduced into AML12 cells by transfection using Lipofectamine 3000 reagent. The transfected cells were treated with 1 µg/ml puromycin for 7 days and RFP-positive cells were further selected by cell sorting with a BD Biosciences Influx high speed cell sorter. CREG1 depletion was confirmed by immunoblotting.
Animals
All animal experiments were approved by Rutgers University Institutional Animal Care and Use Committee. For immunoblot analysis of CREG1 expression, various tissues were harvested from 8 week-old C57BL/6J mice and homogenized in radioimmunoprecipitation assay (RIPA) buffer (50 mM Tris, pH 7.4, 150 mM NaCl, 1 mM EDTA, 1% NP-40, 0.25% sodium deoxycholate) which also contained protease and phosphatase inhibitor cocktails (Sigma). Leukocytes were isolated from heparinized whole blood with Qiagen buffer EL (an erythrocyte lysis buffer, 97,217). Bone marrow was isolated from hind limb long bones as described previously with erythrocytes removed with Qiagen buffer EL [41]. For immunostaining, E7.5 and E16.5 embryos were collected from timed pregnant mice and fixed with 4% paraformaldehyde for 30 min.
Creg1 floxed mice were generated using CRISPR technology by inserting loxP sites to flank exons 1 through 3, which encode the entire open reading frame. We crossed Creg1fl/fl mice with UBC-Cre/ERT2 mice (Jackson Laboratory, 007001) to obtain Creg1fl/fl;UBC-Cre/ERT2 mice, which were injected peritoneally with tamoxifen (150 mg/kg for 5 days) at 8 weeks of age [42]. We then bred creg1 knockout mice with wild-type C57BL/6J mice, which yielded Creg1+/- mice. Intercrosses between the Creg1+/- mice that do not carry the Cre transgene produced creg1-/- mice in numbers slightly reduced from values predicted under Mendelian principles. Liver tissues were harvested from 8 week-old wild-type and creg1-/- mice and used for immunoblot analysis.
Immunofluorescence
Cells were fixed with 3% paraformaldehyde on ice for 10 min and immunostaining was carried out as described [43]. Paraffin sections of mouse embryos were boiled in citrate buffer (pH 6.0) for antigen retrieval. Slides were viewed with a Nikon inverted fluorescence microscope (Eclipse TE2000) using a Nikon Plan Fluor 40×/1.30 oil objective at 20°C and digital images were acquired with a Hamamatsu CCD camera controlled by IP Lab software (Scanalytics). Three-color RGB images were constructed from single-channel images using IP Lab software. All color images were sharpened with Unsharp Mask in Photoshop (Amount: 200%, Radius: 2.0 pixels). Immunofluorescence images of confluent cells was analyzed using ImageJ software (National Institutes of Health) with 6 biological replicates. Average immunofluorescence intensity of individual cells were calculated as mean immunofluorescence of in a defined area divided by cell numbers in that area and multiplied by the cell area. Co-localization was analyzed using ImageJ JACoP macro.
Immunoblotting
Mouse tissues and confluent cells were lysed in RIPA buffer. For analysis of MAP1LC3 and SQSTM1, SDS lysis buffer containing 1% SDS, 50 mM Tris (pH 7.4), and protease and phosphatase inhibitor cocktails was used. Immunoblotting was performed as described [44].
RT-PCR
Total RNA was isolated from cells with TRIzol® reagent (Thermo Fisher Scientific, 15,596,026) and reverse-transcribed to cDNA using a SuperScript™ VILO cDNA synthesis kit as per manufacturer’s instructions (Thermo Fisher Scientific, 11,754,250). PCR reactions were performed using Bio-Rad MyCycler thermocycler and Taq DNA polymerase with ThermoPol buffer (New England Biolabs, M0480L). The PCR primers for the mouse lysosomal gene transcripts are: Lamp1, 5ʹ-CTGCTCCTGCTGCTGCT-3ʹ (forward) and 5ʹ-GTTGGGGAAGGTCCATCCTG-3ʹ (reverse); Atp6v1h, 5ʹ-ATGGCTCCTGGCATTCAGTC-3ʹ(forward) and 5ʹ-CCAACTGCTTTCCACCAAGC-3ʹ (reverse); Ctsc, 5ʹ-TGCCCCGATGACTGATGAAA-3ʹ (forward) and 5ʹ-TGCAGCCACCATAGAAACCA-3ʹ (reverse); Ctsd, 5ʹ-GCGTCTTGCTGCTCATTCTC-3ʹ (forward) and 5ʹ-TGCAATGAATGGAGGGGACC-3ʹ (reverse); and Hexa, 5ʹ-TGAACCCCAGTCTCAACAGC-3ʹ (forward) and 5ʹ-GAGCCTTCTGTTCAGGCGTA-3ʹ (reverse). The PCR primers for the human lysosomal gene transcripts are: LAMP1, 5ʹ-GAGTGGCCCTAAGAACATGA-3ʹ (forward) and 5ʹ-AAAGGTACGCCTGGATGGTG-3ʹ (reverse); ATP6V1H, 5ʹ-AAGGCAGCCAGTGTGCTAAA-3ʹ (forward) and 5ʹ-CGCTACCACGCAGTTTCTGT-3ʹ (reverse); CTSC, 5ʹ-ACCTGCCAACTGCACCTATC-3ʹ (forward) and 5ʹ-CCCACCTTCTTTCCGGTGAA-3ʹ (reverse); CTSD, 5ʹ-AAGTTCGATGGCATCCTGGG-3ʹ (forward) and 5ʹ-CATGAGGGAAGTGCCTGTGT-3ʹ (reverse); and HEXA, 5ʹ-GGTCATTGAATACGCACGGC-3ʹ (forward) and 5ʹ-CAACTTGTTGCTCCACAGCC-3ʹ (reverse). The primers for RNA18S rRNA are 5ʹ- TCAAGAACGAAAGTCGGAGG-3ʹ (forward) and 5ʹ-GGACATCTAAGGGCATCACA-3ʹ (reverse). PCR products were electrophoretically resolved on 2% agarose gels. Data shown are representatives of 3 repeats.
Fluorescent labeling of endocytic compartments
Subconfluent LO2 and AML12 cells were incubated with 100 µg/ml TRITIC-dextran (average molecular weight 65–85 kD), 200 µg/ml FITC-albumin, or 50 µg/ml Alexa Fluor 488-TF at 37°C for 30 min. Cells were washed 3 times with phosphate-buffered saline and fixed with 3% paraformaldehyde for 10 min. Cells were then immunostained for proteins of interest and nuclei were counterstained with DAPI. Pulse-chase experiments were performed to study the trafficking of internalized Alexa Fluor 488-TF. LO2 cells were first labeled with 50 µg/ml Alexa Fluor 488-TF at 4°C for 15 min. Cells were then washed with ice-cold phosphate-buffered saline (PBS; Thermo Fisher Scientific, 10,010–023) 3 times and chased at 37°C for 30 or 60 min. Trafficking of internalized Alexa Fluor 488-TF through the early endosome was detected by immunostaining for RAB5.
Supplementary Material
Statistical analysis
All of the immunoblots shown are representative results of 3 independent experiments. Quantitative data are presented as mean ± SD. Statistical analysis between two groups was performed using unpaired Student’s t-test. Statistical differences between multiple groups were evaluated by one-way ANOVA.
Disclosure statement
No potential conflict of interest was reported by the authors.
Supplementary material
Supplemental data for this article can be accessed here
References
- [1].Veal E, Eisenstein M, Tseng ZH, et al. A cellular repressor of E1A-stimulated genes that inhibits activation by E2F. Mol Cell Biol. 1998. Sep;18(9):5032–5041. . [DOI] [PMC free article] [PubMed] [Google Scholar]
- [2].Veal E, Groisman R, Eisenstein M, et al. The secreted glycoprotein CREG enhances differentiation of NTERA-2 human embryonal carcinoma cells. Oncogene. 2000. Apr 20;19(17):2120–2128. [DOI] [PubMed] [Google Scholar]
- [3].Kunita R, Otomo A, Ikeda JE.. Identification and characterization of novel members of the CREG family, putative secreted glycoproteins expressed specifically in brain. Genomics. 2002. Nov;80(5):456–460. [PubMed] [Google Scholar]
- [4].Kowalewski-Nimmerfall E, Schahs P, Maresch D, et al. Drosophila melanogaster cellular repressor of E1A-stimulated genes is a lysosomal protein essential for fly development. Biochim Biophys Acta. 2014. Dec;1843(12):2900–2912. . [DOI] [PMC free article] [PubMed] [Google Scholar]
- [5].Schahs P, Weidinger P, Probst OC, et al. Cellular repressor of E1A-stimulated genes is a bona fide lysosomal protein which undergoes proteolytic maturation during its biosynthesis. Exp Cell Res. 2008. Oct 1;314(16):3036–3047. [DOI] [PubMed] [Google Scholar]
- [6].Han Y, Deng J, Guo L, et al. CREG promotes a mature smooth muscle cell phenotype and reduces neointimal formation in balloon-injured rat carotid artery. Cardiovasc Res. 2008. Jun 1;78(3):597–604. [DOI] [PubMed] [Google Scholar]
- [7].Liu J, Qi Y, Li S, et al. CREG1 interacts with Sec8 to promote cardiomyogenic differentiation and cell-cell adhesion. Stem Cells. 2016. Nov;34(11):2648–2660. . [DOI] [PubMed] [Google Scholar]
- [8].Moolmuang B, Tainsky MA.. CREG1 enhances p16(INK4a) -induced cellular senescence. Cell Cycle. 2011. Feb 1;10(3):518–530. [DOI] [PMC free article] [PubMed] [Google Scholar]
- [9].Kusudo T, Hashimoto M, Kataoka N, et al. CREG1 promotes uncoupling protein 1 expression and brown adipogenesis in vitro. J Biochem. 2019. Jan 1;165(1):47–55. [DOI] [PubMed] [Google Scholar]
- [10].Hashimoto M, Kusudo T, Takeuchi T, et al. CREG1 stimulates brown adipocyte formation and ameliorates diet-induced obesity in mice. Faseb J. 2019. Jul;33(7):8069–8082. . [DOI] [PubMed] [Google Scholar]
- [11].Sleat DE, Wang Y, Sohar I, et al. Identification and validation of mannose 6-phosphate glycoproteins in human plasma reveal a wide range of lysosomal and non-lysosomal proteins. Mol Cell Proteomics. 2006. Oct;5(10):1942–1956. . [DOI] [PubMed] [Google Scholar]
- [12].Qian M, Sleat DE, Zheng H, et al. Proteomics analysis of serum from mutant mice reveals lysosomal proteins selectively transported by each of the two mannose 6-phosphate receptors. Mol Cell Proteomics. 2008. Jan;7(1):58–70. . [DOI] [PubMed] [Google Scholar]
- [13].Sleat DE, Zheng H, Lobel P. The human urine mannose 6-phosphate glycoproteome. Biochim Biophys Acta. 2007. Mar;1774(3):368–372. [DOI] [PMC free article] [PubMed] [Google Scholar]
- [14].Ghosh P, Dahms NM, Kornfeld S. Mannose 6-phosphate receptors: new twists in the tale. Nat Rev Mol Cell Biol. 2003. Mar;4(3):202–212. [DOI] [PubMed] [Google Scholar]
- [15].Di Bacco A, Gill G. The secreted glycoprotein CREG inhibits cell growth dependent on the mannose-6-phosphate/insulin-like growth factor II receptor. Oncogene. 2003. Aug 21;22(35):5436–5445. [DOI] [PubMed] [Google Scholar]
- [16].Journet A, Chapel A, Kieffer S, et al. Towards a human repertoire of monocytic lysosomal proteins. Electrophoresis. 2000. Oct;21(16):3411–3419. . [DOI] [PubMed] [Google Scholar]
- [17].Journet A, Chapel A, Kieffer S, et al. Proteomic analysis of human lysosomes: application to monocytic and breast cancer cells. Proteomics. 2002. Aug;2(8):1026–1040. . [DOI] [PubMed] [Google Scholar]
- [18].Markmann S, Krambeck S, Hughes CJ, et al. Quantitative proteome analysis of mouse liver lysosomes provides evidence for mannose 6-phosphate-independent targeting mechanisms of acid hydrolases in mucolipidosis II. Mol Cell Proteomics. 2017. Mar;16(3):438–450. . [DOI] [PMC free article] [PubMed] [Google Scholar]
- [19].Levine B, Kroemer G. Autophagy in the pathogenesis of disease. Cell. 2008. Jan 11;132(1):27–42. [DOI] [PMC free article] [PubMed] [Google Scholar]
- [20].Ni HM, Bockus A, Wozniak AL, et al. Dissecting the dynamic turnover of GFP-LC3 in the autolysosome. Autophagy. 2011. Feb;7(2):188–204. . [DOI] [PMC free article] [PubMed] [Google Scholar]
- [21].Huang L, Pike D, Sleat DE, et al. Potential pitfalls and solutions for use of fluorescent fusion proteins to study the lysosome. PLoS One. 2014;9(2):e88893. [DOI] [PMC free article] [PubMed] [Google Scholar]
- [22].Haar JL, Ackerman GA. Ultrastructural changes in mouse yolk sac associated with the initiation of vitelline circulation. Anat Rec. 1971. Aug;170(4):437–455. [DOI] [PubMed] [Google Scholar]
- [23].Bielinska M, Narita N, Wilson DB. Distinct roles for visceral endoderm during embryonic mouse development. Int J Dev Biol. 1999. May;43(3):183–205. [PubMed] [Google Scholar]
- [24].Kawamura N, Sun-Wada GH, Aoyama M, et al. Delivery of endosomes to lysosomes via microautophagy in the visceral endoderm of mouse embryos. Nat Commun. 2012;3:1071. [DOI] [PubMed] [Google Scholar]
- [25].Wada Y, Sun-Wada GH, Kawamura N. Microautophagy in the visceral endoderm is essential for mouse early development. Autophagy. 2013. Feb 1;9(2):252–254. [DOI] [PMC free article] [PubMed] [Google Scholar]
- [26].Balbis A, Baquiran G, Dumas V, et al. Effect of inhibiting vacuolar acidification on insulin signaling in hepatocytes. J Biol Chem. 2004. Mar 26;279(13):12777–12785. [DOI] [PubMed] [Google Scholar]
- [27].Pierzynska-Mach A, Janowski PA, Dobrucki JW. Evaluation of acridine orange, LysoTracker Red, and quinacrine as fluorescent probes for long-term tracking of acidic vesicles. Cytometry A. 2014. Aug;85(8):729–737. [DOI] [PubMed] [Google Scholar]
- [28].Sanchez-Martin P, Komatsu M. p62/SQSTM1 - steering the cell through health and disease. J Cell Sci. 2018. Nov 5;131:21. . [DOI] [PubMed] [Google Scholar]
- [29].Pohlmann R, Boeker MW, Von Figura K. The two mannose 6-phosphate receptors transport distinct complements of lysosomal proteins. J Biol Chem. 1995. Nov 10;270(45):27311–27318. [DOI] [PubMed] [Google Scholar]
- [30].Commisso C, Davidson SM, Soydaner-Azeloglu RG, et al. Macropinocytosis of protein is an amino acid supply route in Ras-transformed cells. Nature. 2013. May 30;497(7451):633–637. [DOI] [PMC free article] [PubMed] [Google Scholar]
- [31].Macia E, Ehrlich M, Massol R, et al. Dynasore, a cell-permeable inhibitor of dynamin. Dev Cell. 2006. Jun;10(6):839–850. . [DOI] [PubMed] [Google Scholar]
- [32].Ghobrial G, Araujo L, Jinwala F, et al. The structure and biological function of CREG. Front Cell Dev Biol. 2018;6:136. [DOI] [PMC free article] [PubMed] [Google Scholar]
- [33].Le Roy C, Wrana JL. Clathrin- and non-clathrin-mediated endocytic regulation of cell signalling. Nat Rev Mol Cell Biol. 2005. Feb;6(2):112–126. [DOI] [PubMed] [Google Scholar]
- [34].Luzio JP, Hackmann Y, Dieckmann NM, et al. The biogenesis of lysosomes and lysosome-related organelles. Cold Spring Harb Perspect Biol. 2014. Sep 2;6(9):a016840. [DOI] [PMC free article] [PubMed] [Google Scholar]
- [35].Napolitano G, Ballabio A. TFEB at a glance. J Cell Sci. 2016. Jul 1;129(13):2475–2481. [DOI] [PMC free article] [PubMed] [Google Scholar]
- [36].Puertollano R, Ferguson SM, Brugarolas J, et al. The complex relationship between TFEB transcription factor phosphorylation and subcellular localization. Embo J. 2018. Jun 1;37:11. . [DOI] [PMC free article] [PubMed] [Google Scholar]
- [37].Tiede S, Storch S, Lubke T, et al. Mucolipidosis II is caused by mutations in GNPTA encoding the alpha/beta GlcNAc-1-phosphotransferase. Nat Med. 2005. Oct;11(10):1109–1112. . [DOI] [PubMed] [Google Scholar]
- [38].Kim JJ, Olson LJ, Dahms NM. Carbohydrate recognition by the mannose-6-phosphate receptors. Curr Opin Struct Biol. 2009. Oct;19(5):534–542. [DOI] [PMC free article] [PubMed] [Google Scholar]
- [39].Schwake M, Schroder B, Saftig P. Lysosomal membrane proteins and their central role in physiology. Traffic. 2013. Jul;14(7):739–748. [DOI] [PubMed] [Google Scholar]
- [40].Koivusalo M, Welch C, Hayashi H, et al. Amiloride inhibits macropinocytosis by lowering submembranous pH and preventing Rac1 and Cdc42 signaling. J Cell Biol. 2010. Feb 22;188(4):547–563. [DOI] [PMC free article] [PubMed] [Google Scholar]
- [41].Amend SR, Valkenburg KC, Pienta KJ. Murine hind limb long bone dissection and bone marrow isolation. J Vis Exp. 2016. Apr;14:110. [DOI] [PMC free article] [PubMed] [Google Scholar]
- [42].Ruzankina Y, Pinzon-Guzman C, Asare A, et al. Deletion of the developmentally essential gene ATR in adult mice leads to age-related phenotypes and stem cell loss. Cell Stem Cell. 2007. Jun 7;1(1):113–126. [DOI] [PMC free article] [PubMed] [Google Scholar]
- [43].Li S, Yurchenco PD. Matrix assembly, cell polarization, and cell survival: analysis of peri-implantation development with cultured embryonic stem cells. Methods Mol Biol. 2006;329:113–125. [DOI] [PubMed] [Google Scholar]
- [44].Liu J, He X, Corbett SA, et al. Integrins are required for the differentiation of visceral endoderm. J Cell Sci. 2009. Jan 15;122(Pt 2):233–242. [DOI] [PMC free article] [PubMed] [Google Scholar]
Associated Data
This section collects any data citations, data availability statements, or supplementary materials included in this article.