Figure 4.

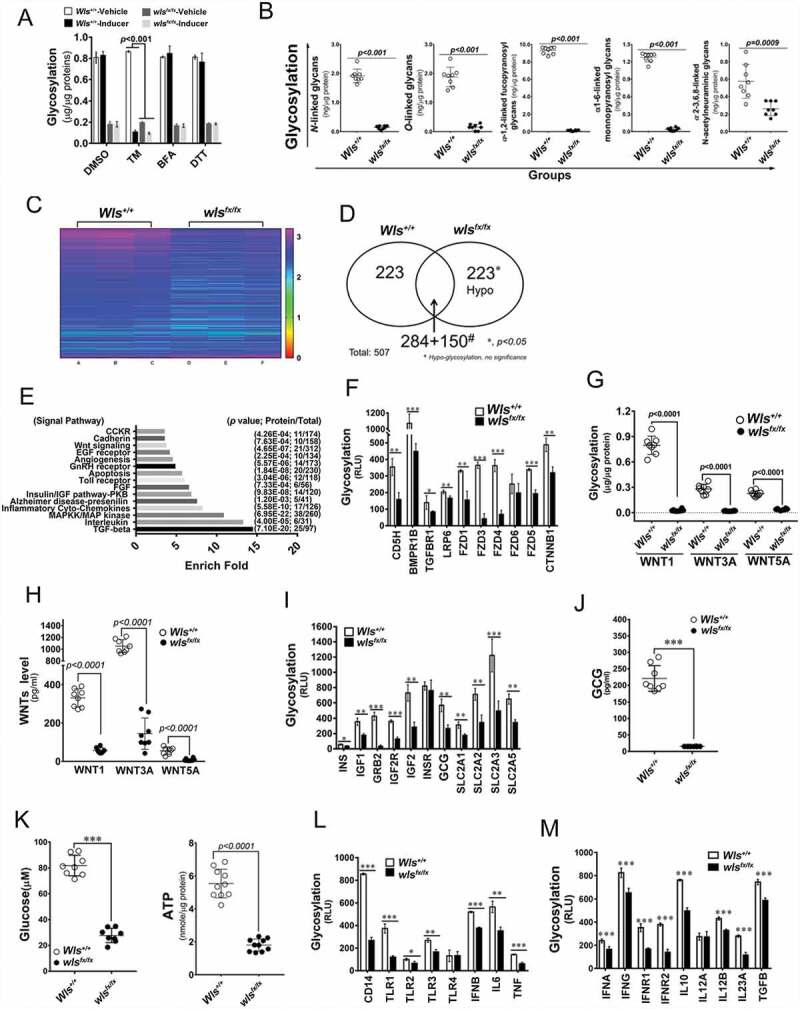
WLS-mediated molecular chaperone supercomplex modulates protein glycosylation, cytokine secretion, and cell fate in BMDCS. (A) Total glycosylation levels as measured by ELISA in BMDCs with wild-type and wls-null genotypes after TM, BFA, or DTT treatment. (B) Glycosylation levels of different kinds of glycan modification of total proteins determined by phenol-sulfuric acid method. (C) Heatmap of 507 biomarkers in wild-type and wls-null (wlsfx/fx) BMDCs; (D) Comparison of the number of hypoglycosylated proteins between wild-type and wls-null cells. #, hypo-glycosylation, no significance (*, p< 0.05); (E) GO biological process over-representation analysis with 15 signal pathways between wild-type and wls-null cells; (F) Glycosylation levels of CDH5/VE-Cadherin, BMPR1B, TGFBR1, LRP6, FZD1/Frizzled-1, FZD3, FZD4, FZD5, FZD6, and CTNNB1/β-catenin in wild-type and wls-null cells. (G) Glycosylation levels as measured by ELISA in anti-WNT1, WNT3A, and WNT5A immunoprecipitates of wild-type and wls-null BMDC. (H) Levels of WNT1, WNT3A, and WNT5A as measured by ELISA in wild-type and wls-null BMDCs. (I) Glycosylation levels of INS (insulin), IGF1, GRB2, IGF2R, INSR, GCG (glucagon), SLC2A1/GLUT1, SLC2A2, SLC2A3, and SLC2A5 in wild-type and wls-null cells. (J-K) Levels of GCG, glucose, and ATP as measured by ELISA in wild-type and wls-null BMDCs. (L) Glycosylation levels of CD14, TLR1, TLR2, TLR3, TLR4, IFNB, IL6, and TNF in wild-type and wls-null cells. (M) Glycosylation levels of IFNA, IFNG, IFNAR1, IFNGR2, IL10, IL12A, IL23A and TGFA in wild-type and wls-null cells
