Figure 2.

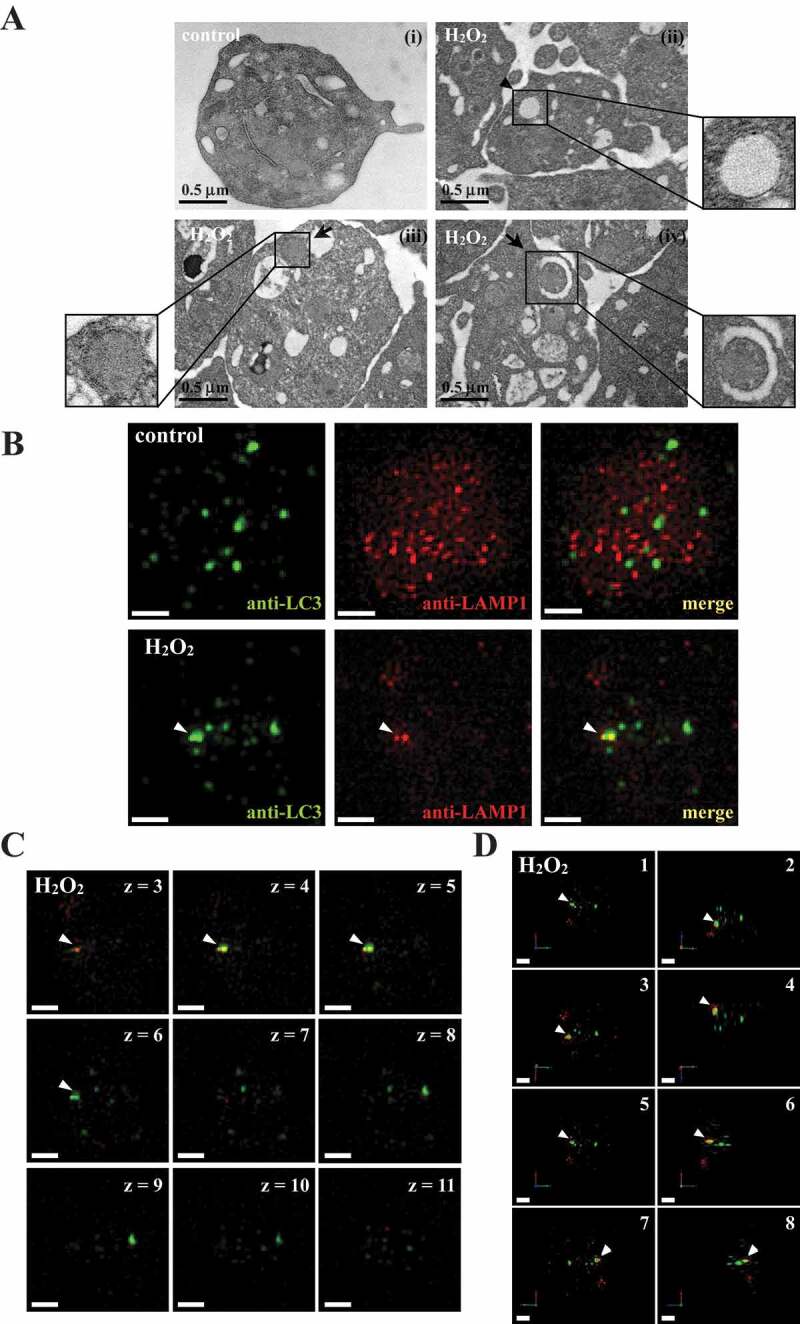
Autophagosome formation in H2O2-activated human platelets. (A) Representative transmission electron microscopic images of platelets treated (ii–iv) with or (I) without 100 μM H2O2 for 60 min. The arrowhead indicates the double-membrane autophagosome (ii) and the arrows indicate the early (iii) and late (iv) autophagosome enveloping mitochondria. Scale bar: 0.5 μm. (B) Washed platelets treated with or without 100 μM H2O2 for 60 min and then fixed. The LC3 and lysosomes were stained with anti-LC3 and anti-LAMP1 antibodies, respectively. These images were observed under a deconvolution microscope and were also captured from 2D (x-y axis). Three-dimensional (3D) autophagosome–lysosome fusion (i.e., autolysosome) was also provided in video form in Video S1. The green and red colors indicate LC3 and lysosomes, respectively. The white arrowhead indicates colocalization of LC3 and lysosome. Scale bar: 0.7 µm. (C) Different z-sections (z-axis) of the merged image of H2O2-treated platelets in (B). Scale bar: 0.7 µm. (D) Different angles (rotation) of the merged image of H2O2-treated platelets in (B). Scale bar: 0.7 µm. The profiles (A-D) are representative examples of 4 similar experiments
