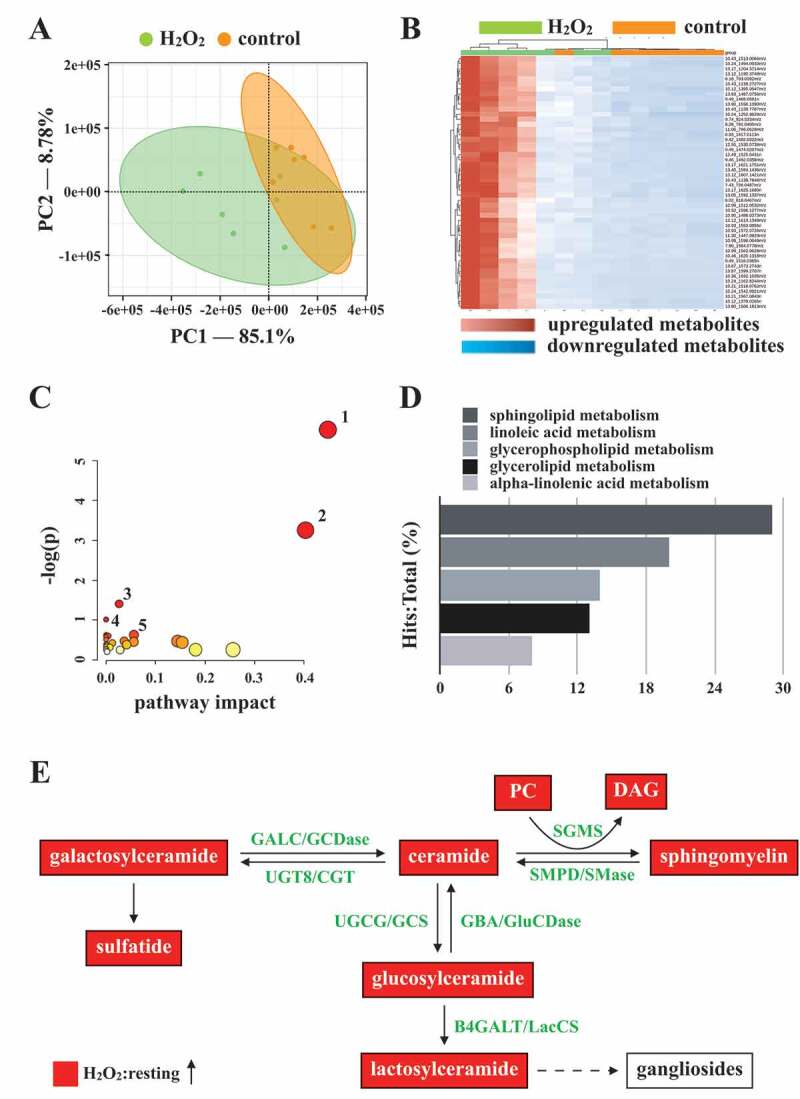
Figure 6.

Metabolic pathway analysis in H2O2-activated human platelets. Platelets were treated with or without H2O2, and subjected to Q-TOF MS analysis (n = 7). Those metabolites with significant changes between groups (P < 0.05 and fold change > 1.5) were selected and subjected to pathway analysis. (A) PLS-DA score plot, presenting the clustering of control (orange) and H2O2-treated (green) platelets. (B) Heat map indicating top 50 potential metabolites. Red in the gradient presents the increases. Blue in gradient presented the decreases. (C) Bubble map showing the rank of pathways by P values. 1, sphingolipid metabolism; 2, glycerophospholipid metabolism; 3, glycerolipid metabolism; 4, linoleic acid metabolism; 5, primary bile acid biosynthesis. (D) Photograph depicting the top 5 metabolic pathways ranked by hit rate (hits/total metabolites). (E) Schematic of sphingolipid metabolism, in which the identified metabolites are involved, in the H2O2-treated group compared with the control group. The red solid box represents upregulation. PC: phosphatidylcholine; DAG: diacylglycerol; SGMS: sphingomyelin synthase; SMPD/SMase: sphingomyelin phosphodiesterase; UGT8/CGT: UDP glycosyltransferase 8; GALC/GCDase: galactosylceramidase; UGCG/GCS: UDP-glucose ceramide glucosyltransferase; GBA/GluSDase: glucosylceramidase beta; B4GALT/LacCS: beta-1,4-galactosyltransferase
