Figure 2.

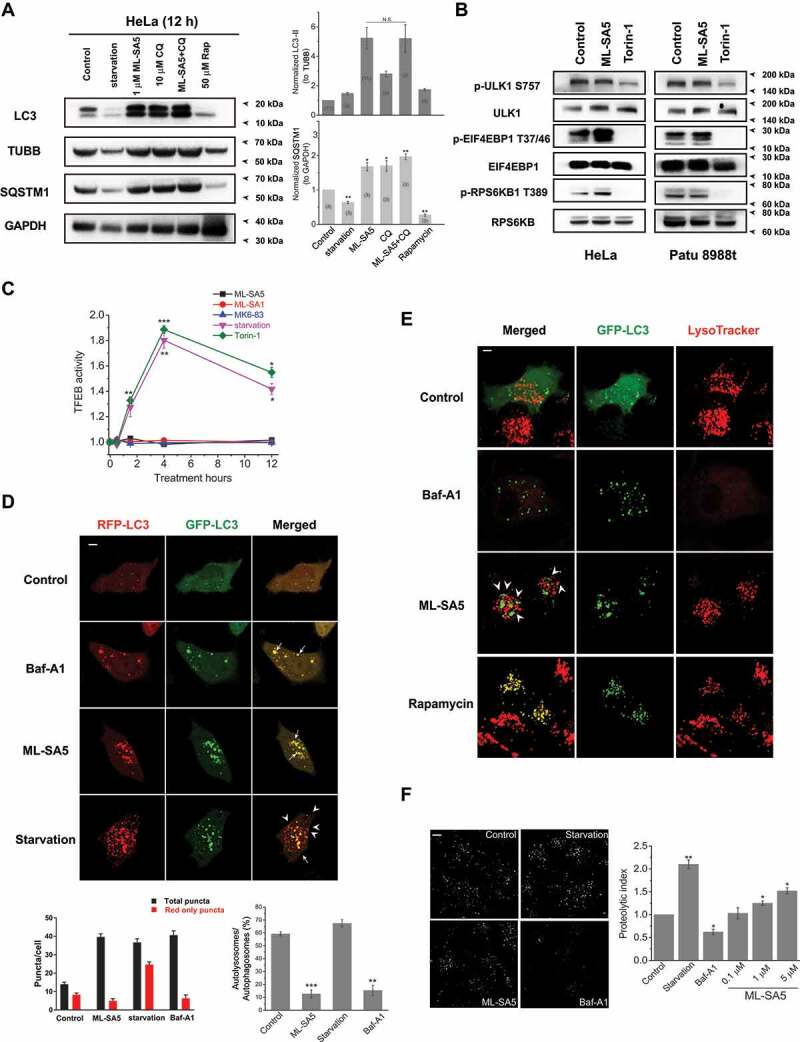
The activation of MCOLN1 arrests autophagic flux by disrupting fusion of autophagosomes and lysosomes. (A) The LC3-II and SQSTM1 levels were measured by western blot under treatments indicated in HeLa cells. Starvation (AA- and FBS-free) and rapamycin (50 μM) treatments served as positive controls for assessing SQSTM1. TUBB/beta-tubulin and GAPDH were loading controls for normalization of LC3-II and SQSTM1, respectively. (B) Phosphorylated (p-) and total ULK1, RPS6KB and EIF4EBP1 were assessed by western blot following ML-SA5 treatments (1 μM) in both HeLa and Patu 8988 t cells, respectively. Torin-1 (1 μM) treatments were positive controls for inhibiting phosphorylation of ULK1, RPS6KB and EIF4EBP1, respectively. Phosphorylated residues at S757 for ULK1, at T37/46 for EIF4EBP1 and at T389 for RPS6KB1 were investigated, respectively. All treatments were for 12 h. (C) TFEB activity was measured along conditions indicated by employing a TFEB-luciferase assay (see methods). The TFEB activities in HeLa cells under ML-SA5 (1 μM), ML-SA1 (20 μM), MK6-83 (5 μM), torin-1 (1 μM) and starvation (AA- and FBS-free) were normalized to control, respectively. n = 4. (D) Abundance of LC3 puncta as reflected by GFP and RFP fluorescence in transiently transfected tandem GFP-RFP-LC3 HeLa cells under different conditions indicated. The arrowheads indicate red puncta only, while the arrows illustrate yellow puncta (merged from red and green puncta). All treatments were for 4 h. Scale bar: 10 μm. The numbers of total (autophagosomes) and red only puncta (autolysosomes) and ratio of autolysosomes to autophagosomes were quantified from three independent experiments (typically n = 4–10 cells). Starvation was used as a positive control for inducing autophagy and Baf-A1 (1 μM) was used as a negative control for inhibiting autophagy. (E) Representative confocal images of co-localizations of autophagosomes (GFP-LC3 puncta) and lysosomes (LysoTracker) in HeLa cells under control, Baf-A1 (1 μM), rapamycin (50 μM) and ML-SA5 treatments (1 μM), respectively. The arrowheads indicate that green puncta and red puncta are adjacent to each other, but not fused. All treatments were for 4 h. Scale bar: 10 μm. (F) Representative confocal images of Cos-1 cells stained by DQ-red-BSA under treatments of control, starvation (AA- and FBS-free), ML-SA5 (1 μM), and Baf-A1 (1 μM), respectively. All treatments were for 4 h. Scale bar: 10 μm. Proteolytic index for different conditions were quantified from five to twenty images. Means ± SEMs are shown in panels A, C, D and F. Significant differences were evaluated using one-way ANOVA followed by Tukey’s test. *P < 0.05; **P < 0.01; ***P < 0.001
