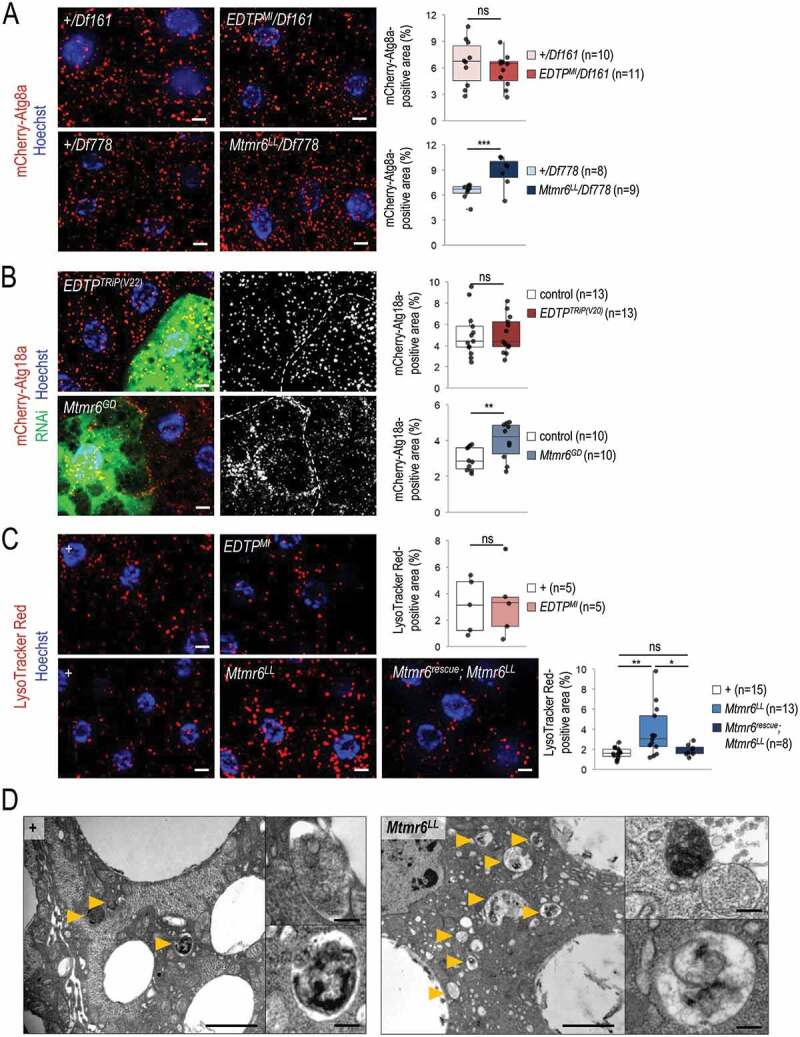
Figure 5.

In starved animals, the amount of autophagic structures is not influenced by EDTP deficiency, but becomes elevated in response to Mtmr6 inactivation. (A) Mutational inactivation of EDTP in a hemizygous background (EDTPMI/Df161) does not influence the amount of mCherry-Atg8a-positive structures. In contrast, mutation in mtmr6 in a hemizygous background (Mtmr6LL/Df778) increases the number of autophagic structures relative to control. mCherry-Atg8a (red) labels forming phagophores, autophagosomes and autolysosomes. (B) Clonal silencing of EDTP in fat body cells does not influence the quantity of mCherry-Atg18a-positive early autophagic structures. Downregulation of Mtmr6 significantly enhances the number of these structures. Clonal cells (green) treated with RNAi are outlined by white dotted lines. Analysis was performed by using hsFLP; UAS-Dcr-2; r4-mCherry-Atg18a, Act<CD2< Gal4, UAS-nlsGFP animals. (C) Defects in EDTP function do not alter the number and size of acidic compartments labeled by LysoTracker Red (LTR), as compared to control. An inactivating mutation in Mtmr6 enhances the amount of LTR-positive structures, which are effectively rescued by an Mtmr6rescue clone to nearly normal levels. LTR (red) stains acidic structures including autolysosomes. (D) Ultrastructural analysis of autophagy in fat body cells under starved condition. Starvation triggers the formation of autophagic structures including autophagosomes and autolysosomes in control animals. In Mtmr6LL mutant samples, fusing autophagic structures (right up) and digesting autolysosomes with degrading materials become abundantly apparent in response to nutritional stress (right down). Arrowheads indicate autophagic structures. Scale bar: 1 µm in large images and 125 nm in small ones. In panels A-C, Hoechst staining (blue) indicates nuclei, and scale bar: 10 μm. Fluorescence microscopy images were composed of multiple optical sections. Quantifications are shown in boxplots, *: p < 0.05, **: p < 0.01, ***: p < 0.001, ns: not significant (for statistics, see the Materials and Methods section). In panels C and D, w1118 was used as a control, indicated by “+”. Fat bodies were prepared from starved animals at the third instar feeding larval (L3F) stage
