

ABSTRACT
The hepatitis B virus X protein (HBx) is involved in the process of hepatocellular carcinoma via the activation of various oncogenes. Our previous study indicated that ARBB1 (arrestin beta 1) promotes hepatocellular carcinogenesis (HCC). However, the role of ARRB1 in HBx-related HCC remains unclear. Herein, we identified that ARRB1 was upregulated by HBx in vivo and in vitro. Arrb1 deficiency suppressed HBx-induced hepatocellular carcinogenesis in several mouse models. Furthermore, knockdown of ARRB1 blocked HBx-induced macroautophagic/autophagic flux and disrupted the formation of autophagosomes. ARRB1 interacted with HBx, and the autophagic core protein MAP1LC3/LC3, a scaffolding protein, was essential for complete autophagy. Inhibition of autophagy by 3-methyladenine or interference of ATG5 or ATG7 attenuated HBx-induced cell cycle acceleration and the subsequent proliferative response via the induction of G1/S arrest. The absence of autophagy abolished the phosphorylation of CDK2 and the activity of the CDK2-CCNE1 complex. Our results demonstrate that ARRB1 plays a critical role in HBV-related HCC via modulating autophagy and the CDKN1B-CDK2-CCNE1-E2F1 axis and indicate that ARRB1 may be a potential therapeutic target for HCC.
Abbreviations: ARRB1: arrestin beta 1; ACTB: actin beta; AMPK: adenosine monophosphate (AMP)-activated protein kinase; ATG5: autophagy related 5; ATG7: autophagy related 7; Baf A1: bafilomycin A1; CDK2: cyclin dependent kinase 2; CDKN1B/p27Kip1: cyclin dependent kinase inhibitor 1B; CQ: chloroquine; E2F1: E2F transcription factor 1; FBS: fetal bovine serum; GPCRs: G protein-coupled receptors; GST: glutathione S-transferase; HCC: hepatocellular carcinoma; HBV: hepatitis B virus; HBx: hepatitis B virus X protein; HMGB1: high mobility group box 1; HIF1A/HIF-1α: hypoxia inducible factor 1 subunit alpha; IHC: immunohistochemistry; JAK1: Janus kinase 1; LOX: lysyl oxidase; MAP1LC3B/LC3: microtubule associated protein 1 light chain 3 beta; MKI67: marker of proliferation Ki-67; MTOR: mechanistic target of rapamycin kinase; MAPK: mitogen-activated protein kinase; 3-MA: 3-methyladenine; NFKB/NF-κB: nuclear factor kappa B; PIK3CA: phosphatidylinositol-4,5-bisphosphate 3-kinase catalytic subunit alpha; PIK3C3: phosphatidylinositol 3-kinase catalytic subunit type 3; PHHs: primary human hepatocytes; RB1: RB transcriptional corepressor 1; SQSTM1/p62: sequestosome 1; STAT: signal transducer and activator of transcription; TACR1/NK1R: tachykinin receptor 1
KEYWORDS: ARRB1, autophagy, cell cycle, hepatocellular carcinoma, hepatitis B virus X protein
Introduction
The HBV genome encodes four viral gene products, one of which, the HBV X protein (HBx), is a multifunctional regulatory protein that is associated with the activation of a series of oncogenes in the initiation and development of HCC [1,2]. HBx has been confirmed to be a pleiotropic transactivator that modulates viral replication and many cellular functions, including cell proliferation, differentiation, transformation, apoptosis, drug resistance and DNA repair [3–5], and these numerous functions are closely associated with autophagy [6–8], an intracellular catabolic process by which cells recycle the cytoplasm and dispose of senescent or defective organelles to maintain cellular homeostasis.
It has been shown that autophagy increases in HBV-associated HCC [9,10] and HBx enhances the level of LC3-II in vitro through the PIK3CA-AKT-MTOR pathway, resulting in an increased level of endogenous BECN1 in response to starvation-induced autophagy [11,12]. Furthermore, crosstalk between HBx and HMGB1 (high mobility group box 1 facilitates autophagy in hepatocytes [13]. However, the specific mechanism by which HBx induces autophagy is largely unclear. Autophagy is a double-edged sword, that plays multiple roles in HCC. Mice with homozygous knockout of becn1 have notably reduced autophagic activity and a high incidence of HCC [14]. Whereas, a clinical study reports that concomitant inhibition of cytoprotective autophagy enhances the efficacy of withaferin A, an effective agent for HCC inhibition, and induction of autophagy promotes the growth of early preneoplastic rat liver nodules [15,16]. These studies highlight the importance of unraveling the function of HBx-induced autophagy in HCC for the development of new therapeutic strategies.
ARRB1 (arrestin beta 1), an important member of the arrestins beta (ARRBs) family that modulates endocytosis, desensitization, and ubiquitination of GPCRs, can scaffold various intracellular signaling networks, including the WNT, MAPK1, and NFKB/NF-κB pathways [17–19]. Prior work from our laboratory has shown that ARRB1 is involved in inflammation-mediated hepatocellular carcinogenesis, but the precise role and mechanism in HBV-related HCC is not known [20]. Recent progress in different model systems has shown a connection between ARRB1 and autophagy. Wang et al. reported that ARRB1 acts as a crucial coordinator of autophagy by interacting with BECN1-PIK3C3 and mediating neuroprotection upon ischemic stress [21]. Moreover, ARRB1 promotes liver fibrosis via autophagy-mediated Snail signaling [22]. These studies suggest that ARRB1 may mediate autophagy to regulate the development of HCC.
Tumor-associated cell cycle defects are often regulated by alterations in the subfamily of cyclin-dependent kinases (CDKs), the activity of which is modulated by several activators (cyclins) and inhibitors (CDKIs). By deregulating cell cycle checkpoint control, HBx contributes to viral carcinogenesis and exacerbates the accumulation of unrepaired transforming mutations [23,24]. Simultaneously, ARRB1 plays a significant role in the G2/M transition of glioblastoma cells in response to TCR1/NK1R (tachykinin receptor 1) activity [25]. Additionally, autophagy is closely linked with the cell cycle, exhibiting disparate biological effects under different conditions [26,27].
Here, we explored the interplay between ARRB1-mediated autophagy and the cell cycle in the development of HBV-related HCC. Our results suggest that HBx increases ARRB1 expression and that Arrb1 deficiency suppresses HBx-induced hepatocellular malignant proliferation and carcinogenesis, which is dependent on the effects of autophagy on the cell cycle. These results indicate that ARRB1 plays a vital role in HBV-related HCC via the modulation of autophagy and the CDKN1B-CDK2-CCNE1-E2F1 axis, and ARRB1 may be potential targets for HCC therapy.
Results
ARRB1 is amplified and overexpressed in HBV-related hepatocellular carcinogenesis
In this study, immunohistochemistry (IHC) staining was performed to confirm HBx and ARRB1 protein expression in 10 human normal liver tissues, 10 HBV-related chronic hepatitis tissues, 10 HBV-related liver cirrhosis tissues and 160 pairs of HBV-related HCC tumor tissues and adjacent paracancerous tissues (Figure 1A). The expression levels of HBx and ARRB1 were quantified with a pathologic histochemistry score (H-score) system. Clear HBx expression was observed in HCC and paracancerous tissues (Figure 1B). Strong positive ARRB1 staining was significantly higher in HCC and paracancerous tissues than in normal liver tissues (Figure 1C and Table S1). The level of ARRB1 mRNA was also higher in paracancerous and tumor tissues than in normal liver tissues (Figure 1D). In addition, the trend in HBx and ARRB1 protein expression by western blotting in 6 normal liver tissues and 6 pairs of HCC tissues and adjacent paracancerous tissues was consistent with the results of IHC and real-time PCR (Figure 1E, F).
Figure 1.

ARRB1 is involved in HBV-related hepatocellular carcinogenesis in patients. (A) Representative images of H&E staining and HBx and ARRB1 staining in human normal liver tissues, chronic hepatitis tissues, liver cirrhosis tissues, HCC and paracancerous tissues. Scale bar: 100 μm. (B) H-score of HBx staining in indicated tissues. (C) H-score of ARRB1 staining in indicated tissues. (D) ARRB1 mRNA levels in human normal liver tissues and HCC and paracancerous tissues. (E and F) HBx and ARRB1 protein expression in human normal liver tissues and HCC and paracancerous tissues were determined by western blotting. ACTB was used as the loading control. n = 10 in each group. (G) The correlation between HBx and ARRB1 H-score in HCC and paracancerous tissues, respectively, and the total correlation in HCC and paracancerous tissues. (H) The correlation between HBx and ARRB1 mRNA in HCC and paracancerous tissues, respectively, and the total correlation in HCC and paracancerous tissues. The Pearson correlation coefficient was used to evaluate the correlation. One-way ANOVA was used to analyze the rest of data. All values are the mean ± SD
Additionally, a significant correlation was observed between HBx and ARRB1 protein levels in HBV-related HCC and paracancerous tissues, as well as in HCC patient mixed tissues (Figure 1G). This positive correlation was also found between HBx and ARRB1 mRNA levels (Figure 1H). These data suggest that HBx may contribute, at least in part, to the upregulation of ARRB1 in HBV-related HCC. To evaluate the clinical significance of ARRB1, ARRB1 expression was examined in a tissue microarray (Fig. S1A). A correlation was not observed between ARRB1 expression status and clinical pathological features, such as gender, age, and TNM stage (Table S2). However, strong ARRB1 expression in HCC tissue but not in paracancerous tissue was positively associated with a more advanced tumor size (Fig. S1B, C). Furthermore, we used UALCAN (http://ualcan.path.uab.edu) to analyze the prognostic values of the mRNA expression level in 365 HCC patients. As shown in Fig. S1D, higher ARRB1 mRNA expression was associated with a poor survival rate in HCC patients. Moreover, our results showed that patients with stronger ARRB1 protein expression in tumors had significantly shorter survival than those with weak ARRB1 protein expression among 160 HBV-related HCC patients (Fig. S1E and Table S3).
HBx promotes ARRB1 expression in vivo and in vitro.
Our data showed that HBx and ARRB1 were significantly upregulated in HCC and adjacent paracancerous tissues in HBV-infected patients. However, it remains unknown whether ARRB1 expression is directly induced by HBx. In this study, an HBx-transgenic (HBx-TG) mouse model was used, and the male mice at 18 months developed HCC spontaneously, while no tumors developed at 4 months [28]. ARRB1 was highly expressed in hepatic tissues of HBx-TG mice compared with that of wild-type (WT) mice (Figure 2A-C, S2F). Then, we tested ARRB1 mRNA and protein expression in the immortal human liver cell line LO2, the HCC cell line HepG2, which does not express HBx, and two HCC cell lines that do express HBx, Hep3B and HepG2.2.15. The results showed increased ARRB1 mRNA and protein levels in Hep3B and HepG2.2.15 cells (Figure 2D, E). Furthermore, we transfected the HBx plasmid into LO2 and HepG2 cells and found that ARRB1 mRNA and protein expression were significantly upregulated (Figure 2F, G). However, HBx protein expression was not upregulated in Hep3B and HepG2.2.15 cells and in stable HBx-expressing LO2 (LO2-HBx) and HepG2 (HepG2-HBx) cell lines infected with HBx lentivirus after transfection with ARRB1 plasmid for 48 h (Figure 2H). We also found that ARRB1 expression was enhanced in primary human hepatocytes (PHHs) infected with HBV virions (Fig. S2A, B), and the expression of HBV genomic DNA rather than HBx-null HBV DNA increased the expression of ARRB1 (Fig. S2C, D). Previous data demonstrated that HBx enhanced ARRB1 expression in vivo and in vitro. To detect the mechanism, the interaction between HBx and ARRB1 was examined in LO2-HBx and Hep3B cells by co-immunoprecipitation, and the results showed that ARRB1 bound to HBx (Figure 2I). Furthermore, a dual-luciferase reporter system was used to confirm whether HBx targeted ARRB1. ARRB1 luciferase reporters were transfected with HBx plasmid alone with the control empty vector into 293 T cells. The results indicated that the ARRB1 reporter was activated by HBx (Figure 2J). Interestingly, HBx was found to bind directly to the ARRB1 promoter as well (Fig. S2E).
Figure 2.
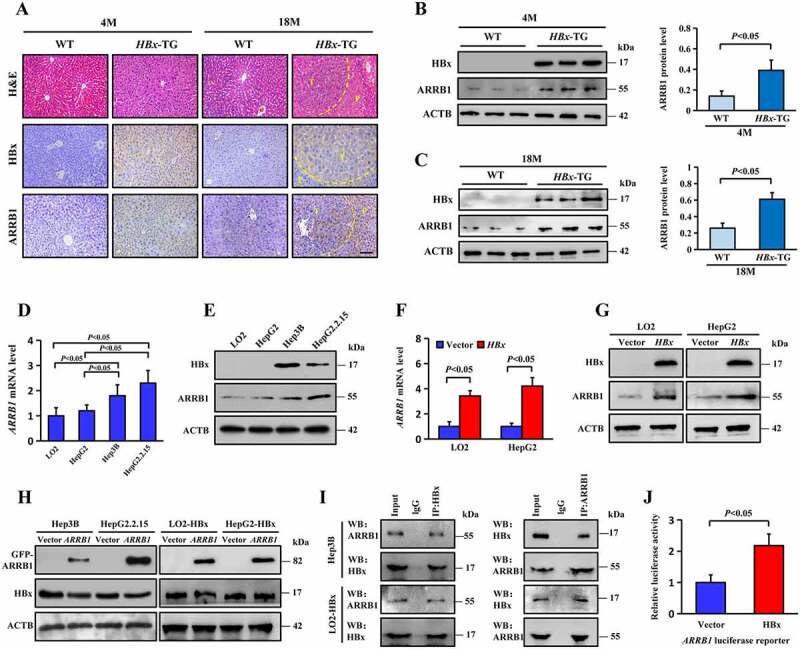
HBx induces ARRB1 expression in vitro and in vivo. (A) Representative H&E staining and HBx and ARRB1 staining of liver tissues from WT and HBx-TG mice at 4 months and 18 months. T, tumor. P, paracancerous tissue. Scale bar: 100 μm. (B and C) ARRB1 protein expression was determined by western blot analysis of liver tissues of 4- and 18-month-old mice. n = 6. Quantification from 3 independent experiments shown on the right represents the relative ARRB1 levels normalized to ACTB. (D) Relative mRNA levels of ARRB1 in LO2, HepG2, Hep3B and HepG2.2.15 cell lines. (E) Western blot analysis of ARRB1 protein levels in the indicated cells. (F) Relative mRNA levels of ARRB1 in LO2 and HepG2 cells transfected with the HA-HBx plasmid or empty vector. (G) Western blot analysis of HBx and ARRB1 proteins in cells that were transiently transfected with the HA-HBx plasmid for 48 h. (H) Western blot analysis of HBx and ARRB1 proteins in cells that were transiently transfected with the GFP-ARRB1 plasmid for 48 h. (I) LO2 cells were transiently transfected with the HA-HBx plasmid for 48 h. The cellular lysates were subjected to immunoprecipitation with anti-HBx antibody. Co-immunoprecipitated endogenous ARRB1 was detected with an anti-ARRB1 antibody as indicated. (J) HA-HBx plasmid or empty vector was co-transfected with the ARRB1 promoter construct in the luciferase activity assays. Luciferase activities relative to the Renilla control were measured after transfection. Statistical analysis was performed with Student’s t-test (two groups) or one-way ANOVA (more than two groups). All Data are mean ± SD of three experiments
Arrb1 deficiency suppresses hepatocellular carcinogenesis in HBx-TG mice
To further investigate the role of ARRB1 in HBV-related hepatocellular carcinogenesis, we generated mice with HBx expression and arrb1 deletion (HBx+/+ arrb1−/-) by crossing HBx-TG (HBx+/+ Arrb1+/+) mice and single arrb1 knockout (arrb1−/-) mice. Livers of male HBx+/+ Arrb1+/+ and HBx+/+ arrb1−/- mice were harvested at 4 months and 18 months. Tumor incidence and tumor weight and tumor size were evaluated at 18 months. Grossly identified hepatocellular carcinoma developed spontaneously in 11 male HBx+/+ Arrb1+/+ mice (11/15) and 6 male HBx+/+ arrb1−/- mice (6/15) at 18 months (Figure 3A). As shown in Figure 3B, the relative liver weight versus body weight of HBx+/+ arrb1−/- mice was reduced by 1.4-fold compared with that of HBx+/+ Arrb1+/+ mice (4.2 ± 1.2 versus 5.7 ± 1.3%). In particular, the maximal tumor size in HBx+/+ arrb1−/- mice was decreased approximately by 2.4-fold compared with that of HBx+/+ Arrb1+/+ mice (2.5 ± 0.8 versus 5.9 ± 1.4). The tumor number and average tumor size were also notably decreased in HBx+/+ Arrb1−/- mice compared to those in HBx+/+ Arrb1+/+ mice. Tumor samples were confirmed by histopathological analysis to be hepatocellular carcinoma (Figure 3C). Next, MKI67 IHC staining showed that malignant cell proliferation was dramatically suppressed, and the number of MKI67-positive cells was decreased almost twofold in HBx+/+ arrb1−/- mice compared with that of HBx+/+ Arrb1+/+ mice (Figure 3D).
Figure 3.
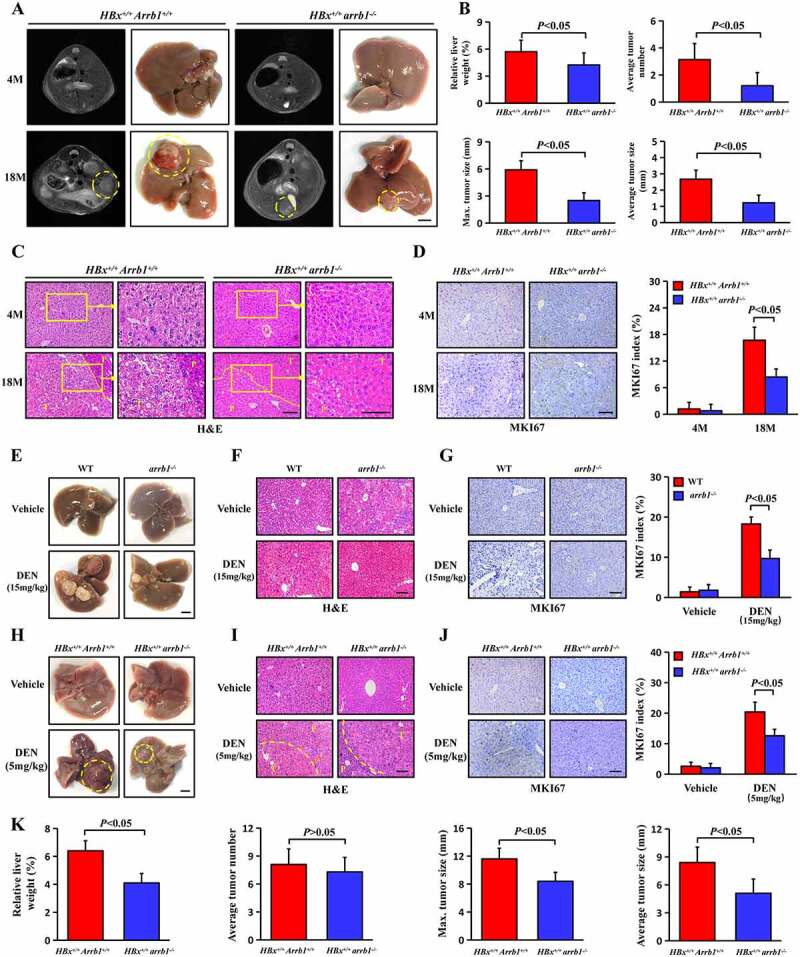
Arrb1 deficiency restrains spontaneous and low-dose DEN-induced hepatocellular carcinogenesis in HBx-TG mice. (A) MRI images and liver photographs of HBx+/+ Arrb1+/+ and HBx+/+ arrb1−/- mice at 4 months and 18 months. Scale bars: 5 mm. (B) Quantification of average liver weight as a percentage of body weight. Quantification of the average numbers of liver tumors in HBx+/+ Arrb1+/+ and HBx+/+ arrb1−/- mice at 18 months. Quantification of the maximal tumor size (diameter) in HBx+/+ Arrb1+/+ and HBx+/+ arrb1−/- mice at 18 months. Quantification of the average tumor size (diameter) in HBx+/+ Arrb1+/+ and HBx+/+ arrb1−/- mice at 18 months. n = 15 in each group. (C) Representative H&E staining of liver tissues from HBx+/+ Arrb1+/+ and HBx+/+ arrb1−/- mice at 4 months and 18 months. T, tumor. P, paracancerous tissue. Scale bars: 100 μm. (D) Representative MKI67 staining of liver tissues from HBx+/+ Arrb1+/+ and HBx+/+ arrb1−/- mice at 4 months and 18 months and MKI67 index score (n = 6 in each group). Scale bars: 100 μm. WT and arrb1−/- mice were treated with a single intraperitoneal injection of DEN (15 mg/kg). HBx+/+ Arrb1+/+and HBx+/+ arrb1−/- mice were treated with a single intraperitoneal injection of DEN (5 mg/kg). All livers were harvested at 9 months. (E) Photographs of DEN-induced liver tumors at 9 months. Scale bars: 5 mm. (F) Representative H&E staining of DEN-induced liver tumors from WT and arrb1−/- mice. Scale bars: 100 μm. (G) MKI67 staining in DEN-induced liver tumors from WT and arrb1−/- mice at 9 months and the MKI67 index score (n = 6 in each group). Scale bars: 100 μm. (H) Photographs of low-dose DEN-induced liver tumors at 9 months. Scale bars: 5 mm. (I) Representative H&E staining of low-dose DEN-induced liver tumors from HBx+/+ Arrb1+/+ and HBx+/+ arrb1−/- mice. T, tumor. P, paracancerous tissue. Scale bars: 100 μm. (J) MKI67 staining in DEN-induced liver tumors from HBx+/+ Arrb1+/+ and HBx+/+ arrb1−/- mice at 9 months and the MKI67 index score (n = 6 in each group). Scale bars: 100 μm. (K) Quantification of the average liver weight as a percentage of body weight. Quantification of the average numbers of liver tumors in HBx+/+ Arrb1+/+ and HBx+/+ arrb1−/- mice at 9 months. Quantification of the maximal tumor size (diameter) in HBx+/+ Arrb1+/+ and HBx+/+ arrb1−/- mice at 9 months. Quantification of the average tumor size (diameter) in HBx+/+ Arrb1+/+ and HBx+/+ arrb1−/- mice at 9 months. n = 10 in each group. All values are the mean ± SD. P < 0.05 using Student’s t-test
Next, 15-day-old male arrb1−/- mice without HBx expression and WT mice were injected with diethylnitrosamine (DEN, 15 mg/kg), a chemical carcinogen, to induce HCC. Tumors developed in all mice after 9 months. However, hepatocarcinogenesis was markedly repressed in single arrb1 knockout mice compared with the WT mice (Figure 3E). Tumor samples were confirmed by H&E staining to be hepatocellular carcinoma (Figure 3F). The relative tumor weight, tumor number, maximal tumor size and average tumor size were measured and are shown in Fig. S3, and these characteristics were reduced in arrb1−/- mice. MKI67 IHC staining indicated less malignant cell proliferation in arrb1−/- mice than in WT mice (Figure 3G). Additionally, male HBx+/+ Arrb1+/+ and HBx+/+ arrb1−/- mice were treated with a single injection of low-dose DEN (5 mg/kg) at 15 days of age to accelerate the development of HBx-induced tumors. Tumors developed at 9 months after DEN treatment (Figure 3H). Tumor samples were confirmed by histopathological analysis to be hepatocellular carcinoma (Figure 3I). As shown in Figure 3K, the relative liver weight versus body weight in HBx+/+ arrb1−/- mice was reduced by 1.6-fold compared with that of HBx+/+ Arrb1+/+ mice (4.1 ± 0.6 versus 6.4 ± 0.8%). HBx+/+ Arrb1+/+ mice exhibited significantly larger average tumor sizes than HBx+/+ arrb1−/- mice treated with the same dose of DEN (8.4 ± 1.6 versus 5.1 ± 1.4) and were more likely to develop large tumors. However, there was no difference in the tumor incidence in the two types of mice. Moreover, MKI67-positive cells were markedly decreased in HBx+/+ arrb1−/- mice compared with those in HBx+/+ Arrb1+/+ mice in the low-dose DEN group (Figure 3J).
Expression of HBx exacerbates autophagy in hepatocellular carcinogenesis
Autophagy, a major catabolic process that maintains cellular homeostasis, plays multiple roles in hepatocellular carcinogenesis. Previous studies have reported that HBx is involved in autophagy [29]. In this study, we investigated whether the autophagy level was significantly higher in HCC and paracancerous tissues than in normal liver tissues (Figure 4A, B). Immunofluorescence double staining of HBx and BECN1 revealed that HBx and BECN1 were expressed in many common areas (Figure 4C). High BECN1 and LC3-II expression accompanied by low SQSTM1 accumulation was detected in liver tissues of 18-month-old HBx-TG mice compared with that of WT mice (Figure 4D, E). Moreover, electron microscopy showed that the number of typical autophagosomes with double membranes was significantly increased in the liver tissues of 18-month-old HBx-TG mice compared with that of WT mice (Figure 4F). The same phenomenon was observed in LO2 and HepG2 cell lines after transfection with the HBx plasmid (Figure 4G). The accumulation of LC3 puncta indicates autophagosome formation. Transfection of the HBx plasmid increased the formation of LC3 puncta in LO2 and HepG2 cells, as shown in Figure 4H. Furthermore, western blotting showed that BECN1 and LC3-II protein increased and SQSTM1 decreased in LO2 and HepG2 cells after transfection with the HBx plasmid (Figure 4I). Treatment with chloroquine (CQ), a specific inhibitor of autophagy that prevents the acidification of lysosomes and disrupts autophagic degradation, further increased the accumulation of LC3-II in LO2 and HepG2 cells with HBx expression and resulted in less LC3-II accumulation in cells without HBx expression (Figure 4J).
Figure 4.
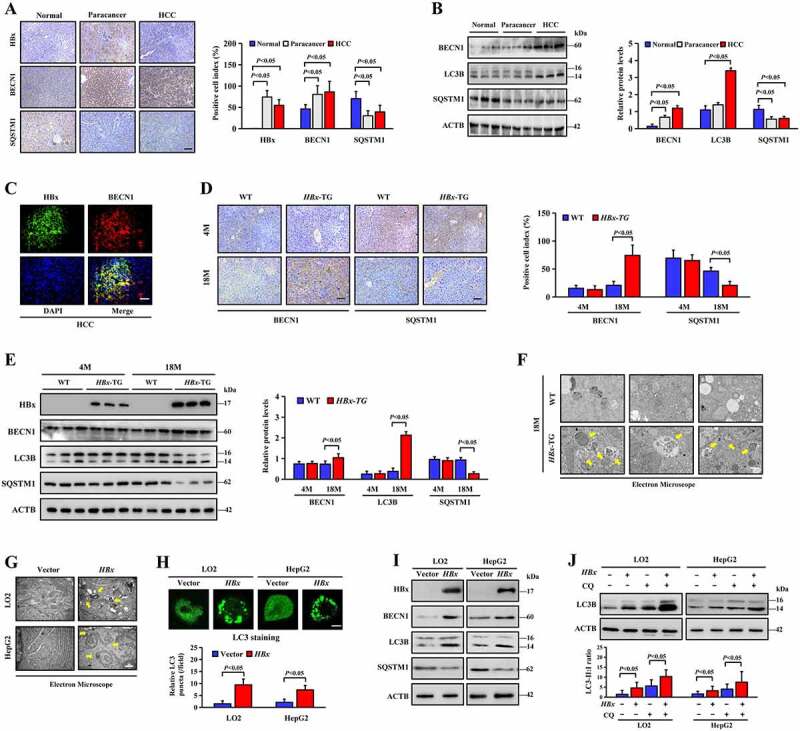
HBx enhances autophagy in hepatocellular carcinogenesis. (A) Representative images and quantification of HBx, BECN1 and SQSTM1 staining in human normal liver tissues, HCC and paracancerous tissues. Scale bar, 100 μm. (B) BECN1, LC3B and SQSTM1 protein expression in human normal liver tissues, HCC and paracancerous tissues were determined by western blotting assay. Quantification of proteins was shown in the right graph. n = 6 in each group. (C) Double immunofluorescence staining for HBx and BECN1 were performed in HCC. Nuclei was stained with DAPI in blue. Scale bar: 100 μm. (D) Representative images and quantification of BECN1 and SQSTM1 staining in liver tissues from WT and HBx-TG mice at 4 months and 18 months. scale bar: 100 μm. (E) HBx, BECN1, LC3B and SQSTM1 protein expression in the WT and HBx-TG mice liver tissues at 4 months and 18 months were determined by western blotting assay. Quantification of proteins was shown in the right graph. n = 6 in each group. (F) Autophagosomes and autolysosomes (yellow arrows indicated) were detected in the WT and HBx-TG mice liver tissues at 18 months by electron microscopy. Scale bar: 500 nm. (G) Autophagosomes and autolysosomes (yellow arrows indicated) were detected in the HA-HBx plasmid or empty vector transfected LO2 and HepG2 cells. Scale bar: 500 nm. (H) LC3 immunofluorescent staining in HA-HBx plasmid or empty vector transfected LO2 and HepG2 cells. Scale bar: 10 μm. LC3B puncta were quantified as described in Materials and Methods. (I) Western blotting analysis of HBx, BECN1, LC3B and SQSTM1 protein expression in LO2 and HepG2 cells transfected with the HA-HBx plasmid or empty vector. (J) LO2 and HepG2 cells were transfected with the HA-HBx plasmid or empty vector with or without chloroquine (CQ, 10 μM 1 h). LC3B protein was determined by Western blotting. Quantification of LC3B was shown in the graph below. All quantitative data are the mean ± SD and were obtained from 3 independent experiments. Statistical analysis was performed with Student’s t-test (two groups) or one-way ANOVA (more than two groups)
Deficiency of ARRB1 strongly suppresses HBx-induced autophagosome formation
The preceding data demonstrated that HBx promotes the expression of ARRB1 and induces autophagy in HCC. To further explore the effects of ARRB1 on the autophagic response induced by HBx, we introduced a stubRFP-sensGFP-LC3 reporter system to monitor changes in autophagic flux. Autophagosomes display GFP and RFP simultaneously, whereas when located in autolysosomes, this form of LC3 exhibits only red fluorescence because the GFP signal is sensitive to the acidic condition in the lysosome lumen. Increased red and yellow puncta in the merged image appeared distinctly in LO2 and HepG2 cells infected with HBx lentivirus. However, ARRB1 knockdown by small interfering RNA (siARRB1) resulted in the loss of fluorescent puncta, especially yellow puncta, suggesting that ARRB1 knockdown blocked autophagic flux and principally impaired the formation of autophagosomes (Figure 5A, B). Similarly, the HBx-induced increase in BECN1 and LC3B and the decrease in SQSTM1 in LO2 and HepG2 cells were attenuated after the transient transfection of siARRB1 (Figure 5C, D). Interestingly, liver tissues of HBx+/+ arrb1−/- mice at 18 months displayed lower autophagy levels than those of HBx+/+ Arrb1+/+ mice at the same age (Figure 5E, F, H), and 9-month-old arrb1-deficient mice treated with DEN (15 mg/kg) at 15 days had lower autophagy levels than the WT mice (Fig. S4). Ultrastructural analysis demonstrated typical autophagosomes in the liver tissues of HBx+/+ Arrb1+/+ mice, but autophagosomes were scarce in HBx+/+ arrb1−/- mice (Figure 5G). These data reveal that ARRB1 deficiency damages the integrated autophagy process that is triggered by HBx.
Figure 5.
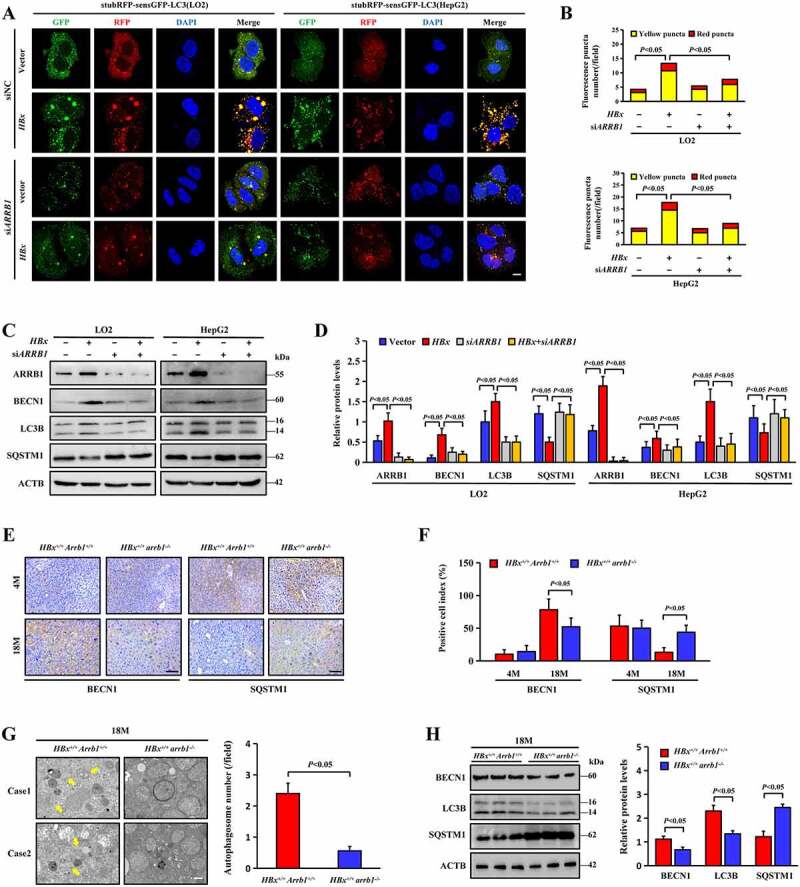
Deletion of ARRB1 inhibits HBx-induced autophagosome formation. (A) LO2 and HepG2 cells with stable HBx expression were infected with stubRFP-sensGFP-LC3 lentivirus, followed by siARRB1 or siNC for 48 h. Representative confocal microscopy images of LC3 fluorescence intensity in cells. Nuclei are highlighted with DAPI. Scale bar: 20 μm. (B) Quantification of LC3 puncta in each field. (C) ARRB1, BECN1, LC3B and SQSTM1 protein expression in cells was determined by western blotting. (D) Relative expression levels of the indicated proteins in different groups. (E) Representative images of BECN1 and SQSTM1 staining of liver tissues from HBx+/+ Arrb1+/+and HBx+/+ arrb1−/- mice at 4 months and 18 months. Scale bar: 100 μm. (F) The index of indicated positive cells was determined by counting 1000 cells/sample. n = 6 in each group. (G) Autophagosomes and autolysosomes were detected in liver tissues from HBx+/+ Arrb1+/+ and HBx+/+ arrb1−/- mice at 18 months by electron microscopy. Scale bar: 500 nm. Quantification of autophagosomes was shown in the right graph. n = 6 in each group. (H) Western blot analysis and quantification of BECN1, LC3B and SQSTM1 protein expression in liver tissues from HBx+/+ Arrb1+/+ and HBx+/+ arrb1−/- mice at 18 months. n = 6 in each group. All data are the mean ± SD. Statistical analysis was performed with Student’s t test (two groups) or one-way ANOVA (more than two groups)
ARRB1 facilitates the recruitment of HBx to the autophagy machinery
Since HBx promotes LC3B-I to transform into LC3B-II, inducing the formation of autophagosomes, and deletion of ARRB1 reversed this upregulation, we wondered whether there are specific interactions among HBx, ARRB1 and the autophagic core protein LC3B. By double immunofluorescence staining, we found that ARRB1 existed on the membranes of autophagosomes in HBx-expressing HepG2 cells (Figure 6A). Immunoprecipitation with anti-HA, anti-ARRB1, and anti-LC3B antibodies revealed that HBx interacts with both ARRB1 and LC3B, especially the LC3B-I protein (Figure 6B). Surprisingly, the interaction between HBx and LC3B was abrogated after interrupting the expression of ARRB1. In contrast, overexpression of ARRB1 enhanced the interaction between HBx and LC3B (Figure 6C, D). However, ARRB1 still interacted with LC3B in HepG2 cells that lacked HBx expression, demonstrating that HBx is dispensable for the interaction between ARRB1 and LC3B (Figure 6B). We then detected whether ARRB1 directly binds to HBx or LC3B using an in vitro glutathione S-transferase (GST) affinity isolation assay. Importantly, even in the absence of HBx, recombinant ARRB1 protein interacted with purified GST-LC3B (Figure 6E). Similarly, recombinant ARRB1 still directly interacted with GST-HBx in the absence of LC3B (Figure 6F). However, only slight amounts of GST-HBx directly interacted with LC3B weakly when ARRB1 was absent (Figure 6G). These data show that ARRB1 is required for the interaction between HBx and LC3B and promotes this association, indicating that ARRB1 targets the interaction between HBx and LC3B to regulate the autophagy machinery.
Figure 6.
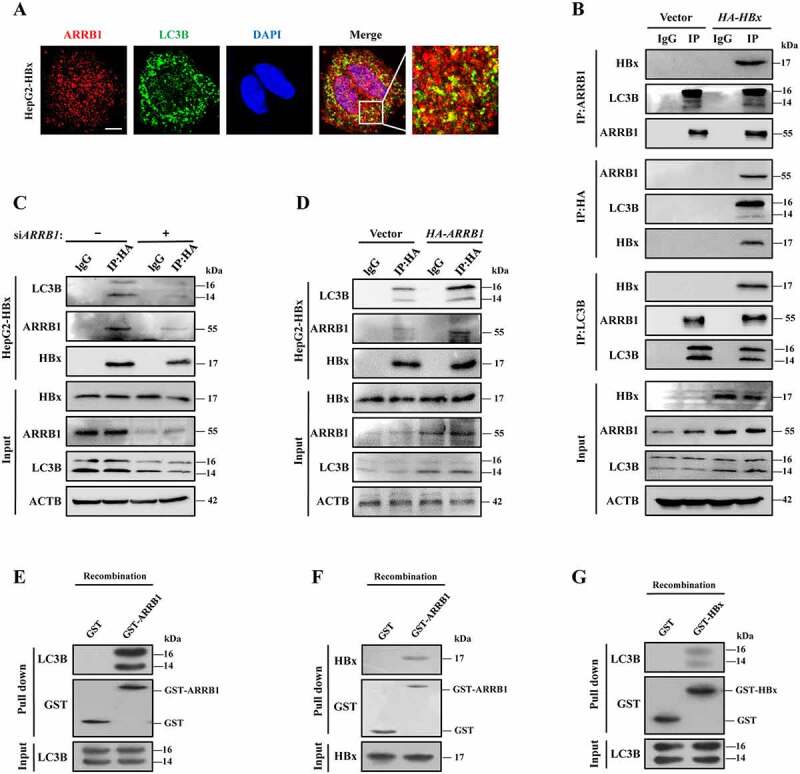
ARRB1 recruits HBx and LC3B to form a complex, resulting in the induction of autophagy. (A) Double immunofluorescent staining of ARRB1 and LC3B in stable HBx-expressing HepG2 cells. DAPI was used to stain nuclei. Scale bar: 10 μm. (B) Analysis of the interactions among LC3B, ARRB1, and HBx in HBx-expressing HepG2 cells by immunoprecipitation. At 48 h after transfection with the HA-HBx plasmid, cell lysates were immunoprecipitated with anti-ARRB1 anti-HA and anti-LC3B antibodies, and proteins were detected by immunoblot assay. IP, immunoprecipitation. (C) SiARRB1 was transfected into stable HBx-expressing cells for 48 h. Analysis of the interaction between HBx and LC3B by immunoprecipitation with anti-HA antibody. (D) The HA-ARRB1 construct was transfected into stable HBx-expressing cells for 48 h. Analysis of the interaction between HBx and LC3B by immunoprecipitation with anti-HA antibody. (E) Recombinant GST or GST-ARRB1 immobilized on glutathione resin was incubated with purified recombinant LC3B. Analysis of a direct interaction between ARRB1 and LC3B in vitro by using a GST affinity isolation assay. (F) Recombinant GST or GST-ARRB1 immobilized on glutathione resin was incubated with purified recombinant HBx. Analysis of a direct interaction between ARRB1 and HBx in vitro by using a GST affinity isolation assay. (G) Recombinant GST or GST-HBx immobilized on glutathione resin was incubated with purified recombinant LC3B. Analysis of a direct interaction between HBx and LC3B in vitro by using a GST affinity isolation assay
Inhibition of autophagy induces G1/S arrest in HBx-induced proliferation
Although the preceding results demonstrated that autophagy is exacerbated after overexpression of HBx, the specific function of the autophagy response to HBx-induced proliferation remains unclear. Therefore, we examined the effect of autophagy on the proliferation of HBx-expressing LO2 and HepG2 cells by using a 5-ethynyl-2′-deoxyuridine (EdU) incorporation assay. As shown in Figure 7A, B and Fig. S5A-C, overexpression of HBx promoted the proliferation of LO2 and HepG2 cells. Treatment with the autophagy inhibitor 3-MA or spautin-1 or interference of ATG5 or ATG7 all attenuated HBx-induced proliferation. Consistently, western blotting showed that HBx enhanced the level of the proliferation-related protein PCNA, but this effect was reversed after treatment with 3-MA or interference of ATG5 or ATG7 (Figure 7C, D and S5G, H). In serval types of cancers, autophagy is involved in cell cycle progression, which is necessary for proliferation [27,30], and thus the relationship between HBx-induced autophagy and proliferation was examined by flow cytometry. LO2-HBx and HepG2-HBx cells were made proliferatively quiescent by culture without fetal bovine serum (FBS) for 48 h and then administering 10% FBS stimulation for 24 h. The data showed that HBx-expressing cells quickly emerged from G0/G1 arrest and entered the S phase (LO2: 38.7 ± 2.3; HepG2: 45.5 ± 3.9) and nearly tripled the proliferation level compared to those cells lacking HBx (LO2: 13.3 ± 2.2; HepG2: 14.8 ± 2.4) (Figure 7E). Moreover, the levels of crucial checkpoint regulatory proteins for S phase, CCNE1 and CDK2, were enhanced by overexpression of HBx (Figure 7F, G). However, inhibition of autophagy greatly disrupted HBx-induced acceleration of S phase entry (LO2: 18.5 ± 2.1; HepG2: 21.8 ± 2.2) and blocked G1/S cycle progression (Figure 7E), and this effect was accompanied by a decrease in the level of only CCNE1 (Figure 7F, G). Meanwhile, interference of ATG5 or ATG7 showed the consistent results (Fig. S5D-H). Interestingly, obstruction of the phosphatidylinositol 3-kinase signal pathway alone cannot achieve the inhibitory effect of 3-MA on HBx-induced proliferation (Fig. S6). Taken together, our results indicate that inhibition of autophagy may suppress HBx-induced proliferation via triggering G1/S arrest.
Figure 7.
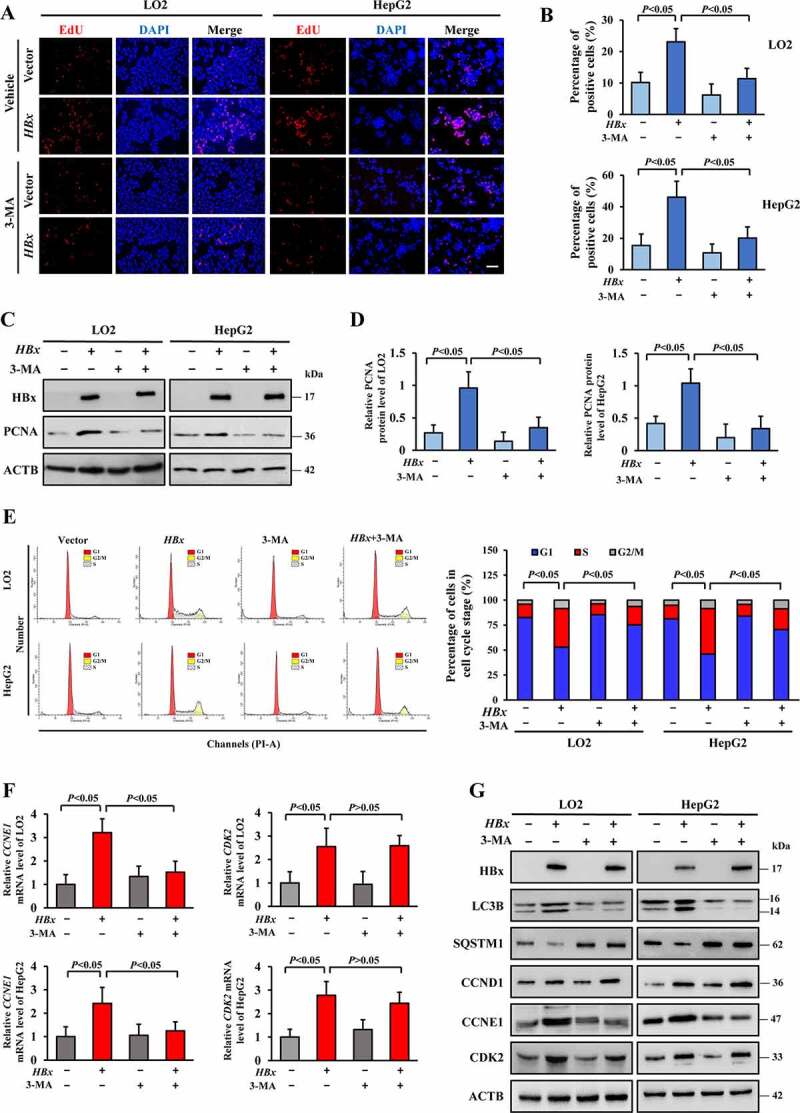
Inhibition of autophagy triggers G1/S arrest in HBx-induced proliferation. (A) The HA-HBx construct or empty vector was transfected into LO2 or HepG2 cells with or without 3-MA (5 mM) for 24 h. Cell proliferation was examined by EdU incorporation assay after treatment. Scale bar: 100 μm. (B) Quantification of positive cells in the EdU assay. The percentage of positive cells was determined by counting 1000 cells/sample. (C) Western blot analysis of HBx and PCNA protein expression in LO2 or HepG2 cells with the above treatments. (D) Quantification of the relative PCNA protein expression in LO2 or HepG2 cells. (E) Synchronized HBx-expressing LO2 and HepG2 cells were stimulated with 10% FBS with or without 3-MA (5 mM) for 24 h, followed by PI staining and flow cytometry. Cell cycle distribution among different groups. (F) mRNA levels of CCNE1 and CDK2 in different groups were detected by real-time PCR. (G) Western blot analysis of HBx, LC3B, SQSTM1, CCND1, CCNE1 and CDK2 protein expression in LO2 or HepG2 cells with the above treatments. All values are the mean ± SD. Statistical analysis was performed with one-way ANOVA
Deletion of ARRB1 blocks G1/S and is autophagy-dependent in HBx-induced proliferation
Aside from its role as a vital mediator of autophagy induction, ARRB1 has been associated with proliferation and apoptosis in previous studies [31]. We sought to determine whether autophagy is required for ARRB1-mediated cell cycle progression in HBx-induced proliferation. EdU and CCK-8 assays showed that ARRB1 knockdown dramatically suppressed HBx-induced proliferation in LO2 and HepG2 cells infected with HBx lentivirus (Figure 8A, B) and retarded the growth of Hep3B and HepG2.2.15 cells with endogenous HBx expression (Fig. S7A, B). Next, cells were synchronized at proliferative quiescence by culture without serum for 48 h and then administration of 10% FBS stimulation for 24 h. We found a dramatic decrease in the number of LO2-HBx and HepG2-HBx cells in S phase with ARRB1 knockdown compared with those without shRNA against ARRB1 (Figure 8C). Consistent with these findings, ARRB1 knockdown decreased the protein levels of CCNE1, CDK2, p-CDK2 and p-RB1 as determined by western blotting (Figure 8D, S7D). Additionally, compared with the expression in HBx+/+ Arrb1+/+ mice, lower expression levels of CCNE1, CDK2, p-CDK2, p-RB1 and MKI67 were exhibited in liver tissues of 18-month-old HBx+/+ arrb1−/- mice (Figure 8E, F, S7C).
Figure 8.
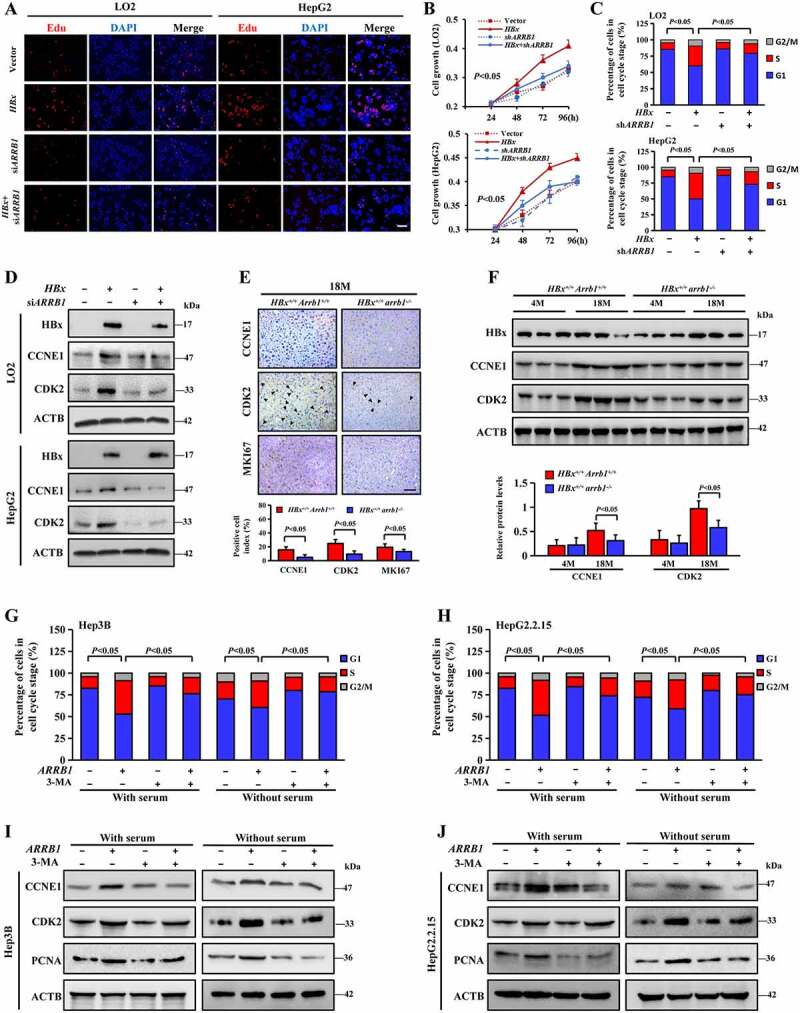
Deletion of ARRB1 promotes G1/S arrest by downregulating autophagy in HBx-induced proliferation. (A) ARRB1 was downregulated by siRNA in LO2 and HepG2 cells infected with HA-HBx lentivirus. Cell proliferation was examined by EdU incorporation assay. Scale bar: 100 μm. (B) ARRB1 was downregulated by shRNA lentivirus in stable HBx-expressing LO2 and HepG2 cells. Cell growth curve after treatment by CCK-8 assay. (C) LO2 and HepG2 cells with the above treatment were stained with PI and examined by flow cytometry and cell cycle distribution among different groups. (D) Western blot analysis of HBx, CCNE1 and CDK2 protein expression in LO2 or HepG2 cells with the above treatments. (E) Representative images and quantification of CCNE1, CDK2 and MKI67 staining in liver tissues from 18-month-old HBx+/+ Arrb1+/+and HBx+/+ arrb1−/-mice. Black triangles indicated CDK2 strong positive cells. Scale bar: 100 μm. n = 6 in each group. (F) Western blot analysis of HBx, CCNE1 and CDK2 protein expression in HBx+/+ Arrb1+/+ and HBx+/+ arrb1−/- mice at 4 months and 18 months. Densitometry of the proteins was shown in the graph below. n = 6 in each group. (G and H) Stable ARRB1-expressing Hep3B and HepG2.2.15 cells were deprived of serum for 48 h and then stimulated with 10% FBS for 24 h or deprived of serum for 24 h, followed by PI staining and flow cytometry. Cell cycle distribution among the different groups. (I and J) Western blot analysis of CCNE1, CDK2, and PCNA protein expression in stable ARRB1-expressing Hep3B and HepG2.2.15 cells with the above treatment. All values are the mean ± SD. Statistical analysis was performed with Student’s t-test (two groups) or one-way ANOVA (more than two groups)
Next, ARRB1 lentivirus was introduced into LO2 and HepG2 cells, and synchronized quiescent cells were treated with 10% FBS for 24 h, as well as 3-MA or sterile water for cell cycle analysis. The results indicated that inhibition of autophagy induced G1/S arrest and blocked ARRB1-induced S phase acceleration (Figure 8G, H). Interference of ATG5 or ATG7 showed the consistent results (Fig. S8A, B). To further confirm our investigation, serum was directly deprived for 12 h in cells to induce cycle arrest for flow cytometry analysis. The data showed that overexpression of ARRB1 blocked cycle arrest induced by serum starvation, while inhibition of autophagy reversed this effect (Figure 8G, H). Interestingly, instead of a change in CDK2, the change in CCNE1, a checkpoint regulatory protein for S phase, was consistent with the cell cycle distribution (Figure 8I, J and S8C, D). Collectively, these data indicate that blockage of G1/S by ARRB1 deficiency is dependent on the function of ARRB1 in autophagy.
HBx facilitates ARRB1-mediated autophagy to regulate G1/S, which depends on the CDKN1B-CDK2-CCNE1-E2F1 axis
Our preceding results show that inhibition of autophagy downregulates the expression level of CCNE1 but not CDK2. To investigate the mechanism by which ARRB1-mediated autophagy regulates G1/S, we detected the expression level of phospho-CDK2 and its downstream phosphorylation proteins. Western blotting showed that inhibition of autophagy failed to reduce the CDK2 protein but strikingly disturbed the HBx-induced increase in phosphorylation of CDK2 and reduced the expression level of the downstream phosphorylated target protein p-RB1 and release of the transcription factor E2F1 (Figure 9A, S9A). Consistent results were found after overexpression of ARRB1 (Figure 9B, S9B). Indeed, CDK2 only functions biologically when combined with CCNE1. To further confirm our investigation, the level of interaction between CDK2 and CCNE1 was detected by co-immunoprecipitation and showed that overexpression of HBx or ARRB1 enhanced the association between CCNE1 and CDK2, but inhibition of autophagy attenuated this interaction and complex activity (Figure 9C-F, S9C-F). CDKN1B/p27Kip1 has been identified as a negative regulator of the activity of the CDK2-CCNE1 complex [32]. We found that HBx restrained the expression of CDKN1B and that inhibition of autophagy reversed it. Furthermore, although the proteasome inhibitor lactacystin inhibited and delayed the degradation of CDKN1B (Fig. S10A), inhibition of autophagy by bafilomycin A1 or 3-MA also clearly delayed the degradation of CDKN1B (Fig. S10B, C) and enhanced the delayed effect of lactacystin in HBx-expressing HepG2 cells (Fig. S10D). In conclusion, as shown in Figure 10, these results indicated that ARRB1 may recruit HBx and LC3B, thus forming a complex to promote autophagy and maintain the cell cycle progression, and these effects are dependent on regulating the CDKN1B-CDK2-CCNE1-E2F1 axis.
Figure 9.
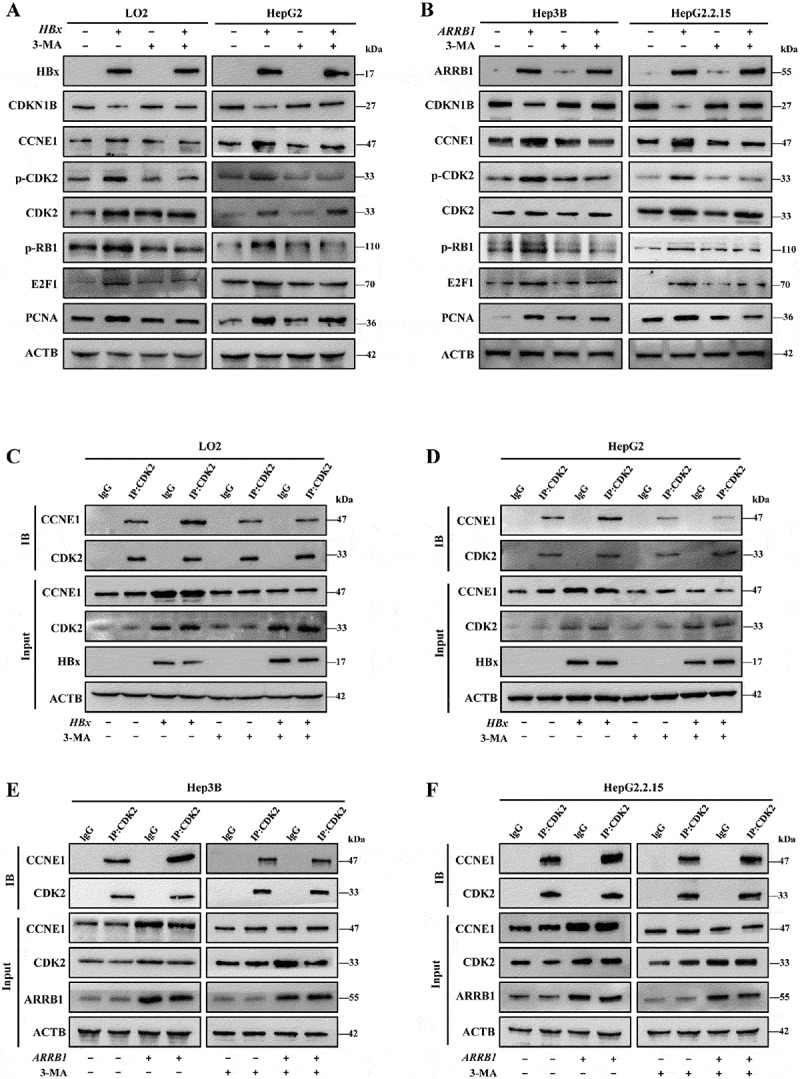
HBx promotes ARRB1-mediated autophagy to drive G1/S in a manner that is dependent on the CDKN1B-CDK2-CCNE1-E2F1 axis. (A) Western blot analysis of HBx, CDKN1B, CCNE1, p-CDK2, CDK2, p-RB1, E2F1, and PCNA protein expression in stable HBx-expressing LO2 and HepG2 cells treated with 3-MA (5 mM, 24 h). (B) Western blot analysis of ARRB1, CDKN1B, CCNE1, p-CDK2, CDK2, p-RB1, E2F1, and PCNA protein expression in stable ARRB1-expressing Hep3B and HepG2.2.15 cells treated with 3-MA (5 mM, 24 h). (C and D) Analysis of the interactions between CCNE1 and CDK2 in stable HBx-expressing LO2 and HepG2 cells with the above 3-MA treatment by immunoprecipitation. (E and F) Analysis of the interactions between CCNE1 and CDK2 in stable ARRB1-expressing HepG2 and HepG2.2.15 cells with the above 3-MA treatment by immunoprecipitation
Figure 10.
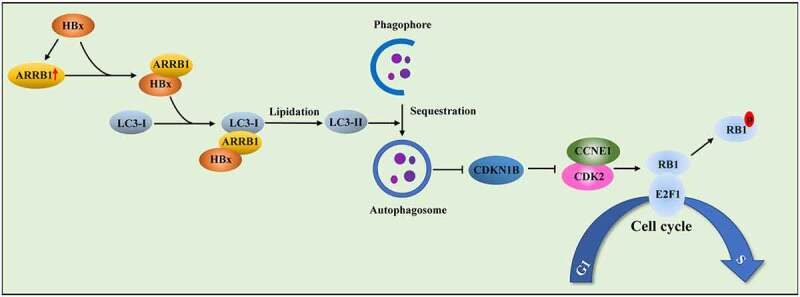
Proposed mechanism by which ARRB1-mediated autophagy drives the G1/S cycle in HBx-induced HCC. HBx enhances the expression level of ARRB1 in HCC. HBx facilitates autophagy and promotes LC3B esterification to form autophagosomes via interaction with ARRB1. HBx-induced autophagy expedites CDKN1B degradation. Inhibition of ARRB1-mediated autophagy suppresses CDK2-CCNE1 complex activity and then blocks the G1/S cycle in HBx-induced cell proliferation
Discussion
In this study, we demonstrated that ARRB1 was frequently overexpressed in HBV-related primary HCC tissues and cell lines with HBx expression but was reduced in normal human liver tissues due to the absence of HBx. By establishing spontaneous and chemically-induced HCC models in HBx+/+ Arrb1+/+ and HBx+/+ arrb1−/- mice, we first confirmed that ARRB1 deficiency inhibited HBx-related hepatocellular carcinogenesis. Moreover, ARRB1, as an autophagy scaffolding protein, facilitated the physical interaction between HBx and LC3B and was involved in HBx-induced autophagy. Our present studies also showed that the absence of ARRB1-mediated autophagy caused cell cycle arrest that was dependent on the regulation of CDK2-CCNE1 complex activity.
The causal relationship between aberrant expression of specific oncogenes and HCC in epidemiological and functional studies has been well described [33,34]. ARRB1 is a superfamily member of the arrestins beta (ARRBs), which are known as multifunctional GPCR regulatory or adaptor proteins [35]. In this study, we found that ARRB1 was commonly upregulated in patients with HBV-related HCC. This indicates the significance of the oncogenic function of ARRB1 during the initiation and development of HCC. HBx is a major risk factor for HCC and activates cell signal transduction pathways, such as the JAK1-STATs, NFKB/NF-κB, and HIF1A/HIF-1α-LOX pathways [36,37]. Our previous work reported that ARRB1 was upregulated in chemical poison-induced HCC mouse models that lacked HBx expression, although the causal relationship between HBx and ARRB1 was unclear [20]. In this study, we found that ARRB1 was increased in the liver tissues of HBV-related HCC patients and was significantly correlated with HBx expression in 160 HCC patients, suggesting that HBx gene amplification contributes to ARRB1 overexpression in HCC. Importantly, by using both in vitro and in vivo experimental models, we investigated whether HBx preceded ARRB1 production. Although HBx is not a conventional transcription factor, it has been validated to interact with the promoters of some deregulated target genes of transcription factors, such as IL17B (interleukin 17B) [38]. Here, we found that HBx could bind to the promoter of ARRB1 directly, which provided an explanation for the regulation of ARRB1 by HBx. This specific relationship led us to further explore the functional role of ARRB1 in HBV-related HCC. In contrast to other animal HCC models, a spontaneous hepatocellular carcinoma model without any chemical induction, similar to normal physiological and pathological processes in vivo, was established in HBx-TG mice. We crossbred the genetically modified mice (HBx+/+ Arrb1+/+ and HBx−/- arrb1−/-) for selected generations (HBx+/+ arrb1−/-), which revealed that arrb1 deficiency markedly restrained HBx-induced spontaneous HCC.
Previous studies have shown that HBx facilitates autophagy via activating death-associated protein kinase and sensitizes cells to starvation-induced autophagy [12,39], which is consistent with our findings that HBx promoted the course of autophagic flux in vitro and ATG expression in vivo. Interestingly, HBx-TG and WT mice at 4 months appeared no significant difference in autophagy. It may be because HBx just begins to strongly express in the hepatocytes at 4 months and there are no neoplastic nodules or HCC in the liver. In addition, we were surprised to find that ARRB1 deficiency abolished the autophagic process, particularly the formation of autophagosomes in the early stage of autophagic flux. Although previous studies have reported that ARRB1 can accommodate autophagy in different disease models, such as cerebral ischemia, diabetic nephropathy and liver fibrosis [21,22,40], to our knowledge, this is the first time that ARRB1 and autophagy have been linked concurrently in HCC. In recent research, ARRBs have been documented as crucial scaffolding proteins and multifunctional adaptors that are widely involved in protein interactions, such as the recruitment of the non-receptor tyrosine kinase family member SRC and the members of the MAPK family MAPK14 and MAPK1, in cell signal transduction pathways and cell signal regulation, such as the MAPK and PIK3CA-AKT signal pathways and insulin signaling [20,31,41]. In a cerebral ischemia model, researchers noted that ARRB1 is able to interact with BECN1 and PIK3C3 in neurons [21]. In this study, we investigated the novel mechanism by which ARRB1 acts as a vital coordinator of autophagy by interacting with HBx and LC3B to regulate the formation of autophagosomes and assist HBx in recruiting LC3B. Our GST affinity isolation assay in vitro demonstrated that ARRB1 directly binds to HBx and LC3B, whereas HBx loses the capacity to interact with LC3B when ARRB1 is absent, indicating that ARRB1 is an essential scaffolding protein that promotes HBx-induced autophagy by assisting with phagophores and the intact double layer coating of autophagosomes.
In fact, the diverse effects of autophagy in HCC have always been controversial, and previous studies confirmed that mice with heterozygous disruption of BECN1 had a high incidence of spontaneous HCC [42]. In contrast, it was reported that AMPK-MTOR-dependent autophagy activation contributed to HCC invasion and migration [43]. The cell cycle is the internal and precise master regulator of cell growth and is influenced by some autophagy-related genes [27]. However, the effect of autophagy as a multifunctional regulator on cell cycle progression in HCC remains unclear. In our present study, inhibition of autophagy or siARRB1 attenuated the resistance of HBx to cell death (data not shown). We found that HBx sensitized synchronized LO2 and HepG2 cells at proliferative quiescence upon stimulation with 10% FBS. In contrast, synchronized cells at proliferative quiescence with 3-MA treatment or interference of ATG5 or ATG7 did not show this response, which coincided with a prominent decrease in the level of CCNE1. Notably, the absence of ARRB1 weakened the HBx-mediated response to FBS stimulation on G1/S phase, accompanied by a conspicuous decrease in both the levels of CCNE1 and CDK2. Furthermore, overexpression of ARRB1 in synchronized quiescent Hep3B and HepG2.2.15 cells or serum-starved HCC cells accelerated the G1/S process and blocked G1/S arrest, which was reversed by the inhibition of autophagy. These data indicated that complete autophagy is strongly required for HBx to facilitate cell growth and that ARRB1 exerts this effect in a manner that is dependent on its function in autophagy. Although inhibition of autophagy or specific downregulation of ARRB1 both increased G1/S arrest under the same conditions, the alteration of cycle regulatory proteins was not uniform, implying that autophagy may not be the only approach by which ARRB1 affects the cell cycle. Zhang et al. reported that ARRB1 knockdown in glioblastoma cells markedly downregulated CDC25 C-CDK1-CCNB1 activity through regulating MAPK1 and p-AKT expression [44].
Sequential activation of the CDK2-CCNE1 complex and its downstream molecules is vital in the transition of cells from G0/G1 into S phase. Here, we found that inhibition of autophagy interfered with the phosphorylation of CDK2 and subsequently, the HBx-induced transformation of RB1 and E2F1 was abolished. Moreover, the activity of CDK2 declined due to an inability to conjugate with CCNE1 after inhibition of autophagy. Given that recent studies identified that the crucial CDK2-CCNE1 complex inhibitor CDKN1B degraded in a selective autophagy-dependent manner [45] and we found that inhibition of HBx-induced autophagy delayed the degradation of CDKN1B, we speculate that selective autophagy-mediated degradation of relevant cell cycle inhibitory proteins may be involved in our investigations. Interestingly, we noticed that autophagy can also be regulated by cell cycle-related proteins such as p-RB1-E2F1 and E4F1 [46,47]. Recently, it was shown that the CDK7-CDK4 signaling axis potentially triggers autophagy by activating p-RB1-E2F1 [48]. In our study, whether the CDKN1B-CDK2-CCNE1-E2F1 axis affects autophagy is worth further study.
In summary, we demonstrated an unknown relationship among autophagy, ARRB1 and the cell cycle in HBV-related HCC. HBx facilitated the amplification and overexpression of ARRB1, which is an important carcinogenic factor that promotes cell proliferation by modulating G1/S in an autophagy-dependent manner. A crosstalk occurs between autophagy regulation and ARRB1, which recruits HBx and LC3B to form a complex. In view of the role of ARRB1 in HBV-related HCC, our findings provide novel insight into the molecular mechanisms underlying the regulation of autophagy and the aberrant cell cycle in HBV-related HCC. Additionally, ARRB1 may serve as an independent prognostic biomarker for HCC patients, and manipulation of ARRB1-mediated autophagy offers promising clinical therapeutic directions for HCC.
Materials and methods
Tissue samples
Normal liver tissue specimens were obtained 2 cm from the parahemangioma sites of 10 hepatic hemangioma patients without hepatitis virus infection. Hepatitis specimens were obtained from 10 chronic hepatitis B patients and samples of liver fibrosis were obtained from 10 HBV-infected liver fibrosis patients before any therapeutic intervention. 160 paired tissue specimens from HCC and paracancerous tissues, taken from more than 2 cm from the edge of the tumors, were obtained during operations on HCC patients with hepatitis B virus infection before any therapeutic intervention (Table S2). The exclusion criteria were the presence of other causes of liver disease, including alcoholic liver disease, hepatitis C virus infection, nonalcoholic fatty liver disease, and other liver diseases. Histological verification of all specimens was subsequently performed. The tumor–node–metastasis (TNM) stage of HCC tissues was evaluated according to the criteria of the seventh edition of the TNM classification of the American Joint Committee on Cancer. A total of 160 patients were regularly followed up, and the median follow-up duration since the time of diagnosis was 35 months (range 3–140 months). The study protocol was approved by the Research Ethics Committee of The Third Affiliated Hospital of Sun Yat‐Sen University ([2014]2‐7). Informed consent was obtained from all patients. The UALCAN (http://ualcan.path.uab.edu) website [49] was used for the survival analysis of 365 HCC patients based on The Cancer Genome Atlas (TCGA) datasets.
Cell culture and treatments
Three HCC cell lines (HepG2, Hep3B, Hep2.2.15) and one immortalized hepatocyte cell line (LO2) and HEK-293 T cell line were used in this study, which were cultured in Dulbecco’s modified Eagle’s medium (Gibco BRL, Rockville, MD, USA) supplemented with 10% fetal bovine serum (Gibco BRL) in an incubator with 5% CO2 at 37°C. HepG2 (HB-8065), Hep3B (HB-8064) and HEK-293 T (CRL-3216) cell lines were obtained from the American Type Culture Collection. LO2 and HepG2.2.15 cell lines were provided by the Guangdong Provincial Key Laboratory of Liver Disease Research, China. For drug intervention, cells were treated with autophagy inhibitors purchased from Selleck, including 5 mM 3-MA (S2767), 10 μM chloroquine (S4157), 100 nM bafilomycin A1 (S1413), and 10 μM spautin-1 (S7888), or the proteasome inhibitor 5 µM lactacystin (Sigma, 426100), or PIK3R3 (phosphoinositide-3-kinase regulatory subunit 3) inhibitor 2 µM CZC24832 (Selleck, S7018).
Mice and treatments
HBx+/+ and WT (HBx−/-) littermates on a mixed genetic background (C57BL/6 and CBA) were derived from HBx heterozygous transgenic male and female mice (kindly provided by Dr. DY Yu, Korea Research Institution of Bioscience and Biotechnology, Korea). WT (Arrb1+/+) and arrb1−/- littermates on C57BL/6 background were derived from heterozygote intercrosses (kindly provided by Dr. R. J. Lefkowitz, Duke University Medical Center, Durham, NC, USA). HBx+/+ arrb1−/- and HBx+/+ Arrb1+/+ littermates were generated from the cross between HBx+/+ mice and arrb1−/- mice. Genotyping was performed as previously described [20,28]. Male mice were used in all studies. The mice were housed in microisolator cages under a 12-hour dark-light cycle (lights on at 8:00 a.m.) with food and water ad libitum. The sedative consisted of xylazine (15 mg/kg), and ketamine (50 mg/kg) was given intraperitoneal as the anesthesia. Carbon dioxide inhalation was used as method of euthanasia. Animal research protocols were authorized by the Institutional Animal Care and Use Committee at the Third Affiliated Hospital of Sun Yat-Sen University. In the spontaneous HCC model, HBx+/+ Arrb1+/+and HBx+/+ arrb1−/- mice were sacrificed at 18 months. In the DEN (Sigma, N0756)-induced HCC model, 15 mg/kg DEN was intraperitoneally injected for 15-day-old Arrb1+/+ and arrb1−/- mice, and low-dose DEN (5 mg/kg) was performed for 15-day-old HBx+/+ arrb1−/- and HBx+/+ Arrb1+/+ mice in the same manner. These mice were sacrificed after 9 months. The equivalent volume of physiological saline was intraperitoneally injected as vehicle treatment. The number and size of surface tumor nodules in each liver lobe and the weight of livers were measured and recorded.
MRI scans in HCC mice model
Mice were anaesthetized with isoflurane at room temperature and then detected in a 7.0 T MRI tomograph (Bruker PharmaScan PharmaScan70/16, Ettlingen, Germany) with continuous narcosis. Respiratory and heart rate of the mice were monitored during MRI imaging.
Transient transfection, generation of stable cell lines and RNA interference
The HA-HBx plasmid, which carries inserts encoding HA-HBx, was cloned into the pcDNA3.1 vector as described previously [11]. The ARRB1-expressing vector was constructed as our previous study [20]. Plasmid with the 1.3-mer HBV genomic DNA was a gift from Wang-Shick Ryu (Addgene, 65459) and the HBV 1.3-mer X-null replicon was a gift from Wang-Shick Ryu (Addgene, 65461). Transient transfection was performed using Lipofectamine 3000 reagent (Invitrogen, L3000) according to the manufacturer’s protocol.
To generate stable HBx-overexpression cell lines (LO2-HBx, HepG2-HBx) and stable ARRB1-overexpression cell lines (Hep3B-ARRB1, Hep2.2.15-ARRB1), lentiviral vectors pLenti-HBx-HA-Zeo and pLenti-ARRB1-HA-puromycin (GeneChem, China) were constructed and used for corresponding cells by lentivirus-mediated transfection. Small interfering RNA siARRB1 (5ʹ- GTCACCAACAACACCAACA-3ʹ), siATG5 (5ʹ- CCTTTCATTCAGAAGCTGTTT −3ʹ) and siATG7 (5ʹ-GCCTCTCTATGAGTTTGAA-3ʹ) targeting the coding region of the respective mRNA, were used according to the manufacturer’s instructions (Gene Pharma, China). ARRB1-shRNA and shNC were cloned into the lentiviral vector GV112 (GeneChem, 0112). Stable transfections were selected with respective antibiotics for 2 weeks before the following experiments.
Immunohistochemical and immunofluorescence analysis
Immunohistochemistry was performed on paraffin sections as described in our previous study [20]. For staining in tissue samples, the slides were incubated with primary antibodies against HBx (Genetex, 22741), ARRB1 (Abcam, ab32099), MKI67 (Abcam, ab15580), BECN1 (Proteintech, 11306), and SQSTM1/p62 (Proteintech, 18420). For IHC staining, the targeted protein was detected using respective secondary antibodies (Beyotime, A0208; Beyotime, A0216) and the sections were counterstained with hematoxylin. For immunofluorescence staining, targeted proteins were detected by corresponding secondary antibodies (Alexa Fluor 488-conjugated goat anti-rabbit, A-11008; Alexa Fluor 488-conjugated goat anti-mouse, A-11001; Alexa Fluor 594-conjugated goat anti-rabbit, A-11012) purchased from Invitrogen. DAPI (Invitrogen, D1306) was used to stain nuclei. The index of positive cells was determined by counting 1000 cells/sample.
For immunofluorescence staining in cell samples, cells were fixed with 4% paraformaldehyde for 20 min at room temperature and incubated with 0.5% Triton X-100 (Beyotime, ST797) to increase membrane permeability. After washing with PBS (Beyotime, C0221), cells were probed with primary anti-LC3B (Sigma, L7543) at 4°C overnight. After 3 washes with PBS, the cells were incubated with Alexa Fluor 488-conjugated goat anti-rabbit antibody at room temperature for 2 h. Under confocal microscopy (Leica, TSC SP8, Germany), the puncta-like structures per field (20 × magnification) were counted. For double immunofluorescence staining, cells were incubated with HBcAg (Abcam, ab8637) and HBx (Genetex, 22741) or ARRB1 (Abcam, ab32099) and LC3B (Cell Signaling Technology, 83506) primary antibodies and detected by corresponding secondary antibodies.
Histochemistry score (H-score) system
H-score was performed on tissue microarrays after immunohistochemical staining as described in a previous study [50]. The percentage of immunostaining and the staining intensity of tumor cells (0, negative; 1, weak; 2, intermediate; 3, strong) were recorded. The formula for the H-score is: H-score = Σ(I × Pi) = (percentage of cells of weak intensity × 1) + (percentage of cells of moderate intensity × 2) + (percentage of cells of strong intensity × 3), where I = intensity of staining and Pi = percentage of stained tumor cells, giving a range of 0 to 300. The scoring was assessed by Quant Center software.
Tandem stubRFP-sensGFP-LC3 fluorescence microscopy
Tandem stubRFP-sensGFP-LC3 lentiviruses were purchased from GeneChem company (China) and used to monitor autophagy flux. To assess tandem fluorescent LC3 puncta, 48 h after tandem stubRFP-sensGFP-LC3 lentiviruses were transfected alone or with siARRB1 co-transfected into LO2-HBx and HepG2-HBx, and then the cells were washed with PBS three times, and fixed with 4% paraformaldehyde. DAPI (Invitrogen, D1306) was used to stain nuclei. Images were obtained by a confocal microscope.
RNA extraction and real-time PCR
Total RNA was extracted using TRIzol (Invitrogen, 15596–018) and transcribed into cDNA using a High Capacity cDNA Kit (TOYOBO, FSQ101). For the quantitative real‐time polymerase chain reaction (PCR) analysis, aliquots of cDNA were amplified using gene‐specific primers and ChamQ SYBR qPCR Master Mix (Vazyme, Q411) in a real‐time PCR system (Bio‐Rad, CA). Each sample was tested in triplicate.
The sequences of primers:
HBx sense 5ʹ-TACCGTCCCTTGCTTTCTCT-3ʹ
antisense 5ʹ-CAGAGGTGAAGCGAAGTGC-3ʹ
ARRB1 sense 5ʹ-CCGAGGACAAGAAGCCACTGA-3ʹ
antisense 5ʹ-AGAGTGACTGAGCATGGAAGGT-3ʹ
CCNE1 sense 5ʹ-AAGGAGCGGGACACCATGA-3ʹ
antisense 5ʹ-ACGGTCACGTTTGCCTTCC-3ʹ
CDK2 sense 5ʹ-CCAGGAGTTACTTCTATGCCTGA-3ʹ
antisense 5ʹ-TTCATCCAGGGGAGGTACAAC-3ʹ
ACTB sense 5ʹ- GTCTTCCCCTCCATCGTG-3ʹ
antisense 5ʹ- AGGGTGAGGATGCCTCTCTT-3ʹ
Western blotting analysis
Total protein extractions were analyzed by western blotting as previously described [20]. Western blotting was performed using antibodies against HBx (Genetex, 22741), ARRB1 (Abcam, ab32099), BECN1 (Proteintech, 11306), SQSTM1/p62 (Proteintech, 18420), LC3B (Sigma, L7543), CCNE1/cyclin E1 (Abcam, ab71535), CCND1/cyclin D1 (Cell Signaling Technology, 55506), CDK2 (Abcam, ab32147), p-CDK2 (Cell Signaling Technology, 2561), p-RB1 (Cell Signaling Technology, 8516), E2F1 (Abcam, 179445), ATG5 (Abcam, 108327), ATG7 (Abcam, 52472), CDKN1B (Cell Signaling Technology, 3686), HBcAg (Abcam, ab8637) and ACTB (Sigma, A5441). Nitrocellulose membranes with proteins were incubated with primary antibodies at 4°C overnight and corresponding secondary antibodies at room temperature for 2 h. Proteins were visualized using ECL western blotting detection reagents (Advansta, K12045). The quantitative densitometry of the indicated proteins except LC3 was normalized to ACTB. The densitometry of LC3 was calculated by LC3-II:I ratio.
Immunoprecipitation and GST affinity isolation assay
For immunoprecipitation, cells were lysed in Pierce™ IP Lysis Buffer with protease inhibitor cocktail (Thermo Scientific, 78430). The lysate was precleared with protein A magnetic beads (Bio-ray, 1614013) at 4°C overnight and then incubated with anti-ARRB1, anti-HBx, anti-LC3B, or anti-CCNE1 antibody respectively at room temperature for 2 h. The magnetic beads were washed 3 times with PBST (0.1% Tween- 20 [Beyotime, ST825]) and boiled at 70°C for 10 min. Boiled samples were subjected to immunoblot analysis. IgG antibodies (Beyotime, A7016; Beyotime, A7028) from the corresponding species were used as a control.
For the GST affinity isolation assay, GST and GST-HBx proteins were prepared as previously described [29]. In brief, E. coli BL21 (DE3) (Vazyme, C504) transformed with pGEX-6P-1-ARRB1, pGEX-6P-1-HBx or pGEX-6P-1 was induced with 1 M IPTG (1/1000 of bacterial liquid volume) on a rotating wheel at 20°C for 16 h. After centrifugation of the bacterial lysate, the sediment was loaded with 0.01 M PBS containing 1% Triton X-100 (Beyotime, ST797) and PMSF (Beyotime, ST506). The supernatant was obtained by ultrasonication (8 pulses, 10 s each) and centrifugation. To purify the bait proteins, bait proteins were immobilized on 50% glutathione-sepharose 4B slurry (Thermo Fisher, 21516) at 4°C for 2 h. The supernatant was discarded after centrifugation. The sepharose was washed 3 times with PBS. After incubation with HepG2 cell lysate for 2 h at 4°C on a rotating wheel, glutathione-sepharose was washed 5 times with wash solution. Elution was carried out using buffer containing washed glutathione and boiled in SDS sample buffer, and loaded onto SDS-PAGE gels. The GST pull down assay was performed following the instruction of the GST Protein Interaction Pull-Down Kit (Thermo Fisher, 21516).
Cell viability and cell growth assay
The 5-ethynyl-20-deoxyuridine (EdU) and cell counting kit-8 (CCK-8) assays were used to measure cell viability and growth. The cells were incubated with EdU (Ribobio, China) for 2 h according to the manufacturer’s instruction. Cells were visualized under a fluorescence microscope. Exponentially growing cells (1 × 10³/well) were seeded into 96-well plates. The plates were then incubated at 37°C and 5% CO2 for 24 h to 96 h. Subsequently, 20 μl CCK-8 (DOJINDO, CK04) solution was added to 180 μl culture medium. After 3 h at 37°C, the absorbance was measured at a wavelength of 450 nm. The experiments were performed in triplicate wells and three times independently.
Cell cycle distribution analysis
Cells were planted in 6-well plates (1 × 10⁴/well) in DMEM medium without serum for 48 h to make proliferative quiescent and then stimulated with 10% FBS for 24 h. Another way to treat cells was to deprive serum for 24 h directly and subsequently detect the cells by flow cytometer. After the corresponding treatment, cells were washed three times with PBS, harvested, and fixed with ice-cold 70% ethanol at 4°C overnight. Cells were washed three times with PBS again and resuspended in 50 μg/ml propidium iodide (KeyGEN, KGA512). The cells were sorted by a FACS Calibur flow cytometer (BD Biosciences), and cell cycle distributions were analyzed using ModFit LT 4.1 software (Verity Software House, Topsham, ME). All experiments were performed three times in triplicate.
ARRB1 reporter assay
293 T cells (2 × 10⁴/well) were plated in 24-well plates and transfected with the expression plasmid pcDNA3.1-HBx-HA or the vector pcDNA3.1-HA (400 ng/well) using Lipofectamine 3000 (Invitrogen, L3000). For each transfection, 200 ng of the pGL4.1-ARRB1 luciferase reporter plasmid and 5 ng of the renilla plasmid as a control were used. Luciferase activities were detected by the Dual-Luciferase reporter assay system (Promega, E1910) according to the manufacturer’s instructions with a Lumat LB 9507 luminometer (Berthold, Nashua, NH).
Chromatin immunoprecipitation (ChIP) Assay
ChIP assay was performed following the instruction of SimpleChIP® Plus Enzymatic Chromatin IP Kit (Cell Signaling Technology, 9005). Briefly, cells cultured in 10-cm culture dishes were cross-linked using 1% formaldehyde at room temperature for 10 min. After centrifugation, the resulting pellets were sonicated and for each ChIP, the chromatin solution was precleared with 30 μl of ChIP-grade protein G magnetic beads. Subsequently, the precleared lysate and the mixtures were incubated with specific antibodies at 4°C overnight on a rotating wheel. The ChIP-enriched DNA was analyzed by real-time PCR using the specific primers (ARRB1: sense 5ʹ- CTGCAGAAACAACAGGTGGC-3ʹ antisense 5ʹ- CTCTGGGCAATGTTAGGAGCT-3ʹ), and the data from the real-time PCR were normalized to the values of the same input sample.
Transmission electron microscopy
Fresh liver tissues were fixed with ice-cold 2.5% glutaral overnight. Electron microscopy samples were performed by the electron microscopy core lab of Sun Yat-Sen University with a transmission electron microscope (JEOL, Tokyo, Japan). Images were acquired digitally from a randomly selected pool of 10 to 15 fields in each group.
HBV infection
Primary human hepatocytes (ScienCell, 5200) were infected by inoculation with HBV-containing human serum from highly viremic, acutely infected patients without antiviral agent and 4% PEG8000 (Beyotime, ST483) at 37°C overnight. Afterward, the medium containing patients serum was removed. PHHs were washed with PBS 5 times and maintained in complete culture medium (ScienCell, 5201) containing 2% dimethylsulfoxide (Sigma, D2650). The control cells were cultured with FBS-containing complete culture medium all the time. Cells and culture medium were collected 5 days after infection and used for follow-up tests. The level of HBV DNA in culture medium was quantified by the COBAS® TaqMan 48® assay (Roche).
Statistical analysis
The results are expressed as mean ± standard deviation (SD). A statistical analysis was performed using GraphPad Prism 6.01 and SPSS 22.0. Statistical significance was calculated with Student’s t-test between two selected groups or one-way ANOVA analysis in comparisons of multiple groups. The chi‐square test was used to compare patient characteristics and distributions of expression and covariates by vital status. The Pearson correlation coefficient was used to estimate the correlation between the gene and protein expression levels of HBx and ARRB1 in the patient specimens. The hazard ratio for death associated with the ARRB1 expression status was estimated by univariate analyses. Multivariate survival analysis was carried out on all parameters that were significant at the univariate level using the Cox regression model. Overall survival in relation to expression was assessed by the Kaplan-Meier survival curve and the log-rank test. Statistical significance was set at P < 0.05.
Supplementary Material
Acknowledgments
We thank Professor Robert J. Lefkowitz at Duke University for providing the arrb1-knockout mice, Professor DY Yu at the Korea Research Institution of Bioscience and Biotechnology for providing the HBx-transgenic mice, Professor G. Pei at the Institute of Biochemistry and Cell Biology, Shanghai Institutes for Biological Sciences, and the Chinese Academy of Sciences for providing the ARRB1 plasmids.
Funding Statement
Funding: This project was partially supported by the National Natural Science Foundation of China [82070574, 81602122], the Natural Science Foundation Team Project of Guangdong Province [2018B030312009], and the Breeding Foundation for Young Pioneers’ Research of Sun Yat-sen University (17ykpy53);Young Teacher Foundation of Sun Yat-sen University [17ykpy53];
Disclosure statement
The authors declare that they have no competing interests.
Ethics approval and consent to participate
Study protocols were approved by the Ethics Committee of the Third Affiliated Hospital of Sun Yat-Sen University. Informed consent was obtained from all participants included in this study according to the committee regulations. All animal experiments and relevant details were conducted in accordance with the approved guidelines and were approved by the committee on Animal Care and Use of Sun Yat-Sen University.
Consent for publication
All authors agree with the content of the manuscript.
Availability of data and materials
The datasets used and/or analyzed during the current study are available from the corresponding author on reasonable request.
Supplementary material
Supplemental data for this article can be accessed here.
References
- [1].Xu QG, Yuan SX, Tao QF, et al. A novel HBx genotype serves as a preoperative predictor and fails to activate the JAK1/STATs pathway in hepatocellular carcinoma. J Hepatol. 2019;70:904–917. [DOI] [PubMed] [Google Scholar]
- [2].Chan C, Thurnherr T, Wang J, et al. Global re-wiring of p53 transcription regulation by the hepatitis B virus X protein. Mol Oncol. 2016;10:1183–1195. [DOI] [PMC free article] [PubMed] [Google Scholar]
- [3].Wang J, Li N, Huang ZB, et al. HBx regulates transcription factor PAX8 stabilization to promote the progression of hepatocellular carcinoma. Oncogene. 2019;38:6696–6710. [DOI] [PubMed] [Google Scholar]
- [4].Chen SL, Liu LL, Lu SX, et al. HBx-mediated decrease of AIM2 contributes to hepatocellular carcinoma metastasis. Mol Oncol. 2017;11:1225–1240. [DOI] [PMC free article] [PubMed] [Google Scholar]
- [5].Wang X, Li Y, Mao A, et al. Hepatitis B virus X protein suppresses virus-triggered IRF3 activation and IFN-beta induction by disrupting the VISA-associated complex. Cell Mol Immunol. 2010;7:341–348. [DOI] [PMC free article] [PubMed] [Google Scholar]
- [6].Fu L, Fu X, Mo J, et al. miR-146a-5p enhances hepatitis B virus replication through autophagy to promote aggravation of chronic hepatitis B. IUBMB Life. 2019;71:1336–1346. [DOI] [PubMed] [Google Scholar]
- [7].Gao Q, Hou B, Yang H, et al. Distinct role of 4E-BP1 and S6K1 in regulating autophagy and hepatitis B virus (HBV) replication. Life Sci. 2019;220:1–7. [DOI] [PubMed] [Google Scholar]
- [8].Wang K. Autophagy and apoptosis in liver injury. Cell Cycle. 2015;14:1631–1642. [DOI] [PMC free article] [PubMed] [Google Scholar]
- [9].Kunanopparat A, Kimkong I, Palaga T, et al. Increased ATG5-ATG12 in hepatitis B virus-associated hepatocellular carcinoma and their role in apoptosis. World J Gastroenterol. 2016;22:8361–8374. [DOI] [PMC free article] [PubMed] [Google Scholar]
- [10].Peantum J, Kunanopparat A, Hirankarn N, et al. Autophagy related-protein 16-1 Up-regulated in hepatitis B virus-related hepatocellular carcinoma and impaired apoptosis. Gastroenterology Res. 2018;11:404–410. [DOI] [PMC free article] [PubMed] [Google Scholar]
- [11].Wang P, Guo QS, Wang ZW, et al. HBx induces HepG-2 cells autophagy through PI3K/Akt-mTOR pathway. Mol Cell Biochem. 2013;372:161–168. [DOI] [PubMed] [Google Scholar]
- [12].Tang H, Da L, Mao Y, et al. Hepatitis B virus X protein sensitizes cells to starvation-induced autophagy via up-regulation of beclin 1 expression. Hepatology. 2009;49:60–71. [DOI] [PubMed] [Google Scholar]
- [13].Fu S, Wang J, Hu X, et al. Crosstalk between hepatitis B virus X and high-mobility group box 1 facilitates autophagy in hepatocytes. Mol Oncol. 2018;12:322–338. [DOI] [PMC free article] [PubMed] [Google Scholar]
- [14].Yue Z, Jin S, Yang C, et al. Beclin 1, an autophagy gene essential for early embryonic development, is a haploinsufficient tumor suppressor. Proc Natl Acad Sci U S A. 2003;100:15077–15082. [DOI] [PMC free article] [PubMed] [Google Scholar]
- [15].Siddharth S, Muniraj N, Saxena NK, et al. Concomitant Inhibition of cytoprotective autophagy augments the efficacy of withaferin A in hepatocellular carcinoma. Cancers (Basel). 2019;11:453. [DOI] [PMC free article] [PubMed] [Google Scholar]
- [16].Kowalik MA, Perra A, Ledda-Columbano GM, et al. Induction of autophagy promotes the growth of early preneoplastic rat liver nodules. Oncotarget. 2016;7:5788–5799. [DOI] [PMC free article] [PubMed] [Google Scholar]
- [17].Smith JS, Rajagopal S.. The beta-arrestins: multifunctional regulators of G protein-coupled receptors. J Biol Chem. 2016;291:8969–8977. [DOI] [PMC free article] [PubMed] [Google Scholar]
- [18].Rosano L, Cianfrocca R, Tocci P, et al. Endothelin A receptor/beta-arrestin signaling to the Wnt pathway renders ovarian cancer cells resistant to chemotherapy. Cancer Res. 2014;74:7453–7464. [DOI] [PubMed] [Google Scholar]
- [19].Kumari P, Srivastava A, Ghosh E, et al. Core engagement with beta-arrestin is dispensable for agonist-induced vasopressin receptor endocytosis and ERK activation. Mol Biol Cell. 2017;28:1003–1010. [DOI] [PMC free article] [PubMed] [Google Scholar]
- [20].Yang Y, Guo Y, Tan S, et al. Beta-Arrestin1 enhances hepatocellular carcinogenesis through inflammation-mediated Akt signalling. Nat Commun. 2015;6:7369. [DOI] [PubMed] [Google Scholar]
- [21].Wang P, Xu TY, Wei K, et al. ARRB1/beta-arrestin-1 mediates neuroprotection through coordination of BECN1-dependent autophagy in cerebral ischemia. Autophagy. 2014;10:1535–1548. [DOI] [PMC free article] [PubMed] [Google Scholar]
- [22].Tan S, Lu Y, Xu M, et al. beta-Arrestin1 enhances liver fibrosis through autophagy-mediated Snail signaling. FASEB J. 2019;33:2000–2016. [DOI] [PubMed] [Google Scholar]
- [23].Benn J, Schneider RJ. Hepatitis B virus HBx protein deregulates cell cycle checkpoint controls. Proc Natl Acad Sci U S A. 1995;92:11215–11219. [DOI] [PMC free article] [PubMed] [Google Scholar]
- [24].Koike K, Moriya K, Yotsuyanagi H, et al. Induction of cell cycle progression by hepatitis B virus HBx gene expression in quiescent mouse fibroblasts. J Clin Invest. 1994;94:44–49. [DOI] [PMC free article] [PubMed] [Google Scholar]
- [25].Zhang YX, Li XF, Yuan GQ, et al. beta-Arrestin 1 has an essential role in neurokinin-1 receptor-mediated glioblastoma cell proliferation and G2/M phase transition. J Biol Chem. 2017;292:8933–8947. [DOI] [PMC free article] [PubMed] [Google Scholar]
- [26].Li H, Peng X, Wang Y, et al. Atg5-mediated autophagy deficiency in proximal tubules promotes cell cycle G2/M arrest and renal fibrosis. Autophagy. 2016;12:1472–1486. [DOI] [PMC free article] [PubMed] [Google Scholar]
- [27].Azzopardi M, Farrugia G, Balzan R. Cell-cycle involvement in autophagy and apoptosis in yeast. Mech Ageing Dev. 2017;161:211–224. [DOI] [PubMed] [Google Scholar]
- [28].Yu DY, Moon HB, Son JK, et al. Incidence of hepatocellular carcinoma in transgenic mice expressing the hepatitis B virus X-protein. J Hepatol. 1999;31:123–132. [DOI] [PubMed] [Google Scholar]
- [29].Shin GC, Kang HS, Lee AR, et al. Hepatitis B virus-triggered autophagy targets TNFRSF10B/death receptor 5 for degradation to limit TNFSF10/TRAIL response. Autophagy. 2016;12:2451–2466. [DOI] [PMC free article] [PubMed] [Google Scholar]
- [30].Kreis NN, Louwen F, Yuan J. The multifaceted p21 (Cip1/Waf1/CDKN1A) in cell differentiation, migration and cancer therapy. Cancers (Basel). 2019;11:1220. [DOI] [PMC free article] [PubMed] [Google Scholar]
- [31].Ma L, Pei G. Beta-arrestin signaling and regulation of transcription. J Cell Sci. 2007;120:213–218. [DOI] [PubMed] [Google Scholar]
- [32].Lloyd RV, Erickson LA, Jin L, et al. p27kip1: a multifunctional cyclin-dependent kinase inhibitor with prognostic significance in human cancers. Am J Pathol. 1999;154:313–323. [DOI] [PMC free article] [PubMed] [Google Scholar]
- [33.Fang G, Zhang P, Liu J, et al. Inhibition of GSK-3beta activity suppresses HCC malignant phenotype by inhibiting glycolysis via activating AMPK/mTOR signaling. Cancer Lett. 2019;463:11–26. [DOI] [PubMed] [Google Scholar]
- [34].Lin X, Yang Y, Guo Y, et al. PTTG1 is involved in TNF-alpha-related hepatocellular carcinoma via the induction of c-myc. Cancer Med. 2019;8:5702–5715. [DOI] [PMC free article] [PubMed] [Google Scholar]
- [35].Whalen EJ, Rajagopal S, Lefkowitz RJ. Therapeutic potential of beta-arrestin- and G protein-biased agonists. Trends Mol Med. 2011;17:126–139. [DOI] [PMC free article] [PubMed] [Google Scholar]
- [36].Duan L, Wu R, Zhang X, et al. HBx-induced S100A9 in NF-kappaB dependent manner promotes growth and metastasis of hepatocellular carcinoma cells. Cell Death Dis. 2018;9:629. [DOI] [PMC free article] [PubMed] [Google Scholar]
- [37].Tse AP, Sze KM, Shea QT, et al. Hepatitis transactivator protein X promotes extracellular matrix modification through HIF/LOX pathway in liver cancer. Oncogenesis. 2018;7:44. [DOI] [PMC free article] [PubMed] [Google Scholar]
- [38].Sung WK, Lu Y, Lee CW, et al. Deregulated direct targets of the hepatitis B virus (HBV) protein, HBx, identified through chromatin immunoprecipitation and expression microarray profiling. J Biol Chem. 2009;284:21941–21954. [DOI] [PMC free article] [PubMed] [Google Scholar]
- [39].Zhang HT, Chen GG, Hu BG, et al. Hepatitis B virus x protein induces autophagy via activating death-associated protein kinase. J Viral Hepat. 2014;21:642–649. [DOI] [PubMed] [Google Scholar]
- [40].Liu J, Li QX, Wang XJ, et al. beta-Arrestins promote podocyte injury by inhibition of autophagy in diabetic nephropathy. Cell Death Dis. 2016;7:e2183. [DOI] [PMC free article] [PubMed] [Google Scholar]
- [41].Luan B, Zhao J, Wu H, et al. Deficiency of a beta-arrestin-2 signal complex contributes to insulin resistance. Nature. 2009;457:1146–1149. [DOI] [PubMed] [Google Scholar]
- [42].Qu X, Yu J, Bhagat G, et al. Promotion of tumorigenesis by heterozygous disruption of the beclin 1 autophagy gene. J Clin Invest. 2003;112:1809–1820. [DOI] [PMC free article] [PubMed] [Google Scholar]
- [43].Xie M, Yang Z, Liu Y, et al. The role of HBV-induced autophagy in HBV replication and HBV related-HCC. Life Sci. 2018;205:107–112. [DOI] [PubMed] [Google Scholar]
- [44].Zhong F, Bi R, Yu B, et al. Carcinoma arising in microglandular adenosis of the breast: triple negative phenotype with variable morphology. Int J Clin Exp Pathol. 2014;7:6149–6156. [PMC free article] [PubMed] [Google Scholar]
- [45].Jia W, He MX, McLeod IX, et al. Autophagy regulates T lymphocyte proliferation through selective degradation of the cell-cycle inhibitor CDKN1B/p27Kip1. Autophagy. 2015;11:2335–2345. [DOI] [PMC free article] [PubMed] [Google Scholar]
- [46].Jiang H, Martin V, Gomez-Manzano C, et al. The RB-E2F1 pathway regulates autophagy. Cancer Res. 2010;70:7882–7893. [DOI] [PMC free article] [PubMed] [Google Scholar]
- [47].Dai Y, Cros MP, Pontoizeau C, et al. Downregulation of transcription factor E4F1 in hepatocarcinoma cells: HBV-dependent effects on autophagy, proliferation and metabolism. Carcinogenesis. 2014;35:635–650. [DOI] [PubMed] [Google Scholar]
- [48].Ruan C, Wang C, Gong X, et al. An integrative multi-omics approach uncovers the regulatory role of CDK7 and CDK4 in autophagy activation induced by silica nanoparticles. Autophagy. 2020:1–22. DOI: 10.1080/15548627.2020.1763019 [DOI] [PMC free article] [PubMed] [Google Scholar]
- [49].Chandrashekar DS, Bashel B, Balasubramanya SAH, et al. UALCAN: a portal for facilitating tumor subgroup gene expression and survival analyses. Neoplasia. 2017;19:649–658. [DOI] [PMC free article] [PubMed] [Google Scholar]
- [50].Yeo W, Chan SL, Mo FK, et al. Phase I/II study of temsirolimus for patients with unresectable hepatocellular carcinoma (HCC)- a correlative study to explore potential biomarkers for response. BMC Cancer. 2015;15:395. [DOI] [PMC free article] [PubMed] [Google Scholar]
Associated Data
This section collects any data citations, data availability statements, or supplementary materials included in this article.
Supplementary Materials
Data Availability Statement
The datasets used and/or analyzed during the current study are available from the corresponding author on reasonable request.