eLife logoLink to eLife
. 2021 Dec 6;10:e68678. doi: 10.7554/eLife.68678

Src activates retrograde membrane traffic through phosphorylation of GBF1

Joanne Chia 1,, Shyi-Chyi Wang 1,2, Sheena Wee 1, David James Gill 1, Felicia Tay 1, Srinivasaraghavan Kannan 3, Chandra S Verma 3,4,5, Jayantha Gunaratne 1, Frederic A Bard 1,†,
Editors: Suzanne R Pfeffer6, Suzanne R Pfeffer7
PMCID: PMC8727025  PMID: 34870592

Abstract

The Src tyrosine kinase controls cancer-critical protein glycosylation through Golgi to ER relocation of GALNTs enzymes. How Src induces this trafficking event is unknown. Golgi to ER transport depends on the GTP exchange factor (GEF) GBF1 and small GTPase Arf1. Here, we show that Src induces the formation of tubular transport carriers containing GALNTs. The kinase phosphorylates GBF1 on 10 tyrosine residues; two of them, Y876 and Y898, are located near the C-terminus of the Sec7 GEF domain. Their phosphorylation promotes GBF1 binding to the GTPase; molecular modeling suggests partial melting of the Sec7 domain and intramolecular rearrangement. GBF1 mutants defective for these rearrangements prevent binding, carrier formation, and GALNTs relocation, while phosphomimetic GBF1 mutants induce tubules. In sum, Src promotes GALNTs relocation by promoting GBF1 binding to Arf1. Based on residue conservation, similar regulation of GEF-Arf complexes by tyrosine phosphorylation could be a conserved and widespread mechanism.

Research organism: Human

Introduction

Eukaryotic cells constantly regulate membrane trafficking between compartments to adjust their physiology. Thus, signaling pathways impinge on trafficking pathways at many different levels. For instance, the Src tyrosine kinase has been shown to regulate Golgi membranes, in part to adjust trafficking rates in response to change in cargo load (Pulvirenti et al., 2008). Changes in Src activity have major effects on the morphology of the Golgi apparatus, with compaction after Src depletion or fragmentation upon Src hyper-activation (Bard et al., 2003; Weller et al., 2010).

A specific role of the Src kinase at the Golgi is to regulate protein O-glycosylation. Src activation induces the relocation of polypeptide GalNAc transferases (GALNTs) from the Golgi to the endoplasmic reticulum (ER) (Bard and Chia, 2016). GALNTs initiate GalNAc type O-glycosylation and their relocation leads to a marked increase in glycosylation, which can be measured with the levels of the Tn glycan (a single GalNac residue). Increase in Tn can be detected by lectins such as HPL and Vicia villosa lectin (VVL) (Gill et al., 2011; Gill et al., 2010). The Tn levels’ increase corresponds to multiple cell surface and ER resident proteins becoming hyper-O-glycosylated; such as MMP14, PDIA4, and Calnexin (Nguyen et al., 2017; Ros et al., 2020). In short, GALNTs relocation upregulates GalNac type O-glycosylation of many proteins.

This GALNTs Activation (GALA) pathway is strongly activated in breast, lung, and liver cancers and presumably in most high Tn-expressing tumors. GALA markedly promotes tumor growth and metastasis (Gill et al., 2013; Nguyen et al., 2017; Ros et al., 2020). In addition to Src, the pathway can be stimulated by the cell surface receptors EGFR or PDGFR and is controlled by a complex signaling network, including a constitutive negative regulation by the kinase ERK8 in some cell types (Chia et al., 2014). Src has long been implicated in tumorigenesis and tumor invasiveness, and GALA is likely an important mediator of Src oncogenic effects (Chia et al., 2019). It is unclear how Src stimulates the transport of GALNTs from the Golgi to the ER apart from the fact that the process involves the Arf1 small GTPase and can be blocked by a dominant negative form of Arf1 (Gill et al., 2010).

Arf1 is part of a family of small GTPases involved in many aspects of intracellular membranes (D’Souza-Schorey and Chavrier, 2006). Arfs function in conjunction with larger proteins called GTP exchange factors (GEFs) that mediate the transfer from GDP to GTP-bound form of the small GTPase. GEFs bind to the GDP-bound form of Arfs and not the GTP-bound form. All GEFs have in common a Sec7 domain (Sec7d) that specifically mediates displacement of GDP from Arf-GDP and loading with GTP. Thus, Arfs function like molecular timers, oscillating between GDP- and GTP-bound forms and binding different partners (Cherfils, 2014).

There are seven subfamilies of Arf GEFs in eukaryotes, with two subfamilies operating at the Golgi: BIG1/2 and GBF1 (Cox et al., 2004). While the BIGs primarily function at the trans-Golgi network and endosomal compartments, GBF1 functions at the early cis-Golgi and ER-Golgi intermediate compartment (ERGIC) and regulates Golgi to ER retrograde traffic (Kawamoto et al., 2002; Zhao et al., 2006; Zhao et al., 2002).

GBF1 functions mostly with Arf1. GBF1 contains five other conserved domains, two in N-terminal of the Sec7d (DCB and HUS) and three in C-terminal (HDS1 to 3). These domains are thought to mediate GBF1 recruitment to membranes and/or regulate membrane transport (Richardson et al., 2012). Work by Melançon’s group has identified membrane-bound Arf-GDP as a factor regulating GBF1 recruitment to cis-Golgi membranes (Quilty et al., 2018; Quilty et al., 2014). In addition, they propose that the C-terminal domains HDS1 and 2 are required to bind to an unidentified Golgi receptor (Quilty et al., 2018). More recently, HDS1 has been shown to bind to phosphoinositides such as PIP3, PI4P, and PI(4,5)P2 (Meissner et al., 2018).

Here, we report the setup of an inducible Src activation system to rapidly and reliably activate the relocation of GALNTs to the ER. Acute activation of Src stimulates the formation of tubular-shaped, GALNTs-containing transport carriers and results in increased O-glycosylation levels. Src activation induces the recruitment of GBF1 at the Golgi, increased binding of GBF1 to Arf1, and a transient upregulation of Arf1-GTP levels. By mass spectrometry, we found that Src directly phosphorylates GBF1 on 10 residues, including residues Y876 and Y898, located within and close to the C-terminus of the Sec7d, respectively. In silico modeling and directed mutagenesis suggest important conformational changes that promote binding to Arf1. As supported by additional mutants, Y876 phosphorylation induces partial melting of an alpha-helix in Sec7d, increasing binding affinity to Arf1. Y898 phosphorylation appears to release an interaction between Sec7d and the linker domain in C-terminal. We propose that tyrosine phosphorylation increases GBF1 affinity for Arf-GDP on Golgi membranes and promotes the relocation of GALNTs through tubular transport intermediates.

Results

Src8A7F chemical activation induces rapid GALNTs relocation to the ER

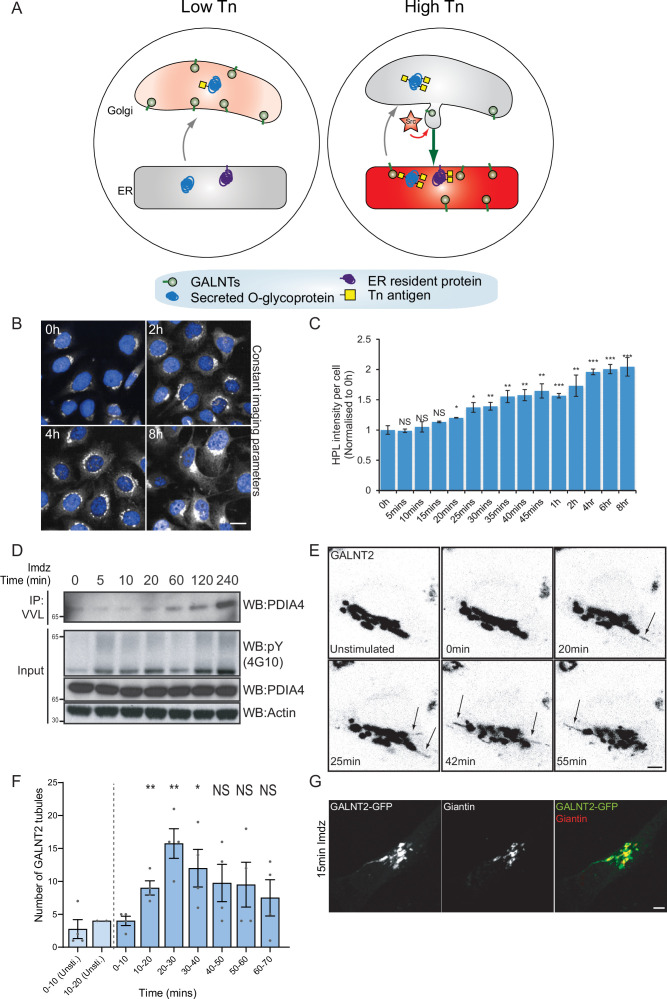
ER relocation of GALNTs correlates well in solid tumors with total Tn levels, measured using staining with Helix pomatia lectin (HPL) (Gill et al., 2010; Hammarström et al., 1977; Figure 1A). High levels of relocation or GALA are found in a majority of samples from malignant tumors. By contrast and for unknown reasons, most cancer cell lines in vitro show limited levels of GALA (Gill et al., 2013). A more marked relocation can be induced in cell lines by transfecting a plasmid expressing an active form of Src. However, this approach implies an uncontrolled increase of Src activity over several hours and tends to result in fragmentation of the Golgi apparatus (Bard et al., 2003).

Figure 1. Src8A7F chemical activation induces GALNTs relocation to the endoplasmic reticulum (ER) in tubular carriers.

(A) Schematic of the GALA pathway, the red coloring represents the anti-Tn lectin staining. (B) Representative images of Helix pomatia lectin (HPL) staining of Tn in HeLa-IS cells after 5 mM imidazole (imdz) stimulation. Scale bar: 20 μm. (C) HPL staining intensity per cell normalized to untreated control cells (0 hr). Three replicate wells per experiment were quantified. (D) Representative immunoblot analysis of Vicia villosa lectin (VVL) immunoprecipitation of cell lysate after 5 mM imdz treatment of HEK-IS cells. (E) Still images of time-course analysis of GALNT2-GFP-expressing HeLa-IS cells stimulated with 5 mM imdz. (See Figure 1—video 1 for time-lapse movie.) Scale bar: 5 μm. (F) Quantification of the number of GALNT2 tubules emanating from the Golgi over various time pre-imdz (light blue bars) and post-imdz treatment (dark blue bars). Tubules were counted manually over 10 min windows in four independent cells. (G) Fixed GALNT2-expressing HeLa-IS cells were stained for the Golgin Giantin. Values on graphs indicate the mean ± SD. Statistical significance (p) was measured by two-tailed paired t-test. *p<0.05, **p<0.01, ***p<0.001 relative to untreated cells.

Figure 1.

Figure 1—figure supplement 1. Src activation promotes GALNT tubules at the Golgi.

Figure 1—figure supplement 1.

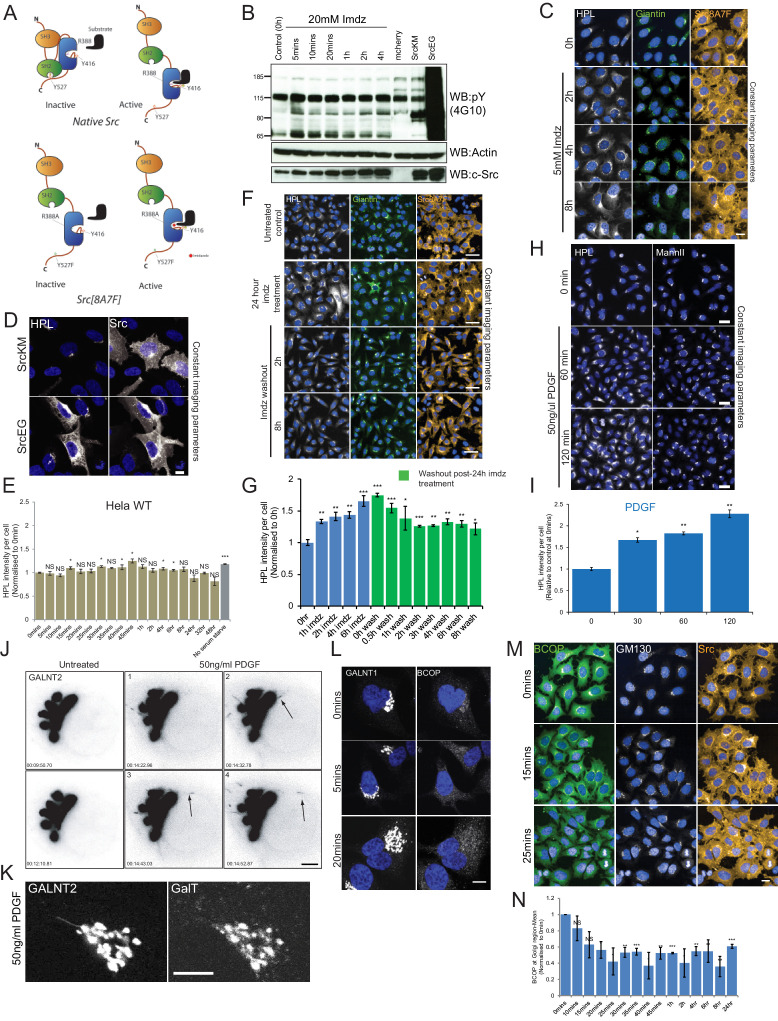
(A) Schematic of imidazole (imdz) rescue of Src8A7F mutant in comparison to wild-type Src. (B) SDS-PAGE comparison of the total phosphotyrosine levels of imdz-treated HeLa-IS cells over time and cells expressing empty mCherry vector, SrcKM and SrcEG mutants. (C) Images of Src8A7F expression as well as Helix pomatia lectin (HPL) and Golgi marker Giantin staining of the cells shown in Figure 1B over time of imdz stimulation. Images were acquired under constant acquisition settings using an automated confocal microscope. Scale bar: 20 μm. (D) HPL staining of HeLa cells expressing inactive SrcKM and active SrcEG mutants. (E) Quantification of HPL levels over duration of 5 mM imdz stimulation in wild-type HeLa cells. Values were normalized with respect to untreated cells (0 hr). (F) HPL staining of HeLa-IS stable cell line over time of imdz washout. Cells were treated with 5 mM imdz for 24 hr prior to washout. Scale bar: 50 μm. (G) Quantification of HPL levels over duration of imdz treatment (blue bars) and washout of imdz and fixed over various durations after 24 hr of imdz treatment (green bars). Values were normalized with respect to untreated cells (0 hr). (H) HPL staining of HeLa cells after 50 ng/ml platelet-derived growth factor (PDGF) stimulation. Scale bar: 10 μm. (I) Quantification of HPL levels after PDGF stimulation normalized with respect to untreated cells (0 hr). (J) Stills of the movie demonstrating GALNT2 tubule formation in HeLa cells stimulated with 50 ng/ml PDGF. Scale bar: 5 μm. (K) The Golgi glycosyltransferase GALT was not observed in the GALNT2 tubules. Scale bar: 10 μm. (L) Images of BCOP localization of HeLa-IS cells over time with imdz treatment. (M) Images of BCOP localization acquired from automated microscope and used for quantification. GM130 is a Golgi marker. Scale bar: 20 μm. (N) Quantification of levels BCOP at the Golgi over time of imdz treatment. Values on graphs indicate the mean ± SD. Statistical significance (p) was measured by two-tailed paired t-test. *p<0.05, **p<0.01, ***p<0.001 relative to untreated cells. NS, nonsignificant.
Figure 1—video 1. Video of tubule formation in GALNT2-GFP-expressing HeLa-IS cells stimulated with 5 mM imidazole (imdz).
Download video file (58.2MB, mp4)
Scale bar: 5 μm.

We sought to obtain a better kinetic control of the Src-induced GALNT relocation. The Cole group has demonstrated that a mutant form of Src, Src(R388A,Y527F) or Src8A7F for short, is a mostly inactive kinase that can be chemically rescued and activated by imidazole (Qiao et al., 2006; Figure 1—figure supplement 1A). After generating a stable HeLa cell line expressing this Inducible Src, HeLa-IS, we verified that imidazole treatment induces an increase in total tyrosine phosphorylation. By comparison with the overexpression of constitutively active point mutant SrcE378G (SrcEG), the increase in tyrosine phosphorylation remained moderate (Figure 1—figure supplement 1B).

In terms of GALA, imidazole treatment induced a twofold increase in total Tn levels after 2 hr with a pattern of Tn staining a mix of Golgi and ER, suggesting a measured GALNT relocation (Figure 1B and C, Figure 1—figure supplement 1C). Staining pattern of the Golgi marker Giantin was not affected, indicating that the Golgi organization was not overly perturbed. Tn increase was relatively modest compared to the expression of SrcEG (Figure 1—figure supplement 1D) or ERK8 depletion in HeLa cells (Chia et al., 2014). Imidazole treatment in wild-type HeLa cells had no effect on Tn (Figure 1—figure supplement 1E). We also observed that the effects of Src8A7F activation were reversible: imidazole washout after 24 hr of treatment resulted in a significant reduction of Tn levels within 1 hr (Figure 1—figure supplement 1F and G).

To evaluate the physiological relevance of the inducible Src activation system, we compared it to a stimulation with platelet-derived growth factor (PDGF). PDGF binding to the PDGF receptor usually results in Src activation (Thomas and Brugge, 1997). Stimulation with 50 ng/ml PDGF yielded around a twofold increase in total Tn levels (Figure 1—figure supplement 1H and I), similar to that observed with imidazole treatment. Hence, Src8A7F rescue recapitulates the levels of response to growth factor stimulation. The advantage of imidazole rescue is a reliable Src activation, whereas the effect of PDGF stimulation tends to be influenced by cell culture conditions (Chia et al., 2019). Similar data were obtained in another cell line HEK293 that stably expresses Src8A7F (HEK-IS). HEK-IS recapitulated the results obtained with HeLa-IS, providing an alternative model for biochemical experiments.

We further verified whether increased Tn levels were due to relocation of GALNTs to the ER. Direct observation of GALNTs in the ER is technically challenging because of the dilution and dispersion factor involved (Chia et al., 2019). However, GALNTs presence in the ER results in O-glycosylation of ER resident proteins such as PDIA4, which is more readily quantified (Chia et al., 2019; Nguyen et al., 2017). We measured the effects of Src8A7F imidazole rescue on the glycosylation of PDIA4 using VVL immunoprecipitation (IP) followed by PDIA4 blotting and quantified a fivefold increase of PDIA4 glycosylation after 4 hr (Figure 1D). Overall, the Src8A7F system provides a measured activation of the GALA pathway, without breakdown of the Golgi structure and with tight kinetic control.

Acute activation of Src induces GALNTs-containing tubules at the Golgi

To visualize GALNTs relocation, HeLa-IS cells stably expressing GALNT2-GFP were imaged by time-lapse microscopy after imidazole stimulation. In unstimulated conditions, GALNT2 was mostly confined at the Golgi. Upon imidazole addition, GFP-positive tubules started to emanate from the Golgi as soon as 10 min after stimulation, their numbers reaching peak around 20–30 min, then decreasing to slightly above unstimulated conditions (Figure 1E and F, Figure 1—video 1). The tubules often detached and moved away from the Golgi, suggesting effective transport (Figure 1F).

This phenomenon was also observed after PDGF stimulation where GALNT2 tubules emerged from the Golgi after ~15 min (Figure 1—figure supplement 1J). In some particularly responsive cells, the tubules were forming at a high rate and eventually led to a marked reduction of GALNT2 levels in the Golgi. Of note, similar tubules were also observed upon drug inhibition of ERK8, a negative inhibitor of GALNTs relocation (Chia et al., 2014). The tubules were deprived of the peripheral Golgi protein Giantin (Figure 1G). In addition, they appeared deprived of the chimeric Golgi enzyme beta 1,4-galactosyltransferase (GALT) tagged with mCherry (Figure 1—figure supplement 1K).

Src activation does not increase COPI recruitment on Golgi membranes

We next wondered whether tubule formation was dependent on the COPI coat. We first measured if COPI was recruited at the Golgi upon Src activation using staining for the beta-subunit of COPI. Surprisingly, using both high-resolution microscopy and quantitative automated high-throughput confocal microscopy, we observed no increase but instead a mild reduction of COPI intensity at the Golgi between 5 and 20 min after Src activation (Figure 1—figure supplement 1L–N). These results suggest that COPI is not playing a driving role in the formation of tubules at the Golgi, consistent with previous reports about the formation of retrograde-directed tubular intermediates at the Golgi (Bottanelli et al., 2017). Since COPI vesicles formation cannot be readily observed, our observations suggest that GALNTs retrograde traffic to the ER is mediated instead by tubules emanating from the Golgi and seceding into transport carriers.

Transient Src activation increases Arf1-GTP levels

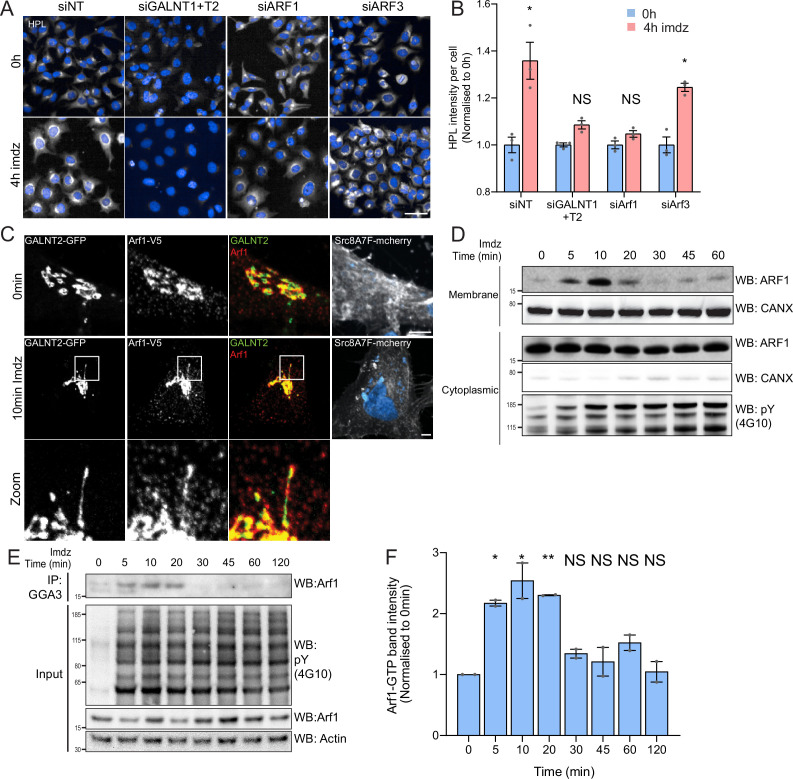
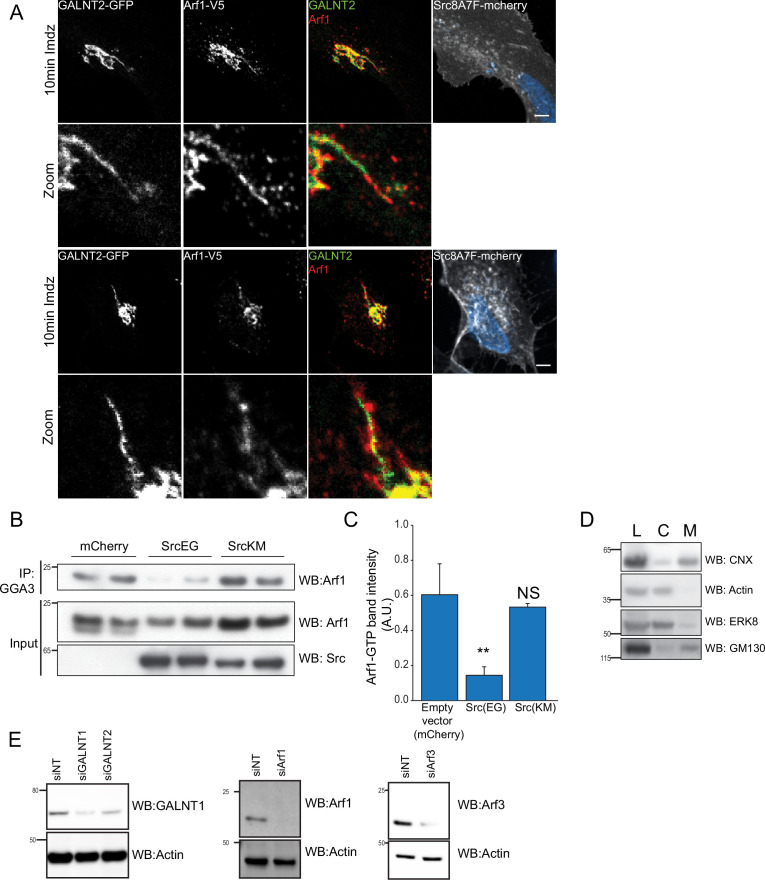
Tubular carriers involved in retrograde traffic have been described previously and recently shown to depend on the small GTPase Arf1 (Bottanelli et al., 2017). We previously reported the requirement of Arf1 for GALNTs relocation (Chia et al., 2014; Gill et al., 2010). By contrast, the small GTPase Arf3 is thought to act primarily in anterograde traffic at the TGN (Sztul et al., 2019). Consistently, siRNA knockdown of Arf1 resulted in a significant reduction of Tn levels upon imidazole treatment and Arf3 knockdown had little effect (Figure 2A and B, Figure 2—figure supplement 1E).

Figure 2. Src activation stimulates GTP loading and membrane recruitment of Arf1.

(A) Representative images of Helix pomatia lectin (HPL) staining in HeLa-IS treated with various siRNA before and after 4 hr of imidazole (imdz) treatment. siNT refers to non-targeting siRNA, and siGALNT1 + T2 refers to co-transfection of GALNT1 and GALNT2 siRNAs. Images were acquired under constant acquisition settings. Scale bar: 50 μm. (B) Quantification of HPL staining intensity per cell normalized to the respective untreated cells (0 hr) for each siRNA treatment. Three replicate wells per experiment were measured. (C) Representative images of GALNT2-expressing HeLa-IS cells stained for Arf1 before and after 10 min of stimulation with 5 mM imdz. Images were acquired at ×100 magnification. Scale bar: 5 μm. (D) SDS-PAGE analysis of cytoplasmic and membrane levels of Arf1 after imdz stimulation. CANX refers to blotting for endoplasmic reticulum (ER)-resident Calnexin. The blots were generated with the same exposure and repeated twice. (E) SDS-PAGE analysis of GTP-loaded Arf1 after pulldown with GGA3 beads after imdz treatment in HEK-IS cells. (F) Quantification of Arf1-GTP levels in (E). Two experimental replicates were measured and values were normalized to untreated cells (0 hr). Values on graphs indicate the mean ± SD. Statistical significance (p) was measured by two-tailed paired t-test. *p<0.05, **p<0.01, ***p<0.001 relative to untreated cells. NS, nonsignificant.

Figure 2.

Figure 2—figure supplement 1. Active Src transiently stimulates nucleotide exchange and membrane recruitment of Arf.

Figure 2—figure supplement 1.

(A) Additional representative images of Arf1 on GALNT2 tubules emanating from the Golgi upon 10 min stimulation of 20 mM imidazole (imdz). Images were acquired at ×100 magnification under Immersol oil. Scale bar: 5 μm. (B) SDS-PAGE analysis of the levels of Arf1-GTP immunoprecipitation (IP) using GGA3 beads in HEK293T cells expressing empty mCherry vector, SrcKM and SrcEG mutants. (C) Quantification of the levels of Arf1-GTP in (B). Three experimental replicates were measured. (D) SDS-PAGE analysis of total lysate (L), cytoplasmic (C), and membrane (M) levels of various proteins after subcellular fractionation. Endoplasmic reticulum (ER)-resident Calnexin (CANX), Golgi marker GM130 as well as cytoplasmic actin and MAP kinase ERK8 are shown. (E) siRNA knockdown efficiencies of various proteins assayed. siNT refers to non-targeting siRNA. Values on graphs indicate the mean ± SD. Statistical significance (p) was measured by two-tailed paired t-test. *p<0.05 and **p<0.001 relative to untreated cells. NS, nonsignificant.

Arf1 has been involved in the formation of retrograde tubular carriers at the Golgi (Beck et al., 2008; Bottanelli et al., 2017; Krauss et al., 2008). We wondered if Arf1 was present on GALNT2 tubules; however, antibody staining was too faint to be conclusive. We thus generated HeLa-IS stably coexpressing GALNT2-GFP and C-terminal V5-tagged Arf1 (Arf1-V5). The small V5 tag was selected to minimize functional interference, and we picked a clone that expresses moderate levels of Arf1-V5 (Jian et al., 2010). We found that in unstimulated cells Arf1-V5 localizes both at the Golgi and in peripheral cytosol (Figure 2C). Upon Src8A7F activation, Arf1-V5 appeared to be recruited at the Golgi and localized on the GALNT2 tubules, almost throughout the structure (Figure 2C, Figure 2—figure supplement 1A). To confirm the membrane recruitment of Arf1, we isolated cytosolic and membrane proteins to measure the levels of membrane-bound Arf1 and found Arf1 membrane-association increased within 5 min, peaked at 10 min, and began to fall after 20 min while the cytosolic pool remained relatively constant (Figure 2D, Figure 2—figure supplement 1D).

The results so far suggested that Arf1 is activated by Src, suggesting an effect on Arf1-GTP levels. We measured them using pulldown with the binding domain of the Arf1 effector GGA1 in HEK-IS (Dell’Angelica et al., 2000; Yoon et al., 2005). Strikingly, Arf1-GTP levels increased more than twofold within 5 min of imidazole induction (Figure 2E and F). Interestingly, Arf1-GTP levels subsided after 30 min of stimulation despite continuous Src activity. Surprisingly, transient expression of SrcEG for 18 hr resulted in a marked decrease in the amount of Arf1-GTP (Figure 2—figure supplement 1B and C).

Altogether, the data indicate that Src activation at the Golgi results in a transient increase in GTP-loaded Arf1 and recruitment at the Golgi. Given the reported increased affinity of Arf-GTP for membranes, the switch to GTP-bound form might explain the increase in membrane-bound Arf (Nawrotek et al., 2016; Pasqualato et al., 2002).

GBF1 is required for Arf-GTP formation, GALNT relocation, and tubule formation

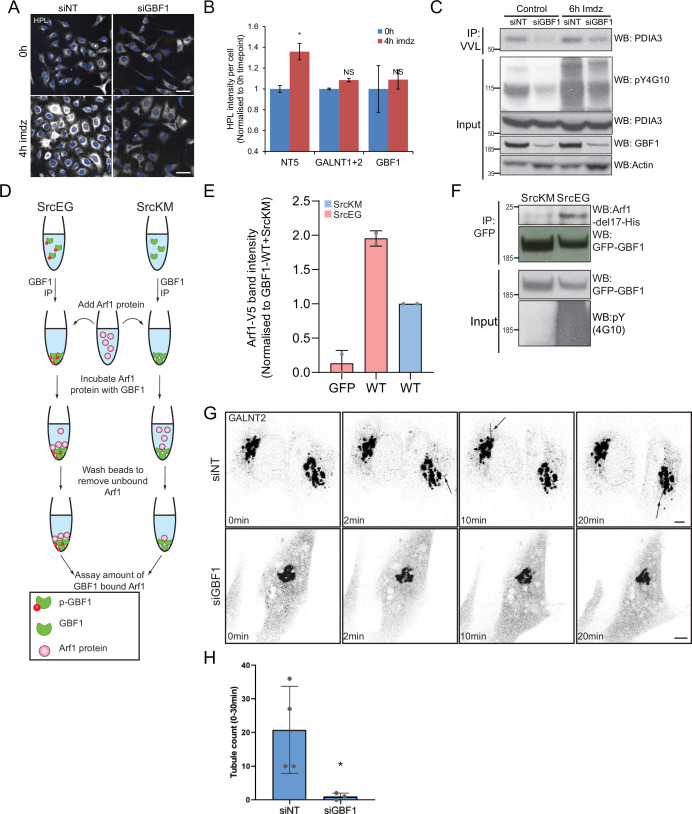
GTP loading of Arf1 at the Golgi is regulated by GBF1 (Kawamoto et al., 2002; Zhao et al., 2006). We previously reported that lowering GBF1 levels reduces GALNTs relocation in cells where GALA has been induced by ERK8 depletion (Chia et al., 2014). Following Src activation in imidazole-treated HEK-IS, GBF1 RNAi-mediated knockdown resulted similarly in a significant reduction of Tn levels (Figure 3—figure supplement 1A and B) and PDIA4 glycosylation (Figure 3—figure supplement 1). These results indicate that GBF1 is mediating the burst of GALNTs relocation induced by Src8A7F and suggest that GBF1 may also control Arf-GTP burst.

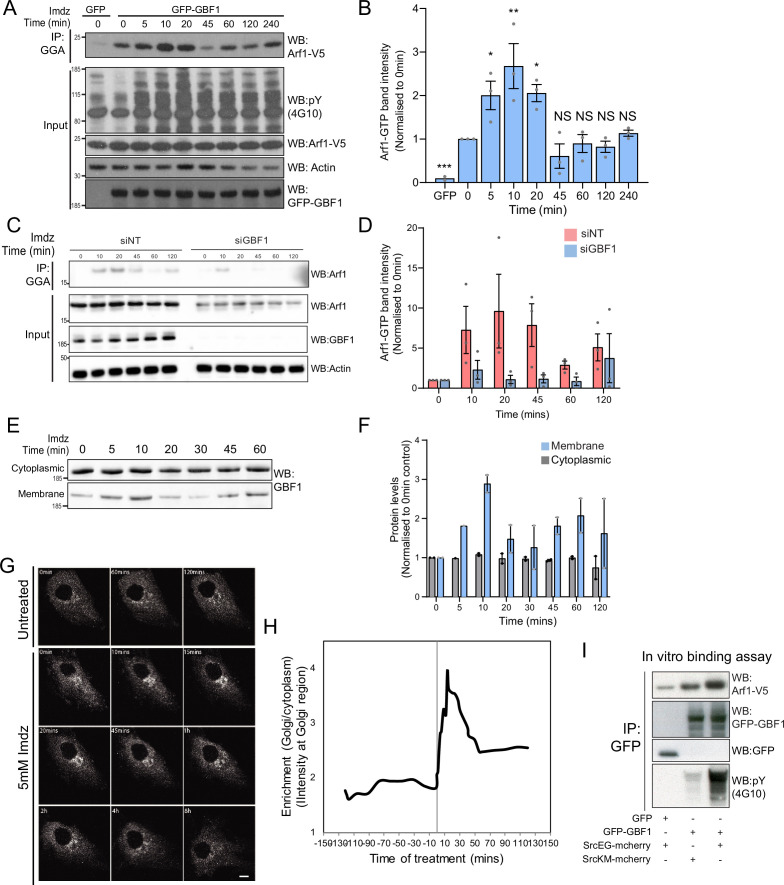
To test this, we reasoned that increased GBF1 expression, together with Src activation, should enhance Arf-GTP formation. Expression of a GFP-tagged form of GBF1 (GFP-GBF1) alone enhances Arf1-GTP levels in HEK-IS (Figure 3A). Strikingly, upon imidazole stimulation, GTP loading was further increased by nearly threefold within 10 min of induction (Figure 3A and B). The effect was transient and Arf1-GTP returned to pre-stimulation within 45 min, indicating similar dynamics as with wild-type levels of GBF1.

Figure 3. Src activates the ARF-GEF GBF1.

(A) Representative SDS-PAGE analysis of Arf1-GTP levels in HEK-IS cells expressing GFP or GFP-GBF1. GGA pulldown was performed as in Figure 2E. (B) Quantification of Arf1-GTP levels in three independent experiments in (A). (C) SDS-PAGE analysis of Arf1-GTP levels in HEK-IS cells treated with siGBF1 and siNT siRNA. (D) Quantification of the Arf1-GTP levels in three independent experiments in (C). (E) SDS-PAGE analysis of cytoplasmic and membrane levels of GBF1 after imidazole (imdz) stimulation. (F) Quantification of two independent experiments shown in (E). Values presented were normalized to untreated cells (0 hr).(G) Still images of the time-lapse movie of GBF1-GFP in HeLa-IS cells stimulated with 5 mM imdz. Scale bar: 10 μm. (H) Quantification of the ratio of Golgi to total cytoplasmic levels of GBF1 before and after imdz treatment in time lapse shown in (G). (I) SDS-PAGE analysis of the levels of Arf1-V5 bound to GFP or GFP-GBF1 immunoprecipitation (IP) from cells expressing inactive SrcKM or active SrcEG in an in vitro binding assay. Two experimental replicates were tested and quantified in Figure 3—figure supplement 1E.

Figure 3.

Figure 3—figure supplement 1. GBF1 is required for GALNT tubule formation.

Figure 3—figure supplement 1.

(A) Helix pomatia lectin (HPL) staining of HeLa-IS stable cell line treated with siRNA targeting GBF1 before and after 4 hr of imidazole (imdz) treatment. siNT refers to non-targeting siRNA, and siGALNT1 + T2 refers to co-transfection of GALNT1 and GALNT2 siRNAs. Images were acquired under constant acquisition settings using an automated confocal microscope. Scale bar: 50 μm. (B) Quantification of HPL staining intensity per cell normalized to the respective untreated cells (0 hr) for each siRNA treatment. (C) Immunoblot analysis of the levels of Tn-modified endoplasmic reticulum (ER)-resident PDIA3 from Vicia villosa lectin (VVL) immunoprecipitation (IP) in HEK-IS cell line upon GBF1 siRNA knockdown. Cells were untreated or treated with 5 mM imdz for 6 hr. (D) Schematic illustrating the workflow of the in vitro Arf1 binding assay. (E) Quantification of the levels of bound Arf1-V5 to GFP and GFP-GBF1 (WT) IP from cells expressing inactive SrcKM or active SrcEG in the in vitro binding assay shown in Figure 3G. Results representative of two experimental replicates. (F) SDS-PAGE analysis of the levels of recombinant protein Arf1-del17-His bound to GFP-GBF1 IP from inactive SrcKM or active SrcEG-expressing cells in an in vitro binding assay. (G) Images from time-lapse imaging of GALNT2-GFP in HeLa-IS cells that were either treated with siRNA targeting GBF1 (siGBF1) or siNT stimulated with 5 mM imdz. (See Figure 3—videos 1 and 2 for time-lapse movies.) Scale bar: 5 μm. (H) Quantification of the number of tubules observed in the first 30 min upon imidazole treatment. Values on graphs indicate the mean ± SD. Statistical significance (p) was measured by two-tailed paired t-test. *p<0.05 and **p<0.01 relative to untreated (0 hr) or GFP-expressing cells. NS, nonsignificant.
Figure 3—video 1. Video of tubule formation in siNT-treated HeLa-IS cells expressing GALNT2-GFP stimulated with 5 mM imidazole (imdz).
Download video file (22.9MB, mp4)
Scale bar: 5 μm.
Figure 3—video 2. Video of tubule formation in siGBF1-treated HeLa-IS cells expressing GALNT2-GFP stimulated with 5 mM imidazole (imdz).
Download video file (21.8MB, mp4)
Scale bar: 10 μm.

We next tested the effect of GBF1 depletion on Arf-GTP production upon Src activation. GBF1 knockdown affects cell adhesion and Golgi morphology, but these effects occur progressively after siRNA transfection. To capture recently GBF1-depleted cells, we harvested them at 48 hr instead of 72 hr. In these conditions, GBF1 levels were already significantly lowered; imidazole stimulation did not result in significant Arf-GTP production (Figure 3C). Averaging three independent experiments resulted in over 90% reduction of Arf activation (Figure 3D).

Since GBF1 is involved in Arf-GTP production after Src activation, we reasoned it might be recruited to Golgi membranes. Strikingly, the GBF1 membrane pool in HEK-IS increased by roughly threefold within 5–10 min, while total GBF1 remained constant. This increase was partially transient, peaking at 10 min of imidazole treatment, but remained elevated for up to 60 min (Figure 3E and F). Using time-lapse microscopy of GFP-GBF1 in HeLa-IS, we observed GBF1 recruitment at the Golgi complex. In sync with the biochemical experiment, GBF1 Golgi levels increased rapidly, peaking at ~10 min, decreasing after ~20 min but not to baseline levels (Figure 3G and H).

GBF1 recruitment at the Golgi depends on binding to membrane-bound Arf-GDP (Quilty et al., 2014). Thus, we wondered whether phosphorylation by Src might increase GBF1 affinity for Arf1. To test this idea, we isolated Arf1-V5 from a cell lysate and added, in the presence of GDP, GFP-GBF1 immunoprecipitated on beads from cells expressing also active or inactive Src (Figure 3—figure supplement 1D). After 1 hr incubation, beads were washed and the amount of Arf1 bound to beads quantified by immunoblotting (Figure 3I). By comparison with inactive SrcKM, SrcEG induced a twofold increase in binding (Figure 3—figure supplement 1E). Given this net increase, we next tested binding of immunoprecipitated GFP-GBF1 with bacterially produced and purified Arf1-del17-His in the presence of GDP. Arf1-del17-His, a recombinant protein deleted of the first 17 amino acids, is able to bind GDP in the absence of phospholipids (Kahn et al., 1992). As with Arf1-V5, phosphorylated GBF1 displayed increased binding to purified Arf1-del17-His (Figure 3—figure supplement 1F).

We then repeated the imaging of GALNT2-GFP in live HeLa-IS cells with cells depleted for GBF1. After imidazole stimulation, control cells displayed abundant tubule formation while tubules were almost nonexistent in GBF1-depleted cells (Figure 3—figure supplement 1G and H, Figure 3—videos 1 and 2).

Altogether, our results indicate that Src activation induces a wave of Arf-GTP that appears driven by an increase of affinity between GBF1 and Arf1-GDP. Coincidently, GBF1 is recruited to Golgi membranes and is involved in the formation of GALNT2 tubules.

GBF1 protein is phosphorylated by Src on at least 10 tyrosine residues

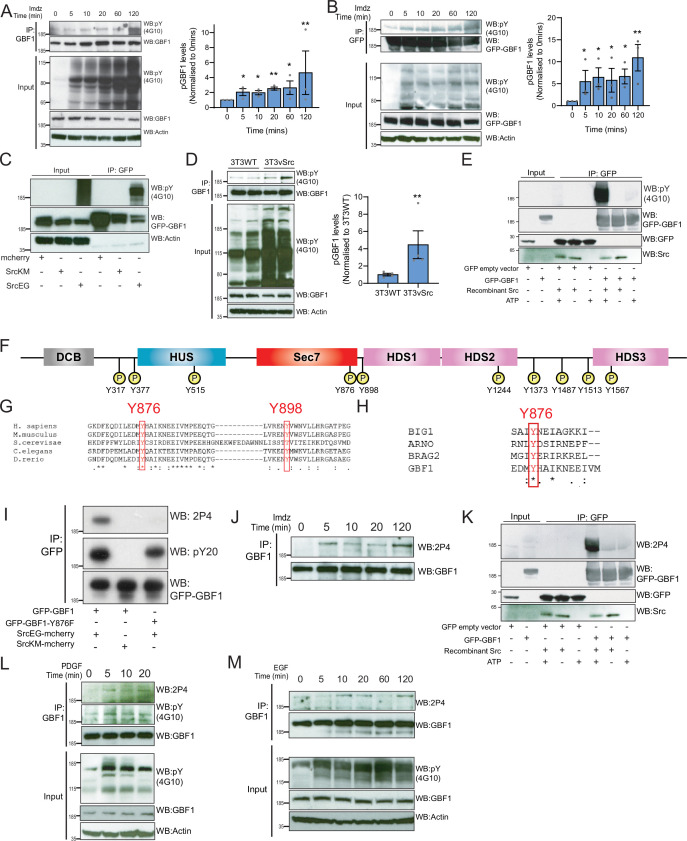
We next tested directly whether Src phosphorylates GBF1. After imidazole stimulation of HEK-IS cells, GBF1 was immunoprecipitated and probed with an antibody specific for tyrosine phosphorylation, revealing an increase within 5 min that was sustained for 2 hr (Figure 4A). As the signals both for GBF1 and its phosphorylation were not very marked, we also tested GFP-GBF1-expressing HEK-IS cells, obtaining similar results (Figure 4B). We also transiently coexpressed GFP-GBF1 with SrcEG and SrcKM mutants in HEK293T cells. In such conditions, the difference in phosphorylation levels was very marked (Figure 4C). Similarly, endogenous GBF1 was phosphorylated by SrcEG in HeLa cells (Figure 4—figure supplement 1A). Finally, we tested GBF1 phosphorylation in a third cell line: NIH3T3vSrc are mouse fibroblasts that have transformed with a viral, oncogenic, and constitutively active mutant of Src (Vogt, 2012). These cells display significantly higher levels of GALA than their normal counterparts (Figure 4—figure supplement 1B). They also display four times as much phospho-GBF1 (Figure 4D). To test whether phosphorylation was direct, we immunoisolated GFP-GBF1 from HEK293 cells and added recombinant Src. In the presence of ATP, GFP-GBF1 displayed marked phosphotyrosine levels compared to controls, indicating that GBF1 is a direct substrate of Src (Figure 4E, Figure 4—figure supplement 1C).

Figure 4. Src phosphorylates two tyrosines Y876 and Y898 at the C-terminus of the GBF1 Sec7d.

(A) SDS-PAGE analysis of phosphotyrosine (pY) levels in endogenous GBF1 using HEK-IS cells after imidazole (imdz) treatment. Quantification of pY-GBF1 in three replicates shown on the graph (right). (B) SDS-PAGE analysis of pY levels on GFP-GBF1 immunoprecipitation (IP) from HEK-IS cell line after imdz treatment. Quantification of pY-GBF1 in three replicates shown on the graph (right). (C) SDS-PAGE analysis of pY in GBF1 in HEK293T cells expressing either inactive SrcKM or active SrcEG. (D) SDS-PAGE analysis of pY levels on endogenous GBF1 IP from wild-type and vSrc transformed NIH3T3 cell lines. Quantification of pY-GBF1 in four replicates from two independent experiments shown on the graph (right). (E) Quantification of pY in GBF1 after in vitro phosphorylation. Immunoprecipitated GFP or GFP-GBF1 was incubated with recombinant Src protein in the presence or absence of nucleotide ATP. (F) Schematic of the 10 tyrosine residues in GBF1 that were identified by targeted mass spectrometry after exposure to Src. (G) Amino acid sequence alignment of GBF1 from various species. The sequences of GBF1 at Y876 and Y898 of Homo sapiens (NP_004184) was aligned with that of Mus musculus (NP_849261), Saccharomyces cerevisiae (NP_010892), Caenorhabditis elegans (NP_001255140), and Danio rerio (XP_009305378), revealing conservation of both residues. (H) Y876 is conserved and observed to be phosphorylated in other GEFs BRAG2, ARNO, and BIG1 based on the PhosphoSitePlus database. (I) SDS-PAGE analysis of wild-type GFP-GBF1 or GFP-GBF1-Y876F mutant immunoprecipitated from HEK293T cells expressing inactive SrcKM or active SrcEG. Phosphorylation at Y876 was marked by the 2P4 antibody. (J) SDS-PAGE analysis of Y876 phosphorylation on endogenous GBF1 IP from HEK-IS cell line over various durations of imdz treatment. (K) Y876 phosphorylation of GBF1 in an in vitro phosphorylation assay. (L) SDS-PAGE analysis of the total and Y876 phosphorylation on endogenous GBF1 in HeLa cells over the duration of 50 ng/ml platelet-derived growth factor (PDGF) stimulation. (M) SDS-PAGE analysis of Y876 phosphorylation on endogenous GBF1 in A431 cells over time of 100 ng/ml EGF stimulation. Values on graphs indicate the mean ± SD. Statistical significance (p) was measured by two-tailed paired t-test. *p<0.05, **p<0.01, ***p<0.001 relative to untreated cells. NS, nonsignificant.

Figure 4.

Figure 4—figure supplement 1. High cross-species conservation of tyrosine residues phosphorlated in GBF1.

Figure 4—figure supplement 1.

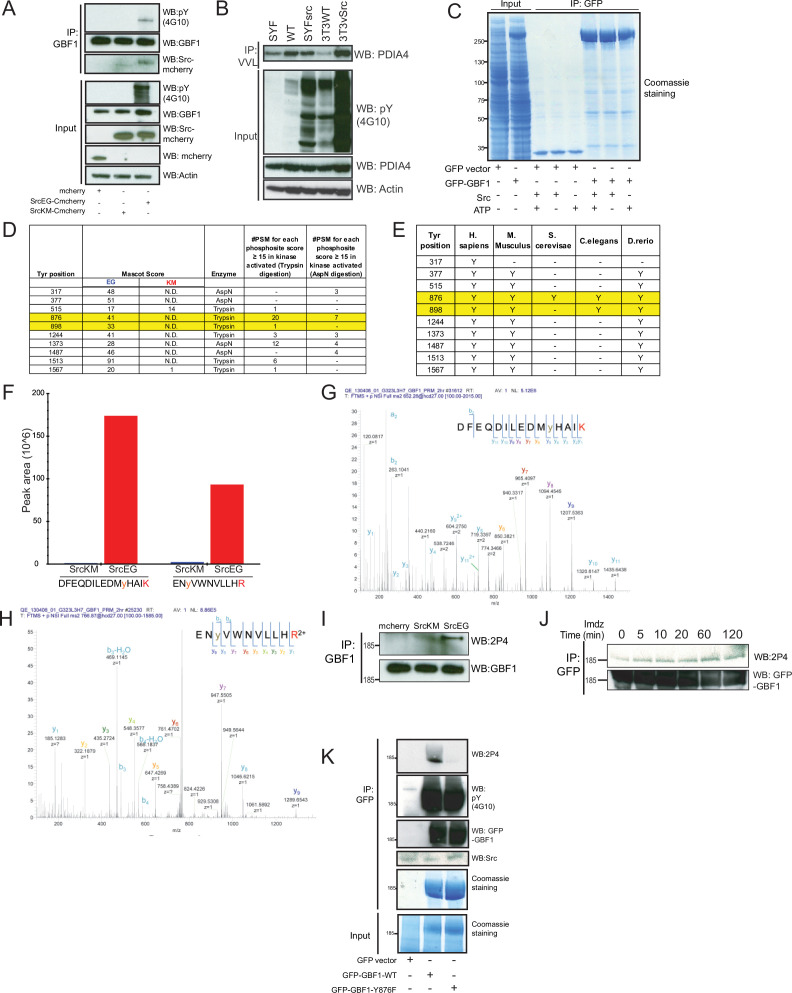
(A) SDS-PAGE analysis of Y876 phosphorylation levels in endogenous GBF1 in cells expressing empty mCherry vector, inactive SrcKM, or active SrcEG. (B) Immunoblot analysis of the levels of Tn-modified PDIA4 from Vicia villosa lectin (VVL) immunoprecipitation (IP) in mouse embryonic fibroblasts WT, SYF, and SYFsrc as well as mouse fibroblasts NIH3T3 WT and 3T3vSrc. SYF cells are knockout of Src, Yes, and Fyn while SYFsrc cells are SYF cells with stable transfection of c-Src. 3T3vsrc cells are v-Src transformed 3T3 cells. (C) Corresponding Coomassie staining of immunoprecipitated GFP and GFP-GBF1 purified from HEK293T cells that were used for in vitro Src kinase assay. The purified proteins on the beads were incubated with recombinant Src protein in the presence or absence of nucleotide ATP. (D) Table of the mascot scores and the frequencies of peptide-spectrum matches (PSM) that are more than or equal to 15 for each phosphosite on GBF1 that is coexpressed with SrcKM (KM) or SrcEG (EG). GBF1 was cleaved with either trypsin or endoproteinase AspN for analysis. (E) Table illustrating the conservation of each identified tyrosine residues that were found to be phosphorylated by Src. (F) Quantification of the peak area of the SILAC mass spectral of the peptides containing Y876 (DFEQDILEDMyHAIK) and Y898 (ENyVWNVLLHR) phosphorylation in SrcKM (blue bars) or SrcEG (red bars). (G) Mass spectra of Y876 phosphopeptide. (H) Mass spectra of Y898 phosphopeptide. (I) SDS-PAGE analysis of total pY levels on endogenous GBF1 in HeLa cells expressing empty mCherry vector, inactive SrcKM or active SrcEG. GBF1 was IP with an antibody targeting the N-terminus of the protein. (J) SDS-PAGE analysis of Y876 phosphorylation on GFP-GBF1 IP from HEK-IS cell line over various durations of imidazole treatment. (K) In vitro phosphorylation assay of GFP and GFP-GBF1 wild-type or mutant with recombinant Src protein. Total phosphorylation and phosphorylation of GBF1 at Y876 are detected by pY(4G10) and 2P4 antibodies, respectively.

To map the phosphorylation sites, GFP-GBF1 from HEK293 cells expressing active SrcEG was extracted from a gel separation and digested using trypsin and AspN. Phosphopeptides were analyzed with tandem mass spectrometry, revealing 10 phosphorylated tyrosine residues with high confidence (Figure 4F, Figure 4—figure supplement 1D). All the phosphopeptides identified were clearly increased in the presence of SrcEG but mostly not detectable with inactive SrcKM expression (Figure 4—figure supplement 1D).

Src phosphorylates two tyrosines at the C-terminus of GBF1 GEF domain

Ten phosphosites are challenging to study in parallel. We were particularly interested in the residues Y876 and Y898 because they are located respectively within the GEF/Sec7d and on a C-terminal loop connecting Sec7d and the HDS1 domain (Figure 4F). It suggested that they could be directly involved in the regulation of GBF1 GEF activity.

A database search revealed that Y876 is conserved in GBF1 homologues in various species (Figure 4G). Y898 is also conserved in GBF1 in most species (Figure 4G, Figure 4—figure supplement 1E). In contrast, the other phosphorylation sites are mostly conserved in vertebrates and Y317 is only present in human GBF1 (Figure 4—figure supplement 1E). We next compared Sec7 domains of different ARFGEFs and found Y876 to be highly conserved, while Y898 appeared specific for GBF1. Interestingly, a search on PhosphoSitePlus database indicates that multiple GEFs, including Brefeldin-Resistant Arf-GEF 2 (BRAG2, IQSEC1), Brefeldin A-Inhibited Guanine Nucleotide-Exchange Protein 1 (BIG1), and Cytohesin 2 (ARNO), can be phosphorylated on the tyrosine analogous to Y876 (Figure 4H).

We subsequently used targeted SILAC to quantify the intensity of phosphorylation on each site in HEK293 transiently transfected (Ong et al., 2002). GBF1, in the presence of SrcEG, displayed about 180-fold increase in phosphorylated Y876 peptide (DFEQDILEDMyHAIK) and 100-fold in increase in phosphorylated Y898 peptide (ENyVWNVLLHR) compared to SrcKM-expressing samples, suggesting that these sites are the major phosphorylation targets (Figure 4—figure supplement 1F–H).

Phosphorylation at Y876 in endogenous GBF1 is confirmed with a specific antibody

We next aimed to generate antibodies specific for phospho-Y876 and Y898. While our efforts on Y898 were unsuccessful, we obtained a monoclonal antibody named 2P4 after immunization with a Y876-containing phosphopeptide that reacted with phospho-GBF1 (Figure 4—figure supplement 1I). To verify specificity, wild-type GFP-GBF1 and mutant GFP-GBF1(Y876F) were coexpressed with SrcEG, immunoprecipitated, and probed with 2P4. While wild-type GBF1 showed strong reactivity and total phosphotyrosine levels were moderately affected, the band was completely abolished in the Y876F mutant (Figure 4I).

We used 2P4 to assess the kinetics of Y876 phosphorylation after Src activation in the HEK-IS system. Similarly to overall phosphotyrosine levels, phospho-Y876 was detected within 5 min of imidazole treatment and persisted for 2 hr (Figure 4J). Similar results were obtained with GFP-GBF1 (Figure 4—figure supplement 1J). We also verified that Y876 is a direct target of Src using the in vitro phosphorylation assay (Figure 4K, Figure 4—figure supplement 1K).

We also tested Y876 phosphorylation after growth factor stimulation. Starting with serum-starved HeLa cells stimulated with PDGF, endogenous GBF1 was immunoprecipitated and phospho-Y876 found to display similar kinetics to generic GBF1 tyrosine phosphorylation (Figure 4L). A431 cells, which express high levels of EGFR, were stimulated with 100 ng/ml of EGF (Fernandez-Pol, 1985). Similarly to PDGF with HeLa cells, phospho-Y876 was upregulated within 10–20 min (Figure 4M). To review, Y876 is a major site of phosphorylation by Src and is modified in physiological conditions of GALA activation.

Phosphorylation at Y876 and Y898 is required for Src-induced Arf1-GTP levels and GALNT relocation

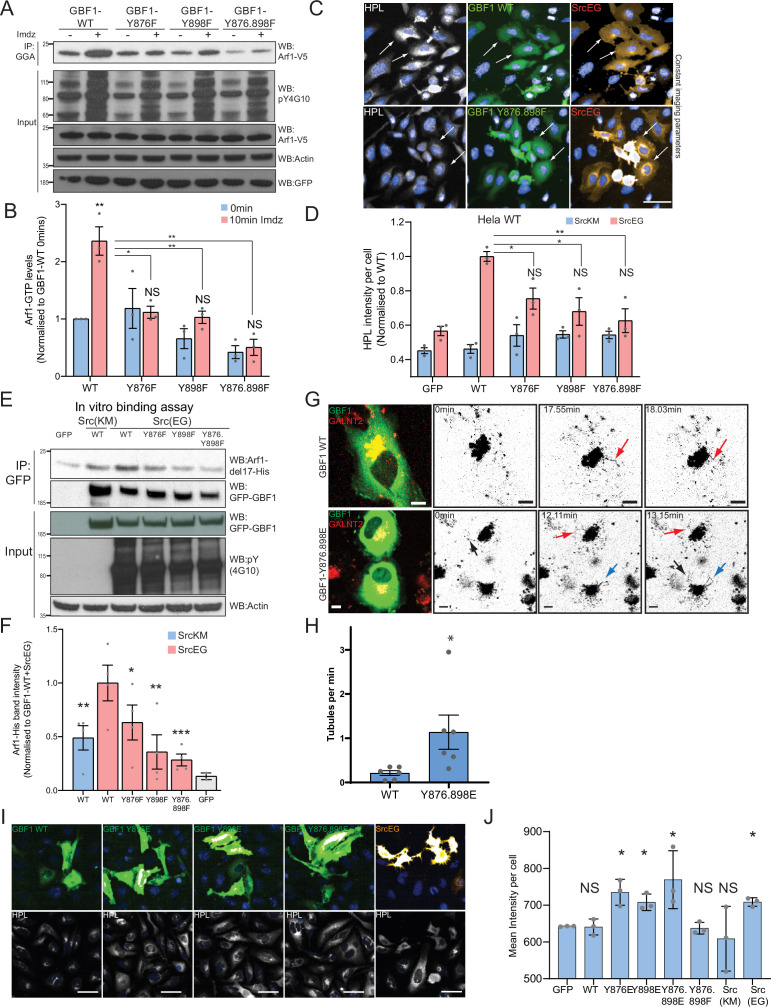
To test the functional importance of Y876 and Y898, we generated single and double tyrosine (Y) to phenylalanine (F) phospho-null mutants at position Y876 and Y898 (Y876F, Y898F, Y876.898F). We then measured Arf1 GTP loading after Src8A7F activation in the presence of transiently expressed wild-type or phospho-defective mutant GBF1. As previously observed, Arf1-GTP increased by ~2.5-fold within 10 min of imidazole treatment with wild-type GBF1 expression. This increase was abolished with the Y876F and double mutant, while residual activation was observed with the Y898F mutant (Figure 5A and B). Expression of the double mutant even reduced the basal Arf1-GTP levels.

Figure 5. Phosphorylation at Y876 and Y898 regulates GEF activity of GBF1.

(A) SDS-PAGE analysis of GTP-loaded Arf1 at 0 min (-) and 10 min (+) imidazole treatment in HEK-IS cells expressing wild-type GBF1 and phospho-defective mutants GBF1-Y876F, GBF1-Y898F, or GBF1-Y876.898F. (B) Quantification of Arf1-GTP loading levels in (A) from three independent experiments. Values were normalized to untreated cells (-) expressing wild-type GBF1. (C) Representative images of Helix pomatia lectin (HPL) staining in HeLa cells coexpressing wild-type GBF1 or GBF1-Y876.898F mutant with active SrcEG. Scale bar: 50 μm. (D) Quantification of HPL staining levels of cells coexpressing wild-type or mutant GBF1 with inactive SrcKM (blue bars) or active SrcEG (pink bars). Values were from three replicates. (E) SDS-PAGE analysis of the levels of recombinant Arf1-His bound to wild-type or phospho-defective GBF1 mutants immunoprecipitated (IP) from cells expressing inactive SrcKM or active SrcEG in an in vitro binding assay. (F) Quantification of the levels of bound Arf1-His. Values were from four experimental replicates and normalized to wild-type GBF1 IP from cells expressing active SrcEG from each experiment. IP’ed GFP protein used as a negative control for nonspecific binding with GFP (gray bar). (G) Still images from time-lapse imaging of GALNT2-mCherry in HeLa cells that were either transfected with wild-type GBF1 (GBF1 WT) or phosphomimetic mutant (GBF1 Y876.898E). Arrows indicate tubule formation. Scale bar: 5 μm. (H) Quantification of the number of tubules per minute of acquisition. (I) Representative images of HPL staining in HeLa cells expressing phosphomimetic (Y-to-E) mutants 4 hr post transfection. (J) Quantification of HPL staining levels in (I). Values on graphs indicate the mean ± SD. Statistical significance (p) was measured by two-tailed paired t-test. *p<0.05, **p<0.01, ***p<0.001 relative to untreated cells or to 10 min imidazole (imdz)-treated cells expressing wild-type GBF1. NS, nonsignificant.

Figure 5.

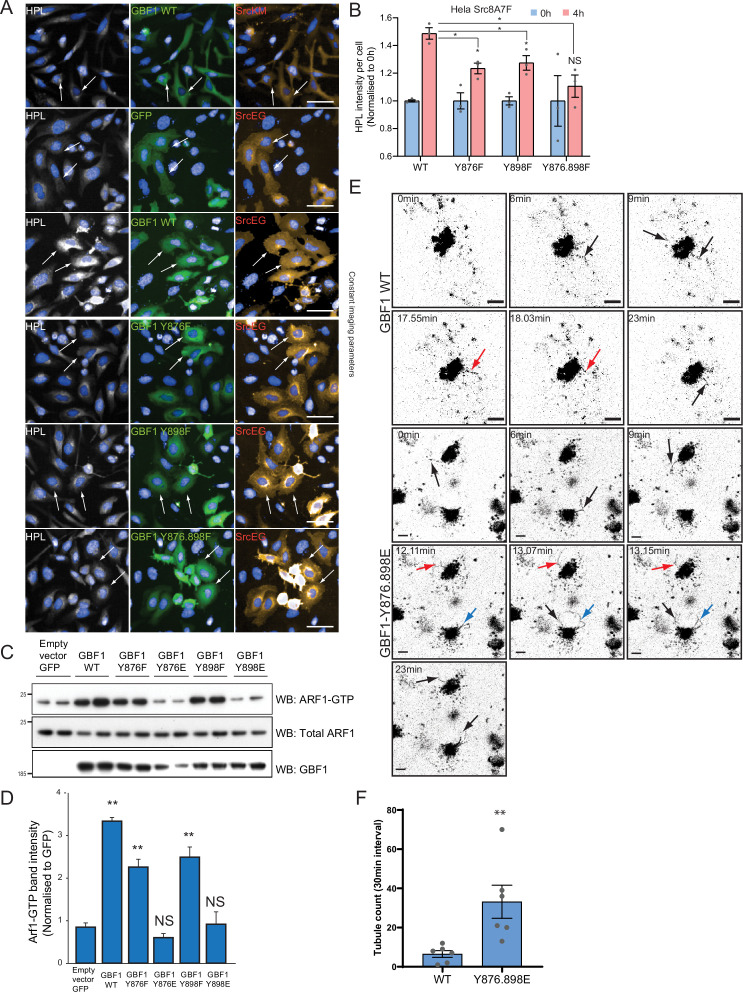
Figure 5—figure supplement 1. Phosphomimetic mutants at Y876 and Y898 recapitulate the effects of active Src.

Figure 5—figure supplement 1.

(A) Representative images of Helix pomatia lectin (HPL) staining in HeLa cells coexpressing wild-type GBF1 or phospho-defective mutants with active SrcEG or inactive SrcKM shown in Figure 5C. Scale bar: 50 μm. (B) Quantification of HPL staining levels of HeLa-IS cells coexpressing with wild-type or phospho-defective mutant GBF1 without (blue bars) or with 4 hr imidazole (imdz) treatment (pink bars). Values were from three experimental replicates. (C) SDS-PAGE analysis of total Arf1 and GTP-loaded Arf1 in HEK293T cells expressing phospho-defective and phosphomimetic mutants of GBF1. Two experimental replicates for each condition are shown in the blot. (D) Quantification of Arf1-GTP loading in (C). (E) An extension of images from time-lapse imaging of GALNT2-mCherry in HeLa cells that were either transfected with wild-type GBF1 (GBF1 WT) or phosphomimetic mutant (GBF1 Y876.898E) shown in Figure 5G. Arrows indicate tubule formation. Scale bar: 5 μm. (F) Quantification of the number of tubules observed in the first 30 min of acquisition. Values on graphs indicate the mean ± SD. Statistical significance (p) was measured by two-tailed paired t-test. *p<0.05 and **p<0.001 relative to untreated (0 hr) or GFP-expressing cells. NS, nonsignificant.
Figure 5—video 1. Video of tubule formation in GALNT2-mCherry-expressing HeLa cells transfected with wild-type GBF1 (GBF1 WT).
Download video file (12.3MB, mp4)
Scale bar: 5 μm.
Figure 5—video 2. Video of tubule formation in GALNT2-mCherry-expressing HeLa cells transfected with phosphomimetic GBF1 mutant (GBF1 Y876.898E).
Download video file (70.4MB, mp4)
Scale bar: 5 μm.

Next, we tested whether GALNT relocation was affected by the phospho-defective mutants by measuring Tn levels. GBF1-Y876F or GBF1-Y898F significantly repressed Tn levels in SrcEG-expressing cells (Figure 5C and D, Figure 5—figure supplement 1A). There was also a reduction of Tn levels by phospho-defective GBF1 in the presence of activated Src8A7F (Figure 5—figure supplement 1B). These results indicate that the GBF1 mutants do not support the formation of GALNT retrograde transport carriers and may act as dominant-negative.

We next tested their effect on Arf binding. In the in vitro binding assay with purified Arf1-del17 and immuno-purified GFP-GBF1 wild-type and phospho-defective proteins, single mutants of Y876 or Y898 had reduced Arf1 binding by 40 and 60%, respectively, with more than 70% for the double mutant (Figure 5E and F). In fact, the double mutant had lower binding to Arf than nonphosphorylated wild-type GBF1. These results confirm that the phosphorylation on tyrosines Y876 and Y898 increases affinity of GBF1 for Arf1-GDP.

A phosphomimetic mutant at Y876 and Y898 recapitulates GALNT tubule formation

Next, we tested the effect of Y to E phosphomimetic mutations (Y876E and Y898E). First, we observed that after 24 hr overexpression, we observed a reduction of basal GTP loading levels by more than 70% (Figure 5—figure supplement 1C and D). While it was initially surprising, this result actually recapitulates the effect of long-term expression of constitutively active SrcEG (Figure 2—figure supplement 1B). It suggests that the Y-to-E mutants may induce the same effects with similar kinetics on Arf nucleotide loading than Src. Similarly to Src expression, long-term (~48 hr) expression of the phosphomimetic GBF1 mutant reduces COPI levels at the Golgi.

We next tested if phosphomimetic GBF1 mutant could induce the relocation from the Golgi of GALNTs. We imaged GALNT2-mCherry in cells very transiently expressing phosphomimetic double mutant GFP-GBF1 Y876.898E (YE). We performed this experiment at early times (12–24 hr) after transfection when the GFP becomes just detectable. Remarkably, cells expressing the YE mutant showed a high incidence of tubule formation, while cells expressing wild-type GBF1 (GBF1 WT) displayed very little (Figure 5G and H, Figure 5—figure supplement 1E and F, Figure 5—videos 1 and 2). In YE mutant-expressing cells, tubules appeared also to be more extended and to persist longer than with WT GBF1 (Figure 5G, Figure 5—figure supplement 1E; red and blue arrows). YE mutant cells displayed a fivefold higher rate of tubule formation per minute of imaging compared to their WT counterpart (Figure 5H).

Expression of the phosphomimetic mutants of GBF1 also resulted in a mild but significant increase in Tn levels in cells transfected with YE mutants compared to GBF1 WT cells (Figure 5I and J), indicating GALNT relocation to the ER. Altogether, the data indicate that tyrosine phosphorylation of GBF1 is a key driver for GALNT retrograde tubule traffic.

Phosphorylation on Y898 probably releases a Sec7d-HDS1 intramolecular interaction

We next wondered how the phosphorylations affect GBF1’s activity. Y898 is located in the linker region between the Sec7d and HDS1 domains of GBF1. While the Sec7d structure of GBF1 has not been resolved, GBF1 Sec7d shares at least 65% homology with several other GEFs, so it can be modeled relatively accurately. Unfortunately, this is not the case for HDS1 for which there is no structural information. We could model the Sec7d and the linker domain using the GBF1 sequence and the resolved structures of the GEFs ARNO, Cytohesin-1, and Grp1. In this model, the linker is located close to a pocket of negatively charged residues in the Sec7d (Figure 6—figure supplement 1A). Molecular dynamics (MD) revealed a repulsion of the linker away from Sec7d after phosphorylation (Figure 6—figure supplement 1B, Figure 6—video 1). This suggests that phosphorylation could relieve an intramolecular interaction between the Sec7 domain and the HDS1 domain. ARNO/Grp1/Cytohesin and BIG family contain Pleckstrin Homology (PH) and HDS domains, respectively, in C-term of Sec7d that interacts and inhibits the GEF activity for ARNO by about 14-fold (Stalder et al., 2011) and about 7-fold for BIG (Richardson et al., 2012). Therefore, we hypothesize that the HDS1 of GBF1 could similarly inhibit the Sec7d and phosphorylation at Y898 would alleviate this Sec7d-HDS1 inhibition.

Phosphorylation of Y876 partially unfolds GBF1 Sec7d domain, increasing affinity for Arf1

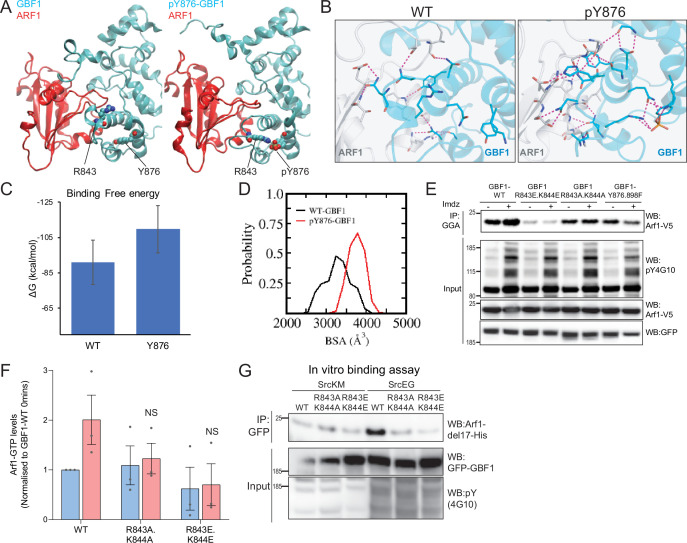
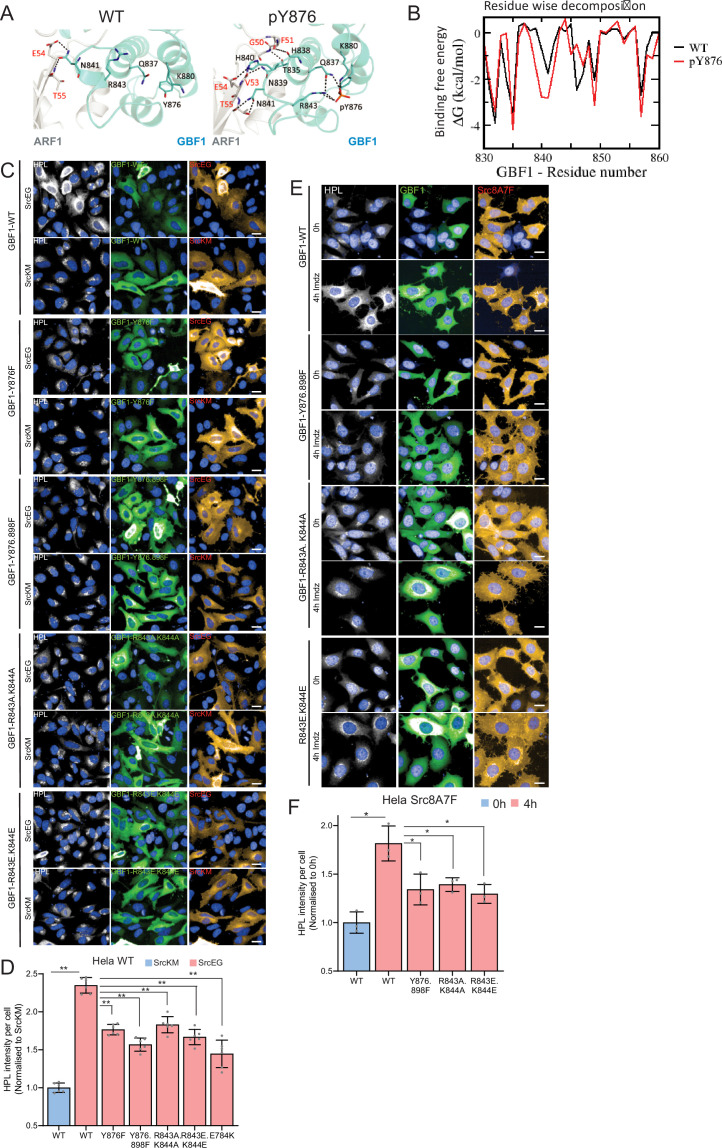
By contrast with Y898, Y876 is located within the Sec7d. There are 10 alpha helices in Sec7d, and Y876 is present on helix J (Cherfils et al., 1998). We modeled the interaction of GBF1 with Arf1 based on available structures and observed that helix J is protruding in the interface between the two proteins (Figure 6—video 2). When we simulated Y876 phosphorylation, the negative charge was attracted by the positively charged residues arginine 843 (R843) and lysine 844 (K844) at the end of helix H. This, in turn, led to a partial unwinding of helix H, leading to an extension of the loop between helices H and I (Figure 6A). This partial unfolding and loop extension would result in better bond formation between Sec7d and Arf1 (Figure 6B, Figure 6—figure supplement 2A). This translates into a reduced free binding energy (Figure 6C, Figure 6—figure supplement 2B) and an increased probability of buried surface area (BSA) between the Sec7d and Arf1 (Figure 6D) in the phosphorylated state. Higher BSA indicates tighter packing interactions, and thus, higher affinity between the molecules. Thus, the loop extension induced by phosphorylation is predicted to favor the interaction with Arf1, a result consistent with our in vitro binding assay results with phospho-GBF1 (Figures 3I and 5E).

Figure 6. Phosphorylation on Y876 increases GBF1 Sec7d affinity for Arf1.

(A) Structural basis for the binding of unphosphorylated GBF1 Sec7d and Y876-phosphorylated GBF1 Sec7d with Arf1. Cartoon representations of conformations extracted from the molecular dynamics (MD) simulations of the unphosphorylated GBF1 Sec7d (left of panel A; cyan) and Y876-phosphorylated GBF1 Sec7d (right of panel A; cyan) bound to Arf1 (red color). MD suggests the unwinding of the helix H to form an extended loop between helices H and I through increased attractions between positive charges on R843 and K844 on the loop with the negative charges on phosphorylated Y876 (see Figure 6—video 2). The Sec7d of GBF1 (blue), in turn, interacts more with Arf1 (red). (B) Residues involved in GBF1:Arf1 interprotein are shown as sticks, and the H-bonds highlighted as black dashed lines. The Sec7d is shown in blue while Arf1 protein is in gray. Refer to Figure 6—figure supplement 2 for the identities of the residues. (C) Estimation of the free energies (ΔG) of the interactions between the unphosphorylated GBF1 Sec7d and Arf1 and between the Y876-phosphorylated GBF1 Sec7d and Arf1. Calculations carried out using the MMPBSA approximations averaged over the conformations generated from MD simulations of the complexes; larger negative values represent higher affinities. GBF1 Sec7d has a higher affinity for Arf1 when it is phosphorylated at Y876. (D) Probability distributions of the buried surface area (BSA) between GBF1 Sec7d and Arf1. (E) SDS-PAGE analysis of GTP-loaded Arf1 at 0 min (-) and 10 min (+) imidazole treatment in HEK-IS cells expressing wild-type GBF1, Y876.898F, and the HI loop mutants. (F) Quantification of Arf1-GTP loading levels in (E) in three experimental replicates. Values were normalized to untreated cells (-) expressing wild-type GBF1. (G) SDS-PAGE analysis of the levels of recombinant Arf1-His bound to wild-type or the HI loop mutants GFP-GBF1 immunoprecipitation (IP) from cells expressing inactive SrcKM or active SrcEG in an in vitro binding assay. Values on graphs indicate the mean ± SD. Statistical significance (p) was measured by two-tailed paired t-test. NS, nonsignificant.

Figure 6.

Figure 6—figure supplement 1. Phosphorylation at Y898 appears to release an intramolecular interaction between Sec7d and HDS1 domain.

Figure 6—figure supplement 1.

(A) Electrostatic map of the charged residues on GBF1 Sec7d in the presence (right) and absence (left) of phosphorylation on Y898 on the C-terminal linker. (B) Molecular dynamics (MD) snapshot of the release of the C-terminal linker from the main body of the Sec7d when Y898 is phosphorylated (see Figure 6—video 1). Values on graphs indicate the mean ± SD. Statistical significance (p) was measured by two-tailed paired t-test. *p<0.05 and **p<0.001 relative to untreated cells or to 10 min imidazole (imdz)-treated cells expressing wild-type GBF1. NS, nonsignificant.
Figure 6—figure supplement 2. Positive-charged residues R843 and K844 are required for the Y876 phosphorylation effect.

Figure 6—figure supplement 2.

(A) Representation of the predicted electrostatic bonds between the GBF1:Arf1 complex in the unphosphorylated (WT) and Y876-phosphorylated states. The Sec7d is shown in blue while Arf1 protein is in gray. Residues involved in interprotein interactions are shown as sticks, with interprotein H-bonds highlighted as black dashed lines. (B) Per-residue decompositions of the binding free energies of interactions between the Y876-phosphorylated GBF1 Sec7d and Arf1 and between unphosphorylated GBF1 Sec7d and Arf1 using the MMGBSA approximations averaged over the conformations generated from molecular dynamics (MD) simulations of the complexes. (C) Representative images of Helix pomatia lectin (HPL) staining in HeLa cells coexpressing wild-type or HI loop mutants with active SrcEG. Scale bar: 50 μm. (D) Quantification of HPL staining levels of cells coexpressing wild-type or mutant GBF1 with inactive SrcKM (blue bar) or active SrcEG (pink bars). Values were from six replicates from two independent experiments. (E) Representative images of HPL staining in HeLa-IS cells coexpressing wild-type or HI loop mutants. Scale bar: 50 μm. (F) Quantification of HPL staining levels of HeLa-IS cells coexpressing wild-type or mutant GBF1 that were unstimulated (0 hr, blue bar) or stimulated with 5 mM imidazole (imdz) (4 hr, pink bars). Values were from three replicates. Values on graphs indicate the mean ± SEM. Statistical significance (p) was measured by two-tailed paired t-test. *p<0.05 and **p<0.001 relative to control cells. NS, nonsignificant.
Figure 6—video 1. Molecular dynamics (MD) simulation of the Sec7d and C-terminal linker of wild-type GBF1 (GBF1-WT, left) and when Y898 is phosphorylated (GBF1-pY898, right).
Download video file (4.9MB, mp4)
Figure 6—video 2. Molecular dynamics (MD) simulation of unphosphorylated GBF1 Sec7d (GBF1-WT, left panel, cyan) and Y876-phosphorylated GBF1 Sec7d (GBF1-pY876, right panel, cyan) with Arf1 (in red).
Download video file (7.1MB, mp4)
H refers to helix H of GBF1 Sec7 domain. Positive charges on R843 are as indicated.

Since the model predicts that the positive charges on either R843 and K844 are important for the conformational change induced by phosphorylation, we mutated these sites into glutamic acids (R843E.K844E) or neutral charges with alanine (R843A.K844A). We next tested if these HI loop mutants have an impact on GTP loading on Arf1 in cells. The introduction of negative charges in the R843E.K844E mutant resulted in a massive reduction in basal cellular Arf1-GTP levels by about 90% (Figure 6E and F). On the other hand, the mutant with neutral charges (R843A.K844A) did not have an effect on the basal Arf1-GTP levels. However, when we stimulated Src8A7F with imidazole, the cells expressing the R843A.K844A mutant did not upregulate Arf1 GTP loading (Figure 6E and F). These results indicate that the positively charged residues in the loop between helices H and I are required for the Y876 phosphorylation effect.

The model predicts that blocking the partial unfolding of helix H would reduce the interaction of GBF1 with Arf1 (Figure 6B, Figure 6—figure supplement 2A). As expected, we found that the mutants (both E and A) were insensitive to SrcEG in terms of enhanced binding to Arf1-GDP (Figure 6G).

We next tested whether blocking helix H unfolding would prevent Src-induced GALNT relocation to the ER. HPL staining intensities in cells coexpressing constitutively active SrcEG and wild-type or the HI loop mutants (both A and E forms) were measured. The HI loop mutants resulted in a significant reduction in Tn levels, at levels similar to GBF1-Y876F Figure 6—figure supplement 2C and D. A similar reduction was observed in HeLa Src8A7F cells stimulated with imidazole (Figure 6—figure supplement 2E and F).

Altogether, these results strongly support a model where the phosphorylation on Y876 induces a partial melting of the Sec7d helix H, which in turn facilitates GBF1 binding to Arf1-GDP.

Discussion

In this report, we describe how a tyrosine kinase, Src, controls a key regulator of membrane trafficking, GBF1, and in turn mediates the movement of Golgi enzymes. The relocation of the GALNTs from the Golgi to the ER has been nicknamed the GALA pathway, for GALNTs activation, and its importance for tumor growth has been described previously (Gill et al., 2013; Nguyen et al., 2017; Ros et al., 2020). GALA induction by the oncogenic Src kinase has been described, but it remains unclear how Src induces this relocation (Gill et al., 2010).

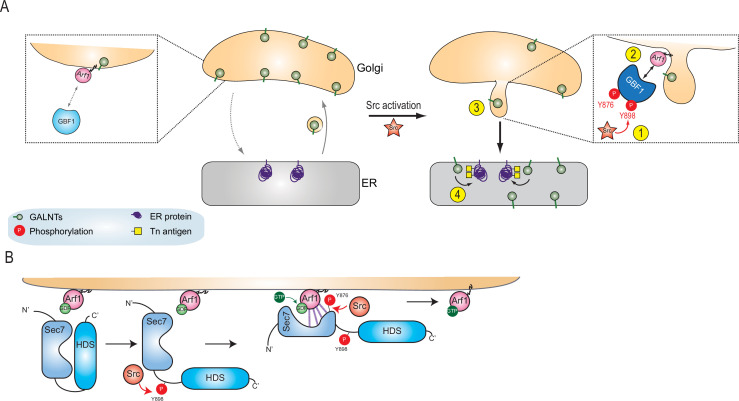
Here, we propose a model where Src phosphorylates GBF1 on multiple tyrosines, which results in an extrusion of GALNTs from Golgi membranes in tubules and eventually their relocation to the ER (Figure 7A). The two phosphorylation sites at and near the Sec 7 domain of GBF1 increase its affinity for Arf-GDP (Figure 7B). Thus, Src increases the rate of retrograde traffic of GALNTs through the phosphorylation of GBF1 and regulation of the GBF1-Arf interaction.

Figure 7. Models of GBF1 phosphorylation effects on binding to Arf1 and on the formation of tubules.

Figure 7.

(A) In normal cells, GBF1 and Arf interaction are limited and retrograde traffic rate is moderate. Upon Src activation, GBF1 is phosphorylated on at least two tyrosines, Y876 and Y898 (step 1), which results in increased affinity for Arf-GDP on Golgi membranes (step 2). These reactions ultimately yield the formation of tubules containing GALNTs (step 3) and the enzymes’ relocation to the endoplasmic reticulum (ER) where they glycosylate resident and neo-synthesized substrates (step 4). (B) Detailed representation of GBF1 phosphorylation: we hypothesize an interaction between Sec7 and HDS1, which is released by Y898 phosphorylation. Y876 phosphorylation affects the fold of the Sec7 domain itself, apparently inducing a partial melting and favoring binding to the Arf protein. This enhanced interaction leads to increased production of Arf-GTP.

Src kinase activity is critical for its oncogenic activity, and decades of research have revealed that Src is a highly regulated kinase with a large repertoire of substrates (Reynolds et al., 2014). GBF1 was not previously recognized as a prominent substrate, and its phosphorylation sites appear only partially in some databases of systematic mass spectrometry approaches. In our study, we found that the GBF1-phosphorylated form is relatively difficult to detect in comparison with other substrates. This is partly because GBF1 protein levels are relatively low, almost 50 times less abundant than Arf1 (Itzhak et al., 2016). In addition, others have reported that GBF1 is an unstable protein, which we have also observed with recombinant GBF1 (Bhatt et al., 2016). These characteristics might be evolutionary linked to the ‘toxicity’ of GBF1, whose overexpression affects Golgi organization and cell adhesion. While being a quantitatively minor Src substrate, GBF1 might be a critical substrate for the oncogenic activity of the kinase, transducing Src activation into changes in cell surface protein glycosylation. Specific inhibitors of Src/GBF1 interaction might thus have a therapeutic interest.

While phospho-GBF1 is not very abundant, Src can phosphorylate multiple sites on the GEF. GBF1 is a large protein with multiple domains, which can interact with one another. For instance, the N-terminal Dimerization and Cyclophilin Domain (DBS) interacts with the Homology Upstream of Sec7 domain (HUS) (Ramaen et al., 2007). The phosphorylation of the tyrosines in positions 317, 377, and 515 could alter this intramolecular interaction; while the five tyrosines in the Homology Downstream of Sec 7 domain 2 and 3 (HDS2/3) could affect other intra- or intermolecular interactions.

Mass spectrometry data and residue conservation analysis suggest that Y876 and Y898, located at and near the C-terminus of Sec7 domain, are particularly important. Based on the modeling efforts, Y876 phosphorylation induces the partial melting of an alpha-helix within the Sec7d, allowing for better binding to Arf. Partial melting is dependent on the phospho group interacting with either residues R843 or K844. Consistently, an R843A.K844A double mutant does not increase binding to Arf1 nor Arf1-GTP levels following Src activation. The R843E.K844E mutant is also unable to respond to Src, and in addition, it induces a reduced basal Arf-GTP level. This is consistent with the Sec7d of this mutant being locked into a low Arf-binding conformation. Y876 is conserved in all the Sec7d proteins we looked at. For several other GEFs, phosphorylation of the corresponding residue has been reported in various high-throughput databases. These findings suggest that the helix melting regulation is shared by other GEF proteins and could be a widespread mechanism for tyrosine kinases to regulate the GEF family of proteins.

The effect of Y898 phosphorylation is more hypothetical; it might release an inhibitory interaction between the Sec7d and the HDS1 domain (Figure 7B). However, to our knowledge, such interaction has not been reported. Notwithstanding, the data suggest that phosphorylation on both residues synergize to stimulate binding of GBF1 to Arf1-GDP. Y898 residue is highly conserved among vertebrates and invertebrates homologues of GBF1, suggesting that its phosphorylation is an ancient, conserved mechanism of regulation.

The importance of Y876 and Y898 phosphorylation is confirmed by the induction of tubules by the double phosphomimetic mutant. The tubules could only be observed at early time points after transfection of the mutant expression. At later time points, we observed a fragmentation of the Golgi and reduction of COPI staining. Similarly, we observed a peak of tubules formation shortly after Src activation (20–30 min). This kinetic control of Src allows distinguishing its short- to long-term effects on the Golgi. Like the phosphomimetic GBF1, Src activation tends to fragment the Golgi and reduce COPI staining.

The tubules are individually transient but extended, often measuring several micrometers long. Tubules are enriched in GALNT but depleted in the Golgi enzyme B4GAL-T1 and Giantin. By contrast, we did not observe an increase in COPI-enriched structures or vesicles in the Golgi vicinity after Src activation. The data thus suggest that GALNTs relocation is mediated by tubular transport carriers. Several groups have reported tubules-derived transport carriers emanating from the Golgi (Bottanelli et al., 2017; Sengupta et al., 2015). In a recent study, live super-resolution microscopy revealed COPI cups on Golgi membranes with surprisingly no evidence of COPI vesicles detaching (Bottanelli et al., 2017). Perhaps these results are to be compared with the proposal that ER to Golgi traffic is mediated by tubular transport carriers rather than COPII-coated vesicles (Raote and Malhotra, 2019; Shomron et al., 2021; Weigel et al., 2021).

How GBF1 phosphorylation might induce these tubules remains to be established. Our results indicate an increase in GBF1 affinity for Arf1-GDP, and mutagenesis of GBF1 suggests that this affinity increase is critical for the relocation (e.g., mutant R843A,K844A effect on Tn increase). GBF1 is recruited to Golgi membranes at the time of tubule formation. As shown previously, GBF1 Golgi membrane binding recruitment is dependent on Arf-GDP (Quilty et al., 2018). So, a possible model is that a membrane-tethered GBF1-Arf-GDP complex could recruit motors to pull on the membrane. Interestingly, the GBF1/Arf1 complex has been shown to interact with the microtubule motor Miro at mitochondria (Walch et al., 2018).

GBF1 is involved in different physiological situations in addition to the regulation of GALNTs activity (Kaczmarek et al., 2017). The axis Src-GBF1-Arf might also be involved in the regulation of Golgi organization based on the work by Luini’s group (Consoli et al., 2012; Luini and Parashuraman, 2016; Pulvirenti et al., 2008). GBF1-Arf are also involved in the positioning of mitochondria, a locale where Src kinase has also been detected (Ackema et al., 2014; Hebert-Chatelain, 2013; Walch et al., 2018).

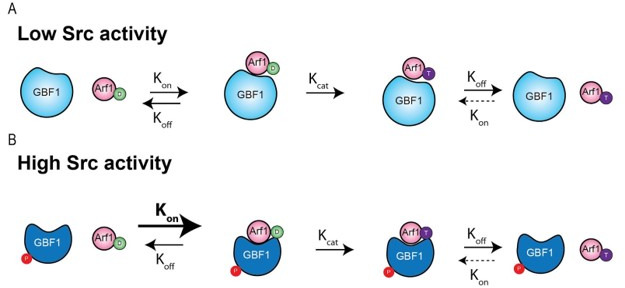
We observed a wave of Arf-GTP production after Src activation. This burst of Arf-GTP could, alternatively, drive GALNT-containing tubule formation as it was previously shown that Arf-GTP can deform membranes (Krauss et al., 2008). We interpret the increase in Arf-GTP as phosphorylation facilitating the formation of a GBF1-Arf-GDP complex, while, based on the simulation, phosphorylation may not affect the GTP exchange catalytic reaction. The nucleotide exchange reaction can indeed be described with a KD for the binding of both proteins and a kcat for the conversion. Phosphorylation might regulate the KD without affecting the kcat. To note, overexpression of GBF1 alone increases Arf-GTP levels, indicating that GBF1 is a limiting factor and supporting the idea that an increase in affinity would result in higher Arf-GTP level.

Similarly to tubule formation, Arf1 and GBF1 recruitment on membranes and Arf1-GTP levels peak within 10–30 min after Src activation, suggesting a self-limiting mechanism. GBF1 phosphorylation itself is sustained over hours. Membrane-bound Arf-GDP, which is important for GBF1 recruitment, is probably also not the limiting factor because total membrane-bound Arf increases significantly after Src activation. The limiting factor may arise from the export of GALNTs-containing carriers, resulting in the depletion of an unidentified receptor on Golgi membranes. Indeed, Arf-GDP requires a protein receptor to bind to Golgi membranes (Donaldson and Jackson, 2011). Two candidates have even been proposed, the p23 protein and the SNARE membrin (Gommel et al., 2001; Honda et al., 2005). GBF1 also appears to require an additional receptor to bind efficiently to Golgi membranes (Quilty et al., 2018). It is possible that after Src activation either of these receptors (or both) are transported from Golgi membranes by the tubules-derived carriers. This could explain the peak in Arf-GTP levels and why overnight Src expression, while inducing a marked GALNT relocation, also results in a reduction of Arf-GTP levels: the Arf receptor may have been markedly depleted at the Golgi. By contrast, wild-type GBF1 overexpression, not promoting GALNTs relocation, would not induce this depletion and can thus stably increase Arf-GTP levels.

To sum up, our study reveals a key mechanistic insight into how Src regulates Golgi to ER retrograde traffic. It suggests that GBF1 binding to Arf-GDP plays a driving role in the formation of transport carriers. The understanding of this complex transport mechanism might help interfere therapeutically with a process driving the invasiveness of solid tumor cancer cells.

Materials and methods

Cloning and cell culture

Wild-type HeLa cells were from V. Malhotra (CRG, Barcelona). HEK293T cells were a gift from W. Hong (IMCB, Singapore). NIH3T3 and NIH3T3-vsrc mouse fibroblast were a gift from X. Cao (IMCB). Cell lines were previously purchased from ATCC and were authenticated by the vendor and cell morphology. All cell lines were verified to be free of mycoplasma contamination. Cells were maintained in DMEM with 10% fetal bovine serum (FBS) except for HEK293T, which was cultivated in 15% FBS. All cells were grown at 37°C in a 10% CO2 incubator. Plasmids encoding full-length wild-type chicken SRC and an E378G mutant were a gift from Roland Baron (Harvard Medical School, Boston, MA). Src8A7F construct was obtained from Philip Cole’s laboratory (Johns Hopkins University School of Medicine). The human GALT-GFP construct corresponds to the first 81 AA of human GALT fused in frame with Aequorea coerulescens green fluorescent protein, allowing targeting of the chimeric protein to medial and trans cisternae. The construct was purchased from Clontech Laboratories, Inc, Human GALNT2 (NM_004481) was cloned from a cDNA library generated from HT29 cells. All constructs were cloned into entry vector pDONR221 (Invitrogen, Life Technologies Corporation, Carlsbad, CA), and subsequently, gateway destination vectors expressing either emGFP or mCherry tag as described in Gill et al., 2010. All constructs were verified by sequencing and restriction enzyme digests before use. HeLa and HEK293T cell lines stably expressing Src8A7F-CmCherry or GALNT2-GFP were generated by lentiviral infection as described in Gill et al., 2013, and subsequently, FACS sorted to enrich for mCherry- or GFP-expressing cells.

Antibodies and reagents

HPL conjugated with 647 nm fluorophore, Alexa Fluor secondary antibodies, and Hoechst 33342 were purchased from Invitrogen. Anti-GALNT1 for immunofluorescence staining was a gift from U. Mendel and H. Clausen (University of Copenhagen, Denmark). Anti-GBF1 antibody for IP was from BD Biosciences (Franklin Lakes, NJ). Anti-GBF1 (C-terminus), anti-Giantin, and anti-Arf1 were from Abcam (Cambridge, MA). Human recombinant growth factors PDGF and EGF were purchased from BD Biosciences. Imidazole was purchased from Sigma-Aldrich (St. Louis, MO). GGA3 PBD agarose beads were purchased from Cell Biolabs, Inc (San Diego, CA). GTP-trap agarose beads were purchased from ChromoTek GmbH, Germany.

Automated image acquisition and quantification

The staining procedures were performed as described in Chia et al., 2014. Briefly, images were acquired sequentially with a ×20 objective on a laser scanning confocal high-throughput microscope (Opera Phenix, PerkinElmer Inc). Image analysis was performed using the Columbus Software (version 2.8.0). GFP and mCherry-expressing cells were selected based on the intensity cutoff of the top 10% of expressing cells. The HPL staining intensity of the selected cell population was quantified by drawing a ring region outside the nucleus that covers most of the cell area. The HPL intensity per cell of each well was quantified. Statistical significance was measured using a paired t-test assuming a two-tailed Gaussian distribution.

High-resolution fluorescence microscopy

The procedures were performed as described in Chia et al., 2014. Briefly, cells were seeded onto glass coverslips in 24-well dishes (Nunc, Denmark) before various treatments. They were fixed with 4% paraformaldehyde-4% sucrose in D-PBS, permeabilized with 0.2% Triton-X for 10 min, and stained with the appropriate markers. This was followed by secondary antibody staining for 20 min before mounting onto glass slides using FluorSave (Merck). The cells were imaged at room temperature using an inverted confocal microscope (IX81; Olympus Optical Co. Ltd, Tokyo, Japan) coupled with a CCD camera (model FVII) either with a ×60 objective (U Plan Super Apochromatic [UPLSAPO]; NA 1.35) or ×100 objective (UPLSAPO; NA 1.40) under Immersol oil. Images were processed using Olympus FV10-ASW software.

High-resolution live imaging

For imaging of GALNT tubules, cells were seeded on eight-chamber glass chambers (Thermo Scientific, #155411) and acquired on LSM800 Zeiss inverted microscope with 37°C environmental chamber and using a ×63 objective under Immersol oil. Images were acquired at 4 s per frame for at least 30 min. For imidazole treatment of HeLa-IS cells expressing GALNT2-GFP, an equal volume of 2× concentrated imidazole in cell culture media was added dropwise to obtain a final concentration of 5 mM imidazole. For the experiment involving GBF1-depleted cells, cells were siRNA knockdown for 48 hr prior imaging. For the experiment involving phosphomimetic YE mutants, cells were transiently transfected with GBF1 plasmids and allowed to be expressed for short durations of 4–16 hr before imaging.

For the imaging of GALNT tubules under PDGF stimulation, cells were seeded in six-channel μ-Slide slides (ibidi GmbH, Germany) and treated with 50 ng/ml of PDGF stimulation using a perfusion pump system (ibidi GmbH) to inject the media at a constant and gentle flow rate. The cells were placed in a 37°C environmental chamber and imaged using an inverted confocal microscope (IX81; Olympus Optical Co. Ltd) coupled with a CCD camera (model FVII) with a ×100 objective (UPLSAPO; NA 1.40) under Immersol oil. Images were processed using Olympus FV10-ASW software.

Immunoprecipitation and western blot analysis

Procedures for cell harvesting and processing for IP and western blot were performed as described previously with some modifications (Gill et al., 2010). For imidazole treatment and growth factor stimulations, cells were serum-starved for 24 hr before treatment with 5 mM imidazole, 50 ng/ml PDGF, or 100 ng/ml EGF, respectively. Cells were washed twice using ice-cold D-PBS before scraping in ice-cold RIPA lysis buffer (50 mM Tris [pH 7.4], 150 mM NaCl, 1% NP-40 alternative, cOmplete Protease Inhibitor, and phosphatase inhibitor [Roche Applied Science, Mannheim, Germany]). The lysate was incubated on ice for 30 min with gradual agitation before clarification of samples by centrifugation at 10,000 × g for 10 min at 4°C. Clarified lysate protein concentrations were determined using Bradford reagent (Bio-Rad Laboratories, Hercules, CA) before sample normalization. To IP endogenous GBF1, samples were incubated with 2.5 μg of GBF1 (BD Biosciences) for 1 hr at 4°C with constant mixing. The IP samples were then incubated with 20 μl of washed protein A/G–Sepharose beads (Millipore) for 2 hr at 4°C with constant mixing. IP samples were washed three times with 1 ml of RIPA buffer containing cOmplete Protease Inhibitor and phosphatase inhibitor. For NGFP-GBF1 IP, clarified cell lysates were incubated with GTP-trap agarose beads (ChromoTek GmbH) for 2 hr before washing with GFP wash buffer (10 mM Tris [pH 7.5], 150 mM NaCl, 0.5 mM EDTA, cOmplete Protease Inhibitor, and phosphatase inhibitor) for three times. For Arf1-GTP loading assay, the clarified cell lysates were incubated with GGA3 PBD agarose beads (Cell Biolabs Inc) for 1 hr at 4°C with agitation before washing. Samples were diluted in lysis buffer with 4× SDS loading buffer and boiled at 95°C for 10 min. The proteins were resolved by SDS-PAGE electrophoresis using Bis-Tris NuPAGE gels (Invitrogen) and transferred to PVDF or nitrocellulose membranes. Membranes were then blocked using 3% BSA dissolved in Tris-buffered saline with tween (TBST: 50 mM Tris [pH 8.0, 4°C], 150 mM NaCl, and 0.1% Tween 20) for 1 hr at room temperature before incubation with primary antibodies overnight. Membranes were washed three times with TBST before incubation with secondary HRP-conjugated antibodies (GE Healthcare). Membranes were further washed three times with TBST before ECL exposure.

In vitro Arf1 binding assay

Procedures for cell harvesting and processing for IP and western blot were described as above. NGFP-GBF1 expressed in cells was IP with GTP-trap agarose beads and washed three times with GFP wash buffer in the presence of cOomplete Protease Inhibitor and once with HKMT buffer (20 mM HEPES, pH 7.4, 0.1 M KCl, 1 mM MgCl2, 0.5% Triton X-100) containing cOmplete Protease Inhibitor and phosphatase inhibitor. The purified NGFP-GBF1 on agarose beads were then incubated with either 4 mg of cell lysates of HEK293T cells expressing Arf1-V5 (agarose beads pre-cleared) or 10 µg recombinant Arf1-del17 protein for 1 hr for 4°C. Subsequently, the beads were washed three times with the HKMT buffer to remove unbound Arf1 protein. The beads were boiled at 95°C for 10 min. The amount of GBF1 bound Arf1 was resolved by western blotting.

LC/MS analysis

The GFP-GBF1 bands of immunoprecipitated samples run on an SDS-PAGE using a NuPAGE 4–12% Bis-Tris gel (Invitrogen) were excised followed by in-gel digestion as described previously (Shevchenko et al., 2006). The peptide samples were subjected to a LTQ Orbitrap classic for data-dependent acquisition and a Q-Exactive for parallel reaction monitoring (PRM) (Thermo Fisher Scientific) analysis as described previously (Swa et al., 2012).

For PRM on Q-Exactive, targeted MS2 was carried out using a resolution of 17,500, target AGC values of 2E5 with maximum injection time of 250 ms, isolation windows of 2 Th, and a normalized collision energy of 27. MS/MS scans started from m/z 100.

Data processing and database search

Raw file obtained from data-dependent acquisition was processed using Mascot Daemon (version 2.3.2, Matrix Science). Data import filter for precursor masses ranged from 700 to 4000 Da, with a minimum scan per group of 1 and a minimum peak count of 10. Mascot search was performed using the IPI Human database (ipi.HUMAN.v3.68.decoy.fasta or ipi.HUMAN.v3.68.decoy.fasta), trypsin as enzyme, and two allowed missed cleavages. Carbamidomethyl (C) was set as a static modification while the dynamic modifications were acetyl (Protein N-term), oxidation (M), and phosphorylation (S/T/Y). Tolerance for the precursor masses was 7 ppm and for fragments 0.5 Da for samples analyzed on LTQ Orbitrap.

Raw file obtained from PRM was processed using open-source Skyline software tool (Maclean, B. et al. Bioinformatics 2010, 26, 966; http://skylinemaccosslab.org.). The accuracy of the peaks assigned by Skyline was manually validated using Thermo Xcalibur Qual Browser by manual inspection of the targeted MS2 spectra and by XIC to ensure the m/z of the fragment ions are within 20 ppm of their theoretical values.

Structure modeling and molecular dynamics

The 3D structure of GBF1 protein is not available; therefore, a structural model of the Sec7 domain of GBF1 (GBF1_Sec7) protein was generated using comparative modeling methods (Sali and Blundell, 1993). Homology model of the GBF1_Sec7 in its autoinhibited form was generated using the crystal structure of the autoinhibited form of Grp1 Arf GTPase exchange factor (PDB: 2R0D, resolution 2.0 Å), which shares ~65% homology with GBF1 in the Sec7 domain. A 3D structural model of the GBF1_Sec7-Arf1 complex was generated using the crystal structure of Arno_Sec7-Arf1 (PDB: 1R8Q, resolution 1.9 Å) since Arno shares ~65% homology with GBF1 in the Sec7 domain.

MD simulations were carried out with the pemed.CUDA module of the program Amber18 (Case et al., 2018) using standard and well-tested protocols (Kannan et al., 2015). All atom versions of the Amber 14SB force field (ff14SB) (Maier et al., 2015) were used to represent the protein. Force field parameters for phosphorylated tyrosine and GTP were taken as described elsewhere (Homeyer et al., 2006); an overall charge of –2e is assigned to the phosphate groups. The Xleap module was used to prepare the system for the MD simulations. All the simulation systems were neutralized with appropriate numbers of counterions. Each neutralized system was solvated in an octahedral box with TIP3P (Jorgensen et al., 1983) water molecules, leaving at least 10 Å between the solute atoms and the borders of the box. All MD simulations were carried out in explicit solvent at 300 K. During the simulations, the long-range electrostatic interactions were treated with the particle mesh Ewald (Darden et al., 1993) method using a real space cutoff distance of 9 Å. The SETTLE (Miyamoto and Kollman, 1992) algorithm was used to constrain bond vibrations involving hydrogen atoms, which allowed a time step of 2 fs during the simulations. Solvent molecules and counterions were initially relaxed using energy minimization with restraints on the protein and inhibitor atoms. This was followed by unrestrained energy minimization to remove any steric clashes. Subsequently, the system was gradually heated from 0 to 300 K using MD simulations with positional restraints (force constant: 50 kcal mol-1 Å–2) on the protein atoms over a period of 0.25 ns allowing water molecules and ions to move freely. During an additional 0.25 ns, the positional restraints were gradually reduced followed by a 2 ns unrestrained MD simulation to equilibrate all the atoms. Production runs were carried out for 250 ns in triplicates (assigning different distributions of initial velocities) for each system. Simulation trajectories were visualized using VMD (Humphrey et al., 1996), and figures were generated using PyMOL.

Binding free energies and per-residue decomposition of binding free energies between the GBF1_Sec7 (unphosphorylated and phosphorylated at Tyr876) and Arf1 were calculated using the standard MMPBSA approach (Homeyer and Gohlke, 2012; Hou et al., 2011). Conformations extracted from the last 125 ns of the MD simulations of each GBF1_Sec7-Arf1 complex were used, and binding energy calculations/per residue decomposition analysis were carried out using standard protocols (Kannan et al., 2015). BSA was computed using the program NACCESS (Hubbard and Thornton, 1993).

Funding Statement

The funders had no role in study design, data collection and interpretation, or the decision to submit the work for publication.

Contributor Information

Joanne Chia, Email: zhchia@imcb.a-star.edu.sg.

Frederic A Bard, Email: fbard@imcb.a-star.edu.sg.

Suzanne R Pfeffer, Stanford University School of Medicine, United States.

Suzanne R Pfeffer, Stanford University School of Medicine, United States.

Funding Information

This paper was supported by the following grant:

  • Astar Core fund to Frederic A Bard.

Additional information

Competing interests

No competing interests declared.

No competing interests declared.

Reviewing editor, eLife.

Author contributions

Conceptualization, Data curation, Investigation, Methodology, Project administration, Validation, Visualization, Writing – original draft, Writing - review and editing.

Data curation, Investigation, Methodology, Writing – original draft.

Data curation, Investigation, Methodology.

Conceptualization, Investigation.

Investigation, Methodology.

Investigation, Methodology, Visualization.

Conceptualization.

Conceptualization, Methodology, Supervision.

Conceptualization, Funding acquisition, Supervision, Writing – original draft, Writing - review and editing.

Additional files

Transparent reporting form
Source data 1. Original full raw unedited gels or blots in all figures and figure supplements.

The red boxes indicate the regions of the blot presented in the figures of the article.

elife-68678-supp1.pdf (5.8MB, pdf)
Source data 2. Raw quantification data and statistical tests performed in all figures and figure supplements.
elife-68678-supp2.xlsx (51.7KB, xlsx)

Data availability

Source data of western blots and all quantifications have been provided for all figures.

References

  1. Ackema KB, Hench J, Böckler S, Wang SC, Sauder U, Mergentaler H, Westermann B, Bard F, Frank S, Spang A. The small GTPase Arf1 modulates mitochondrial morphology and function. The EMBO Journal. 2014;33:2659–2675. doi: 10.15252/embj.201489039. [DOI] [PMC free article] [PubMed] [Google Scholar]
  2. Bard F, Mazelin L, Péchoux-Longin C, Malhotra V, Jurdic P. Src regulates Golgi structure and KDEL receptor-dependent retrograde transport to the endoplasmic reticulum. The Journal of Biological Chemistry. 2003;278:46601–46606. doi: 10.1074/jbc.M302221200. [DOI] [PubMed] [Google Scholar]
  3. Bard F, Chia J. Cracking the Glycome Encoder: Signaling, Trafficking, and Glycosylation. Trends in Cell Biology. 2016;26:379–388. doi: 10.1016/j.tcb.2015.12.004. [DOI] [PubMed] [Google Scholar]
  4. Beck R, Sun Z, Adolf F, Rutz C, Bassler J, Wild K, Sinning I, Hurt E, Brügger B, Béthune J, Wieland F. Membrane curvature induced by Arf1-GTP is essential for vesicle formation. PNAS. 2008;105:11731–11736. doi: 10.1073/pnas.0805182105. [DOI] [PMC free article] [PubMed] [Google Scholar]
  5. Bhatt JM, Viktorova EG, Busby T, Wyrozumska P, Newman LE, Lin H, Lee E, Wright J, Belov GA, Kahn RA, Sztul E. Oligomerization of the Sec7 domain Arf guanine nucleotide exchange factor GBF1 is dispensable for Golgi localization and function but regulates degradation. American Journal of Physiology. Cell Physiology. 2016;310:C456–C469. doi: 10.1152/ajpcell.00185.2015. [DOI] [PMC free article] [PubMed] [Google Scholar]
  6. Bottanelli F, Kilian N, Ernst AM, Rivera-Molina F, Schroeder LK, Kromann EB, Lessard MD, Erdmann RS, Schepartz A, Baddeley D, Bewersdorf J, Toomre D, Rothman JE. A novel physiological role for ARF1 in the formation of bidirectional tubules from the Golgi. Molecular Biology of the Cell. 2017;28:1676–1687. doi: 10.1091/mbc.E16-12-0863. [DOI] [PMC free article] [PubMed] [Google Scholar]
  7. Case DA, Ben-Shalom IY, Brozell SR, Cerutti DS, Cheatham III TE, Cruzeiro VWD, Darden TA, Duke RE, Ghoreishi D, Gilson MK, Gohlke H, Goetz AW, Greene D, Harris R, Homeyer N, Huang Y, Izadi S, Kovalenko A, Kurtzman T, Lee TS, LeGrand S, Li P, Lin C, Liu J, Luchko T, Luo R, Mermelstein DJ, Merz KM, Miao Y, Monard G, Nguyen C, Nguyen H, Omelyan I, Onufriev A, Pan F, Qi R, Roe DR, Roitberg A, Sagui C, Schott-Verdugo S, Shen J, Simmerling CL, Smith J, Salomon-Ferrer R, Swails J, Walker RC, Wang J, Wei H, Wolf RM, Wu X, Xiao L, York DM, Kollman PA. AMBER 2018. University of California, San Francisco 2018
  8. Cherfils J, Ménétrey J, Mathieu M, Le Bras G, Robineau S, Béraud-Dufour S, Antonny B, Chardin P. Structure of the Sec7 domain of the Arf exchange factor ARNO. Nature. 1998;392:101–105. doi: 10.1038/32210. [DOI] [PubMed] [Google Scholar]
  9. Cherfils J. Arf GTPases and their effectors: assembling multivalent membrane-binding platforms. Current Opinion in Structural Biology. 2014;29:67–76. doi: 10.1016/j.sbi.2014.09.007. [DOI] [PubMed] [Google Scholar]
  10. Chia J, Tham KM, Gill DJ, Bard-Chapeau EA, Bard FA. ERK8 is a negative regulator of O-GalNAc glycosylation and cell migration. eLife. 2014;3:e01828. doi: 10.7554/eLife.01828. [DOI] [PMC free article] [PubMed] [Google Scholar]
  11. Chia J, Tay F, Bard F. The GalNAc-T Activation (GALA) Pathway: Drivers and markers. PLOS ONE. 2019;14:e0214118. doi: 10.1371/journal.pone.0214118. [DOI] [PMC free article] [PubMed] [Google Scholar]
  12. Consoli GML, Geraci C, Fanelli F, Luini A. The KDEL receptor couples to Gαq/11 to activate Src kinases and regulate transport through the Golgi. The EMBO Journal. 2012;31:2869–2881. doi: 10.1038/emboj.2012.134. [DOI] [PMC free article] [PubMed] [Google Scholar]
  13. Cox R, Mason-Gamer RJ, Jackson CL, Segev N. Phylogenetic analysis of Sec7-domain-containing Arf nucleotide exchangers. Molecular Biology of the Cell. 2004;15:1487–1505. doi: 10.1091/mbc.e03-06-0443. [DOI] [PMC free article] [PubMed] [Google Scholar]
  14. Darden T, York D, Pedersen L. Particle mesh Ewald: An N ⋅log(N) method for Ewald sums in large systems. The Journal of Chemical Physics. 1993;98:10089–10092. doi: 10.1063/1.464397. [DOI] [Google Scholar]
  15. Dell’Angelica EC, Puertollano R, Mullins C, Aguilar RC, Vargas JD, Hartnell LM, Bonifacino JS. GGAs: a family of ADP ribosylation factor-binding proteins related to adaptors and associated with the Golgi complex. The Journal of Cell Biology. 2000;149:81–94. doi: 10.1083/jcb.149.1.81. [DOI] [PMC free article] [PubMed] [Google Scholar]
  16. Donaldson JG, Jackson CL. ARF family G proteins and their regulators: roles in membrane transport, development and disease. Nature Reviews. Molecular Cell Biology. 2011;12:362–375. doi: 10.1038/nrm3117. [DOI] [PMC free article] [PubMed] [Google Scholar]
  17. D’Souza-Schorey C, Chavrier P. ARF proteins: roles in membrane traffic and beyond. Nature Reviews. Molecular Cell Biology. 2006;7:347–358. doi: 10.1038/nrm1910. [DOI] [PubMed] [Google Scholar]
  18. Fernandez-Pol JA. Epidermal growth factor receptor of A431 cells Characterization of a monoclonal anti-receptor antibody noncompetitive agonist of epidermal growth factor action. The Journal of Biological Chemistry. 1985;260:5003–5011. doi: 10.1016/S0021-9258(18)89171-2. [DOI] [PubMed] [Google Scholar]
  19. Gill DJ, Chia J, Senewiratne J, Bard F. Regulation of O-glycosylation through Golgi-to-ER relocation of initiation enzymes. The Journal of Cell Biology. 2010;189:843–858. doi: 10.1083/jcb.201003055. [DOI] [PMC free article] [PubMed] [Google Scholar]
  20. Gill DJ, Clausen H, Bard F. Location, location, location: new insights into O-GalNAc protein glycosylation. Trends in Cell Biology. 2011;21:149–158. doi: 10.1016/j.tcb.2010.11.004. [DOI] [PubMed] [Google Scholar]
  21. Gill DJ, Tham KM, Chia J, Wang SC, Steentoft C, Clausen H, Bard-Chapeau EA, Bard FA. Initiation of GalNAc-type O-glycosylation in the endoplasmic reticulum promotes cancer cell invasiveness. PNAS. 2013;110:E3152–E3161. doi: 10.1073/pnas.1305269110. [DOI] [PMC free article] [PubMed] [Google Scholar]
  22. Gommel DU, Memon AR, Heiss A, Lottspeich F, Pfannstiel J, Lechner J, Reinhard C, Helms JB, Nickel W, Wieland FT. Recruitment to Golgi membranes of ADP-ribosylation factor 1 is mediated by the cytoplasmic domain of p23. The EMBO Journal. 2001;20:6751–6760. doi: 10.1093/emboj/20.23.6751. [DOI] [PMC free article] [PubMed] [Google Scholar]
  23. Hammarström S, Murphy LA, Goldstein IJ, Etzler ME. Carbohydrate binding specificity of four N-acetyl-D-galactosamine- “specific” lectins: Helix pomatia A hemagglutinin, soy bean agglutinin, lima bean lectin, and Dolichos biflorus lectin. Biochemistry. 1977;16:2750–2755. doi: 10.1021/bi00631a025. [DOI] [PubMed] [Google Scholar]
  24. Hebert-Chatelain E. Src kinases are important regulators of mitochondrial functions. The International Journal of Biochemistry & Cell Biology. 2013;45:90–98. doi: 10.1016/j.biocel.2012.08.014. [DOI] [PubMed] [Google Scholar]
  25. Homeyer N, Horn AHC, Lanig H, Sticht H. AMBER force-field parameters for phosphorylated amino acids in different protonation states: phosphoserine, phosphothreonine, phosphotyrosine, and phosphohistidine. Journal of Molecular Modeling. 2006;12:281–289. doi: 10.1007/s00894-005-0028-4. [DOI] [PubMed] [Google Scholar]
  26. Homeyer N, Gohlke H. Free Energy Calculations by the Molecular Mechanics Poisson-Boltzmann Surface Area Method. Molecular Informatics. 2012;31:114–122. doi: 10.1002/minf.201100135. [DOI] [PubMed] [Google Scholar]
  27. Honda A, Al-Awar OS, Hay JC, Donaldson JG. Targeting of Arf-1 to the early Golgi by membrin, an ER-Golgi SNARE. The Journal of Cell Biology. 2005;168:1039–1051. doi: 10.1083/jcb.200409138. [DOI] [PMC free article] [PubMed] [Google Scholar]
  28. Hou T, Wang J, Li Y, Wang W. Assessing the performance of the molecular mechanics/Poisson Boltzmann surface area and molecular mechanics/generalized Born surface area methods. II. The accuracy of ranking poses generated from docking. Journal of Computational Chemistry. 2011;32:866–877. doi: 10.1002/jcc.21666. [DOI] [PMC free article] [PubMed] [Google Scholar]
  29. Hubbard SJ, Thornton JM. "NACCESS”, Computer Program Department Biochemistry and Molecular Biology. University College London Press; 1993. [Google Scholar]
  30. Humphrey W, Dalke A, Schulten K. VMD: visual molecular dynamics. Journal of Molecular Graphics. 1996;14:33–38. doi: 10.1016/0263-7855(96)00018-5. [DOI] [PubMed] [Google Scholar]
  31. Itzhak DN, Tyanova S, Cox J, Borner GH. Global, quantitative and dynamic mapping of protein subcellular localization. eLife. 2016;5:e16950. doi: 10.7554/eLife.16950. [DOI] [PMC free article] [PubMed] [Google Scholar]
  32. Jian X, Cavenagh M, Gruschus JM, Randazzo PA, Kahn RA. Modifications to the C-terminus of Arf1 alter cell functions and protein interactions. Traffic. 2010;11:732–742. doi: 10.1111/j.1600-0854.2010.01054.x. [DOI] [PMC free article] [PubMed] [Google Scholar]
  33. Jorgensen WL, Chandrasekhar J, Madura JD, Impey RW, Klein ML. Comparison of simple potential functions for simulating liquid water. The Journal of Chemical Physics. 1983;79:926–935. doi: 10.1063/1.445869. [DOI] [Google Scholar]
  34. Kaczmarek B, Verbavatz JM, Jackson CL. GBF1 and Arf1 function in vesicular trafficking, lipid homoeostasis and organelle dynamics. Biology of the Cell. 2017;109:391–399. doi: 10.1111/boc.201700042. [DOI] [PubMed] [Google Scholar]
  35. Kahn RA, Randazzo P, Serafini T, Weiss O, Rulka C, Clark J, Amherdt M, Roller P, Orci L, Rothman JE. The amino terminus of ADP-ribosylation factor (ARF) is a critical determinant of ARF activities and is a potent and specific inhibitor of protein transport. The Journal of Biological Chemistry. 1992;267:13039–13046. doi: 10.1016/S0021-9258(18)42378-2. [DOI] [PubMed] [Google Scholar]
  36. Kannan S, Poulsen A, Yang HY, Ho M, Ang SH, Eldwin TSW, Jeyaraj DA, Chennamaneni LR, Liu B, Hill J, Verma CS, Nacro K. Probing the binding mechanism of Mnk inhibitors by docking and molecular dynamics simulations. Biochemistry. 2015;54:32–46. doi: 10.1021/bi501261j. [DOI] [PubMed] [Google Scholar]
  37. Kawamoto K, Yoshida Y, Tamaki H, Torii S, Shinotsuka C, Yamashina S, Nakayama K. GBF1, a guanine nucleotide exchange factor for ADP-ribosylation factors, is localized to the cis-Golgi and involved in membrane association of the COPI coat. Traffic. 2002;3:483–495. doi: 10.1034/j.1600-0854.2002.30705.x. [DOI] [PubMed] [Google Scholar]
  38. Krauss M, Jia JY, Roux A, Beck R, Wieland FT, De Camilli P, Haucke V. Arf1-GTP-induced tubule formation suggests a function of Arf family proteins in curvature acquisition at sites of vesicle budding. The Journal of Biological Chemistry. 2008;283:27717–27723. doi: 10.1074/jbc.M804528200. [DOI] [PMC free article] [PubMed] [Google Scholar]
  39. Luini A, Parashuraman S. Signaling at the Golgi: sensing and controlling the membrane fluxes. Current Opinion in Cell Biology. 2016;39:37–42. doi: 10.1016/j.ceb.2016.01.014. [DOI] [PubMed] [Google Scholar]
  40. Maier JA, Martinez C, Kasavajhala K, Wickstrom L, Hauser KE, Simmerling C. ff14SB: Improving the Accuracy of Protein Side Chain and Backbone Parameters from ff99SB. Journal of Chemical Theory and Computation. 2015;11:3696–3713. doi: 10.1021/acs.jctc.5b00255. [DOI] [PMC free article] [PubMed] [Google Scholar]
  41. Meissner JM, Bhatt JM, Lee E, Styers ML, Ivanova AA, Kahn RA, Sztul E. The ARF guanine nucleotide exchange factor GBF1 is targeted to Golgi membranes through a PIP-binding domain. Journal of Cell Science. 2018;131:jcs210245. doi: 10.1242/jcs.210245. [DOI] [PMC free article] [PubMed] [Google Scholar]
  42. Miyamoto S, Kollman PA. Settle: An analytical version of the SHAKE and RATTLE algorithm for rigid water models. Journal of Computational Chemistry. 1992;13:952–962. doi: 10.1002/jcc.540130805. [DOI] [Google Scholar]
  43. Nawrotek A, Zeghouf M, Cherfils J. Allosteric regulation of Arf GTPases and their GEFs at the membrane interface. Small GTPases. 2016;7:283–296. doi: 10.1080/21541248.2016.1215778. [DOI] [PMC free article] [PubMed] [Google Scholar]
  44. Nguyen AT, Chia J, Ros M, Hui KM, Saltel F, Bard F. Organelle Specific O-Glycosylation Drives MMP14 Activation, Tumor Growth, and Metastasis. Cancer Cell. 2017;32:639–653. doi: 10.1016/j.ccell.2017.10.001. [DOI] [PubMed] [Google Scholar]
  45. Ong SE, Blagoev B, Kratchmarova I, Kristensen DB, Steen H, Pandey A, Mann M. Stable isotope labeling by amino acids in cell culture, SILAC, as a simple and accurate approach to expression proteomics. Molecular & Cellular Proteomics. 2002;1:376–386. doi: 10.1074/mcp.m200025-mcp200. [DOI] [PubMed] [Google Scholar]
  46. Pasqualato S, Renault L, Cherfils J. Arf, Arl, Arp and Sar proteins: a family of GTP-binding proteins with a structural device for “front-back” communication. EMBO Reports. 2002;3:1035–1041. doi: 10.1093/embo-reports/kvf221. [DOI] [PMC free article] [PubMed] [Google Scholar]
  47. Pulvirenti T, Giannotta M, Capestrano M, Capitani M, Pisanu A, Polishchuk RS, San Pietro E, Beznoussenko GV, Mironov AA, Turacchio G, Hsu VW, Sallese M, Luini A. A traffic-activated Golgi-based signalling circuit coordinates the secretory pathway. Nature Cell Biology. 2008;10:912–922. doi: 10.1038/ncb1751. [DOI] [PubMed] [Google Scholar]
  48. Qiao Y, Molina H, Pandey A, Zhang J, Cole PA. Chemical rescue of a mutant enzyme in living cells. Science. 2006;311:1293–1297. doi: 10.1126/science.1122224. [DOI] [PubMed] [Google Scholar]
  49. Quilty D, Gray F, Summerfeldt N, Cassel D, Melançon P. Arf activation at the Golgi is modulated by feed-forward stimulation of the exchange factor GBF1. Journal of Cell Science. 2014;127:354–364. doi: 10.1242/jcs.130591. [DOI] [PubMed] [Google Scholar]
  50. Quilty D, Chan CJ, Yurkiw K, Bain A, Babolmorad G, Melançon P. The Arf-GDP-regulated recruitment of GBF1 to Golgi membranes requires domains HDS1 and HDS2 and a Golgi-localized protein receptor. Journal of Cell Science. 2018;132:jcs208199. doi: 10.1242/jcs.208199. [DOI] [PMC free article] [PubMed] [Google Scholar]
  51. Ramaen O, Joubert A, Simister P, Belgareh-Touzé N, Olivares-Sanchez MC, Zeeh JC, Chantalat S, Golinelli-Cohen MP, Jackson CL, Biou V, Cherfils J. Interactions between conserved domains within homodimers in the BIG1, BIG2, and GBF1 Arf guanine nucleotide exchange factors. The Journal of Biological Chemistry. 2007;282:28834–28842. doi: 10.1074/jbc.M705525200. [DOI] [PubMed] [Google Scholar]
  52. Raote I, Malhotra V. Protein transport by vesicles and tunnels. The Journal of Cell Biology. 2019;218:737–739. doi: 10.1083/jcb.201811073. [DOI] [PMC free article] [PubMed] [Google Scholar]
  53. Reynolds AB, Kanner SB, Bouton AH, Schaller MD, Weed SA, Flynn DC, Parsons JT. SRChing for the substrates of Src. Oncogene. 2014;33:4537–4547. doi: 10.1038/onc.2013.416. [DOI] [PubMed] [Google Scholar]
  54. Richardson BC, McDonold CM, Fromme JC. The Sec7 Arf-GEF is recruited to the trans-Golgi network by positive feedback. Developmental Cell. 2012;22:799–810. doi: 10.1016/j.devcel.2012.02.006. [DOI] [PMC free article] [PubMed] [Google Scholar]
  55. Ros M, Nguyen AT, Chia J, Le Tran S, Le Guezennec X, McDowall R, Vakhrushev S, Clausen H, Humphries MJ, Saltel F, Bard FA. ER-resident oxidoreductases are glycosylated and trafficked to the cell surface to promote matrix degradation by tumour cells. Nature Cell Biology. 2020;22:1371–1381. doi: 10.1038/s41556-020-00590-w. [DOI] [PubMed] [Google Scholar]
  56. Sali A, Blundell TL. Comparative protein modelling by satisfaction of spatial restraints. Journal of Molecular Biology. 1993;234:779–815. doi: 10.1006/jmbi.1993.1626. [DOI] [PubMed] [Google Scholar]
  57. Sengupta P, Satpute-Krishnan P, Seo AY, Burnette DT, Patterson GH, Lippincott-Schwartz J. ER trapping reveals Golgi enzymes continually revisit the ER through a recycling pathway that controls Golgi organization. PNAS. 2015;112:E6752–E6761. doi: 10.1073/pnas.1520957112. [DOI] [PMC free article] [PubMed] [Google Scholar]
  58. Shevchenko A, Tomas H, Havlis J, Olsen JV, Mann M. In-gel digestion for mass spectrometric characterization of proteins and proteomes. Nature Protocols. 2006;1:2856–2860. doi: 10.1038/nprot.2006.468. [DOI] [PubMed] [Google Scholar]
  59. Shomron O, Nevo-Yassaf I, Aviad T, Yaffe Y, Zahavi EE, Dukhovny A, Perlson E, Brodsky I, Yeheskel A, Pasmanik-Chor M, Mironov A, Beznoussenko GV, Mironov AA, Sklan EH, Patterson GH, Yonemura Y, Sannai M, Kaether C, Hirschberg K. COPII collar defines the boundary between ER and ER exit site and does not coat cargo containers. The Journal of Cell Biology. 2021;220:e201907224. doi: 10.1083/jcb.201907224. [DOI] [PMC free article] [PubMed] [Google Scholar]
  60. Stalder D, Barelli H, Gautier R, Macia E, Jackson CL, Antonny B. Kinetic studies of the Arf activator Arno on model membranes in the presence of Arf effectors suggest control by a positive feedback loop. The Journal of Biological Chemistry. 2011;286:3873–3883. doi: 10.1074/jbc.M110.145532. [DOI] [PMC free article] [PubMed] [Google Scholar]
  61. Swa HLF, Blackstock WP, Lim LHK, Gunaratne J. Quantitative proteomics profiling of murine mammary gland cells unravels impact of annexin-1 on DNA damage response, cell adhesion, and migration. Molecular & Cellular Proteomics. 2012;11:381–393. doi: 10.1074/mcp.M111.011205. [DOI] [PMC free article] [PubMed] [Google Scholar]
  62. Sztul E, Chen PW, Casanova JE, Cherfils J, Dacks JB, Lambright DG, Lee FJS, Randazzo PA, Santy LC, Schürmann A, Wilhelmi I, Yohe ME, Kahn RA. ARF GTPases and their GEFs and GAPs: concepts and challenges. Molecular Biology of the Cell. 2019;30:1249–1271. doi: 10.1091/mbc.E18-12-0820. [DOI] [PMC free article] [PubMed] [Google Scholar]
  63. Thomas SM, Brugge JS. Cellular functions regulated by Src family kinases. Annual Review of Cell and Developmental Biology. 1997;13:513–609. doi: 10.1146/annurev.cellbio.13.1.513. [DOI] [PubMed] [Google Scholar]
  64. Vogt PK. Retroviral oncogenes: a historical primer. Nature Reviews. Cancer. 2012;12:639–648. doi: 10.1038/nrc3320. [DOI] [PMC free article] [PubMed] [Google Scholar]
  65. Walch L, Pellier E, Leng W, Lakisic G, Gautreau A, Contremoulins V, Verbavatz JM, Jackson CL. GBF1 and Arf1 interact with Miro and regulate mitochondrial positioning within cells. Scientific Reports. 2018;8:17121. doi: 10.1038/s41598-018-35190-0. [DOI] [PMC free article] [PubMed] [Google Scholar]
  66. Weigel AV, Chang CL, Shtengel G, Xu CS, Hoffman DP, Freeman M, Iyer N, Aaron J, Khuon S, Bogovic J, Qiu W, Hess HF, Lippincott-Schwartz J. ER-to-Golgi protein delivery through an interwoven, tubular network extending from ER. Cell. 2021;184:2412–2429. doi: 10.1016/j.cell.2021.03.035. [DOI] [PubMed] [Google Scholar]
  67. Weller SG, Capitani M, Cao H, Micaroni M, Luini A, Sallese M, McNiven MA. Src kinase regulates the integrity and function of the Golgi apparatus via activation of dynamin 2. PNAS. 2010;107:5863–5868. doi: 10.1073/pnas.0915123107. [DOI] [PMC free article] [PubMed] [Google Scholar]
  68. Yoon HY, Bonifacino JS, Randazzo PA. In vitro assays of Arf1 interaction with GGA proteins. Methods in Enzymology. 2005;404:316–332. doi: 10.1016/S0076-6879(05)04028-0. [DOI] [PubMed] [Google Scholar]
  69. Zhao X, Lasell TKR, Melançon P. Localization of large ADP-ribosylation factor-guanine nucleotide exchange factors to different Golgi compartments: evidence for distinct functions in protein traffic. Molecular Biology of the Cell. 2002;13:119–133. doi: 10.1091/mbc.01-08-0420. [DOI] [PMC free article] [PubMed] [Google Scholar]
  70. Zhao X, Claude A, Chun J, Shields DJ, Presley JF, Melançon P. GBF1, a cis-Golgi and VTCs-localized ARF-GEF, is implicated in ER-to-Golgi protein traffic. Journal of Cell Science. 2006;119:3743–3753. doi: 10.1242/jcs.03173. [DOI] [PubMed] [Google Scholar]

Editor's evaluation

Suzanne R Pfeffer 1

The Src tyrosine kinase controls cancer-critical protein glycosylation through Golgi to ER relocation of a subset of Golgi enzymes, GALNTs, from the Golgi to the ER. The authors show here that Src induces the formation of tubular transport carriers containing GALNTs by phosphorylating GBF1 and promoting its binding to Arf1. This study presents some of the first clues to the molecular events underlying Src-regulated relocalization of glycosyltransferases.

Decision letter

Editor: Suzanne R Pfeffer1

In the interests of transparency, eLife publishes the most substantive revision requests and the accompanying author responses.

Decision letter after peer review:

[Editors’ note: the authors submitted for reconsideration following the decision after peer review. What follows is the decision letter after the first round of review.]

Thank you for submitting your work entitled "Src activates retrograde membrane traffic through phosphorylation of GBF1" for consideration by eLife. Your article has been reviewed by 3 peer reviewers, and the evaluation has been overseen by a Reviewing Editor and a Senior Editor (Suzanne Pfeffer). The reviewers have opted to remain anonymous.

Our decision has been reached after consultation between the reviewers. Based on these discussions and the individual reviews below, we regret to inform you that your work will not be considered further for publication in eLife at this stage.

Overall, the reviewers were excited by the hypothesis that Src activation and phosphorylation of GBF1 control specialized retrograde Golgi-ER trafficking. That being said, they raised a number of issues that would take some time to address, to support fully the conclusions of the present study. One of the reviewers provided the following comments that would be important to consider in regard to your model.

"It seems that the authors are claiming that the phospho-GBF1-Arf1-GDP complex is more stable (which their data do suggest). But their data do not clearly discriminate between positive or negative regulation…. If Src is a positive regulator of GBF1, then why does phospho-GBF1 form stable complexes with Arf1-GDP? A GEF that binds *more* stably to Arf1-GDP is actually *less* active. This may be counterintuitive, but this is how GEFs work: the action of BFA and the catalytic E->K mutations in Sec7 domains are both good examples of how when the GEF domain binds more strongly to Arf1-GDP, they become worse GEFs…If they were trying to demonstrate that Src is a positive regulator of GBF1, the data are not convincing. They have shown that *cellular* levels of Arf1-GTP transiently increase, but they have not shown that Golgi-localized Arf1-GTP increases, and there are other ArfGEFs in cells. The reduction of COPI localization provides further evidence that Arf1-GTP is not increasing at the Golgi.

The key concept is that if a GEF bound strongly to GTPase-GDP, it would actually inhibit activation by GTP binding. Here is a reference from Antonny and Cherfils (and Chabre) for the specific example of a Sec7 domain mutant that binds to Arf-GDP better and therefore is a worse GEF: https://pubmed.ncbi.nlm.nih.gov/9649435/

Here is a review from Wittenhofer: https://pubmed.ncbi.nlm.nih.gov/17540168/

in which he key part about affinities is: "the affinities of the binary complexes between the G protein and either the nucleotide or its GEF are very high. In contrast, the affinities of the exchange factor for the nucleotide-bound G protein and of the nucleotide for the exchange-factor-bound G protein (the ternary complexes) are much lower.

This is consistent with the energetics of how all enzymes work – enzymes bind best not to their substrates or products, but to their transition states (otherwise enzymes would simply stabilize their substrates rather than performing catalysis). The nucleotide-free state of GTPases is the intermediate that is closest to the transition state of the exchange reaction. There is a general misconception that GEFs bind best to GDP-bound GTPases, but this is not true and has arisen because the so-called "GDP-locked" mutants that people have used actually have a reduced affinity for nucleotides (both GDP and GTP) and therefore tend towards being nucleotide free. Anyway, it's a common misconception and usually one that is not too important but in this case it matters for their mechanism."

Another reviewer wrote, "Since simply seeing more Arf1 at the Golgi does not necessarily mean that it is active, perhaps they could perform a FRAP experiment? Given that the Golgi is a large organelle, the kinetics of recovery would reflect association of ARF1 to the Golgi. If Src really increases the levels of active Arf1 at the Golgi, then it should affect the on/off-kinetics in a FRAP experiment. Or they could do Trp-fluorescence assays with recombinant Arf1 and GBF1."Reviewer #1:

In this study from the Bard lab, the authors explore the mechanism behind Src activation induced relocalization of GALNTs enzymes from Golgi to ER. They use an imidazole-inducible Src model, which generates increased O-GALNacylation. In response to Src activation, they observe GFP-GALNTs in tubules emanating from the Golgi. They also observe more Arf1-GTP in Src-activated cells. They Identify Y-phosphorylation sites in GBF1 induced by Src phosphorylation. They can confirm Src-induced phosphorylation at one of these sites (Y876) by phospho-specific antibody. They find that expression of the Y876F GBF1 mutant blocked the Src-activation induced increase in cellular Arf1-GTP levels. Expression of the Y876E/Y898E mutant dramatically reduced the amount of basal Arf1-GTP. They perform modeling studies suggesting that phosphorylation of Y876 should increase the affinity of the GBF1 Sec7d for Arf1.

Their observations of Src activation are similar to the acute effects of BFA. BFA triggers formation of stable, complexes between GBF1 and Arf1-GDP. These complexes bind stably to the Golgi, but are inactive and effectively poison the GEF, reducing the amount of Arf1-GTP generated at that site. Indeed, Src activation results in slight depletion of COPI at the Golgi, and increase in GBF1 at the Golgi, similar to effects of BFA. BFA also triggers tubules emanating from the Golgi.

The authors conclude with a model in which Src phosphorylation of GBF1 results in stable GBF1-Arf1 complexes that somehow generate tubules from the Golgi that traffic GALNTs enzymes back to the ER.

I do not find the overall mechanistic explanation of the observations to be convincing, and in my mind the authors have not ruled out alternative explanations. While the authors have made some interesting observations, I do not believe they have managed to correctly connect the results to a coherent and plausible mechanism.

The authors' model does not even appear to be internally consistent – on the one hand they are claiming that Src activation results in GBF1 activation of Arf1 at the Golgi. On the other hand, they are claiming that Src activation results in stable GBF1-Arf1-GDP complexes that would not be competent for activating Arf1.

In summary, the authors can't seem to decide on whether Src is a positive or negative regulator of GBF1, and it remains unclear whether the resulting GBF1-Arf1 complexes are actually responsible for trafficking GALNTs enzymes from the Golgi to the ER.

Specific issues with interpretations and experimental design:

The authors find that overexpression of GBF1 increases the amount of Arf1 activated in cells in response to Src activation, but critically, they do not test the dependence of Src-responsive Arf1 activation on GBF1. Why have the authors not monitored the extent of Src-triggered Arf1 activation in GBF1-knockdown cells?

The authors claim that Src activation increases the amount of Arf1 at the Golgi but the fluorescence images do not appear to support this claim. Although Arf1 is observed on the resulting tubules, this could represent its presence in non-productive membrane-bound complexes with GBF1.

The authors draw the unsupported conclusion that "these GBF1-Arf1-GDP complexes are directly involved in BFA-induced tubule formation." It would be straightforward for the authors to test whether GBF1 is indeed required for formation of the Src-induced tubules. Similarly, it would be even more convincing if they could also determine whether GBF1 is required for BFA-induced tubules (if this has not already been demonstrated in the literature).

Furthermore, the authors need to test the effects of GBF1 Y/F and Y/E mutants on Src-induced tubule formation.

Perhaps the observed increase in cellular Arf1-GTP levels could be due to the action of the BFA-independent GEFs, perhaps as a compensatory response to the loss of GBF1 activity induced by Src-dependent phosphorylation?

The authors make the claim "Altogether, these results indicate that phosphorylation on Tyrosines Y876 and Y898 drives an increase of affinity of GBF1 for Arf1-GDP, in turn increasing Arf1-GTP levels and promoting GALNTs relocation." Yet the phosphomimetic mutants have reduced Arf1-GTP levels! It appears more likely that phosphorylation is inducing a BFA-like effect, and not actually increasing GBF1 activation of Arf1.

The authors results, both experimental and modeling, strongly suggest that phosphorylation results in stable, non-productive GBF1-Arf1 complexes that would not lead to an increase in Arf1 activation. For an exchange factor, a mutation or PTM that increases affinity for the GTPase substrate will actually result in reduced activation as the GEF needs to dissociate from the GTPase in order for GTP to stably bind.

A key question that is not addressed is whether Src phosphorylation of GBF1 triggers increased Golgi to ER transport or decreased ER to Golgi transport of GALNTs? Either of these situations could cause the observed response to Src activation assuming the GALNTs normally cycle between the Golgi and ER.Reviewer #2:

In this manuscript, Chia et al. tried to provide a first glimpse of the molecular machinery driving the GALNTs Activation (GALA) pathway, which was proposed by the Bard group ten years ago. The major claim of the paper is that the regulated Src-dependent phosphorylation of GBF1 (specifically on Y876 and Y898) is the primary molecular switch that drives formation Golgi-originated membrane tubules that serve to deliver GALNT enzymes to ER. The experiments performed in the manuscript are appreciable and abundant. However, the presentation and writing are sloppy, which has made comprehension tiresome and also tricky. The discussions are shallow, and the authors have conveniently avoided rationalizing interesting/surprising findings. Overall, the hypothesis that Src activation and phosphorylation of GBF1 control specialized retrograde Golgi-ER trafficking looks exciting and valid, but this needs to be supported by more robust data, which is unfortunately not presented in this manuscript. A substantial revision would be required for this manuscript to be published.

1. A major assertion throughout this manuscript is the regulated relocalization of the enzymes GALNTs from Golgi to ER, and corresponding HPL staining has been used as a readout of GANLT activity. Unfortunately, all the images of HPL staining throughout the paper are of low quality and have inconsistencies in the staining pattern and intensity. It is essential to provide high-resolution images and quantify colocalization of HPL signal with ER and Golgi markers. Colocalization of the endogenous GALNT1 with these markers will be a more accurate measure of the relocalization of the enzyme to the ER. PDI IP with VVL was a smart approach and indeed suggest GALNT activity in the ER but could also indicate minor relocalization of PDI4A to the Golgi compartment. The effect of the imidazole treatment on intracellular localization of PDI should be tested.

In F1b, colocalization of GALNT with an ER marker will substantiate this finding. This figure also shows a noticeable increase in the perinuclear (Golgi?) staining intensity of HPL, which seems to have been ignored. Does the relocalization of the enzyme to the ER have anything to do with its increased activity in the Golgi?

2. Another major inconsistency in the manuscript is related to the imidazole-inducible activity of Src8A7F. This activity is depicted as pY 4G10 blots, but these blots (Figures2E, 3A, 4A, S1B) are all different and inconclusive. Random blot parts ( 40-180 kDa, 70-180 kDa, 60-120 kDa) are shown. It is imperative to quantify Src activity. Hopefully, careful Src quantification will shed some light on the unexplainable temporal activation of Arf1 protein.

3. The third major problem is related to the use of overexpressed tagged proteins utilized thought the study. This approach was more or less valid ten years ago, but now with advances of CRISPR and other gene-editing tools, it is possible to avoid (or at least control for) artifacts connected with protein overexpression and tagging. Authors show that overexpressed GALNT2-GFP and Arf1-V5 entering into the tubular compartment emerging from the Golgi (F2C), but they failed to show a similar pattern for the endogenous GALNT1 (S1L). Moreover, the activation pattern of the endogenous Arf1 (F2E) is very different from the activation dynamic of Arf1-V5 (F3A). All these inconsistencies should be adequately addressed in the text.

4. In S1F, how was the experiment performed? What is "control 0h" and what are the other time points grouped as "24h Imdz wash"? This figure needs to be properly labeled.

5. The localization of Src in S1D is different than that of Src8A7F. Does this mutation affect its localization?

6. S1H has cells missing ManII. Is there any effect of Src activation on ManII?

7. In F1D is a smart approach to measure GALNT activity in the ER. An increase in glycosylation of PDI with time upon Src activation, but in later, it is shown that Aft-GTP bursts occur within 5-10mins after Src activation and in SrcEG mutant, Arf is depleted. This data is at odds with the prolonged effect of Src activation on the HPL staining intensity and GALNT relocalization. Moreover, the burst of GBF1 phosphorylation is seen at 120 mins in F4AandB. How do all this fit in into the prolonged effect on GALNT activity and increased HPL staining?

8. Overexpressed GALNT2 indeed shows tubules, but the endogenous GALNT1 tubules are absent in S1L. In this figure, βCOP staining is also very odd. The localization of βCOP to the Golgi is well established, and there are quite a few suitable antibodies that work well (https://doi.org/10.1111/j.1600-0854.2008.00724.x). Such poorly quality staining cannot be used to rule out the involvement of COPI in GALNT relocalization.

9. For F2, which shows GALNT1+2, Arf1 and Afr3 KDs provide data on the efficiency of the KD. Also, look at the effect of Afr1 KD on the localization of active GBF1. Is Arf1-GDP required for the membrane recruitment of GBF1?

10. Arf-V5 and endogenous Afr do not follow the same trend. Please repeat GGA IP in F3A and probe for endogenous Arf.

11. Is GBF1 the only Arf GEF that is phosphorylated upon Src activation? Is it not likely that BIGI, ARNO and BRAG2's conserved tyrosine residues would be phosphorylated too once Src is activated and these activated GEFs would have some contribution to Golgi trafficking?

12. In F4E, Src has been claimed to directly phosphorylate GBF1. However, during the purification of GFP-GBF1 there could be other associated proteins that may be effectors of activated Src. This needs to be acknowledged and before claiming that Src kinase directly phosphorylated GBF1.

13. Another significant discrepancy in this study is the effect of the different Src mutants on the HPL staining and Src localization/profile itself. The model in figure 7 fails to explain how the short burst of pGBF1 and AFR1-GTP triggers prolonged relocalization of GALNT. The final model is unclear and somewhat misleading. It seems to indicate that tubule formation is caused by the tight Arf1-GBF1 complex, but the data show a transient burst of Arf1-GTP (not bound to GBF1) as a major cause of tubule formation. What selects GALNTs into these tubulesReviewer #3:

The manuscript by Chia et al. is one of a series of elegant manuscripts by the Bard lab on the GALA pathway. The topic is very interesting and I think it fits to the scope of the journal. The data are mostly of very high quality and the finding is novel, as it explains the role of Src in retrograde transport.

Apart from some technical and minor comments that I mention below, I am mainly concerned with one point: the authors claim that Src induces retrograde transport that is dependent on Arf1 and GBF1. However, the claim that it is COPI-independent. The evidence for this is relatively weak. Regardless of this, there is no evidence that the tubules that the tubules observed in response to Src activation are directed towards the ER. I did not see evidence that these tubules move towards the ER, or whether they passage through the ERGIC. Maybe these tubules detach from the Golgi to form a carrier that moves to the ER.

I am happy to drop this point, if the editor and/or the other reviewers think that this is beyond the scope of this paper.

1. The images in Figures 1B and S1C are identical. This should be clearly indicated. The authors should state that S1C shows the very same cells as 1B, only with a co-staining for Giantin.

2. I noticed that the size of the Golgi (and the cell) is bigger in imidazole-treated cells (with Src activation). Since the increase of fluorescence is mostly apparent in the Golgi region, I think that the HPL intensity should be normalized by the size of the cell.

3. Figure 1G: I think that the authors should image more than just 4 cells. It is also not indicated how many experiments were performed.

4. Figure 2C: this result requires some form of quantification. How many tubules were observed and in how many cells? How many of the tubules were Arf1-positive?

5. The conservation of tyrosines (in GBF1) from yeast to mammals is meaningless. Yeast (and fungi in general) have no tyrosine kinases (there are very few exotic exceptions, but S. cerevisiae is definitively negative). The fact that yeast has no tyrosine kinases actually should prompt to investigate the tyrosine residues that are not conserved. I think this passage should be re-written. As it is scientifically not accurate and misleading.

6. Figure 5: the authors state that the stimulus was "nearly abolished". This is not correct. Looking at the blot, I would. Re-word this and rather use "reduced". The double mutant is also still phosphorylated

7. Figure 5F is missing. Figure 5E just shows the quantification, but no primary data.

[Editors’ note: further revisions were suggested prior to acceptance, as described below.]

Thank you for resubmitting your work entitled "Src activates retrograde membrane traffic through phosphorylation of GBF1" for further consideration by eLife. Your revised article has been evaluated by Suzanne Pfeffer (Senior Editor) and a Reviewing Editor.

The manuscript has been improved but there are some remaining issues that need to be addressed, as outlined below; the reviewers think you have very interesting results but need to provide more details related to the mechanism of what is observed.

The reviewers all agreed that the most critical thing missing is direct demonstration of GBF1-Arf1-GDP tubulation activity. They also suggest that you should consider alternative explanations for the data. Specifically, they suggest you load Arf1 with GDP-betaS and add phosphorylated GBF1, then test if the complex drives formation of tubules or carriers out of Golgi membranes.; they note that others have purified GBF1 and it may be possible to immunopurify a FLAG-tagged version of the protein expressed in 293T cells.

Alternatively, if you can show that inducible expression of GBF1 phospho-mimetic mutants Y876E and Y898E can drive Golgi to ER localization of GALNTs in the absence of Src activation and show the cargo selectivity of such tubules, that would be sufficient to justify presentation in eLife. This alternative would require a complete reframing of the text to indicate that an unknown mechanism yet to be elucidated accomplishes this unexpected but fascinating molecular process. Such reframing would be important as the reviewers remain rather skeptical about GBF mediated membrane tubulation.

I include their detailed responses to guide your next steps. They acknowledge that this may require more than a short time to complete but still want to give you a chance to try. I realize that this is not the answer you were hoping for and we will be flexible about the time required to respond.Reviewer #1:

The revised version of the manuscript by Chia et al. is only a minimally altered version of the original submission. The main changes in the text are within the discussion and the authors are mainly to argue against the criticism raised by the reviewers.

I find the following points confusing:

1. The authors state that they don't think that it is a key point that Arf1-GTP is at the Golgi. They propose that it is the complex between GBF1 and Arf1-GDP that is relevant for tubule formation. I am not sure that the experimental evidence that is provided is convincingly showing this.

2. The authors argue that it is irrelevant to talk about COPI, because Arf1 could generate tubule itself. They cite a paper by Francesca Bottanelli. I would like to stress that the Botallei paper showed Arf1 tubules that are directed to the cell periphery and NOT retrograde transport to the ER. In addition, the Botanelli paper did not suggest that these are tubules generated with Arf1-GDP. Therefore, I find the argumentation used in the rebuttal a bit confusing.

3. I think that the point that the complex of Arf1-GDP and GBF1 generates tubules should be demonstrated experimentally.

4. The argument about the conservation of the tyrosine residue in yeast is confusing. Firstly, there is very little tyrosine phosphorylation in yeast. There are dual-specificity kinases in yeast that can perform tyrosine phosphorylation. However, there kinases are conserved in humans. So why do mammalian cells then use Src, and not the ancestral dual-specificity kinase. I find it confusing why the authors are insisting on keeping a piece of text that is so speculative and most likely wrong. Anyhow, this is just a minor point.

I think that the point that the complex of Arf1-GDP and GBF1 generates tubules should be demonstrated experimentally. Based on the new discussion and the rebuttal letter, I see that the authors themself consider this very important. I think this point deserves to be tested experimentally.

Reviewer #2:

Signaling pathways modify intracellular membrane trafficking and protein modifications on different levels. In this study, the authors investigate the mechanism behind Src activation-induced relocalization of a subset of Golgi enzymes, GALNTs, from Golgi to ER. In response to Src activation, authors observe GALNT2-GFP in Golgi-derived tubular structures. They also observed temporal activation of small GTPase Arf1 and phosphorylation of Arf1 GTP exchange factor, GBF1. The authors propose the model in which phosphorylation of GBF1 by Src results in GBF1-Arf1 complexes that generate membrane tubules for traffic GALNTs from Golgi to ER.

In the revised submission, Chia et al. have fixed the many errors in the manuscript, which has indeed improved its presentation. They also provided two new experiments and significantly updated the Discussion section. At the same time, authors mostly responded to our and other critiques not by performing requested experiments/controls but by referencing their own previously published work and by modifying the text. We believe that this kind of response is not adequate.

My main concerns are as follows:

1. As I have stated in the first round of review, to quantify Src-dependent Golgi-ER relocalization of Golgi enzymes, it is essential to provide reproducible, high-quality images quantify colocalization of HPL signal with ER and Golgi markers. The ratio of ER to Golgi signal is the most important parameter here. The work should be reproducible, and therefore mere references to previously published work are not sufficient. The model system (HeLa cells with inducible Src) is not adequately characterized in terms of relocalization of GALNTs from Golgi to ER. Specifically, images presented in Figure 1B and, even more strikingly, in Supplementary Figure 1C, H are not supporting the notion that ER/Golgi ratio of HPL signal (i.e. relocalization of GALNTs) has been changed significantly. Without proper verification that retrograde trafficking of Golgi enzymes is increased in a Src/GBF1-dependent manner, the title of the manuscript is not supported by the data since the direction of movement of GALNT-GFP-positive tubular structures is unknown.

2. Endogenous Golgi cargo has not been detected in Golgi-derived tubules, suggesting that tubule formation could be an artifact of protein overexpression. Authors' arguments that "tubules are transient in nature… it makes it harder to observe…chemical fixation significantly disrupts tubule integrity" are valid in general, but not at the level of eLife quality paper. Moreover, for the majority of tubule imaging in the manuscript (Figures 1G, 2C, S1K, S2A), the authors successfully used chemical fixation to demonstrate the association of overexpressed proteins with tubular structures. If necessary, consider live cell microscopy.

3. Authors clearly shown that Src phosphorylates GBF1, and they identified target phosphorylation sites on GBF1. Authors are suggesting that upon Src activation, GBF1 binds to Arf1-GDP, and this complex stimulates the formation of GALNT carrying tubules. However, I still have a hard time aligning this hypothesis with the data presented in the manuscript. During the burst of Arf-GTP, one would assume that k-on exceeds k-off resulting in Arf-GTP levels peaking and Afr-GTP exceeding GBF1-Arf-GDP. However, starting from 10 min following Src activation, the GALNT tubules emanating from the Golgi are significantly increased. This would indicate that tubule formation is not really driven by GBF1-Arf-GDP because it peaks at 20-30 min, when GBF1-Afr-GDP would be at its lowest. In S2B they show that Arf-GTP levels are lower than the controls. In S5AandB, Afr-GTP level as low as the control condition. Authors conclude that constitutively active SrcEG has the same effect on Arf-GTP levels as phosphor-mimetic GBF1 resulting in low levels of Afr-GTP. One can imagine a hypothetical scenario where the entire pool of GBF1 is engaged with Arf-GDP. But, SrcEG cells do have increased HPL staining in the ER and Golgi which, as the authors claim, is due to GALNTs transported to the ER in GBF1-Arf dependent tubules. This would indicate that the transport of GALNTs to the Golgi is independent of Arf-GTP, which is at odds with the kinetics of tubule formation and Arf-GTP levels in Figure 2.

4. As suggested by other reviewers, to validate the model that Src-dependent phosphorylation of GBF1 is causing relocalization of Golgi enzymes, it will be essential to show that inducible expression of GBF1 phospho-mimetic mutants Y876E and Y898E would drive Golgi to ER localization of GALNTs in the absence of Src activation.

Reviewer #3:

The authors model is now more clear, but still not convincing. They are proposing that GBF1-Arf1-GDP complexes are tubulating membranes. There is no precedent for such an activity and other plausible explanations have not been ruled out. As stated in the previous review, an alternative explanation is that their observations are similar to those observed under BFA treatment. The Hsu and Luini groups explored one possibility for why BFA induces Golgi tubulation: (https://pubmed.ncbi.nlm.nih.gov/21725317)

The authors model and cartoon for the GEF reaction in Figure 7A is too simplistic, as the step they label with "kcat" actually represents more than one step: first GDP must dissociate before GTP can dissociate. This is absolutely essential as GDP and GTP occupy the same binding site. Also, the use of "kcat" generally refers to the rate-limiting step, and this is exactly the point I am making – an increase in kon (which appears to be the consequence of phosphorylation) is irrelevant to the overall reaction rate constant if kon is not the rate-limiting step. The step labeled "kcat" could very well be rate-limiting (and at the very least there is no reason to conclude that it is not rate-limiting, which is what the authors appear to be claiming). Therefore, my original concern still stands: their data are most consistent with phospho-GBF1 forming a stable complex with Arf1-GDP, which will reduce, rather than enhance the kinetics of exchange.

I also note that in Figure 7, the authors have incorrectly used upper case 'K's, which are used for equilibrium constants, rather than lower case 'k's, which should be used for the rate constants that they are referring to. Furthermore, by convention kcat is used to refer to the overall rate constant of the reaction.

The authors claim in the rebuttal letter that the "kcat" step is unlikely to be rate-limiting because this is the case for "most enzymes in metabolic pathways acting on small molecules" is both unfounded and probably irrelevant to an exchange factor.

The authors claim that the Antonny, Chabre, and Cherfils paper supports their model but I strongly disagree. Yes, the mutant they used blocks exchange, and also stabilizes binding to Arf-GDP. The authors appear to be ignoring the fact that GDP must dissociate before GTP can bind. Strong binding to Arf-GDP will slow GDP dissociation, and therefore also slow the rate of exchange. The authors' strong language on these points does not make their logic any more correct.

The authors are twisting themselves in knots by explaining that their in vitro binding assay does not include GTP, rather than performing an actual exchange assay in which GTP is included. Rather than trying to argue with reviewers, they could simply perform an actual nucleotide exchange experiment to see whether phosphorylated GBF1 is a better GEF or not. Based on their proposed model for how tyrosine-phosphorylation within the Sec7-domain enhances GEF activity, this should be straightforward to perform using the Sec7-domain of GBF1, rather than the full-length protein which the authors note is difficult to purify.

Finally, from my perspective, I still don't understand why on the one hand, the authors are arguing that phosphorylation makes GBF1 a better GEF, yet on the other hand, the authors' model invokes a functional role for a stable GBF1-Arf1-GDP complex. Neither of these two possibilities is fully supported by the data.

[Editors’ note: further revisions were suggested prior to acceptance, as described below.]

Thank you for resubmitting your work entitled "Src activates retrograde membrane traffic through phosphorylation of GBF1" for further consideration by eLife. Your revised article has been evaluated by Suzanne Pfeffer (Senior Editor) and a Reviewing Editor.

The manuscript has been improved but there are some remaining issues that need to be addressed, as outlined here.

The reviewers felt that although SrcKM is supposed to be dominant negative, it is difficult to account for the effects of endogenous Src and other family members. To show that the phosphomimetic mutant of GBF1 is sufficient to induce tubule formation, the reviewers felt that the experiment should be carried out in Src-deficient cells, i.e. with pharmacological or genetic interference and not with a dominant negative approach. Reviewer 2 agreed that you would know best how to do that, as long as you can demonstrate that Src is not active under whatever treatment they use.Reviewer #1:

The authors have addressed some of the initial concerns I had. I also think that the inclusion of the new data with the phosphomimetic mutant of GBF1 strengthen the story as a whole. Furthermore, I think it was also good to remove the parts of the discussion on the conservation of the phosphotyrosine sites in yeast GFP1, because yeast has no tyrosine kinases. Finally, removing the part with the highly speculative role of Arf1-GDP in tubule formation was absolutely necessary. Although the current work leaves many open questions, I think it is an important contribution to the field and future work will focus on the outstanding questions.

Reviewer #2:

The previous review stated "If you can show that inducible expression of GBF1 phospho-mimetic mutants Y876E and Y898E can drive Golgi to ER localization of GALNTs in the absence of Src activation and show the cargo selectivity of such tubules, that would be sufficient to justify presentation in eLife. "

The authors have addressed concerns regarding the proposed tubulation mechanism by changing the text to be less specific about the details. The authors now provide evidence that expression of phospho-mimetic GBF1 induces Golgi tubules. However, they have not shown cargo selectivity of these tubules. They show these tubules stain with GALNT2, but do not show any selectivity.

Perhaps more importantly, unless I am missing it, they have not shown that phospho-mimetic GBF1 is sufficient to induce GALNT relocalization to the ER in the *absence* of Src activation. In fact, the effect of the phosphomimetic mutant appears more pronounced when Src is activated (Figure 5 supplement 1, panel F, blue bars) than when Src is not activated (Figure 5 supplement 1, panel F, red bars).

[Note that Figure 5 supplement 1 panels E and F labels suggest the phospho-dead mutant (Y->F) is being used but text and legend indicates phospho-mimetic (Y->E)]

This suggests that the relevant Src target is a protein other than GBF1.

Therefore, the functional importance of GBF1 phosphorylation by Src remains unconvincing.

eLife. 2021 Dec 6;10:e68678. doi: 10.7554/eLife.68678.sa2

Author response


[Editors’ note: the authors resubmitted a revised version of the paper for consideration. What follows is the authors’ response to the first round of review.]

Overall, the reviewers were excited by the hypothesis that Src activation and phosphorylation of GBF1 control specialized retrograde Golgi-ER trafficking. That being said, they raised a number of issues that would take some time to address, to support fully the conclusions of the present study. One of the reviewers provided the following comments that would be important to consider in regard to your model.

We thank all the reviewers for their evaluation of the manuscript and the detailed comments. We have taken into account their concerns and questions. We provide a conceptual rebuttal to the main concern of GBF1 activation versus Arf1 binding. In addition, we have performed the following additional experiments:

– GBF1 knock-down in Src activation conditions to show that it is indeed GBF1 that drives Arf1-GTP formation (Figure 3C-D).

– GBF1 knock-down and live imaging showing that tubules are not formed in the absence of GBF1: Figure S3G-H.

We have significantly re-written the Discussion to better explain our reasoning and its limits. We also added a diagram (Figure 7A) to explain our model of increased affinity with increased Arf-GTP production. We understand some aspects of our model may be counterintuitive or controversial, and we would like to point out the results seemed counterintuitive to us as well at first. This is one of the reasons why the paper has been in the works for several years. We hope the model will be more clear with this new version and that our study will finally find its home and an audience at eLife.

"It seems that the authors are claiming that the phospho-GBF1-Arf1-GDP complex is more stable (which their data do suggest). But their data do not clearly discriminate between positive or negative regulation…. If Src is a positive regulator of GBF1, then why does phospho-GBF1 form stable complexes with Arf1-GDP? A GEF that binds *more* stably to Arf1-GDP is actually *less* active. This may be counterintuitive, but this is how GEFs work: the action of BFA and the catalytic E->K mutations in Sec7 domains are both good examples of how when the GEF domain binds more strongly to Arf1-GDP, they become worse GEFs…If they were trying to demonstrate that Src is a positive regulator of GBF1, the data are not convincing.

We understand the confusion and acknowledge that perhaps the use of the word “stable” was not appropriate. We meant more “stable” in the sense of phospho-GBF1 having a higher affinity for Arf1-GDP than non-modified GBF1. This fact is supported by data from the binding assays as noted by the reviewer. One has to note that the binding assay is done in the presence of Arf-GDP, but there is no GTP so no opportunity for GEF catalysis to occur. Thus, we are only looking at the Kd (koff /kon) of the complex.

For an enzyme, a binding affinity to the substrate is required to engage the right substrate and an increase in binding affinity does not mechanically imply a loss of catalytic activity. There are clear examples in the literature of enzymes (e.g kinases like Src) showing a decrease in Kd for their substrate and an increase of phosphorylated substrate (e.g Cbl, p130Cas, etc…).

In the case of GBF1, the protein needs to bind its Arf-GDP substrate first, then induces the change of conformation that will lead to nucleotide exchange. A classical way to describe this is a suite of reactions involving a binding reaction with a constant, kon and then a catalysis reaction with the constant kcat. There are other constants that are important, such as the koff for GBF1/Arf-GDP and koff for GBF1/Arf-GTP (others, like the GBF1/Arf-GTP kon can be considered negligible). Please see Author response image 1. Altogether these constants determine an apparent Kd of the GBF1/Arf complex and the rate of production of Arf-GTP.

Author response image 1.

Author response image 1.

The phosphorylation could in theory affect the kon or the koff (or both) of the GBF1/Arf-GDP complex formation. The fact that E->K mutants of GBF1 tend to form complexes with Arf1-GDP suggests that the koff is low to start with. So, we can hypothesise that phosphorylation enhances the kon and the complex might form more readily. (While less likely, the data could also be consistent with a change in koff).The kon and kcat are not necessarily coupled nor do they have necessarily the same magnitude. If kon is larger than kcat, complexes can last for some time on average before the complex is being dissociated after nucleotide exchange.

If kcat is larger than kon (as for most enzymes in metabolic pathways acting on small molecules), the complex enzyme-substrate is very transient and barely detectable, which we believe might be what the reviewers were referring to.

The fact that GBF1 appears to form complexes with Arf-GDP, which may drive its recruitment to Golgi membranes has been proposed and documented (Quilty et al., 2014, 2018). This suggests that in the case of GBF1/Arf-GDP complex, kon is larger than kcat and the complex has a non-negligible half-life. But of course, this remains to be fully established.

As mentioned above, in the in vitro assay we used, the conversion to Arf-GTP is not possible, so it is mostly an increase in kon / koff that is measured. in vivo, we observed an increase in GBF1 recruitment at the Golgi, which is consistent with an increase in binding affinity. The decrease in Kd results in more complexes being formed and, assuming the kcat is unaffected, it will also result in more Arf-GTP produced.

It is true that a loss of catalytic activity can result in an increase in binding. The difference is that in the examples cited by the reviewer, E->K mutation or BFA engagement, increased binding is not due to an increase in binding affinity but a decrease or block of catalytic activity. In other words, kcat is strongly impaired or null while kon is not affected.

In the modeling that was done for our study, we did not see a clear indication of stimulated catalytic activity, but rather an increase in binding affinity. Thus, our interpretation is that GBF1 phosphorylation increases the kon without affecting kcat. Of course, it is hard to be affirmative about this without a full biochemical characterisation.

Testing this hypothesis biochemically is beyond the scope of this study. While we have attempted it, GBF1 protein is difficult to purify in significant amounts and it has not been possible to measure its GEF activity in vitro. GBF1 is a large protein prone to proteolytic degradation. It would also require various biochemical techniques for which we are not really equipped nor experts. Furthermore, and very importantly, it is likely that another protein (and maybe more) is involved in the GBF1-Arf-GDP complex formation. That protein is the receptor for Arf-GDP at the Golgi. There are also reports in the literature that other domains of GBF1 and other receptors are involved in GBF1 recruitment at the Golgi. Without identifying these additional players, the biochemical characterisation in vitro might be impossible or at least not representative.

In sum, the key message is that the scenario we propose is consistent with our data so far and there is no fundamental or conceptual incoherence in our model.

They have shown that *cellular* levels of Arf1-GTP transiently increase, but they have not shown that Golgi-localized Arf1-GTP increases, and there are other ArfGEFs in cells. The reduction of COPI localization provides further evidence that Arf1-GTP is not increasing at the Golgi.

As you may note, the presence of Arf1-GTP at the Golgi is actually not a central point of our proposal: we focus on GBF1, its phosphorylation and its role in GALNTs relocation. Nonetheless, the hypothesis that Arf-GTP is formed somewhere other than the Golgi disregards a lot of evidence and existing literature. It has been abundantly shown that Arf and GBF1 are involved in retrograde Golgi to ER traffic and that GBF1 induces the formation of Arf-GTP. Here, we show that GBF1 is recruited at the Golgi after Src activation.

We have also shown previously that Src is present at the Golgi, that its activation induces an increase of phospho-Y at the Golgi, that it induces the relocation of Golgi enzymes, the GALNTs, from the Golgi and that Arf1 is involved in the process (Bard et al., 2003; Chia et al., 2014, 2019; Gill et al., 2010). So, the data would overwhelmingly indicate that Arf1-GTP increases at the Golgi.

There are other GEF in the cell, but we show that phospho-deficient mutant forms of GBF1 are not able to induce an increase in Arf-GTP (Figure 5A). If other GEFs were involved, mutant GBF1 should not affect Arf1-GTP levels.

The fact that COPI at the Golgi is not increasing is not at all a proof that Arf-GTP is not increasing at the Golgi. While there is ample evidence that Arf-GTP can recruit COPI subunits to membranes in vitro, there is to our knowledge no proof that Arf1-GTP is sufficient to induce COPI vesicle formation in vivo. In addition, Arf-GTP has been proposed to be involved in reactions independent of COPI, see for instance (Bottanelli et al., 2017).

The key concept is that if a GEF bound strongly to GTPase-GDP, it would actually inhibit activation by GTP binding. Here is a reference from Antonny and Cherfils (and Chabre) for the specific example of a Sec7 domain mutant that binds to Arf-GDP better and therefore is a worse GEF: https://pubmed.ncbi.nlm.nih.gov/9649435/

This comment is similar to the objection raised above. This “key concept” is a misinterpretation of the solid and beautiful data presented in this paper. The ARNO mutant presented is unable to convert Arf-GDP in Arf-GTP (kcat is virtually null), which means it remains bound to Arf-GDP and can dissociate with a certain koff, presumably quite low. This is why it is more strongly bound to Arf-GDP, as already mentioned above. There is no experiment in the paper in conditions where the conversion is blocked for both wild-type and mutant, so there is no way to say whether the affinity, the Kd for Arf-GDP has been affected.

Admittedly, in this paper, the kcat is estimated at >10/sec, which is not consistent with the formation of a GEF/Arf-GDP complex lasting for several seconds. But the study is done with ARNO and the value is derived from experiments done in vitro, so the situation could be quite different for GBF1 in an in vivo context.

Here is a review from Wittenhofer: https://pubmed.ncbi.nlm.nih.gov/17540168/

in which he key part about affinities is: "the affinities of the binary complexes between the G protein and either the nucleotide or its GEF are very high. In contrast, the affinities of the exchange factor for the nucleotide-bound G protein and of the nucleotide for the exchange-factor-bound G protein (the ternary complexes) are much lower.

This citation has limited to no bearing on our model: we are simply stating that the affinity of the phosphorylated GEF for Arf-GDP is higher than the non-phosphorylated one; we are not making a comparison between various forms of Arf.

This is consistent with the energetics of how all enzymes work – enzymes bind best not to their substrates or products, but to their transition states (otherwise enzymes would simply stabilize their substrates rather than performing catalysis). The nucleotide-free state of GTPases is the intermediate that is closest to the transition state of the exchange reaction. There is a general misconception that GEFs bind best to GDP-bound GTPases, but this is not true and has arisen because the so-called "GDP-locked" mutants that people have used actually have a reduced affinity for nucleotides (both GDP and GTP) and therefore tend towards being nucleotide free. Anyway, it's a common misconception and usually one that is not too important but in this case it matters for their mechanism."

Again, we are not disputing the fact that GBF1 needs to bind more efficiently to the transition state, nucleotide free form in order to function as a GEF. We are, however, strongly disputing the notion that an increased affinity for the GDP-bound form will necessarily result in a less efficient GEF.

Another reviewer wrote, "Since simply seeing more Arf1 at the Golgi does not necessarily mean that it is active, perhaps they could perform a FRAP experiment? Given that the Golgi is a large organelle, the kinetics of recovery would reflect association of ARF1 to the Golgi. If Src really increases the levels of active Arf1 at the Golgi, then it should affect the on/off-kinetics in a FRAP experiment. Or they could do Trp-fluorescence assays with recombinant Arf1 and GBF1."

The fraction of Arf-GTP and Arf amount at the Golgi increase and decrease in sync, which strongly suggest that the two processes are linked. The FRAP experiment or related ones are challenging for us at this time in part due to the public health situation, because access to the right microscope and required training is not possible.

Also, please see above the comments made above and in the Discussion about Arf-GTP. The question of whether Arf-GTP is present at the Golgi is not a key point of our model at this stage. We are not proposing that Arf-GTP specifically plays an active role in the relocation of GALNTs. In the presence of increased GBF1 expression (not phosphorylated), we observe an increase in Arf-GTP but little or no effect on GALNT relocation.

This observation led us to propose instead that GBF1 plays a key role and more specifically that the complex GBF1/Arf-GDP is critical in the formation of tubules and transport carriers. This is why the increase in affinity without an increase in catalytic activity would be important: it would allow the formation of more GBF1/Arf-GDP complexes on Golgi membranes.

We hypothesise that the catalytic exchange to GTP is a mechanism to deactivate the GBF1/Arf-GDP complex. Please note that this last part is an hypothesis at this stage. We are fully aware that we do not have sufficient data to fully support it.

Reviewer #1:

In this study from the Bard lab, the authors explore the mechanism behind Src activation induced relocalization of GALNTs enzymes from Golgi to ER. They use an imidazole-inducible Src model, which generates increased O-GALNacylation. In response to Src activation, they observe GFP-GALNTs in tubules emanating from the Golgi. They also observe more Arf1-GTP in Src-activated cells. They Identify Y-phosphorylation sites in GBF1 induced by Src phosphorylation. They can confirm Src-induced phosphorylation at one of these sites (Y876) by phospho-specific antibody. They find that expression of the Y876F GBF1 mutant blocked the Src-activation induced increase in cellular Arf1-GTP levels. Expression of the Y876E/Y898E mutant dramatically reduced the amount of basal Arf1-GTP. They perform modeling studies suggesting that phosphorylation of Y876 should increase the affinity of the GBF1 Sec7d for Arf1.

Their observations of Src activation are similar to the acute effects of BFA. BFA triggers formation of stable, complexes between GBF1 and Arf1-GDP. These complexes bind stably to the Golgi, but are inactive and effectively poison the GEF, reducing the amount of Arf1-GTP generated at that site. Indeed, Src activation results in slight depletion of COPI at the Golgi, and increase in GBF1 at the Golgi, similar to effects of BFA. BFA also triggers tubules emanating from the Golgi.

The authors conclude with a model in which Src phosphorylation of GBF1 results in stable GBF1-Arf1 complexes that somehow generate tubules from the Golgi that traffic GALNTs enzymes back to the ER.

Thank you for the summary and the parallel made with the effects of BFA treatment. We agree with the similarities pointed out, however the analogy has its limits. We do not claim that phosphorylation induces a complex as stable as in the case of BFA treatment, but rather increases the affinity of GBF1 for Arf-GDP. The complex still dissociates after some time after conversion of Arf to GTP binding.

I do not find the overall mechanistic explanation of the observations to be convincing, and in my mind the authors have not ruled out alternative explanations. While the authors have made some interesting observations, I do not believe they have managed to correctly connect the results to a coherent and plausible mechanism.

We hope the re-written Discussion will help clarify our model.

The authors' model does not even appear to be internally consistent – on the one hand they are claiming that Src activation results in GBF1 activation of Arf1 at the Golgi. On the other hand, they are claiming that Src activation results in stable GBF1-Arf1-GDP complexes that would not be competent for activating Arf1.

As pointed in our reply above, we agree that the use of the term “stable” was misleading. We are claiming that the complexes GBF1-Arf1-GDP are competent for producing Arf1-GTP, but have enough residence time to explain the increase of GBF1 on Golgi membranes and mediate the formation of tubules.

In summary, the authors can't seem to decide on whether Src is a positive or negative regulator of GBF1, and it remains unclear whether the resulting GBF1-Arf1 complexes are actually responsible for trafficking GALNTs enzymes from the Golgi to the ER.

We find this comment unfair as we provide abundant evidence that GBF1 and Arf are involved in the relocation of GALNTs, as stated in the summary of the reviewer him/herself. The fact that the complex of the two specifically is involved derives from a careful analysis of the results and is consistent, as pointed by the reviewer, with previously published results on BFA effect, where a GBF1-Arf1-BFA complex induces the formation of tubules.

Specific issues with interpretations and experimental design:

The authors find that overexpression of GBF1 increases the amount of Arf1 activated in cells in response to Src activation, but critically, they do not test the dependence of Src-responsive Arf1 activation on GBF1. Why have the authors not monitored the extent of Src-triggered Arf1 activation in GBF1-knockdown cells?

We thank the reviewer for the suggestion and have tested accordingly. We found that the loss of GBF1 by siRNA KD abolished the increase in Arf1-GTP loading over time of Src activation. Please find the data in Figure 3C-D.

The authors claim that Src activation increases the amount of Arf1 at the Golgi but the fluorescence images do not appear to support this claim. Although Arf1 is observed on the resulting tubules, this could represent its presence in non-productive membrane-bound complexes with GBF1.

This point is unclear to us. Maybe the reviewer assumes that Arf-GTP is the key driver in tubules formation? What are “non-productive membrane-bound complexes with GBF1”? We observe an increase in GBF1 at the Golgi; we propose that it is bound to Arf-GDP because of the binding assay and the previous literature.

The authors draw the unsupported conclusion that "these GBF1-Arf1-GDP complexes are directly involved in BFA-induced tubule formation." It would be straightforward for the authors to test whether GBF1 is indeed required for formation of the Src-induced tubules. Similarly, it would be even more convincing if they could also determine whether GBF1 is required for BFA-induced tubules (if this has not already been demonstrated in the literature).

First, we would like to point out that the sentence presented in brackets was not present in our text. We did not present this idea as a conclusion but as a working hypothesis in the Discussion section. The sentence read instead: “Instead, the BFA experiments and our results suggest that the GBF1-Arf1 complex induces the formation of tubules, albeit it is not clear how”.

Nonetheless, this was an interesting suggestion and we have now performed the imaging of GBF1-depleted cells and indeed we observe a much reduced formation of tubules (Figure S3G-H).

Furthermore, the authors need to test the effects of GBF1 Y/F and Y/E mutants on Src-induced tubule formation.

We have documented the effect of the GBF1 Y/F mutants on the relocation of GALNTs. Unfortunately, tubule formation is a transient and delicate event to image. The experiment proposed is thus technically difficult to perform and very time consuming. In addition, the GALNTs we have are GFP tagged, and so are the GBF1 mutants; so we would need to re-clone them, then re-derive a stable cell line.

Perhaps the observed increase in cellular Arf1-GTP levels could be due to the action of the BFA-independent GEFs, perhaps as a compensatory response to the loss of GBF1 activity induced by Src-dependent phosphorylation?

This alternative model would hardly satisfy the Occam’s razor test, would it? We think our model is much simpler and explain the data satisfactorily.

The authors make the claim "Altogether, these results indicate that phosphorylation on Tyrosines Y876 and Y898 drives an increase of affinity of GBF1 for Arf1-GDP, in turn increasing Arf1-GTP levels and promoting GALNTs relocation." Yet the phosphomimetic mutants have reduced Arf1-GTP levels! It appears more likely that phosphorylation is inducing a BFA-like effect, and not actually increasing GBF1 activation of Arf1.

Indeed, the lowered levels of Arf-GTP are initially a surprising result. However, active Src expression results after 12-18h in exactly the same effect: a reduction of Arf-GTP levels. Src activation results in a transient burst of Arf-GTP, followed by a slow decrease to levels below that of the control cells. It is not clear at present what is the mechanism at play, but we have proposed the following explanation:

“Perhaps after Src activation, either the Arf-GDP or GBF1 receptors (or both) are removed from Golgi membranes by tubules-derived carriers. This would explain why overnight Src expression, while inducing a marked GALNT relocation, also results in a reduction of Arf-GTP levels.”

As for the phosphomimetic mutants, we cannot observe the effect of their expression at short time points; but we expect they would behave similarly to a Src activation.

The authors results, both experimental and modeling, strongly suggest that phosphorylation results in stable, non-productive GBF1-Arf1 complexes that would not lead to an increase in Arf1 activation. For an exchange factor, a mutation or PTM that increases affinity for the GTPase substrate will actually result in reduced activation as the GEF needs to dissociate from the GTPase in order for GTP to stably bind.

Our results do not suggest this, as we have explained above.

A key question that is not addressed is whether Src phosphorylation of GBF1 triggers increased Golgi to ER transport or decreased ER to Golgi transport of GALNTs? Either of these situations could cause the observed response to Src activation assuming the GALNTs normally cycle between the Golgi and ER.

This is not correct. At steady state and at t=0 in the Src induction experiment, the amount of GALNTs in the ER is negligible, so blocking ER export could not have a major effect on their intracellular localisation unless there is a very rapid cycling from the Golgi to the ER. Our imaging experiment does not reveal any such transport at steady state. Finally, in addition to GBF1, all the regulators of the pathway we have identified, such as Src and ERK8, are clearly located at the Golgi (Chia et al., 2014).

Reviewer #2:

In this manuscript, Chia et al. tried to provide a first glimpse of the molecular machinery driving the GALNTs Activation (GALA) pathway, which was proposed by the Bard group ten years ago. The major claim of the paper is that the regulated Src-dependent phosphorylation of GBF1 (specifically on Y876 and Y898) is the primary molecular switch that drives formation Golgi-originated membrane tubules that serve to deliver GALNT enzymes to ER. The experiments performed in the manuscript are appreciable and abundant. However, the presentation and writing are sloppy, which has made comprehension tiresome and also tricky. The discussions are shallow, and the authors have conveniently avoided rationalizing interesting/surprising findings. Overall, the hypothesis that Src activation and phosphorylation of GBF1 control specialized retrograde Golgi-ER trafficking looks exciting and valid, but this needs to be supported by more robust data, which is unfortunately not presented in this manuscript. A substantial revision would be required for this manuscript to be published.

1. A major assertion throughout this manuscript is the regulated relocalization of the enzymes GALNTs from Golgi to ER, and corresponding HPL staining has been used as a readout of GANLT activity. Unfortunately, all the images of HPL staining throughout the paper are of low quality and have inconsistencies in the staining pattern and intensity. It is essential to provide high-resolution images and quantify colocalization of HPL signal with ER and Golgi markers. Colocalization of the endogenous GALNT1 with these markers will be a more accurate measure of the relocalization of the enzyme to the ER. PDI IP with VVL was a smart approach and indeed suggest GALNT activity in the ER but could also indicate minor relocalization of PDI4A to the Golgi compartment. The effect of the imidazole treatment on intracellular localization of PDI should be tested.

As the reviewer has noted, we have characterised the pathway for the last 10 years and published several studies about it. The facts that GALNTs are relocated to the ER or that the increased HPL staining is at the ER have been established before several times (Chia et al., 2014, 2019; Gill et al., 2010, 2013). They are not the focus of this study.

In F1b, colocalization of GALNT with an ER marker will substantiate this finding. This figure also shows a noticeable increase in the perinuclear (Golgi?) staining intensity of HPL, which seems to have been ignored. Does the relocalization of the enzyme to the ER have anything to do with its increased activity in the Golgi?

We have indeed observed that HPL staining also increases in the Golgi area. One likely explanation is that substrates that are O-glycosylated in the ER are trafficked to and concentrated at the cis-Golgi, leading to this staining increase. Consistent with this interpretation the HPL pattern around at the Golgi is reminiscent of ERGIC markers, that is partially ER and partially Golgi.

2. Another major inconsistency in the manuscript is related to the imidazole-inducible activity of Src8A7F. This activity is depicted as pY 4G10 blots, but these blots (Figures2E, 3A, 4A, S1B) are all different and inconclusive. Random blot parts ( 40-180 kDa, 70-180 kDa, 60-120 kDa) are shown. It is imperative to quantify Src activity. Hopefully, careful Src quantification will shed some light on the unexplainable temporal activation of Arf1 protein.

We mostly present pY 4G10 blots >40kDa to reduce the size of the blots so as to save space in the figure. We have presented the whole blots in the source data images. The increase in Src activity is reflected by the general increase in pY staining levels and is apparent in the blots presented.

The temporal activity of Arf1-GTP has nothing to do as far as we can see with Src activity.

Indeed, general phosphotyrosine levels and GBF1 phosphorylation are pretty stable over time. We have provided an alternative explanation.

3. The third major problem is related to the use of overexpressed tagged proteins utilized thought the study. This approach was more or less valid ten years ago, but now with advances of CRISPR and other gene-editing tools, it is possible to avoid (or at least control for) artifacts connected with protein overexpression and tagging. Authors show that overexpressed GALNT2-GFP and Arf1-V5 entering into the tubular compartment emerging from the Golgi (F2C), but they failed to show a similar pattern for the endogenous GALNT1 (S1L). Moreover, the activation pattern of the endogenous Arf1 (F2E) is very different from the activation dynamic of Arf1-V5 (F3A). All these inconsistencies should be adequately addressed in the text.

While we appreciate the importance of CRISPR based genome editing, this study was indeed started 10 years ago, so some approaches are indeed not absolutely ideal. But we have confirmed all the main points with endogenous proteins: the phosphorylation of GBF1 by Src for instance is exhaustively confirmed. We have also shown extensively that endogenous GALNT1 is relocated out of the Golgi to the ER upon growth factor stimulation in our previous publications (Chia et al., 2019; Gill et al., 2010).

4. In S1F, how was the experiment performed? What is "control 0h" and what are the other time points grouped as "24h Imdz wash"? This figure needs to be properly labeled.

We apologise for the lack of clarity in this figure. In S1F, Hela-IS cells were treated with 5mM imidazole (imdz) for 24 hours; See “24 hour imdz treatment” for the corresponding HPL staining. The imdz was subsequently washed out for various durations from 0.5hours to 8hours; See “imdz washout'' for the corresponding HPL staining after washout for 2hours and 8hours. The HPL staining intensities was quantified in Figure S1G where the green bars represent the HPL intensity levels of cells at various durations of washout after 24 hours of imdz treatment. The blue bars represent imdz treatment over various time points. The legend was re-written to improve on the clarity.

5. The localization of Src in S1D is different than that of Src8A7F. Does this mutation affect its localization?

We have shown previously that a fraction of Src is present at the Golgi (Bard et al., 2003). The localisation of Src and Src8A7F are cytoplasmic with some Golgi fraction. If you compare the images in S1D and S 1F, they look similar.

6. S1H has cells missing ManII. Is there any effect of Src activation on ManII?

Based on the observations from our paper in 2010 (Gill et al., 2010), we did not observe relocation of Mann II in presence of active Src. These cells are stable cell lines derived from antibiotic selection for more than 2 weeks against cells that do not express MannII-GFP. It is possible that some wildtype cells that did not express MannII-GFP managed to escape antibiotic selection.

7. In F1D is a smart approach to measure GALNT activity in the ER. An increase in glycosylation of PDI with time upon Src activation, but in later, it is shown that Aft-GTP bursts occur within 5-10mins after Src activation and in SrcEG mutant, Arf is depleted. This data is at odds with the prolonged effect of Src activation on the HPL staining intensity and GALNT relocalization. Moreover, the burst of GBF1 phosphorylation is seen at 120 mins in F4AandB. How do all this fit in into the prolonged effect on GALNT activity and increased HPL staining?

There is indeed a complex kinetic effect, we first observe a burst of GALNTs relocalisation and Arf-GTP levels. While the numbers of tubules then decrease, they do not return to normal, indicating that relocalisation continues but at a slower pace. Indeed, as we have described, the amount of GALNTs being relocated is not equivalent to the whole pool in the Golgi, but only a fraction of it. As GALNTs are enzymes, they continuously catalyse the addition of GalNAc sugar on substrates in the ER. This results in the increased HPL (staining O-GalNAc glycan) over time after GALNTs have started relocating. Regarding Arf-GTP, as we have mentioned, the levels of Arf-GTP may not be essential for relocation. We found GBF1 phosphorylation dependent on the Src activity and phosphorylation levels remain high with Src activation.

8. Overexpressed GALNT2 indeed shows tubules, but the endogenous GALNT1 tubules are absent in S1L. In this figure, βCOP staining is also very odd. The localization of βCOP to the Golgi is well established, and there are quite a few suitable antibodies that work well (https://doi.org/10.1111/j.1600-0854.2008.00724.x). Such poorly quality staining cannot be used to rule out the involvement of COPI in GALNT relocalization.

The experiment requires fixed cells and co-staining βCOP and GALNT2. However, due to a number of technical difficulties, it is difficult to observe endogenous GALNT tubules on fixed cells:

1. Tubules are transient in nature, as one can observe from the live imaging. This makes it harder to observe with endogenous levels of proteins.

2. The GALNT antibody that we have has weak immunofluorescence staining and is not as robust as with overexpressed GALNT2-GFP.

3. Chemical fixation with 4% paraformaldehyde (PFA) significantly disrupts tubule integrity and this was also reported in (Bottanelli et al., 2017).

The lack of involvement of COPI is not the main point of our study and we are not “ruling out” COPI. We show that we are just not observing any Golgi recruitment. We are not the first ones to make this disturbing observation: a carefully crafted study does not report any COPI coated vesicles involved in retrograde transport (Bottanelli et al., 2017). We have added some representative BCOP images from the automated high throughput microscopy that was used for quantification.

9. For F2, which shows GALNT1+2, Arf1 and Afr3 KDs provide data on the efficiency of the KD. Also, look at the effect of Afr1 KD on the localization of active GBF1. Is Arf1-GDP required for the membrane recruitment of GBF1?

It has been proposed and documented that it is Arf-GDP and a Golgi receptor that drives GBF1 recruitment to Golgi membranes by forming a complex at the Golgi (Quilty et al., 2014, 2018). With increased affinity of phosphorylated GBF1 for Arf1-GDP, it results in the increased recruitment of GBF1 to the Golgi. This is the likely explanation for what we observed upon Src induction.

10. Arf-V5 and endogenous Afr do not follow the same trend. Please repeat GGA IP in F3A and probe for endogenous Arf.

We are uncertain on why the reviewer thinks that Arf1-V5 and endogenous Arf1 did not follow the same trend. As observed in Figures 1E and 3A, we could observe the burst of GTP exchange within 5-10mins of Src activation and starts to fall after 20mins for both exogenous and endogenous A rf1.

11. Is GBF1 the only Arf GEF that is phosphorylated upon Src activation? Is it not likely that BIGI, ARNO and BRAG2's conserved tyrosine residues would be phosphorylated too once Src is activated and these activated GEFs would have some contribution to Golgi trafficking?

It is possible that Src could phosphorylate other ARFGEFs as it is a promiscuous kinase and there are pY sites on BIGs curated on the phosphosite database. Testing if Src phosphorylates other ARFGEFs is beyond the scope of the paper. We focused on GBF1 as the primary GEF regulating ER-Golgi traffic. Depletion of GBF1 blocks GALNTs relocation.

12. In F4E, Src has been claimed to directly phosphorylate GBF1. However, during the purification of GFP-GBF1 there could be other associated proteins that may be effectors of activated Src. This needs to be acknowledged and before claiming that Src kinase directly phosphorylated GBF1.

We disagree as we have several lines of evidence to show the directness of the phosphorylation. In Figure 4E, we have performed an in vitro kinase assay where recombinant Src was added to immunoprecipitated GBF1. The coomassie gel (Figure S4C) and pY antibody staining (Figure 4K) clearly reflects the immunoprecipitated GFP-GBF1 band on western blot and no other band. We have also verified by mass spectrometry that GBF1 is phosphorylated by active Src (Figure 4F). In cells, Src co-immunoprecipitated with GBF1 (Figure S4A), indicating direct binding between Src and GBF1.

13. Another significant discrepancy in this study is the effect of the different Src mutants on the HPL staining and Src localization/profile itself. The model in figure 7 fails to explain how the short burst of pGBF1 and AFR1-GTP triggers prolonged relocalization of GALNT. The final model is unclear and somewhat misleading. It seems to indicate that tubule formation is caused by the tight Arf1-GBF1 complex, but the data show a transient burst of Arf1-GTP (not bound to GBF1) as a major cause of tubule formation. What selects GALNTs into these tubules.

The data does not show that ARF-GTP is a major cause of tubule formation. The presence of the burst does not necessarily indicate that it is involved in tubules formation. Regarding the selection of GALNTs, we do not know the mechanism.

Reviewer #3:

The manuscript by Chia et al. is one of a series of elegant manuscripts by the Bard lab on the GALA pathway. The topic is very interesting and I think it fits to the scope of the journal. The data are mostly of very high quality and the finding is novel, as it explains the role of Src in retrograde transport.

We thank reviewer 3 for the kind comments, much appreciated.

Apart from some technical and minor comments that I mention below, I am mainly concerned with one point: the authors claim that Src induces retrograde transport that is dependent on Arf1 and GBF1. However, the claim that it is COPI-independent. The evidence for this is relatively weak. Regardless of this, there is no evidence that the tubules that the tubules observed in response to Src activation are directed towards the ER. I did not see evidence that these tubules move towards the ER, or whether they passage through the ERGIC. Maybe these tubules detach from the Golgi to form a carrier that moves to the ER.

I am happy to drop this point, if the editor and/or the other reviewers think that this is beyond the scope of this paper.

We agree that COPI independence is not formally established in our manuscript. We wrote that our data suggests it, we do not claim proof. This is a difficult point to prove as COPI is a key element for Golgi integrity and even required for cell viability. However, please note that this is not a central point of the manuscript.

Regarding the role of the tubules, it is correct that we did not observe fusion with ER, but this is a standard result in the field (Bottanelli et al., 2017; Sciaky et al., 1997; Sengupta et al., 2015). We show that the enzymes relocate from the Golgi to the ER, that they exit the Golgi in tubules and that we cannot detect any vesicles at the time of relocation. The tubules are specific for GALNTs and do not contain another Golgi enzyme, so they are fitting the bill of transport carrier precursors.

1. The images in Figures 1B and S1C are identical. This should be clearly indicated. The authors should state that S1C shows the very same cells as 1B, only with a co-staining for Giantin.

We have indicated in the legend of S1C that the images are from Figure 1B. Thank you for pointing this out.

2. I noticed that the size of the Golgi (and the cell) is bigger in imidazole-treated cells (with Src activation). Since the increase of fluorescence is mostly apparent in the Golgi region, I think that the HPL intensity should be normalized by the size of the cell.

We do not detect a general change in cell size upon imidazole treatment. The image of untreated cells was a cluster of cells that were more tightly packed together, hence they look smaller. We have changed the image of the untreated cells with another field of similar cell sizes for a better comparison.

3. Figure 1G: I think that the authors should image more than just 4 cells. It is also not indicated how many experiments were performed.

Each cell was acquired on different wells and on 3 different days. To further substantiate the GALNT2 tubule formation upon Src activation, our new Figure S3G demonstrates increased tubule formation in control cells (treated with non-targeting siRNA) within 30 mins of imidazole treatment.

4. Figure 2C: this result requires some form of quantification. How many tubules were observed and in how many cells? How many of the tubules were Arf1-positive?

We quantified the tubules number in Figure 1F. We did not quantify the number that are Arf positive as this is not a critical point: we are not making a statement on the Arf role but on GBF1.

5. The conservation of tyrosines (in GBF1) from yeast to mammals is meaningless. Yeast (and fungi in general) have no tyrosine kinases (there are very few exotic exceptions, but S. cerevisiae is definitively negative). The fact that yeast has no tyrosine kinases actually should prompt to investigate the tyrosine residues that are not conserved. I think this passage should be re-written. As it is scientifically not accurate and misleading.

Actually, while there is no tyrosine kinase per se in yeast, phosphotyrosines and corresponding kinases have been reported (Malathi et al., 1999; Stern et al., 1991). There could be as many as 27 different double specificity kinases in yeast (Zhu et al., 2000). Thus, we think our statement is scientifically accurate.

6. Figure 5: the authors state that the stimulus was "nearly abolished". This is not correct. Looking at the blot, I would. Re-word this and rather use "reduced". The double mutant is also still phosphorylated

We stand by our statement: in Figure 5B, there is no difference between 0 and 10 min imidazole, there is therefore no detectable increase of Arf-GTP.

7. Figure 5F is missing. Figure 5E just shows the quantification, but no primary data.

We have added the panel in Figure 5E and moved the quantification to 5F.

[Editors’ note: what follows is the authors’ response to the second round of review.]

The reviewers all agreed that the most critical thing missing is direct demonstration of GBF1-Arf1-GDP tubulation activity. They also suggest that you should consider alternative explanations for the data. Specifically, they suggest you load Arf1 with GDP-betaS and add phosphorylated GBF1, then test if the complex drives formation of tubules or carriers out of Golgi membranes.; they note that others have purified GBF1 and it may be possible to immunopurify a FLAG-tagged version of the protein expressed in 293T cells.

Alternatively, if you can show that inducible expression of GBF1 phospho-mimetic mutants Y876E and Y898E can drive Golgi to ER localization of GALNTs in the absence of Src activation and show the cargo selectivity of such tubules, that would be sufficient to justify presentation in eLife. This alternative would require a complete reframing of the text to indicate that an unknown mechanism yet to be elucidated accomplishes this unexpected but fascinating molecular process. Such reframing would be important as the reviewers remain rather skeptical about GBF mediated membrane tubulation.

We understand the criticisms raised and we have refocused the discussion on the main points of the manuscript: how Src induces the relocation of GALNTs by direct phosphorylation of GBF1. Re the tubulation experiments, we have attempted some of these experiments, in particular purifying Golgi membranes and performing a GEF assay in these conditions (see below in Annex), but we have not been very successful and for instance unable so far to detect any GEF activity for GBF1.

On the other hand, we have been able to show that expression of GBF1 phospho-mimetic mutants Y876E and Y898E induce tubules, in striking contrast to expression of GBF1 alone (Figure 5C-D and S5C-D). We also show that depletion of GBF1 completely abolishes the formation of tubules (Figure S3G-H).

Reviewer #1:

The revised version of the manuscript by Chia et al. is only a minimally altered version of the original submission. The main changes in the text are within the discussion and the authors are mainly to argue against the criticism raised by the reviewers.

I find the following points confusing:

1. The authors state that they don't think that it is a key point that Arf1-GTP is at the Golgi. They propose that it is the complex between GBF1 and Arf1-GDP that is relevant for tubule formation. I am not sure that the experimental evidence that is provided is convincingly showing this.

We understand the reviewer’s concerns and we have removed the model with GBF1-Arf-GDP. We have also removed most text from the discussion about the role of Arf1 and its nucleotide bound form. Instead, we focus on Src phosphorylation of GBF1. In particular, we added the results that GBF1 depletion completely abolishes tubules formation and that GBF1 phosphomimetic mutants induce their formation.

2. The authors argue that it is irrelevant to talk about COPI, because Arf1 could generate tubule itself. They cite a paper by Francesca Bottanelli. I would like to stress that the Botallei paper showed Arf1 tubules that are directed to the cell periphery and NOT retrograde transport to the ER. In addition, the Botanelli paper did not suggest that these are tubules generated with Arf1-GDP. Therefore, I find the argumentation used in the rebuttal a bit confusing.

We apologise for the confusion and the apparently poorly written previous rebuttal. We have also limited the discussion on COPI as most of our results are negative (e.g. no increase in COPI staining).

3. I think that the point that the complex of Arf1-GDP and GBF1 generates tubules should be demonstrated experimentally.

Please see above, answer to point 1.

4. The argument about the conservation of the tyrosine residue in yeast is confusing. Firstly, there is very little tyrosine phosphorylation in yeast. There are dual-specificity kinases in yeast that can perform tyrosine phosphorylation. However, there kinases are conserved in humans. So why do mammalian cells then use Src, and not the ancestral dual-specificity kinase. I find it confusing why the authors are insisting on keeping a piece of text that is so speculative and most likely wrong. Anyhow, this is just a minor point.

We acknowledge this concern and we have removed from the text the reference to GBF1 in yeast.

I think that the point that the complex of Arf1-GDP and GBF1 generates tubules should be demonstrated experimentally. Based on the new discussion and the rebuttal letter, I see that the authors themself consider this very important. I think this point deserves to be tested experimentally.

As discussed above, we have been able to show that phosphomimetic GBF1 does induce tubules, supporting the notion that phosphorylation of GBF1 by Src is what drives tubule formation. Whether it is a GBF1-Arf-GDP complex remains to be fully demonstrated and has been largely removed from the discussion.

Reviewer #2:

Signaling pathways modify intracellular membrane trafficking and protein modifications on different levels. In this study, the authors investigate the mechanism behind Src activation-induced relocalization of a subset of Golgi enzymes, GALNTs, from Golgi to ER. In response to Src activation, authors observe GALNT2-GFP in Golgi-derived tubular structures. They also observed temporal activation of small GTPase Arf1 and phosphorylation of Arf1 GTP exchange factor, GBF1. The authors propose the model in which phosphorylation of GBF1 by Src results in GBF1-Arf1 complexes that generate membrane tubules for traffic GALNTs from Golgi to ER.

In the revised submission, Chia et al. have fixed the many errors in the manuscript, which has indeed improved its presentation. They also provided two new experiments and significantly updated the Discussion section. At the same time, authors mostly responded to our and other critiques not by performing requested experiments/controls but by referencing their own previously published work and by modifying the text. We believe that this kind of response is not adequate.

My main concerns are as follows:

1. As I have stated in the first round of review, to quantify Src-dependent Golgi-ER relocalization of Golgi enzymes, it is essential to provide reproducible, high-quality images quantify colocalization of HPL signal with ER and Golgi markers. The ratio of ER to Golgi signal is the most important parameter here. The work should be reproducible, and therefore mere references to previously published work are not sufficient. The model system (HeLa cells with inducible Src) is not adequately characterized in terms of relocalization of GALNTs from Golgi to ER. Specifically, images presented in Figure 1B and, even more strikingly, in Supplementary Figure 1C, H are not supporting the notion that ER/Golgi ratio of HPL signal (i.e. relocalization of GALNTs) has been changed significantly. Without proper verification that retrograde trafficking of Golgi enzymes is increased in a Src/GBF1-dependent manner, the title of the manuscript is not supported by the data since the direction of movement of GALNT-GFP-positive tubular structures is unknown.

We apologise for not addressing fully these concerns in the previous round of revision as we had not fully appreciated the concern raised. We understand the reviewer makes reference to the fact that both ER and Golgi Tn staining increases over time after Src stimulation. We have often observed this phenomenon before. The interpretation is that after neo-synthesised proteins are Tn-glycosylated in the ER, they traffic to the Golgi, thus raising the levels of Tn in this organelle as well. (Our unpublished data indicate that over 100 cell-surface proteins are hyper-glycosylated after relocation; we have published the data for MMP14, a well-described cell surface protease.) The ER relocation results in an amplification of total Tn staining in the cell, not just in the ER but also in ERGIC and Golgi. In other words, the “ER/Golgi ratio of HPL signal” is not actually reflecting the degree of relocalisation of GALNTs. As you could see clearly in Figure 1B, we show that VVL staining in the ER increases over time; it is a clear indication that GALNTs have relocated. In addition, we complement this result with the glycosylation of ER resident proteins in Figure 1D.

2. Endogenous Golgi cargo has not been detected in Golgi-derived tubules, suggesting that tubule formation could be an artifact of protein overexpression. Authors' arguments that "tubules are transient in nature… it makes it harder to observe…chemical fixation significantly disrupts tubule integrity" are valid in general, but not at the level of eLife quality paper. Moreover, for the majority of tubule imaging in the manuscript (Figures 1G, 2C, S1K, S2A), the authors successfully used chemical fixation to demonstrate the association of overexpressed proteins with tubular structures. If necessary, consider live cell microscopy.

We thank the reviewer for the suggestion. However, we have attempted to stain endogenous GALNT with antibodies but the immunofluorescence staining with the antibodies we have is inherently weak. Together with the transient nature of tubules (i.e. the cells must be emitting tubules at the time of fixation) and the disruptive nature of chemical fixation, we are unable to clearly observe tubules with endogenous GALNT. The reviewer has suggested live cell microscopy to demonstrate the tubules. In this version of the manuscript, we present more evidence using live microscopy to demonstrate the formation of GALNT2 tubules with the GBF1-YE mutant. Altogether, we have demonstrated tubules in various settings i.e. Src-induced and GBF1-YE mutant induced, using the GALNT2-GFP stable cell line.

3. Authors clearly shown that Src phosphorylates GBF1, and they identified target phosphorylation sites on GBF1. Authors are suggesting that upon Src activation, GBF1 binds to Arf1-GDP, and this complex stimulates the formation of GALNT carrying tubules. However, I still have a hard time aligning this hypothesis with the data presented in the manuscript. During the burst of Arf-GTP, one would assume that k-on exceeds k-off resulting in Arf-GTP levels peaking and Afr-GTP exceeding GBF1-Arf-GDP. However, starting from 10 min following Src activation, the GALNT tubules emanating from the Golgi are significantly increased. This would indicate that tubule formation is not really driven by GBF1-Arf-GDP because it peaks at 20-30 min, when GBF1-Afr-GDP would be at its lowest. In S2B they show that Arf-GTP levels are lower than the controls. In S5AandB, Afr-GTP level as low as the control condition. Authors conclude that constitutively active SrcEG has the same effect on Arf-GTP levels as phosphor-mimetic GBF1 resulting in low levels of Afr-GTP. One can imagine a hypothetical scenario where the entire pool of GBF1 is engaged with Arf-GDP. But, SrcEG cells do have increased HPL staining in the ER and Golgi which, as the authors claim, is due to GALNTs transported to the ER in GBF1-Arf dependent tubules. This would indicate that the transport of GALNTs to the Golgi is independent of Arf-GTP, which is at odds with the kinetics of tubule formation and Arf-GTP levels in Figure 2.

We agree that the interpretation of the kinetics and the levels of Arf-GTP is complicated. As mentioned above, we have markedly reduced the place of the hypothesis of GBF1-Arf-GDP and removed it from the model. A full dissection of the mechanisms at play and the role of the Arf-GTP will require further study.

4. As suggested by other reviewers, to validate the model that Src-dependent phosphorylation of GBF1 is causing relocalization of Golgi enzymes, it will be essential to show that inducible expression of GBF1 phospho-mimetic mutants Y876E and Y898E would drive Golgi to ER localization of GALNTs in the absence of Src activation.

As discussed above, this has been done and while it took some optimising (relatively short expression time), we did observe significant tubule formation after GBF1 phosphomimetic expression (Figure 5C).

Reviewer #3:

The authors model is now more clear, but still not convincing. They are proposing that GBF1-Arf1-GDP complexes are tubulating membranes. There is no precedent for such an activity and other plausible explanations have not been ruled out. As stated in the previous review, an alternative explanation is that their observations are similar to those observed under BFA treatment. The Hsu and Luini groups explored one possibility for why BFA induces Golgi tubulation: (https://pubmed.ncbi.nlm.nih.gov/21725317)

The authors model and cartoon for the GEF reaction in Figure 7A is too simplistic, as the step they label with "kcat" actually represents more than one step: first GDP must dissociate before GTP can dissociate. This is absolutely essential as GDP and GTP occupy the same binding site. Also, the use of "kcat" generally refers to the rate-limiting step, and this is exactly the point I am making – an increase in kon (which appears to be the consequence of phosphorylation) is irrelevant to the overall reaction rate constant if kon is not the rate-limiting step. The step labeled "kcat" could very well be rate-limiting (and at the very least there is no reason to conclude that it is not rate-limiting, which is what the authors appear to be claiming). Therefore, my original concern still stands: their data are most consistent with phospho-GBF1 forming a stable complex with Arf1-GDP, which will reduce, rather than enhance the kinetics of exchange.

I also note that in Figure 7, the authors have incorrectly used upper case 'K's, which are used for equilibrium constants, rather than lower case 'k's, which should be used for the rate constants that they are referring to. Furthermore, by convention kcat is used to refer to the overall rate constant of the reaction.

The authors claim in the rebuttal letter that the "kcat" step is unlikely to be rate-limiting because this is the case for "most enzymes in metabolic pathways acting on small molecules" is both unfounded and probably irrelevant to an exchange factor.

The authors claim that the Antonny, Chabre, and Cherfils paper supports their model but I strongly disagree. Yes, the mutant they used blocks exchange, and also stabilizes binding to Arf-GDP. The authors appear to be ignoring the fact that GDP must dissociate before GTP can bind. Strong binding to Arf-GDP will slow GDP dissociation, and therefore also slow the rate of exchange. The authors' strong language on these points does not make their logic any more correct.

The authors are twisting themselves in knots by explaining that their in vitro binding assay does not include GTP, rather than performing an actual exchange assay in which GTP is included. Rather than trying to argue with reviewers, they could simply perform an actual nucleotide exchange experiment to see whether phosphorylated GBF1 is a better GEF or not. Based on their proposed model for how tyrosine-phosphorylation within the Sec7-domain enhances GEF activity, this should be straightforward to perform using the Sec7-domain of GBF1, rather than the full-length protein which the authors note is difficult to purify.

Finally, from my perspective, I still don't understand why on the one hand, the authors are arguing that phosphorylation makes GBF1 a better GEF, yet on the other hand, the authors' model invokes a functional role for a stable GBF1-Arf1-GDP complex. Neither of these two possibilities is fully supported by the data.

We thank the reviewer for this extensive discussion. As mentioned above, we really appreciate the time and effort required to examine our arguments and we apologise if the “strong” language might have given another impression. Unfortunately, we have not been able to perform all the experiments suggested by the reviewer, in particular the purification of a Sec7 domain of GBF1 and usage in a GEF assay. As shown in Author response image 2, we have purified GBF1 and set-up a GEF assay. Unfortunately, as shown in Author response image 3, tested a GEF assay; unfortunately, we have been unable to obtain a specific GEF signal. It is not clear at present why.

Author response image 2. Measuring purified GBF1 GEF activity using fluorescent Mant-GDP.

Author response image 2.

(A) Purification of full length GST-GBF1 and phosphorylated GST-GBF1 (”GST-GBF1+SrcEG”) from Expi293T cells (See arrow for 206kDa protein). Cells were allowed to express the protein for 2 days before harvesting for purification. Gluthathione agarose beads was used to purify GST-GBF1 before 3 washes, followed by elution with 10mM Gluthaione in wash buffer. Full length GBF1 protein was eluted in eluate 1 and 2 with little or no contaminants. The protein was further washed and concentrated in an Amicon ultra centrifuge filter. (B) Schematic of Mant-GDP loading on Arf1-E17 protein as described in Kanie T. et al., 2018, Guanine Nucleotide Exchange Assay Using Fluorescent MANT-GDP. Bio Protoc. 2018 Apr 5; 8(7): e2795. (C) Loading efficiency of Mant-GDP on Arf1-E17 was ~99% efficient. The fluoescence levels of loaded Arf1 was calculated against a standard curve of free Mant-GDP fluoresence. (D) Schematic of Mant-GDP GEF activity assay as described in Kanie T. et al., 2018.

Author response image 3. Measuring purified GBF1 GEF activity using fluorescent Mant-GDP.

Author response image 3.

(A) Arf1-Mant-GDP GEF assay with purified wildtype GBF1. The rate of Mant-GDP exchange i.e. fluorescence decline of Arf1-Mant-GDP in presence of GBF1 or in control with non-hydrolyzable GTP analog GppNHp (”+GppNHp”) were similar. (B) Arf1-Mant-GDP GEF assay in presence of purified Golgi membranes. Golgi membranes were purified from HEK293FT cells using the Minute Golgi Apparatus Enrichment Kit (Invent Biotechnologies inc). There was no difference in the rate of Mant-GDP exchange between wells containing control non-hydrolyzable GTP analog GppNHp (”+GppNHp”) buffer and purified GBF1. There is miminal difference in GDP exchange between GBF1 and phospho-GBF1. The results altogether indicate the lack of functional GEF activity in the purified GBF1 protein.

However, we have been able to show that in the absence of GBF1, there is no increase in Arf-GTP, strongly suggesting that GBF1 is the GEF responsible (Figure 3C).

Regarding our model, we fully agree of course that GDP must disengage from Arf1 before GTP can bind. We are proposing that GBF1 binding to Arf-GDP must precede the nucleotide exchange reaction. We argue that this binding step can be rate limiting for the whole reaction. Supporting this idea is the over-expression of GFB1 (wt) resulting in more Arf-GTP (Figure 3A). A simple interpretation is that increasing GBF1 amounts favors complex formation. Another way to increase the rate of complex formation would be to favor a conformation of GBF1 that binds better to Arf1-GDP. This would not prevent the intramolecular rearrangements that “kick” GDP out of Arf1. We agree with the reviewer that this model does not necessarily predict a more “stable” GBF1-Arf1-GDP and we have removed this notion from the text.

[Editors' note: further revisions were suggested prior to acceptance, as described below.]

The manuscript has been improved but there are some remaining issues that need to be addressed, as outlined here.

The reviewers felt that although SrcKM is supposed to be dominant negative, it is difficult to account for the effects of endogenous Src and other family members. To show that the phosphomimetic mutant of GBF1 is sufficient to induce tubule formation, the reviewers felt that the experiment should be carried out in Src-deficient cells, i.e. with pharmacological or genetic interference and not with a dominant negative approach. Reviewer 2 agreed that you would know best how to do that, as long as you can demonstrate that Src is not active under whatever treatment they use.

To improve the readability, we have re-written the parts of the paper concerning these mutants and organised them in two independent parts. We have also moved the panel with the effect of phosphomimetic GBF1 mutant on GALNT relocation into the main figure 5. It should now be clearer that GBF1 phosphomimetic effect is independent of any Src stimulation. Please see subsection “Phosphorylation at Y876 and Y898 is required for Src-induced Arf1-GTP levels and GALNT relocation” and “A Phosphomimetic mutant at Y876 and Y898 recapitulates GALNT tubule formation”.

Associated Data

    This section collects any data citations, data availability statements, or supplementary materials included in this article.

    Supplementary Materials

    Transparent reporting form
    Source data 1. Original full raw unedited gels or blots in all figures and figure supplements.

    The red boxes indicate the regions of the blot presented in the figures of the article.

    elife-68678-supp1.pdf (5.8MB, pdf)
    Source data 2. Raw quantification data and statistical tests performed in all figures and figure supplements.
    elife-68678-supp2.xlsx (51.7KB, xlsx)

    Data Availability Statement

    Source data of western blots and all quantifications have been provided for all figures.


    Articles from eLife are provided here courtesy of eLife Sciences Publications, Ltd

    RESOURCES