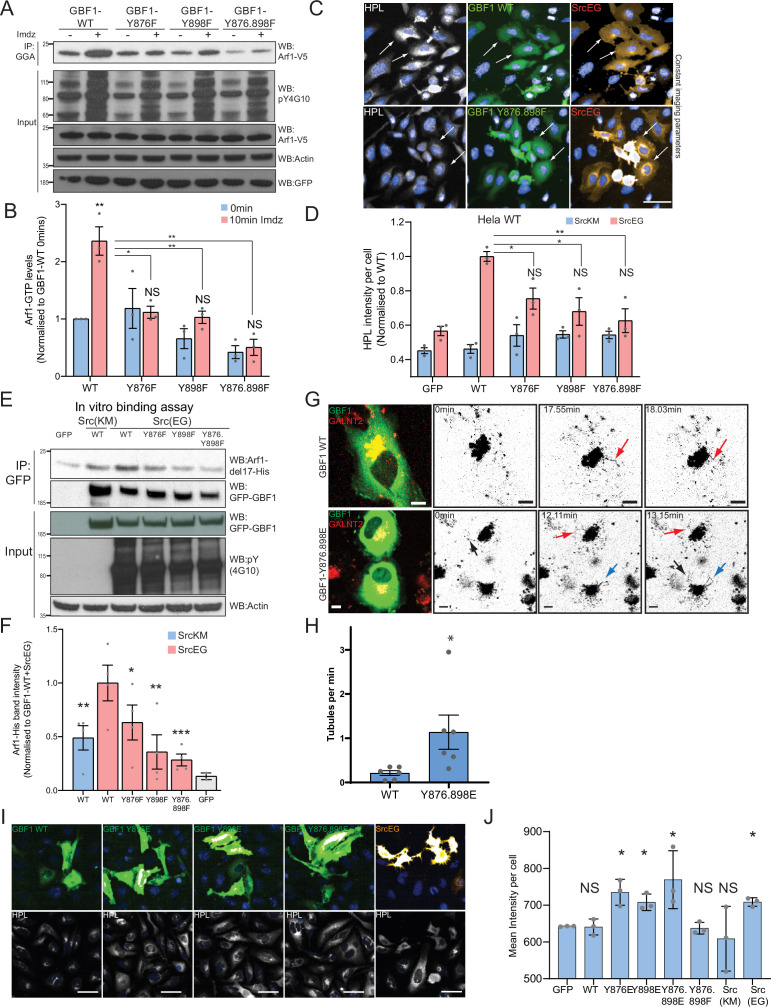
Figure 5. Phosphorylation at Y876 and Y898 regulates GEF activity of GBF1.
(A) SDS-PAGE analysis of GTP-loaded Arf1 at 0 min (-) and 10 min (+) imidazole treatment in HEK-IS cells expressing wild-type GBF1 and phospho-defective mutants GBF1-Y876F, GBF1-Y898F, or GBF1-Y876.898F. (B) Quantification of Arf1-GTP loading levels in (A) from three independent experiments. Values were normalized to untreated cells (-) expressing wild-type GBF1. (C) Representative images of Helix pomatia lectin (HPL) staining in HeLa cells coexpressing wild-type GBF1 or GBF1-Y876.898F mutant with active SrcEG. Scale bar: 50 μm. (D) Quantification of HPL staining levels of cells coexpressing wild-type or mutant GBF1 with inactive SrcKM (blue bars) or active SrcEG (pink bars). Values were from three replicates. (E) SDS-PAGE analysis of the levels of recombinant Arf1-His bound to wild-type or phospho-defective GBF1 mutants immunoprecipitated (IP) from cells expressing inactive SrcKM or active SrcEG in an in vitro binding assay. (F) Quantification of the levels of bound Arf1-His. Values were from four experimental replicates and normalized to wild-type GBF1 IP from cells expressing active SrcEG from each experiment. IP’ed GFP protein used as a negative control for nonspecific binding with GFP (gray bar). (G) Still images from time-lapse imaging of GALNT2-mCherry in HeLa cells that were either transfected with wild-type GBF1 (GBF1 WT) or phosphomimetic mutant (GBF1 Y876.898E). Arrows indicate tubule formation. Scale bar: 5 μm. (H) Quantification of the number of tubules per minute of acquisition. (I) Representative images of HPL staining in HeLa cells expressing phosphomimetic (Y-to-E) mutants 4 hr post transfection. (J) Quantification of HPL staining levels in (I). Values on graphs indicate the mean ± SD. Statistical significance (p) was measured by two-tailed paired t-test. *p<0.05, **p<0.01, ***p<0.001 relative to untreated cells or to 10 min imidazole (imdz)-treated cells expressing wild-type GBF1. NS, nonsignificant.


