

This systematic review reports the preintervention and postintervention changes in suicide rates using restricted methods, such as pesticides, domestic gas, motor vehicle exhaust, and pharmaceuticals, among individuals in 26 countries.
Key Points
Question
What is the association between means restriction of poison and population-level suicide rates?
Findings
In this systematic review of 62 studies from 26 countries, means restriction of poison was associated with reductions in method-specific suicide rates without an equivalent shift toward other methods. Means restriction was most promising when the poison was lethal and common, and decreases in suicides by the restricted poison were not associated with increases in suicide by other available methods.
Meaning
The findings suggest that restricting access to poisons was associated with decreases in suicide by poisoning. Changes in other methods of suicide were associated with historical trends rather than reduced availability of the poison.
Abstract
Importance
Suicide is a major and preventable cause of death worldwide. Means restriction aims to reduce the rate of completed suicides by limiting public access to lethal suicide methods. Means restriction of agents used in poisoning is more controversial because there is potential to switch to other lethal methods.
Objective
To identify the changes in suicide rate by the targeted poison and the corresponding changes in suicide by other methods.
Evidence Review
Five databases (MEDLINE, Embase, Scopus, PsycInfo, and Web of Science) were searched for studies on national means restriction of poison that were published in the English language from inception until December 31, 2019. Of the 7657 articles that were screened by title and abstract, 62 studies were included in the analysis.
Findings
Sixty-two studies from 26 countries in Europe, the US, Australia, Asia, and the United Kingdom were included in the review. The studies included restrictions on pesticides (15 countries), domestic gas (14 countries), motor vehicle exhaust (9 countries), and pharmaceuticals (8 countries). The median (IQR) change in method-specific suicide rates was −1.18 (−2.03 to −0.46) per 100 000 people after restrictions, whereas the median (IQR) change in other methods of suicide (not the restricted poison) was −0.09 (−2.22 to 1.65) per 100 000 people. Decreases in suicide by the restricted poison were not associated with increases in suicide by other methods. An estimated 57 355 poison-specific suicides annually (before the interventions were implemented) may have benefited the most from means restriction.
Conclusions and Relevance
This systematic review found that means restriction of poison was associated with decreased method-specific suicide rates without an equivalent shift toward the use of other methods. Suicide prevention strategies need to address both individuals who are at risk and population-level policies.
Introduction
Suicide prevention is an urgent health priority worldwide, and 77% of suicides occur in low- and middle-income countries.1 Suicide is a leading cause of years of life lost in many countries, especially in adolescents and young adults.2 In addition, suicide has consequences for the person’s community, such as bereavement, stigma, and contagion.3,4
Although medical, psychosocial, and pharmacological treatments contribute to suicide prevention on an individual level, they are not accessed by everybody who is at risk for suicide. Population-level suicide prevention strategies protect people in a crisis, regardless of whether they seek medical or psychological help for their suicidal thoughts or behavior3; examples include media guidelines and means restriction.5
Restricting access to lethal and common means (means restriction) can lower the likelihood of a suicide attempt, delay a suicide attempt, or lead to use of a less lethal method of attempting suicide.6 Any of these outcomes are associated with a better chance of survival and rehabilitation given that many suicide attempts are impulsive, and people are often discouraged if their preferred method is not readily available.6
Means restrictions, such as bridge barriers and gun control laws, are associated with a reduced number of suicides by jumping and by firearms, respectively.7,8,9 Pesticides are responsible for up to 20% of global suicides, especially in low- and middle-income countries.10,11 Pesticide restrictions are also associated with decreased suicide rates, especially when the targeted pesticides were hazardous or frequently used.10 Suicide attempts by other poisons and medicines are common, but these means have not been evaluated as extensively.11
Although means restriction is usually associated with reduced incidence of method-specific suicide rates, a subsequent shift toward other methods of suicide is a possible outcome. This shift is known as method substitution or displacement and is often debated by epidemiologists and suicide prevention experts when considering the overall benefit of means restriction.3,12,13 Population-level suicide is inherently dynamic and affected by multiple factors, and changes in other methods of suicide may be coincidental or driven by changes in means restriction.
In this study, we aimed to assess population-level means restriction policies for poisons. Specifically, the goal was to identify changes in suicide rate by the targeted poison and, if available, the corresponding changes in suicide by other methods. We tested whether an increased incidence of other methods (method substitution) was consistently observed in these studies and whether it was associated with the change in suicide by the targeted poison.
Methods
This study is registered with PROSPERO (CRD42020160734). Articles were extracted and screened for relevance according to the Preferred Reporting Items for Systematic Reviews and Meta-analyses (PRISMA) reporting guideline.14
Search Strategy and Inclusion Criteria
We conducted a systematic review of international evidence to assess the association between means restriction and suicide by poisoning. We searched key words and/or Medical Subject Headings in 5 databases: MEDLINE, Embase, PsycInfo, Scopus, and Web of Science. The search strategy combined 3 concepts: suicide, poison, and restriction (eMethods 1 in the Supplement). Poison included terms such as overdose, medicine, and domestic chemicals. Restriction included terms such as intervention, policy, access, and scheduling. We retrieved all studies that were published in the English language from inception until December 31, 2019.
We excluded studies that were retrieved from gray literature, which we defined as literature searches that were not replicable (eg, Google Scholar) and works that were not published in a peer-reviewed, academic journal (eg, government reports). Literature reviews were also excluded; however, we read relevant reviews to check for additional studies. We searched for additional studies by citation chaining (assessing the references of relevant papers) and checking publications by prominent authors in the field of means restriction.
We selected longitudinal studies that measured changes in suicide rate while means restriction was implemented. The inclusion criteria were national interventions at the country level, and the outcomes were suicide rates reported in the country or a smaller, representative region.
Studies that discussed means restriction but did not report changes in suicide rates or that reported trends in suicide rates without a relevant intervention were excluded. We also excluded interventions that were conducted at a community or regional level, such as interventions limited to 1 province or city.
Study Selection, Data Extraction, and Quality Assessment
Studies were exported into EndNote (Clarivate) and deduplicated. Unique articles were exported into Covidence (Veritas Health Innovation). Two of us (J.S.L. and R.C.) independently performed title and abstract screening. An article was reviewed for relevance in full text if a decision could not be readily made from the title and abstract alone. Conflicts were discussed with a third author (N.A.B.), who helped us reach consensus.
Two of us (J.S.L. and R.C.) also independently extracted data. Data extracted included study location, study design, years reported, years of intervention, details of intervention, and suicide rates by the poison of interest. We extracted data, when available, on overall suicide rates (suicide by any method) and suicide by other methods (not by the targeted poison). The double data extraction was checked for consistency, and a meeting was held to resolve any conflicts.
The main findings from each article are presented in a narrative synthesis (Table).15,16,17,18,19,20,21,22,23,24,25,26,27,28,29,30,31,32,33,34,35,36,37,38,39,40,41,42,43,44,45,46,47,48,49,50,51,52,53,54,55,56,57,58,59,60,61,62,63,64,65,66,67,68,69,70,71,72,73,74,75,76 We assessed each study for quality and bias using the Risk Of Bias In Nonrandomized Studies of Interventions (ROBINS-I) tool for uncontrolled before and after studies (eTable 1 in the Supplement).77
Table. Study Location, Intervention, and Changes in Method-Specific Suicide Rates, Overall Suicide Rates, and Other Suicide Methodsa.
| Location | Year and intervention details | Change in suicide by poison of interest (reported until the end of the study period) | Change in overall suicide and suicide by other methods (reported until the end of the study period) | IRR (95% CI) | Economic and social factors, if reported in the study |
|---|---|---|---|---|---|
| Pesticides in high-income countries | |||||
| England, Wales, and Scotland15 | 1972: Occupational license required to purchase concentrated paraquat | Increasing trend in paraquat suicides: 5-10 cases in 1971; 30 cases in 1977 | Not reported | Not suitable for calculation | Not reported |
| Ireland16 |
|
Suggested increasing trend in paraquat suicides: 7 cases in 1974; 13 cases in 1976 | Not reported | Not suitable for calculation | Not reported |
| Germany17 | 1984 (Inferred): withdrawal of chlorinated hydrocarbons | Pesticide suicides almost eliminated: 6.4 per million in 1983; 0.5 per million in 2010 | Overall suicide rate decreased: 23.6/100 000 in 1983; 12.3/100 000 in 2010. Other methods also decreased. |
|
Reunification in 1990 |
| Finland18 | 1960: Occupational license required for parathion | Parathion suicides decreased: 1.71/100 000 in 1959; 0.32/100 000 in 1973 | No change in overall suicide from 1959 to 1965, and then an increase: 20.6/100 000 in 1959; 24.5/100 000 in 1973 |
|
Not reported |
| Crete (Greece)19 | 2003: Withdrawal of organophosphates (parathion; monocrotophos) | No change in pesticide suicides: 1.4/100 000 in 2002; 1.2/100 000 in 2007 | No change in overall suicide: 37 cases in 2002; 37 in 2007 |
|
Not reported |
| Marseille (France) and overseas territories20 | 2007: Paraquat ban | 9 Paraquat suicides in 2003-2007; 6 paraquat suicides in 2007-2011 | Not reported | Not suitable for calculation | Also included some overseas territories, which may be less resourced |
| South Korea21,22,23,24,25,26 |
|
49% Decrease in pesticide suicides: 5.26/100 000 in 2011; 2.67/100 000 in 201321 | 13% Decrease in overall suicide: 34.9/100 000 in 2011; 30.26/100 000 in 2013.21 Suicide by carbon monoxide and medicines increased; suicide by hanging decreased.21,25 | Suicides increased after financial crisis in 200825; decreasing or stable trends in rates of divorce, unemployment, and alcohol use21 | |
| Taiwan12,27,28 | 1980s-1990s: 36 Pesticide formulations were banned, most of which were organophosphates and carbamates | 67% Decrease in pesticide suicides: 7.7/100 000 in 1987; 2.5/100 000 in 201027 | Decrease in overall suicide from 1983 to 1993, and then an increase: 18.8/100 000 in 1987; 21.3/100 000 in 201027 | Not suitable for calculation | Economic changes and increased unemployment in 1990s28 |
| Pesticides in low- and middle-income countries | |||||
| Hungary29 | Unspecified: “decreased access to highly toxic pesticides” | Decreasing trend in pesticide suicides: 312 cases in 1990; 75 cases in 2001 | 27% Decrease in overall suicide: 39.8/100 000 in 1990; 29.2/100 000 in 2001. Other suicide methods also decreased. | Not suitable for calculation | Upper-middle income country |
| Inner Mongolia (China)30 |
|
49% Decrease in pesticide suicides: 3.45/100 000 in 2008-2011; 1.75/100 000 in 2012-2015 | 33% Decrease in overall suicide: 7.2/100 000 in 2008-2011; 4.8/100 000 in 2012-2015 |
|
Upper-middle income country; social policies to alleviate poverty and fund public services |
| Sri Lanka31,32,33 |
|
55% Decrease in pesticide suicides: 10.1/100 000 in 1996; 4.5/100 000 in 2009.32 Poisoning suicides also decreased.31 | 56% Decrease in overall suicide: 52.85/100 000 in 1995; 23.5/100 000 in 2005.31 Slight increase in suicides by hanging.31 | Not suitable for calculation (rates for pesticide suicide only available for 1996 and 2009) | Secular trends in unemployment, alcohol misuse, divorce, and civil war unlikely to be associated with suicide trends31,33 |
| Sri Lanka34 |
|
51% Decrease in pesticide suicides: 8.5/100 000 in 2011; 4.2/100 000 in 2015 | 21% Decrease in overall suicide: 18.3/100 000 in 2011; 14.3/100 000 in 2015 |
|
Secular trends in unemployment, alcohol misuse, divorce, and civil war unlikely to be associated with suicide trends34 |
| India35 | Unspecified: some WHO class 1 pesticides banned, including aldicarb and calcium cyanide | 48% Decrease in pesticide suicides: 2.2/100 000 in 2001; 1.15/100 000 in 2014 | Overall suicide rate not reported but likely to be unchanged or increasing as suicide by hanging increased rapidly | Not suitable for calculation (no intervention date) | Method of suicide varied in areas by level of economic development |
| Bangladesh36 | 2000: Some WHO class 1 pesticides banned, including organophosphates | 65% Decrease in pesticide suicide: 6.3/100 000 in 1996; 2.2/100 000 in 2014 | 25% Decline in “overall unnatural deaths” from 1996-2014; no statistics provided for overall suicide; slight increase in suicide by hanging | Pesticide: 0.69 (0.66-0.71); other methods could not be calculated. | No significant change in unemployment, alcohol misuse, or divorce |
| Domestic gas in high-income countries | |||||
| England and Wales37,38,39,40,41 | 1958: Domestic gas detoxification | 85% Decrease in domestic gas suicides: 10.4/100,000 in 1962-1963; 1.75/100 000 in 1970-197137 | 33% Decrease in overall suicide: 24.15/100 000 in 1962-1963; 16.15/100 000 in 1970-197137; some increase in overdose suicides39 | Some increase in unemployment; was difficult to determine its effect38 | |
| Birmingham (England)42 | 1960s: Domestic gas detoxification | Decrease in domestic gas suicide: 87 cases in 1962; 12 cases in 1970 | Decrease in overall suicide: 144 cases in 1963; 64 cases in 1970 | Not suitable for calculation (no intervention date) | Not reported |
| Scotland40,43 | 1963: Domestic gas detoxification | 95% Decrease in domestic gas suicide: 4.21/100 000 in 1962; 0.21/100 000 in 1975 | 10% Decrease in overall suicides: 9.10/100 000 in 1962; 8.16/100 000 in 1975 | Not reported | |
| Northern Ireland44 | 1964: Domestic gas detoxification | Domestic gas suicides almost eliminated: 2.06/100 000 in 1964; 0/100 000 in 1988 | Decrease in overall suicide from 1964 to 1973 and then an increase: 5.42/100 000 in 1964; 9.69/100 000 in 1988 |
|
Brief mention of civil disorders |
| Netherlands40 | 1963: Domestic gas detoxification | Domestic gas suicides almost eliminated: 14.0/million in 1962; 0.4/million in 1973 | 31% Increase in overall suicide: 65.63/million in 1962; 86.22/million in 1973 |
|
Not reported |
| Minors (19 y or younger) in Vienna (Austria)45 | 1965: Domestic gas detoxification | Decrease in domestic gas suicides: 92 cases in 1956-1965; none after 1975 | Decreasing trend in overall suicide: 8.4/100 000 in 1953-1962; 3.7/100 000 in 1993-2002 |
|
Not reported |
| West Germany46 | 1963: Domestic gas detoxification | 97% Decrease in domestic gas suicides: 1963-1976 (2.24 to 0.07/100 000) | 12% Increase in overall suicide: 19.4/100 000 in 1963; 21.7/100 000 in 1976; decreasing trend from 1978 to 1989 |
|
Not reported |
| Belgium47 | 1966: Domestic gas detoxification | 87% Decrease in domestic gas suicides: 0.7/100 000 in 1968-1972; 0.09/100 000 in 1978-1981 | 34% Increase in overall suicide: 15.75/100 000 in 1968-1972; 21.07/100 000 in 1978-1981 |
|
Not reported |
| Switzerland48 | 1955: Domestic gas detoxification | 52% Decrease in domestic gas suicides: 3.6/100 000 in 1954; 1.72/100 000 in 1965 | 18% Decrease in overall suicide: 22.61/100 000 in 1954; 18.56/100 000 in 1965 |
|
Not reported |
| Japan49 | Early 1970s: domestic gas detoxification | 42% Decrease in domestic gas suicides: 1.12/100 000 in 1969; 0.65/100 000 in 1982 | 20% Increase in overall suicide: 14.55/100 000 in 1969; 17.51/100 000 in 1982 |
|
Not reported |
| US50 | 1940s-1950s: Domestic gas detoxification | Domestic gas suicides almost eliminated: 0.73/100 000 in 1950; 0.02/100 000 in 1970 | Slight decrease in overall suicide from 1950 to 1960 and then an increase: 11.26/100 000 in 1950; 11.45/100 000 in 1970 |
|
Not reported |
| Australia51 | Early to mid-1960s: Domestic gas detoxification | 58% Decrease in domestic gas suicides: 1.33/100 000 in 1960; 0.55/100 000 in 1970 | 17% Increase in overall suicide: 10.03/100 000 in 1960; 11.7/100 000 in 1970; continued increasing in 1990 |
|
Not reported |
| Motor vehicle exhaust in high-income countries | |||||
| England and Wales41,52,53 | 1993: Catalytic converters | 58% Decrease in motor exhaust suicides: 2.54/100 000 in 1992; 1.06/100 000 in 199852 | 8% Decrease in overall suicide: 10.69/100 000 in 1992; 9.83/100 000 in 199852 | Not reported | |
| Scotland53,54 | 1993: Catalytic converters | 73% Decrease in motor exhaust suicides: 2.11/100 000 in 1992; 0.57/100 000 in 200354 | Overall suicide increases and then returns to same rate in 2003; some increase in hanging | Not reported | |
| Switzerland55 | 1986: Catalytic converters | 61% Decrease in motor exhaust suicides: 1.98/100 000 in 1985; 0.78/100 000 in 1995; continued decreasing in 2005 | 14% Decreasing trend in overall suicide: 23.75/100 000 in 1985; 20.35/100 000 in 1995; continued decreasing in 2005 |
|
Not reported |
| Japan56 | 1975: Motor emission standards to partially reduce carbon monoxide (still fatal at 4.5%) | 106% Increase in motor exhaust suicides: 0.6/100 000 in 1974; 1.24/100 000 in 1981 | No change in overall suicides: 17.5/100 000 in 1974; 17.28/100 000 in 1981 |
|
Not reported |
| US57 | 1968: Motor emission standards to partially reduce carbon monoxide | Motor exhaust suicides decreased in correlation with ownership rates of older cars | Not reported | Not suitable for calculation | Not reported |
| US58,59 | 1975: Catalytic converters | 70% Decrease in motor exhaust suicides from 1975 to 201059 | Not reported | Motor exhaust: 1.05 (could not be calculated as no case numbers were available)58 | Improved medical care for carbon monoxide exposure |
| Australia60 | 1986: Catalytic converters | Increase in motor exhaust suicides: 2.1/100 000 in 1985; 2.85/100 000 in 1995 | Not reported | Motor exhaust: 1.36 (1.18-1.56) | Not reported |
| Medicines in high-income countries | |||||
| England and Wales61,62,63 | 1998: Pack size limit of paracetamol and salicylates (32 tablets in pharmacies; 16 in other retail) | 43% Reduction in paracetamol suicides: 149 cases in 1997; 69 cases in 200962; salicylate deaths also decreased | Decreasing trend in overall suicide: 4830 cases in 1997; 4682 cases in 200962; deaths by other medicines and poison also decreased61 | Not reported | |
| England and Wales64,65 | 2005-2007: Phased withdrawal of paracetamol + dextropropoxyphene (co-proxamol) | 61% Reduction in paracetamol + dextropropoxyphene suicides from 1998-2004 to 2005-201065 | Some decrease in overall suicide but not statistically significant: 4883 cases in 2004; 4528 cases in 201065 | Recession in 2008 | |
| Scotland66 | 2005-2007: Phased withdrawal of paracetamol + dextropropoxyphene (co-proxamol) | Decrease in annual paracetamol + dextropropoxyphene deaths: 37 in 2000-2004; 10 in 2006 | Not reported; no change in suicide by other analgesics | Not suitable for calculation (unclear if the deaths were all suicides) | Not reported |
| Florida (US)67 | 2010: Withdrawal of propoxyphene | Decrease in propoxyphene suicides: 155 cases in 2008-2010; 22 cases in 2010-2012 | Not reported | Not suitable for calculation (unclear if propoxyphene was always the cause of death) | Not reported |
| Sweden68 | 1985: Withdrawal of barbiturates (except phenobarbitone for epilepsy) | 83% Decrease in barbiturate suicides: 1.15/100 000 in 1984; 0.2/100 000 in 1990 | 13% Decrease in overall suicide: 30.3/100 000 in 1969; 25.9/100 000 in 1992; some increase in suicide by analgesics and antidepressants |
|
Not reported |
| Japan69 | 1961: Upscheduled barbiturates from over-the-counter to prescription only | Sedative suicides almost eliminated: 5.6/100 000 in 1960; close to 0 in 1980 | Decrease in overall suicide from 1960-1966; overall suicide and other methods increased after 1970 |
|
Not reported |
| Australia70 | 1967: Pack size limit of barbiturates (from 50 tablets and 2 repeats to 25 tablets only) | 28% Decrease in drug-related suicides: 10.1/100 000 in 1966; 7.31/100 000 in 1970 | 18% Decrease in overall suicide: 15.19/100 000 in 1966; 12.38/100 000 in 1970 |
|
Not reported |
| Sweden71 | 2004: Pack size limit of caffeine tablets (from 250 tablets to 30 tablets) | 12 Suicides with caffeine as the cause of death from 1994-2000; 0 after 2007 | Not reported | NA | Not reported |
| Combined interventions | |||||
| Hradec Králové (Czech Republic)72 | 1970s: Catalytic converters 1990-1995: Domestic gas detoxification |
Annual carbon monoxide suicide cases decrease from 1970-1979 to 1990-1999 | Annual suicide cases decrease from 1970-1979 to 1990-1999 | Not suitable for calculation (was difficult to characterize carbon monoxide deaths) | Upper-middle income country; higher suicide risk for areas with lower socioeconomic profile |
| Denmark73,74 |
|
1985-2000: Domestic gas suicides almost eliminated; 64% decrease in motor exhaust suicides; 65% decrease in analgesic suicides; barbiturate suicides almost eliminated | 54% Decrease in overall suicide: 27.89/100 000 in 1985; 13.72/100 000 in 2000; multiple co-interventions at the same time likely contributed to reduced incidence of suicide by other methods |
|
High-income country |
| Brisbane (Australia)75 |
|
Carbon monoxide suicides and barbiturate overdoses declined after 1967 | 44% Decrease in overall suicide rate: 34.95/100 000 in 1966; 19.7/100 000 in 1973 | NA | High-income country |
Abbreviations: IRR, incidence rate ratio; NA, not applicable; WHO, World Health Organization.
IRRs (95% CIs) were calculated using the annual data at a set number of years (1 year before intervention, 5 years after intervention for pesticides and medicines, or 10 years after intervention for gases). The World Bank historical classification was used for the income level of each country at the time of intervention, if available. If unavailable, the classification in 1987 was the earliest possible reference.76
Statistical Analysis
We extracted data, when available, on suicide rates before and after a clearly defined intervention for a standardized before-and-after comparison. Because each study had different periods, we used annual data from 1 year before the intervention compared with 5 (for liquid or solid poison) or 10 (for gases) years after the intervention. Gases were evaluated after a longer time to account for regional differences and slow changes. Natural gas generally replaced coal gas sources within 10 years, whereas most older cars that predated legislative requirements would retire within 10 years in high-income countries.44,60
We used a preintervention time point 1 year before the intervention given that the suicide rate during the year of the intervention could be erratic depending on when and how the intervention was implemented. If data for these time points were unavailable, we used the closest years available. If multiple studies examined the same intervention, we used the study with the most detailed quantitative data.
Incidence rate ratio (IRR) was calculated as the incidence rate of suicides (usually number of suicides per 100 000 people) after the intervention divided by incidence rate before the intervention. The SE was calculated by adding the reciprocal of annual cases before and after the intervention, and CIs were calculated using loge (IRR) and SE (eMethods 2 in the Supplement). If the number of annual cases of suicide was not available, we retrieved data from global websites, such as the World Bank,78 for a population estimate to calculate CIs. We used ImageJ, version 1.53e (National Institutes of Health) to quantify any data that were presented in graphical form only. We calculated IRRs for suicide by the restricted poison and by other methods of suicide (any method that was not the restricted poison), and then we graphed IRRs on forest plots on a log scale to show the relative change in suicide rates before and after the intervention.
We combined the same incidence rate data to quantify the change in suicide rate per 100 000 people before and after the intervention. These data were graphed on a scatterplot with linear regression to examine the association between the change in suicide by targeted poison and the change in suicide by other methods. Evidence for method substitution would be shown if there was an inverse association (eg, a slope of −1 would indicate that decreases in suicide by the restricted poison was, on average, matched by an equal but opposite change in other methods of suicide). We also graphed a scatterplot with linear regression to examine changes in suicide by other methods over time based on the year of the intervention. In addition, we calculated the median change in suicide by the restricted poison and suicide by other methods.
We repeated all analyses with overall suicide rates instead of suicide by other methods (eFigures 4-9 in the Supplement). We did not conduct a meta-analysis because the studies were heterogeneous with different interventions, dates, and locations. All graphs and analyses were produced using GraphPad Prism, version 9.1 (GraphPad).
Results
The database searches retrieved 12 557 studies, of which 4916 were duplicates. Following the PRISMA guidelines, we performed title and abstract screening on 7657 studies, leading to the exclusion of 7566 studies. We reviewed 91 full-text articles, and 62 studies12,15,16,17,18,19,20,21,22,23,24,25,26,27,28,29,30,31,32,33,34,35,36,37,38,39,40,41,42,43,44,45,46,47,48,49,50,51,52,53,54,55,56,57,58,59,60,61,62,63,64,65,66,67,68,69,70,71,72,73,74,75 from 26 countries met the eligibility criteria for inclusion (eFigure 1 in the Supplement). Restricted substances included pesticides (15 countries), domestic gas (14 countries), motor vehicle exhaust (9 countries), and pharmaceuticals (8 countries). Different strategies to restrict access to poison included banning or withdrawing them from the market, reducing concentration, limiting the quantity sold, and allowing access for only a specific occupation or medical condition.
The studies investigated interventions in Europe, the US, Australia, and Asia, with multiple studies on all poison classes in the United Kingdom (eFigure 2 in the Supplement). We found no research from South America and Africa. Most studies were conducted in high-income countries,12,15,16,17,18,19,20,21,22,23,24,25,26,27,28,37,38,39,40,41,42,43,44,45,46,47,48,49,50,51,52,53,54,55,56,57,58,59,60,61,62,63,64,65,66,67,68,69,70,71,73,74,75 with only 9 studies on pesticide and gas restrictions in low- and middle-income countries.29,30,31,32,33,34,35,36,72
We evaluated each study using the ROBINS-I tool and found that most studies were prone to at least some low to medium risk of bias. Studies with limited trend analysis or limited preintervention data were at higher risk of confounding bias.15,16,17,19,20,26,29,42,44,46,47,53,66,71 These risks of bias are presented in a heat map (eTable 1 in the Supplement).
Pesticide Restrictions
A total of 23 studies reported pesticide interventions in 15 countries (Table).12,15,16,17,18,19,20,21,22,23,24,25,26,27,28,29,30,31,32,33,34,35,36 Occupational licensing for conditional access to pesticides generally occurred earlier (1960-1975) than complete bans (1984-2012). Specific pesticides and classes that were restricted included organophosphates, parathion, organochlorines, and paraquat.
The incidence of suicides by pesticide decreased in most studies (19 of 23).12,17,18,21,22,23,24,25,26,27,28,29,30,31,32,33,34,35,36 Seven interventions in 7 countries were suitable for IRR calculations, with 6 countries showing reduced incidence of suicides by pesticide (Figure 1).17,18,19,21,30,34,36 Five interventions were associated with decreases in suicides by pesticide were reported in Germany, Finland, South Korea, inner Mongolia, Sri Lanka, and Bangladesh, with IRRs ranging from 0.37 to 0.69.17,18,21,30,34 The IRRs for suicide by other methods suggested a decrease in other methods in Germany (0.79; 95% CI, 0.78-0.81) and South Korea (0.93; 95% CI, 0.91-0.95). Suicide by other methods did not change in Finland, Crete (Greece), Inner Mongolia, and Sri Lanka.17,18,19,21,30,34 Suicide by other methods was not reported in Bangladesh, but there was a “25% decline in unnatural deaths.”36(pp175,178)
Figure 1. Forest Plots for Changes in Suicide by Pesticide and Suicide by Other Methods.
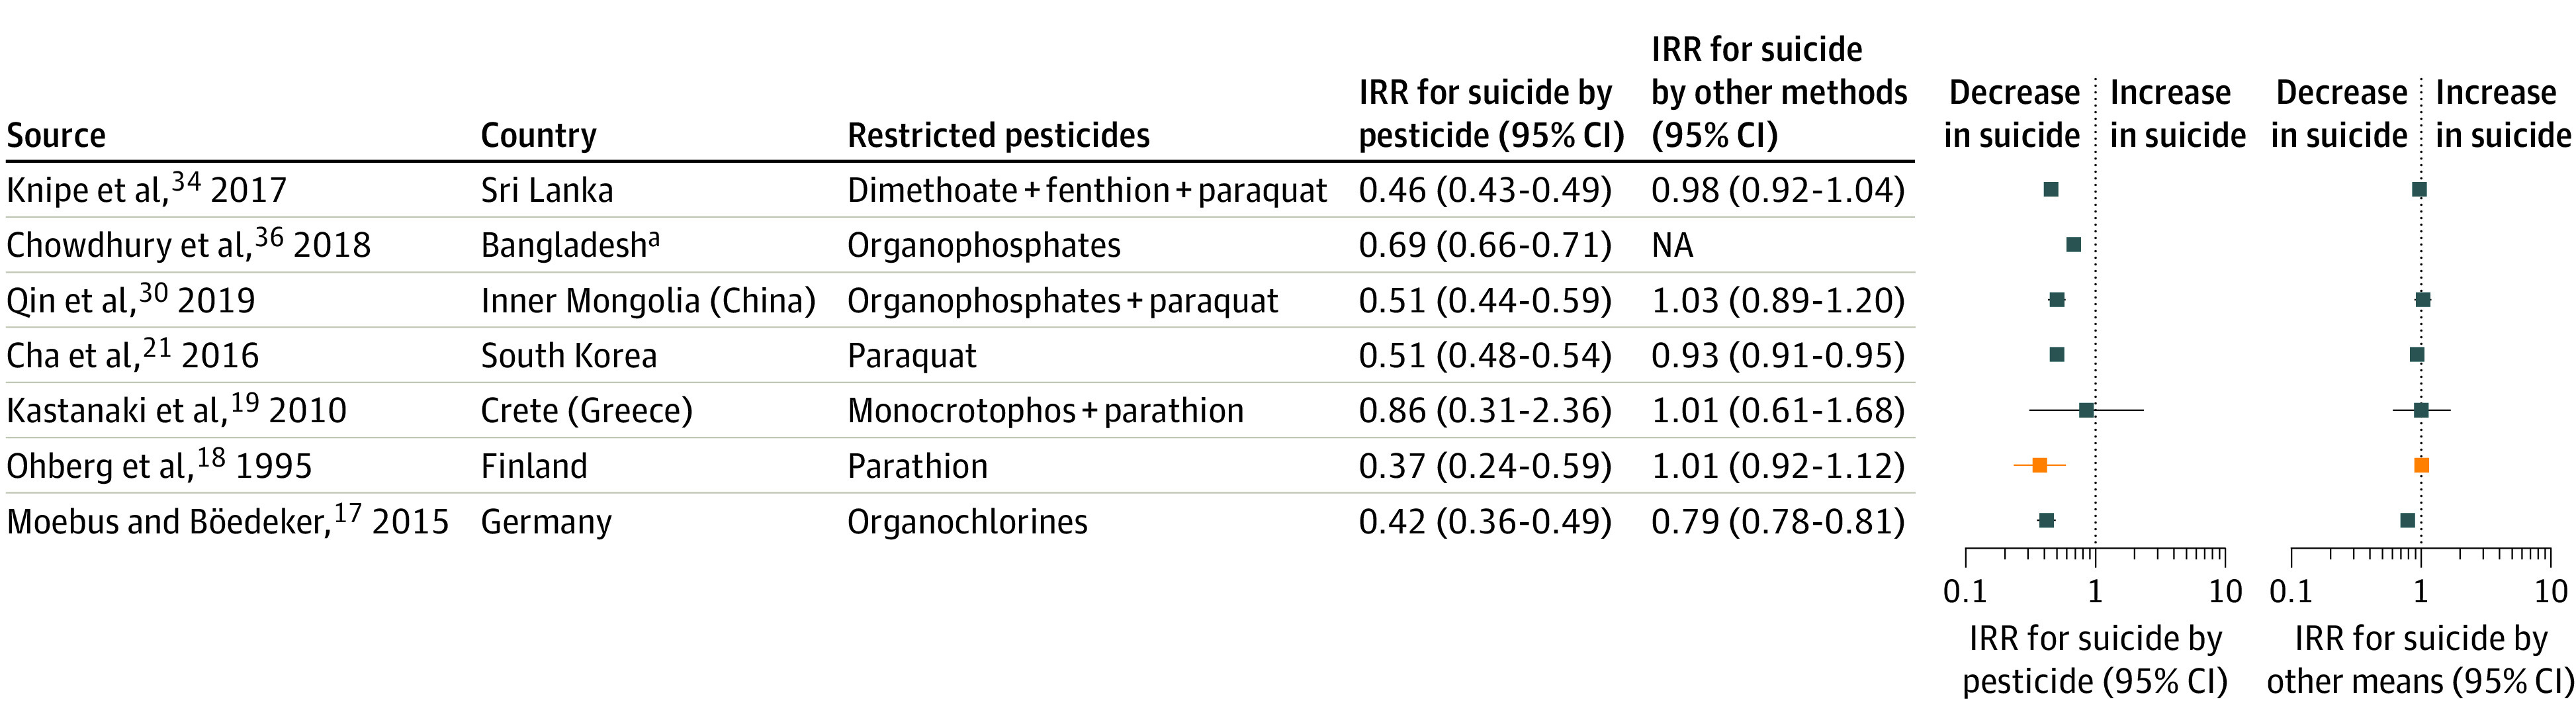
Blue squares indicate ban of pesticide; NA, not applicable; orange squares, occupational license.
aData on overall suicide or other methods of suicide were not available.
In Sri Lanka, earlier pesticide bans from 1984 to 1998 included parathion and endosulfan. The bans were associated with a decrease in suicides by poisoning, with 35 of 100 000 suicides in 1984 and 20 of 100 000 suicides in 2000.31,33,34 In Taiwan, various pesticide formulations were banned from 1980. Suicides by pesticide decreased by 67% from 1987 to 2010, whereas the overall suicide rate and suicide by other methods gradually increased after 1993.12,27,28
Other studies included occupational licensing for paraquat in Ireland and the United Kingdom (England, Wales, and Scotland), and a paraquat ban in Marseille, France.15,16,20 The sample sizes in these studies were too small to enable us to calculate changes before and after the intervention. Studies in India and Hungary did not specify the date of pesticide interventions but reported a decline in suicides by pesticide over time.29,35 However, the incidence of hanging increased rapidly in India and was associated with an overall increase in suicide rates.35
Gas Restrictions
Detoxification of domestic gas refers to the gradual removal of carbon monoxide from gas lines or replacing coal gas with natural gas. This detoxification was implemented in 14 countries from the 1950s to the 1990s (Table).37,38,39,40,41,42,43,44,45,46,47,48,49,50,51,72,73,74,75
Incidence rate ratios were calculated for 13 countries, which all reported reduced incidence of suicide by domestic gas (Figure 2). The largest decreases in domestic gas IRR were reported in the Netherlands (0.03; 95% CI, 0.01-0.06) and West Germany (0.03; 95% CI, 0.02-0.04).40,46
Figure 2. Forest Plots for Changes in Suicide by Domestic Gas and Motor Exhaust and Suicide by Other Methods .

In panel B, blue squares represent catalytic converter, and orange squares represent (4.5% emission) of carbon monoxide in cars. NA indicates not applicable.
aData on overall suicide or other methods of suicide were not available.
The incidence of suicide by other methods subsequently decreased in Switzerland (IRR, 0.89; 95% CI, 0.81-0.97) and Denmark (IRR, 0.78; 95% CI, 0.72-0.84)48,73 but did not change in the US,50 Vienna (Austria),45 and Northern Ireland.44 Suicide by other methods increased in 8 countries: England, Wales, Scotland, the Netherlands, Belgium, West Germany, Japan, and Australia, with IRRs ranging from 1.25 to 1.66.40,46,47,49,51
Catalytic converters and other motor emission legislations reduced carbon monoxide concentration in motor vehicle exhaust. This change was associated with a gradual decrease in carbon monoxide exposure risk because new cars were manufactured and purchased and older cars were removed from service. Nine countries reported suicides by motor exhaust from 1968 to 1993 (Table).41,52,53,54,55,56,57,58,59,60,72,73,74 Most countries introduced mandatory catalytic converters in new cars (carbon monoxide <0.5%).53,57 Japan’s motor legislation was more limited (carbon monoxide <4.5%), and the US reduced carbon monoxide emissions before mandating catalytic converters.56,57
Incidence rate ratio was calculated for 8 countries (Figure 2). Four interventions in 5 countries were associated with decreases in suicides by motor exhaust, with IRRs reported in England and Wales (0.42; 95% CI, 0.38-0.46), Scotland (0.27; 95% CI, 0.18-0.41), Switzerland (0.39; 95% CI, 0.29-0.54), and Denmark (0.43; 95% CI, 0.32-0.58).52,54,55,73 The incidence of suicides by motor exhaust was unlikely to have changed in the US (IRR, 1.05) or increased in Australia (IRR, 1.36; 95% CI, 1.18-1.56) and Japan (IRR, 2.07; 95% CI, 1.89-2.27).56,58,60 The incidence of suicide by other methods subsequently decreased in Switzerland, Denmark, and Japan, with IRRs ranging from 0.58 to 0.95, or increased slightly in England and Wales (IRR, 1.08; 95% CI, 1.03-1.12) and Scotland (IRR, 1.13; 95% CI, 1.02-1.25).
The incidence of suicides by carbon monoxide and overall suicides declined over time in Hradec Králové, Czech Republic. Domestic gas detoxification appeared to correspond to this trend more closely than catalytic converters.72
Pharmaceutical Restrictions
Seven countries reported pharmaceutical interventions (Table).61,62,63,64,65,66,67,68,69,70,71,73,74,75 Targeted medicines included paracetamol, salicylates, dextropropoxyphene, barbiturates, and caffeine tablets. Strategies to limit access to medicine included limiting tablet pack size, withdrawal from market, therapeutic restriction by indication, and upscheduling (from over-the-counter to prescription drug only).
Seven interventions in 6 countries were suitable for IRR calculations (Figure 3).62,65,68,69,70,73,74 Six interventions were followed by reduced incidence of suicides by medicine overdose, with the largest decrease after the dextropropoxyphene ban in England and Wales (IRR, 0.04; 95% CI, 0.02-0.08).65 Four barbiturate interventions were associated with decreased incidence of suicides by overdose, with IRRs reported in Denmark (0.29; 95% CI, 0.17-0.50), Australia (0.72; 95% CI, 0.65-0.80), Sweden (0.17; 95% CI, 0.10-0.29), and Japan (0.22; 95% CI, 0.21-0.23).68,69,70,73 Paracetamol pack size limits were also associated with a decrease in suicides by paracetamol overdose in England and Wales (IRR, 0.60; 95% CI, 0.46-0.77).62 Prescribing restrictions on dextropropoxyphene in Denmark did not appear to change the incidence of suicide by analgesic.73,74
Figure 3. Forest Plots for Changes in Suicide by Drug Overdose and Suicide by Other Methods.
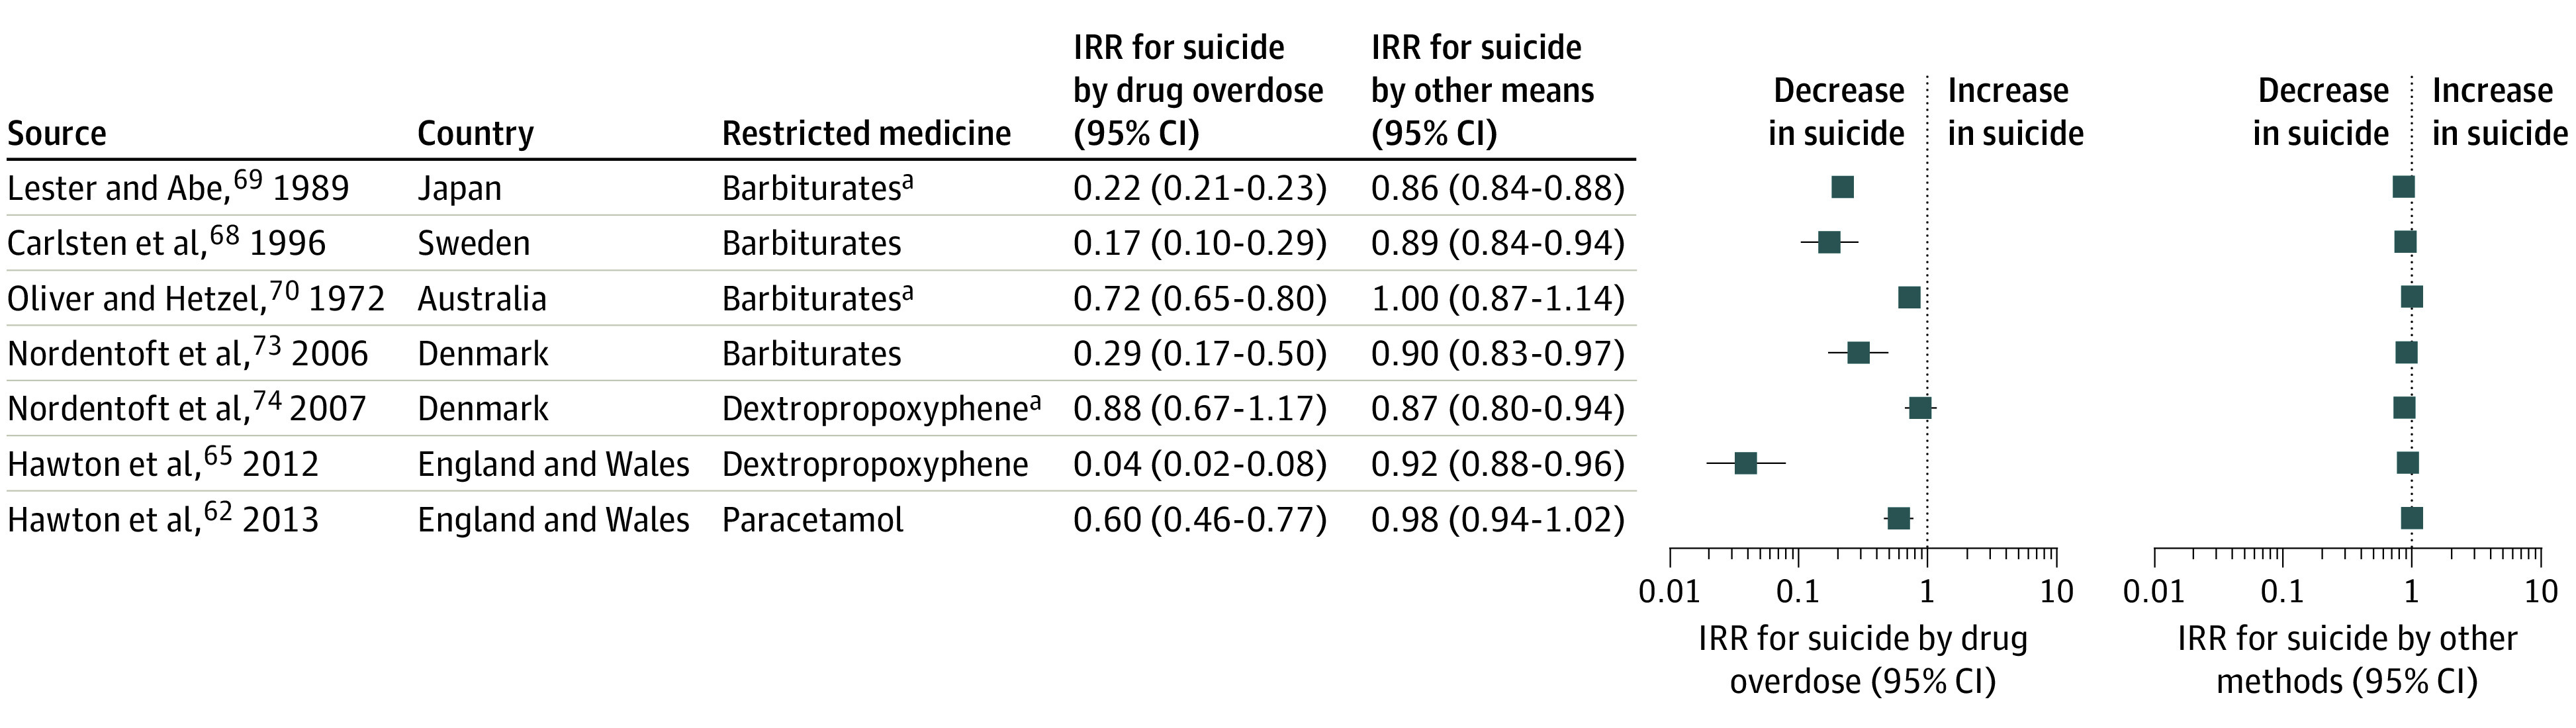
Barbiturates in Japan were up-scheduled to prescription-only access. Barbiturates in Sweden and Denmark and dextropropoxyphene in Denmark were placed under therapeutic restriction. Barbiturates in Australia and paracetamol in England and Wales had pack-size limits. Dextropropoxyphene in England and Wales was withdrawn from the market.
aIndicates studies that recorded suicide by a broader drug class (eg, analgesic and sedative).
The incidence of suicide by other methods decreased after barbiturates restrictions in Sweden, Japan, and Denmark, with IRRs ranging from 0.86 to 0.90, as well as dextropropoxyphene restrictions in Denmark (IRR, 0.87; 95% CI, 0.80-0.94) and England and Wales (IRR, 0.92; 95% CI, 0.88-0.96). Suicide by other methods did not appear to change after pack size limits of paracetamol in England and Wales and of barbiturates in Australia.
Other studies reported dextropropoxyphene withdrawal in Scotland and the US (Florida) as well as caffeine tablet pack size limits in Sweden. Suicides by dextropropoxyphene declined in Scotland after 2 years,66 whereas Florida reported a decreasing trend in suicides by dextropropoxyphene, and Sweden reported a decrease in suicides by caffeine intoxication.67,71
Analysis for Method Substitution
The median (IQR) change in method-specific suicide rates after 29 interventions was −1.18 (−2.03 to −0.46) per 100 000 people during the same follow-up period (5 years for pesticides and medicines, and 10 years for gases). The change in other methods was distributed normally and centered around a median (IQR) of −0.09 (−2.22 to 1.65) per 100 000 people.
No significant association was found (linear regression slope, −0.06; 95% CI, −0.25 to 0.14) between changes in suicide by the restricted poison and suicide by other methods (Figure 4). This result suggests that random variations or other unrelated factors were associated with the observed changes in other methods of suicide. Increases in other methods were often associated with domestic gas detoxification and earlier periods (1960-1975) (eFigure 3 in the Supplement). A conservative estimate of approximately 57 355 poison-specific suicides occurred annually before the interventions were implemented (eTable 2 in the Supplement); these cases may have benefited from means restrictions.
Figure 4. Scatterplot With Linear Regression of Change in Suicide by Restricted Methods vs Change in Suicide by Other Methods .

Line-of-fit metric y = −0.058x – 1.621 with x representing the change in suicide by other methods; linear regression slope = −0.06 (95% CI, −0.25 to 0.14). Inset, the quantile-quantile (QQ) plot shows a normal distribution.
Discussion
Overall, this synthesis of the literature suggests that means restriction of a range of poison was associated with lower incidences of suicide. We found no evidence to suggest that change in other suicide methods that coincided with bans and restrictions was anything other than coincidental. A decrease in specific poisoning did not promote the use of other equally lethal methods. An increase in other suicide methods tended to be partial, to be focused on a subgroup, or to occur over a long time.10,13
Individuals usually prefer a specific method during a suicidal crisis, and any decrease in method-specific suicide rates is beneficial.8,13 Firearm ownership in the US has been associated with 4.8-times higher odds of suicide, whereas a 10% decrease in firearm ownership has been associated with a 4.2% decline in suicide by firearm and 2.5% decline in overall suicide.7,8 Bridge barriers have been associated with an 86% reduction in suicides by jumping at sites with barriers, 44% increase in suicides by jumping at sites without barriers, or a 28% net decrease of all suicides by jumping.9
No significant association was found between changes in suicides by poisoning and suicides by other methods. It seems likely that background historical trends in other methods may explain the many cases in which investigators have concluded that no method substitution occurred. When coal gas was phased out, decreased incidences of suicides by domestic gas coincided with increased access to psychotropic medicines and increased car ownership.3,39,44,52,55 Psychotropic medicines (especially barbiturates and tricyclic antidepressants) and cars without catalytic converters were relatively toxic from the 1960s to the 1980s until they were replaced or restricted.39,44,52,55,58,73 Benzodiazepines and selective serotonin reuptake inhibitors that were much less toxic in overdose became the most common sedatives and antidepressants.39,68,73,75,79
Pesticide restrictions were complex, with different chemicals and formulations available. Outcomes varied depending on what other pesticides were available or banned in the same time frame. Pesticide bans were associated with fewer suicides by pesticide more often than occupational licensing.12,15,16,17,18,21,22,23,24,25,26,27,28,30,31,32,33,34,35,36
Domestic gas detoxification was associated with reduced suicides by carbon monoxide, whereas motor exhaust interventions were sometimes associated with increasing trends of suicides by carbon monoxide. This finding likely reflects the total coverage and relative speed with which household domestic gas could be detoxified. Catalytic converters were applied only to new cars and can lose effectiveness over time.57
Most strategies to limit access to medicine were associated with decreases in suicides by drug overdose. Medicine restrictions can also be affected by changes in prescribing patterns.75 Sedative and hypnotic overdoses were common in the twentieth century, whereas analgesics and opioids are currently associated with medicine poisoning. Means restriction of opioids other than dextropropoxyphene has not been studied to date. Dextropropoxyphene has direct cardiac toxic effects and thus should not be considered a typical opioid. Research on opioid policies and opioid suicide rates should be a high priority given the current epidemic of prescription opioid misuse in high-income countries.65,67
A total of 57 355 poison-specific suicides were reported before the interventions were implemented (eTable 2 in the Supplement). This population represents the cohort who may benefit the most from means restriction of poison, but this population does not account for studies that occur during different periods. Means restriction had the greatest public health benefit when the restricted suicide method was common and highly lethal. This result was seen in Sri Lanka, where multiple pesticide bans were associated with 19 800 fewer suicides (based on time-trend analysis of overall suicide rate) in 1996 to 2005 vs 1986 to 1995.31 In contrast, car exhaust in Japan remained lethal because carbon monoxide was only partially reduced and the increase in suicides by motor exhaust was associated with an increase in car ownership.56
The choice of suicide method at a population level is complex but often varies by socioeconomic profile.35 Some violent self-harm methods (such as hanging, jumping, and sharp-object injury) tend to have lower cost than poisoning. Hanging remained a common method of suicide, and the incidence of hanging sometimes increased over time.18,24,30,31,35,36,41,44,47,52,74 Hanging is highly lethal and difficult to target with means restriction, although means restriction has a place in specific settings, such as ligature restrictions in prisons and hospitals.52
Many interventions such as detoxification of domestic gas and withdrawal of dextropropoxyphene were likely to be widespread, but these interventions were evaluated only in a small number of countries. Cost may be a factor, such as low-income countries using older cars without working catalytic converters. Bans of hazardous pesticides in low- and middle-income countries are considered highly cost-effective and should remain a high priority.80
We evaluated each study with the ROBINS-I tool and found that some studies were prone to selection and reporting bias or with poorly specified interventions. Methods varied considerably, with repeated cross-sectional studies and studies with limited follow-up periods providing less reliable estimates. Most studies considered preintervention trends, but only 4 studies conducted an interrupted time series analysis.62,63,64,65 Interrupted time series analysis is a robust method for estimating preintervention trends and changes in slope to ascertain the magnitude of the intervention. Ideally, this method would be used for future means restriction studies.
Strengths and Limitations
This study has some strengths. To our knowledge, no other systematic review has focused on all poisons, quantitatively comparing poison-specific suicide rates and suicide by other methods. We collected and analyzed data on method-specific suicide rates and suicide by other methods before and after 29 interventions. This method allowed a comparison of different interventions with the same unit (rate per 100 000 people), but it does not account for different periods, preintervention trends, and cointerventions. Preintervention trends can change the reported outcome, such as when physicians were encouraged to prescribe alternate analgesics ahead of the dextropropoxyphene withdrawal.65,66,67 Social and economic detriments to mental health or quality of life, such as poverty, employment, substance misuse, and conflict, also alter the rates of suicidality and are potential confounding factors that are difficult to explain. Means restriction of multiple substances simultaneously or means restriction combined with other suicide prevention policies could have a synergistic benefit for suicide rates. However, quantifying this advantage was beyond the scope of this systematic review.
This study also has some limitations. First, this systematic review did not identify any studies from South America and Africa, which may affect the generalizability of the findings. Second, we found low representation of low- and middle-income countries, despite most suicides occurring in these countries.2 This low representation may be attributed to the search strategy, which included English studies only and excluded reports and other articles that were not published in academic journals. Low- and middle-income countries may be less likely to publish studies on suicide given that underreporting and stigma are common.35
Conclusions
Means restriction appeared to be associated with decreased suicide rates and had the greatest benefit when it restricted suicide methods that were common and highly lethal. Coincidental changes in other methods likely reflects the background trends in other methods, and the overall changes across all studies did not provide support for the speculation that restrictive interventions lead to method substitution. Suicide prevention strategies should be synergistic, targeting both individuals who are at risk and broad population-level policies, including means restriction.
eMethods 1. Search Strategy
eMethods 2. IRR and CIs Were Calculated With the Following Formulae
eFigure 1. PRISMA Flow Diagram of Study Selection
eFigure 2. Bubble Map Showing the Location of Means Restriction Studies Globally, With a Zoomed Inset from Europe
eFigure 3. Scatter Plot With Linear Regression of Change in Suicide by Other Methods Versus Year of the Intervention (Line of Fit Metric: Y = −0.05572*X + 109.8, Linear Regression Slope of −0.06 (95% CI −0.12 to 0.009))
eFigure 4. Forest Plot for Changes in Overall Suicide After Pesticide Restrictions
eFigure 5. Forest Plot for Changes in Overall Suicide After Domestic Gas Detoxification
eFigure 6. Forest Plot for Changes in Overall Suicide After Motor Exhaust Interventions
eFigure 7. Forest Plot for Changes in Overall Suicide After Medicine Restrictions
eFigure 8. Scatter Plot With Linear Regression of Change in Suicide by Restricted Methods Versus Change in Overall Suicide (Line of Fit Metric: Y = 0.1660*X - 1.254, Linear Regression Slope of 0 · 16, 95% [CI −0.01 to 0.34]).
eFigure 9. Scatter Plot With Linear Regression of Change in Overall Suicide Versus Year of the Intervention (Line of Fit Metric: Y = −0.05165*X + 100.2, Linear Regression Slope of −0 · 05, [95% CI −0.12 to 0.02])
eTable 1. Risk of Bias Heat Map Based on the ROBINS I Risk of Bias Tool for Uncontrolled Before-After Studies (Includes Interrupted Time Series)
eTable 2. Approximate or Estimated Number of Annual Poison-Specific Suicides Reported One Year Before Each Intervention (or Closest Year Available).
eMethods 3. Excluded Papers With Reasons
eReferences
References
- 1.World Health Organization . Suicide: key facts. Accessed July 27, 2021. https://www.who.int/news-room/fact-sheets/detail/suicide
- 2.World Health Organization . Preventing suicide: a global imperative. Executive summary. 2014.. Accessed September 3, 2020. https://www.who.int/mental_health/suicide-prevention/exe_summary_english.pdf
- 3.Yip PS, Caine E, Yousuf S, Chang SS, Wu KC, Chen YY. Means restriction for suicide prevention. Lancet. 2012;379(9834):2393-2399. doi: 10.1016/S0140-6736(12)60521-2 [DOI] [PMC free article] [PubMed] [Google Scholar]
- 4.Hawton K, Hill NTM, Gould M, John A, Lascelles K, Robinson J. Clustering of suicides in children and adolescents. Lancet Child Adolesc Health. 2020;4(1):58-67. doi: 10.1016/S2352-4642(19)30335-9 [DOI] [PubMed] [Google Scholar]
- 5.Zalsman G, Hawton K, Wasserman D, et al. Suicide prevention strategies revisited: 10-year systematic review. Lancet Psychiatry. 2016;3(7):646-659. doi: 10.1016/S2215-0366(16)30030-X [DOI] [PubMed] [Google Scholar]
- 6.Sarchiapone M, Mandelli L, Iosue M, Andrisano C, Roy A. Controlling access to suicide means. Int J Environ Res Public Health. 2011;8(12):4550-4562. doi: 10.3390/ijerph8124550 [DOI] [PMC free article] [PubMed] [Google Scholar]
- 7.Kellermann AL, Rivara FP, Somes G, et al. Suicide in the home in relation to gun ownership. N Engl J Med. 1992;327(7):467-472. doi: 10.1056/NEJM199208133270705 [DOI] [PubMed] [Google Scholar]
- 8.Mann JJ, Michel CA. Prevention of firearm suicide in the United States: what works and what is possible. Am J Psychiatry. 2016;173(10):969-979. doi: 10.1176/appi.ajp.2016.16010069 [DOI] [PubMed] [Google Scholar]
- 9.Pirkis J, Spittal MJ, Cox G, Robinson J, Cheung YTD, Studdert D. The effectiveness of structural interventions at suicide hotspots: a meta-analysis. Int J Epidemiol. 2013;42(2):541-548. doi: 10.1093/ije/dyt021 [DOI] [PubMed] [Google Scholar]
- 10.Gunnell D, Knipe D, Chang S-S, et al. Prevention of suicide with regulations aimed at restricting access to highly hazardous pesticides: a systematic review of the international evidence. Lancet Glob Health. 2017;5(10):e1026-e1037. doi: 10.1016/S2214-109X(17)30299-1 [DOI] [PubMed] [Google Scholar]
- 11.Wasserman D, Iosue M, Wuestefeld A, Carli V. Adaptation of evidence-based suicide prevention strategies during and after the COVID-19 pandemic. World Psychiatry. 2020;19(3):294-306. doi: 10.1002/wps.20801 [DOI] [PMC free article] [PubMed] [Google Scholar]
- 12.Lin JJ, Lu TH. Trends in solids/liquids poisoning suicide rates in Taiwan: a test of the substitution hypothesis. BMC Public Health. 2011;11:712. doi: 10.1186/1471-2458-11-712 [DOI] [PMC free article] [PubMed] [Google Scholar]
- 13.Daigle MS. Suicide prevention through means restriction: assessing the risk of substitution: a critical review and synthesis. Accid Anal Prev. 2005;37(4):625-632. doi: 10.1016/j.aap.2005.03.004 [DOI] [PubMed] [Google Scholar]
- 14.Moher D, Liberati A, Tetzlaff J, Altman DG; PRISMA Group . Preferred reporting items for systematic reviews and meta-analyses: the PRISMA statement. BMJ. 2009;339:b2535. doi: 10.1136/bmj.b2535 [DOI] [PMC free article] [PubMed] [Google Scholar]
- 15.Onyon LJ, Volans GN. The epidemiology and prevention of paraquat poisoning. Hum Toxicol. 1987;6(1):19-29. doi: 10.1177/096032718700600104 [DOI] [PubMed] [Google Scholar]
- 16.Fitzgerald GR, Barniville G, Flanagan M, Silke B, Carmody M, O’Dwyer WF. The changing pattern of paraquat poisoning: an epidemiologic study. Ir Med J. 1978;71(4):103-108. [PubMed] [Google Scholar]
- 17.Moebus S, Bödeker W. Mortality of intentional and unintentional pesticide poisonings in Germany from 1980 to 2010. J Public Health Policy. 2015;36(2):170-180. doi: 10.1057/jphp.2014.56 [DOI] [PubMed] [Google Scholar]
- 18.Ohberg A, Lonnqvist J, Sarna S, Vuori E, Penttila A. Trends and availability of suicide methods in Finland: proposals for restrictive measures. Br J Psychiatry. 1995;166(1):35-43. doi: 10.1192/bjp.166.1.35 [DOI] [PubMed] [Google Scholar]
- 19.Kastanaki AE, Kraniotis CF, Kranioti EF, Nathena D, Theodorakis PN, Michalodimitrakis M. Suicide by pesticide poisoning: findings from the island of Crete, Greece. Crisis. 2010;31(6):328-334. doi: 10.1027/0227-5910/a000042 [DOI] [PubMed] [Google Scholar]
- 20.Kervégant M, Merigot L, Glaizal M, Schmitt C, Tichadou L, de Haro L. Paraquat poisonings in France during the European ban: experience of the Poison Control Center in Marseille. J Med Toxicol. 2013;9(2):144-147. doi: 10.1007/s13181-012-0283-6 [DOI] [PMC free article] [PubMed] [Google Scholar]
- 21.Cha ES, Chang SS, Gunnell D, Eddleston M, Khang YH, Lee WJ. Impact of paraquat regulation on suicide in South Korea. Int J Epidemiol. 2016;45(2):470-479. doi: 10.1093/ije/dyv304 [DOI] [PubMed] [Google Scholar]
- 22.Cha ES, Chang SS, Choi Y, Lee WJ. Trends in pesticide suicide in South Korea, 1983-2014. Epidemiol Psychiatr Sci. 2019;29:e25. doi: 10.1017/S2045796019000118 [DOI] [PMC free article] [PubMed] [Google Scholar]
- 23.Kim J, Shin SD, Jeong S, Suh GJ, Kwak YH. Effect of prohibiting the use of Paraquat on pesticide-associated mortality. BMC Public Health. 2017;17(1):858. doi: 10.1186/s12889-017-4832-4 [DOI] [PMC free article] [PubMed] [Google Scholar]
- 24.Han DG, Kang SG, Cho SJ, Cho SE, Na KS. Suicide methods according to age and sex: an analysis of data of 239,565 suicide victims in the Republic of Korea from 1991 to 2015. J Nerv Ment Dis. 2018;206(10):770-775. doi: 10.1097/NMD.0000000000000889 [DOI] [PubMed] [Google Scholar]
- 25.Myung W, Lee GH, Won HH, et al. Paraquat prohibition and change in the suicide rate and methods in South Korea. PLoS One. 2015;10(6):e0128980. doi: 10.1371/journal.pone.0128980 [DOI] [PMC free article] [PubMed] [Google Scholar]
- 26.Lee JW, Hwang IW, Kim JW, et al. Common pesticides used in suicide attempts following the 2012 paraquat ban in Korea. J Korean Med Sci. 2015;30(10):1517-1521. doi: 10.3346/jkms.2015.30.10.1517 [DOI] [PMC free article] [PubMed] [Google Scholar]
- 27.Chang SS, Lu TH, Eddleston M, et al. Factors associated with the decline in suicide by pesticide poisoning in Taiwan: a time trend analysis, 1987-2010. Clin Toxicol (Phila). 2012;50(6):471-480. doi: 10.3109/15563650.2012.688835 [DOI] [PubMed] [Google Scholar]
- 28.Chen YY, Kwok CL, Yip PS, Wu KC. A test of the substitution hypothesis: an analysis of urban and rural trends in solid/liquid poisoning suicides in Taiwan. Soc Sci Med. 2013;96:45-51. doi: 10.1016/j.socscimed.2013.06.031 [DOI] [PubMed] [Google Scholar]
- 29.Berecz R, Cáceres M, Szlivka A, et al. Reduced completed suicide rate in Hungary from 1990 to 2001: relation to suicide methods. J Affect Disord. 2005;88(2):235-238. doi: 10.1016/j.jad.2005.07.005 [DOI] [PubMed] [Google Scholar]
- 30.Qin P, Du M, Wang S, et al. The waterfall pattern of suicide mortality in Inner Mongolia for 2008-2015. J Affect Disord. 2019;256:331-336. doi: 10.1016/j.jad.2019.05.057 [DOI] [PubMed] [Google Scholar]
- 31.Gunnell D, Fernando R, Hewagama M, Priyangika WD, Konradsen F, Eddleston M. The impact of pesticide regulations on suicide in Sri Lanka. Int J Epidemiol. 2007;36(6):1235-1242. doi: 10.1093/ije/dym164 [DOI] [PMC free article] [PubMed] [Google Scholar]
- 32.de Silva VA, Senanayake SM, Dias P, Hanwella R. From pesticides to medicinal drugs: time series analyses of methods of self-harm in Sri Lanka. Bull World Health Organ. 2012;90(1):40-46. doi: 10.2471/BLT.11.091785 [DOI] [PMC free article] [PubMed] [Google Scholar]
- 33.Knipe DW, Metcalfe C, Fernando R, et al. Suicide in Sri Lanka 1975-2012: age, period and cohort analysis of police and hospital data. BMC Public Health. 2014;14:839. doi: 10.1186/1471-2458-14-839 [DOI] [PMC free article] [PubMed] [Google Scholar]
- 34.Knipe DW, Chang SS, Dawson A, et al. Suicide prevention through means restriction: impact of the 2008-2011 pesticide restrictions on suicide in Sri Lanka. PLoS One. 2017;12(3):e0172893. doi: 10.1371/journal.pone.0172893 [DOI] [PMC free article] [PubMed] [Google Scholar]
- 35.Arya V, Page A, Gunnell D, et al. Suicide by hanging is a priority for suicide prevention: method specific suicide in India (2001-2014). J Affect Disord. 2019;257:1-9. doi: 10.1016/j.jad.2019.07.005 [DOI] [PubMed] [Google Scholar]
- 36.Chowdhury FR, Dewan G, Verma VR, et al. Bans of WHO class I pesticides in Bangladesh-suicide prevention without hampering agricultural output. Int J Epidemiol. 2018;47(1):175-184. doi: 10.1093/ije/dyx157 [DOI] [PMC free article] [PubMed] [Google Scholar]
- 37.Kreitman N. The coal gas story: United Kingdom suicide rates, 1960-71. Br J Prev Soc Med. 1976;30(2):86-93. doi: 10.1136/jech.30.2.86 [DOI] [PMC free article] [PubMed] [Google Scholar]
- 38.Kreitman N, Platt S. Suicide, unemployment, and domestic gas detoxification in Britain. J Epidemiol Community Health. 1984;38(1):1-6. doi: 10.1136/jech.38.1.1 [DOI] [PMC free article] [PubMed] [Google Scholar]
- 39.Gunnell D, Middleton N, Frankel S. Method availability and the prevention of suicide—a re-analysis of secular trends in England and Wales 1950-1975. Soc Psychiatry Psychiatr Epidemiol. 2000;35(10):437-443. doi: 10.1007/s001270050261 [DOI] [PubMed] [Google Scholar]
- 40.Clarke RV, Mayhew PAT. Crime as opportunity: a note on domestic gas suicide in Britain and the Netherlands. Br J Criminol. 1989;29(1):35-46. doi: 10.1093/oxfordjournals.bjc.a047788 [DOI] [Google Scholar]
- 41.Thomas K, Gunnell D. Suicide in England and Wales 1861-2007: a time-trends analysis. Int J Epidemiol. 2010;39(6):1464-1475. doi: 10.1093/ije/dyq094 [DOI] [PubMed] [Google Scholar]
- 42.Hassall C, Trethowan WH. Suicide in Birmingham. BMJ. 1972;1(5802):717-718. doi: 10.1136/bmj.1.5802.717 [DOI] [PMC free article] [PubMed] [Google Scholar]
- 43.Lester D, Hodgson J. The effects of the detoxification of domestic gas on the suicide rate in Scotland. Eur J Psychiatry. 1992;6(3):171-174. [Google Scholar]
- 44.Curran PS, Lester D. Trends in the methods used for suicide in Northern Ireland. Ulster Med J. 1991;60(1):58-62. [PMC free article] [PubMed] [Google Scholar]
- 45.Dervic K, Friedrich E, Prosquill D, et al. Suicide among Viennese minors, 1946-2002. Wien Klin Wochenschr. 2006;118(5-6):152-159. doi: 10.1007/s00508-006-0567-4 [DOI] [PubMed] [Google Scholar]
- 46.Wiedenmann A, Weyerer S. The impact of availability, attraction and lethality of suicide methods on suicide rates in Germany. Acta Psychiatr Scand. 1993;88(5):364-368. doi: 10.1111/j.1600-0447.1993.tb03474.x [DOI] [PubMed] [Google Scholar]
- 47.Moens GFG, Loysch MJM, Honggokoesoemo S, van de Voorde H. Recent trends in methods of suicide. Acta Psychiatr Scand. 1989;79(3):207-215. doi: 10.1111/j.1600-0447.1989.tb10246.x [DOI] [PubMed] [Google Scholar]
- 48.Lester D. The effect of the detoxification of domestic gas in Switzerland on the suicide rate. Acta Psychiatr Scand. 1990;82(5):383-384. doi: 10.1111/j.1600-0447.1990.tb01406.x [DOI] [PubMed] [Google Scholar]
- 49.Lester D, Abe K. The effect of restricting access to lethal methods for suicide: a study of suicide by domestic gas in Japan. Acta Psychiatr Scand. 1989;80(2):180-182. doi: 10.1111/j.1600-0447.1989.tb01324.x [DOI] [PubMed] [Google Scholar]
- 50.Lester D. The effects of detoxification of domestic gas on suicide in the United States. Am J Public Health. 1990;80(1):80-81. doi: 10.2105/AJPH.80.1.80 [DOI] [PMC free article] [PubMed] [Google Scholar]
- 51.Burvill PW. The changing pattern of suicide by gassing in Australia, 1910-1987: the role of natural gas and motor vehicles. Acta Psychiatr Scand. 1990;81(2):178-184. doi: 10.1111/j.1600-0447.1990.tb06475.x [DOI] [PubMed] [Google Scholar]
- 52.Amos T, Appleby L, Kiernan K. Changes in rates of suicide by car exhaust asphyxiation in England and Wales. Psychol Med. 2001;31(5):935-939. doi: 10.1017/S0033291701003920 [DOI] [PubMed] [Google Scholar]
- 53.Kendell RE. Catalytic converters and prevention of suicides. Lancet. 1998;352(9139):1525. doi: 10.1016/S0140-6736(05)60332-7 [DOI] [PubMed] [Google Scholar]
- 54.Skilling GD, Sclare PD, Watt SJ, Fielding S. The effect of catalytic converter legislation on suicide rates in Grampian and Scotland 1980-2003. Scott Med J. 2008;53(4):3-6. doi: 10.1258/RSMSMJ.53.4.3 [DOI] [PubMed] [Google Scholar]
- 55.Hepp U, Ring M, Frei A, Rössler W, Schnyder U, Ajdacic-Gross V. Suicide trends diverge by method: Swiss suicide rates 1969-2005. Eur Psychiatry. 2010;25(3):129-135. doi: 10.1016/j.eurpsy.2009.05.005 [DOI] [PubMed] [Google Scholar]
- 56.Lester S, Abe K. Car availability, exhaust toxicity, and suicide. Ann Clin Psychiatry. 1989;1(4):247-250. doi: 10.3109/10401238909149990 [DOI] [Google Scholar]
- 57.Lester D. Changing rates of suicide by car exhaust in men and women in the United States after car exhaust was detoxified. Crisis. 1989;10(2):164-168. [PubMed] [Google Scholar]
- 58.Mott JA, Wolfe MI, Alverson CJ, et al. National vehicle emissions policies and practices and declining US carbon monoxide-related mortality. JAMA. 2002;288(8):988-995. doi: 10.1001/jama.288.8.988 [DOI] [PubMed] [Google Scholar]
- 59.Hampson NB, Holm JR. Suicidal carbon monoxide poisoning has decreased with controls on automobile emissions. Undersea Hyperb Med. 2015;42(2):159-164. [PubMed] [Google Scholar]
- 60.Routley VH, Ozanne-Smith J. The impact of catalytic converters on motor vehicle exhaust gas suicides. Med J Aust. 1998;168(2):65-67. doi: 10.5694/j.1326-5377.1998.tb126713.x [DOI] [PubMed] [Google Scholar]
- 61.Hawton K, Simkin S, Deeks J, et al. UK legislation on analgesic packs: before and after study of long term effect on poisonings. BMJ. 2004;329(7474):1076-1079. doi: 10.1136/bmj.38253.572581.7C [DOI] [PMC free article] [PubMed] [Google Scholar]
- 62.Hawton K, Bergen H, Simkin S, et al. Long term effect of reduced pack sizes of paracetamol on poisoning deaths and liver transplant activity in England and Wales: interrupted time series analyses. BMJ. 2013;346:f403. doi: 10.1136/bmj.f403 [DOI] [PMC free article] [PubMed] [Google Scholar]
- 63.Morgan OW, Griffiths C, Majeed A. Interrupted time-series analysis of regulations to reduce paracetamol (acetaminophen) poisoning. PLoS Med. 2007;4(4):e105. doi: 10.1371/journal.pmed.0040105 [DOI] [PMC free article] [PubMed] [Google Scholar]
- 64.Hawton K, Bergen H, Simkin S, et al. Effect of withdrawal of co-proxamol on prescribing and deaths from drug poisoning in England and Wales: time series analysis. BMJ. 2009;338:b2270. doi: 10.1136/bmj.b2270 [DOI] [PMC free article] [PubMed] [Google Scholar]
- 65.Hawton K, Bergen H, Simkin S, Wells C, Kapur N, Gunnell D. Six-year follow-up of impact of co-proxamol withdrawal in England and Wales on prescribing and deaths: time-series study. PLoS Med. 2012;9(5):e1001213. doi: 10.1371/journal.pmed.1001213 [DOI] [PMC free article] [PubMed] [Google Scholar]
- 66.Sandilands EA, Bateman DN. Co-proxamol withdrawal has reduced suicide from drugs in Scotland. Br J Clin Pharmacol. 2008;66(2):290-293. doi: 10.1111/j.1365-2125.2008.03206.x [DOI] [PMC free article] [PubMed] [Google Scholar]
- 67.Delcher C, Chen G, Wang Y, Slavova S, Goldberger BA. Fatal poisonings involving propoxyphene before and after voluntary withdrawal from the United States’ market: an analysis from the state of Florida. Forensic Sci Int. 2017;280:228-232. doi: 10.1016/j.forsciint.2017.10.008 [DOI] [PubMed] [Google Scholar]
- 68.Carlsten A, Allebeck P, Brandt L. Are suicide rates in Sweden associated with changes in the prescribing of medicines? Acta Psychiatr Scand. 1996;94(2):94-100. doi: 10.1111/j.1600-0447.1996.tb09831.x [DOI] [PubMed] [Google Scholar]
- 69.Lester D, Abe K. The effect of controls on sedatives and hypnotics on their use for suicide. J Toxicol Clin Toxicol. 1989;27(4-5):299-303. doi: 10.3109/15563658908994427 [DOI] [PubMed] [Google Scholar]
- 70.Oliver RG, Hetzel BS. Rise and fall of suicide rates in Australia: relation to sedative availability. Med J Aust. 1972;2(17):919-923. doi: 10.5694/j.1326-5377.1972.tb103635.x [DOI] [PubMed] [Google Scholar]
- 71.Thelander G, Jönsson AK, Personne M, Forsberg GS, Lundqvist KM, Ahlner J. Caffeine fatalities—do sales restrictions prevent intentional intoxications? Clin Toxicol (Phila). 2010;48(4):354-358. doi: 10.3109/15563650903586752 [DOI] [PubMed] [Google Scholar]
- 72.Janík M, Ublová M, Kučerová Š, Hejna P. Carbon monoxide-related fatalities: a 60-year single institution experience. J Forensic Leg Med. 2017;48:23-29. doi: 10.1016/j.jflm.2017.04.002 [DOI] [PubMed] [Google Scholar]
- 73.Nordentoft M, Qin P, Helweg-Larsen K, Juel K. Time-trends in method-specific suicide rates compared with the availability of specific compounds: the Danish experience. Nord J Psychiatry. 2006;60(2):97-106. doi: 10.1080/08039480600600169 [DOI] [PubMed] [Google Scholar]
- 74.Nordentoft M, Qin P, Helweg-Larsen K, Juel K. Restrictions in means for suicide: an effective tool in preventing suicide: the Danish experience. Suicide Life Threat Behav. 2007;37(6):688-697. doi: 10.1521/suli.2007.37.6.688 [DOI] [PubMed] [Google Scholar]
- 75.Whitlock FA. Suicide in Brisbane, 1956 to 1973: the drug-death epidemic. Med J Aust. 1975;1(24):737-743. doi: 10.5694/j.1326-5377.1975.tb111781.x [DOI] [PubMed] [Google Scholar]
- 76.World Bank . The world by income and region. Accessed April 8, 2021. https://datatopics.worldbank.org/world-development-indicators/the-world-by-income-and-region.html
- 77.Sterne JAC, Hernán MA, Reeves BC, et al. ROBINS-I: a tool for assessing risk of bias in non-randomised studies of interventions. BMJ. 2016;355:i4919. doi: 10.1136/bmj.i4919 [DOI] [PMC free article] [PubMed] [Google Scholar]
- 78.World Bank Group . Population, total. Accessed July 27, 2021. https://data.worldbank.org/indicator/SP.POP.TOTL
- 79.Buckley NA, Whyte IM, Dawson AH, Isbister GK. A prospective cohort study of trends in self-poisoning, Newcastle, Australia, 1987-2012: plus ça change, plus c’est la même chose. Med J Aust. 2015;202(8):438-442. doi: 10.5694/mja14.01116 [DOI] [PubMed] [Google Scholar]
- 80.Lee YY, Chisholm D, Eddleston M, et al. The cost-effectiveness of banning highly hazardous pesticides to prevent suicides due to pesticide self-ingestion across 14 countries: an economic modelling study. Lancet Glob Health. 2021;9(3):e291-e300. doi: 10.1016/S2214-109X(20)30493-9 [DOI] [PMC free article] [PubMed] [Google Scholar]
Associated Data
This section collects any data citations, data availability statements, or supplementary materials included in this article.
Supplementary Materials
eMethods 1. Search Strategy
eMethods 2. IRR and CIs Were Calculated With the Following Formulae
eFigure 1. PRISMA Flow Diagram of Study Selection
eFigure 2. Bubble Map Showing the Location of Means Restriction Studies Globally, With a Zoomed Inset from Europe
eFigure 3. Scatter Plot With Linear Regression of Change in Suicide by Other Methods Versus Year of the Intervention (Line of Fit Metric: Y = −0.05572*X + 109.8, Linear Regression Slope of −0.06 (95% CI −0.12 to 0.009))
eFigure 4. Forest Plot for Changes in Overall Suicide After Pesticide Restrictions
eFigure 5. Forest Plot for Changes in Overall Suicide After Domestic Gas Detoxification
eFigure 6. Forest Plot for Changes in Overall Suicide After Motor Exhaust Interventions
eFigure 7. Forest Plot for Changes in Overall Suicide After Medicine Restrictions
eFigure 8. Scatter Plot With Linear Regression of Change in Suicide by Restricted Methods Versus Change in Overall Suicide (Line of Fit Metric: Y = 0.1660*X - 1.254, Linear Regression Slope of 0 · 16, 95% [CI −0.01 to 0.34]).
eFigure 9. Scatter Plot With Linear Regression of Change in Overall Suicide Versus Year of the Intervention (Line of Fit Metric: Y = −0.05165*X + 100.2, Linear Regression Slope of −0 · 05, [95% CI −0.12 to 0.02])
eTable 1. Risk of Bias Heat Map Based on the ROBINS I Risk of Bias Tool for Uncontrolled Before-After Studies (Includes Interrupted Time Series)
eTable 2. Approximate or Estimated Number of Annual Poison-Specific Suicides Reported One Year Before Each Intervention (or Closest Year Available).
eMethods 3. Excluded Papers With Reasons
eReferences