

Abstract
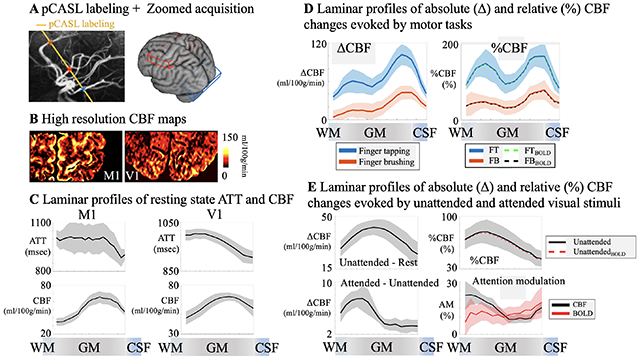
Laminar fMRI based on BOLD and CBV contrast at ultrahigh magnetic fields has been applied for studying the dynamics of mesoscopic brain networks. However, the quantitative interpretations of BOLD/CBV fMRI results are confounded by different baseline physiology across cortical layers. Here we introduce a novel zoomed 3D gradient and spin-echo (GRASE) pseudo-continuous arterial spin labeling (pCASL) technique at 7T that offers the capability for quantitative measurements of laminar cerebral blood flow (CBF) both at rest and during task activation with high spatial specificity and sensitivity. We found arterial transit time in superficial layers is ~100 msec shorter than in middle/deep layers revealing the time course of labeled blood flowing from pial arteries to downstream microvasculature. Resting state CBF peaked in the middle layers which is highly consistent with microvascular density measured from human cortex specimens. Finger tapping induced a robust two-peak laminar profile of CBF increases in the superficial (somatosensory and premotor input) and deep (spinal output) layers of M1, while finger brushing task induced a weaker CBF increase in superficial layers (somatosensory input). This observation is highly consistent with reported laminar profiles of CBV activation on M1. We further demonstrated that visuospatial attention induced a predominant CBF increase in deep layers and a smaller CBF increase on top of the lower baseline CBF in superficial layers of V1 (feedback cortical input), while stimulus driven activity peaked in the middle layers (feedforward thalamic input). With the capability for quantitative CBF measurements both at baseline and during task activation, high-resolution ASL perfusion fMRI at 7T provides an important tool for in vivo assessment of neurovascular function and metabolic activities of neural circuits across cortical layers.
Keywords: Laminar fMRI, Perfusion, Arterial spin labeling, Neural circuit, Visual spatial attention, Ultrahigh field
Graphic abstract
1. Introduction
It was discovered a century ago that the neocortex in mammals is arranged in six layers that vary across different cortical areas (Amunts and Zilles, 2015; Broadman, 1909). This observation formed the basis for the parcellation of human cortex into separate areas, and further assigned feedforward and feedback pathways to different cortical layers (Felleman and Van Essen, 1991; Shipp, 2007). Blood oxygenation level dependent (BOLD) fMRI is the most widely used non-invasive imaging modality for studying the dynamics of macroscopic brain networks and mesoscopic brain circuits. It is now feasible to achieve high resolution BOLD fMRI at the level of cortical layers at high or ultrahigh magnetic fields (UHF, 7T or above) (Koopmans et al., 2011; Polimeni et al., 2010; Ress et al., 2007). However, the complex interplay between cerebral blood flow (CBF), cerebral blood volume (CBV) and oxygen metabolism hampers quantitative interpretations of the BOLD signal across cortical layers or depths with different baseline physiology (Huber et al., 2019). The BOLD signal is also susceptible to contaminations of pial veins on the cortical surface that significantly confounds laminar fMRI. Compared to conventional gradient-echo T2*-weighted BOLD, emerging fMRI methods based on T2-weighted BOLD and CBV contrast have been shown to more precisely map the laminar activities in both animal and human studies (Chen et al., 2017; Duong et al., 2001; Huber et al., 2017; Huber et al., 2019; Kemper et al., 2015; Olman et al., 2012). In particular, vascular space occupancy (VASO) based CBV fMRI at 7T (Huber et al., 2015; Lu et al., 2003) is able to differentiate specific activations in different layers of human motor cortex (M1), as well as the directional functional connectivity of M1 with somatosensory and premotor areas (Huber et al., 2017).
CBF or perfusion measured by arterial spin labeling (ASL) is a key parameter for in vivo assessment of neurovascular function. The ASL signal is localized close to the site of neural activation as most of the labeled arterial water exchanges with tissue water in capillaries (Detre and Wang, 2002). Optical imaging in animals provides evidence that CBF can be precisely and rapidly regulated on an extremely fine scale at the level of capillaries (Chaigneau et al., 2003; Hall et al., 2014; Hamilton et al., 2010; Peppiatt et al., 2006). Compared to BOLD and CBV fMRI, ASL perfusion contrast offers the unique capability for quantitative CBF measurements both at rest and during task activation, which is critical for quantitative estimation of metabolic activities tightly related to neuronal activation. UHF ASL has the dual benefits of increased signal-to-noise ratio (SNR) that scales with B0 field (Pohmann et al., 2016) and prolonged tracer half-life (blood T1 = ~2.1sec at 7T) (Li et al., 2016; Rane and Gore, 2013), and therefore may overcome the major limitation of ASL in terms of low SNR (Gardener et al., 2009; Ivanov et al., 2017; Pfeuffer et al., 2002). To date, however, in vivo mapping of microvascular perfusion at laminar level remains largely unexplored, mainly due to the low sensitivity and technical challenges of performing high-resolution ASL at ultrahigh fields. A few groups proposed to measure brain perfusion with sub-millimeter spatial resolution using Flow-sensitive Alternating Inversion Recovery (FAIR) ASL and EPI readout at 7T (Huber et al., 2019; Ivanov et al., 2018; Kashyap et al., 2021; Pfeuffer et al., 2002). However, the lack of ATT information may affect the accuracy of EPI FAIR ASL to detect the activities of neurocircuits across cortical layers.
In this study, we introduced a novel zoomed 3D pseudo-continuous ASL (pCASL) technique at 7T with high spatial resolution (1-mm isotropic) and sensitivity to characterize layer-dependent resting and task activation induced perfusion activity in the human motor and visual cortices. For the first time, multi-delay pCASL was applied on human brain to measure variations of arterial transit time (ATT) and resting state CBF across cortical layers, illustrating the time course of labeled blood flowing from pial arteries, arterioles to downstream microvasculature in the middle layers of cerebral cortex (Duvernoy et al., 1981). Zoomed pCASL at the optimal post-labeling delay (PLD) was then applied on the motor cortex for detecting and quantifying the layer-dependent activity of M1 during finger tapping and finger brushing (SI Fig. S1A). The optimal zoomed pCASL protocol was further applied on the visual cortex to quantify the absolute and relative perfusion changes across cortical layers in response to a visual spatial attention task in V1. Our primary goal was to demonstrate the technical feasibility to perform laminar perfusion imaging on M1 and V1 using zoomed pCASL at 7T.
Previous studies have shown that somatosensory and premotor input to M1 largely terminates in the superficial layers (II/III), while cortico-spinal output originates predominantly in the deep layers (Vb/VI) (Huber et al., 2017; Mao et al., 2011; Weiler et al., 2008). However, the precise quantitative sensory input and motor output of M1 using ASL remain to be determined. While visual attention has been shown to operate through feedback connections along descending visual pathways involving both superficial and deep layers of V1, a quantitative measure is required to evaluate the relative contribution of deep and superficial layers in top-down attention (SI Fig. S1B). The second goal of our study was to address these unsolved neuroscientific questions using zoomed pCASL perfusion fMRI at 7T. We hypothesize that: 1) finger tapping (FT) engages neural activity of both somatosensory and premotor input in the superficial layers and motor output in the deep layers, and finger brushing (FB) primarily engages somatosensory input and minimal motor output (Huber et al., 2017; Mao et al., 2011; Weiler et al., 2008) (SI Fig. S1A); 2) feedforward visual input from the lateral geniculate of the thalamus mainly reaches the middle layers of V1, and visual attention operates through feedback pathways involving both deep and superficial layers (Felleman and Van Essen, 1991; Liu et al., 2020) (SI Fig. S1B).
2. Materials and Methods
2.1. Zoomed 3D GRASE pCASL protocol at 7T
Applying pCASL at UHF is challenging due to a high specific absorption ratio (SAR) level of RF power, as well as the B1+ drop and B0 inhomogeneity that affect labeling efficiency (Wu et al., 2007). We developed an innovative zoomed 3D pCASL technique to achieve a high labeling efficiency and spatial resolution without exceeding the SAR limit. A segmented 3D inner-volume gradient and spin-echo (GRASE) sequence (Feinberg et al., 1985; Feinberg and Ramanna, 2015) was applied for zoomed pCASL perfusion imaging of a 3D slab of 100×50×24mm3 with a high resolution of isotropic 1mm3. The flip angles (FA) of GRASE refocusing pulses and scheme for segmented acquisition were optimized along with a single background suppression pulse to minimize spatial blurring, physiological noise, and SAR (Fig.1A). The workflow was streamlined by performing maximal-intensity-projection (MIP) of the T1w structural MRI to visualize intracranial arteries, followed by placing the pCASL labeling plane above the circle of Willis (CoW) and simultaneously perpendicular to the M3 segment of middle cerebral artery (MCA), P2 segment of posterior cerebral artery (PCA) and A2 segment of anterior cerebral artery (ACA) (Fig.1B).
Figure 1.
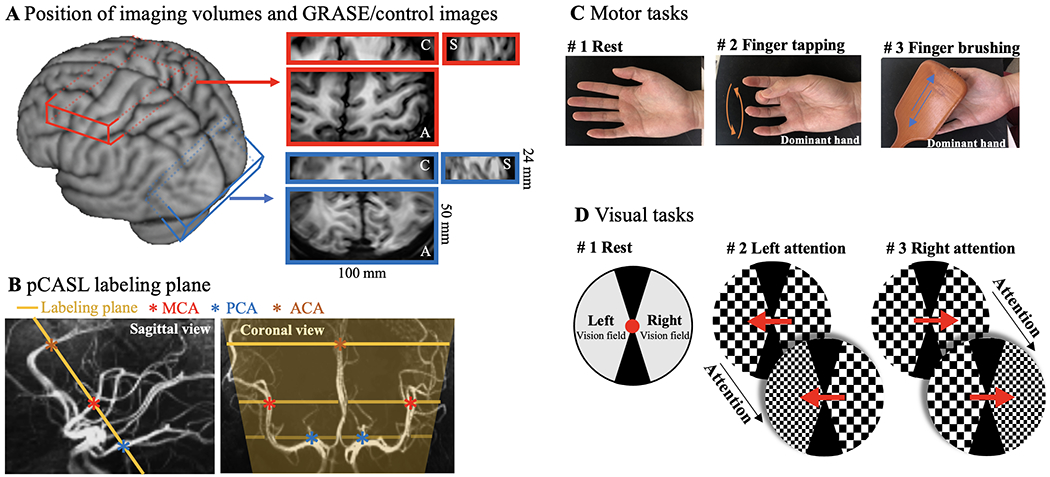
Demonstration of zoomed pCASL acquisition and diagrams of motor and visual tasks. A. Illustration of imaging volume on a 3D brain surface. A small FOV (100×50×24mm3) covering the dominant motor cortex (red) or visual cortex (blue) was acquired with zoomed GRASE. Axial, coronal and sagittal views of GRASE images are shown in enlarged red and blue boxes, respectively. B. Illustration of pCASL labeling plane in sagittal (yellow line) and coronal (yellow lines and shade) views. Intracranial arteries were revealed by maximal-intensity-projection (MIP) of the T1w structural MRI and pCASL labeling plane was placed above the circle of Willis (CoW) and simultaneously perpendicular to the M3 segment of middle cerebral artery (MCA), P2 segment of posterior cerebral artery (PCA) and A2 segment of anterior cerebral artery (ACA). C. Diagram of motor tasks. Two motor tasks consisted unilateral sequential finger tapping and brushing of the dominant hand (frequency of 2Hz). D. Diagram of spatial visual attention tasks. A pair of counter-phase flickering (7.5 Hz, 50% contrast) square wave checkerboards patterns (2 cycles per degree) were presented to the left and the right side of fixation. During the stimulus presentation, the spatial frequency of the two checkerboard patterns changed 7 times randomly and independently. Subjects were asked to pay attention to the cued checkerboard to detect occasional spatial frequency change of the attended stimulus in left or right vision field in two visual task runs.
Compared to conventional pCASL labeling plane at carotid arteries, this labeling location has three advantages: 1) B1+ and B0 fields are more homogeneous around the center of the brain; 2) Blood flow velocity is slower, and the pCASL labeling scheme can be optimized to reduce SAR while maintaining sufficient labeling efficiency; 3) The distance between the labeling plane and cortex of interest is reduced resulting in shortened ATT and TR (= 2.8 sec) for perfusion fMRI scans. With this optimized zoomed 3D pCASL, a high labeling efficiency of 82.1% can be achieved with an average SAR of 77.4±8.9% of the first level limit (3.2W/kg on head, SAR monitored by scanner). Another advantage of the proposed technique is perfusion and T2w GRASE-BOLD contrasts can be concurrently acquired by pairwise subtraction and summation of label and control images (Wong et al., 1997).
2.2. Experimental protocol and session setup
Experiments were conducted on a 7 Tesla Terra scanner (Siemens Healthineers, Erlangen, Germany), using a single-channel transmit and 32-channel receive head coil (Nova Medical, Wilmington, MA, USA). Third order shimming was performed before ASL scans to improve B0 field homogeneity. Imaging parameters for ASL scans were: FOV=100×50 mm2, 24 slices (33% oversampling, 6/8 partial Fourier), 1-mm isotropic nominal resolution, TE=26.78 msec, echo train length=214.2 msec, labeling duration=1280 msec, TR=2800 msec, each ASL image was acquired in 6 segments (2 and 3 segments along phase and partition directions) and resulting in an effective volume TR=16.8 sec. SI Fig. S2 shows the sequence diagram. FAs of 8 refocusing pulses were 120° and the first FA was increased to 150° for signal stabilization and the GRASE signal followed apparent T2 decay based on extended phase graph (EPG) simulation (Weigel, 2015). Zoomed imaging was achieved by switching excitation and refocusing gradients between slice and phase directions for inner-volume acquisition. One non-selective hyperbolic secant (HS) pulse was added within the duration of PLD and timing was optimized for suppressing background signal of T1 = 2.1 secs with nulling point 100 msec ahead of GRASE readout to avoid the cancellation of ASL signal when the signs of control and label signals are opposite. Optimized timing and background suppressed GM/WM signals are summarized in SI Fig. S2. Labeling efficiency was estimated by Bloch equation simulations using the numerical integration with inputs of pCASL parameters (FA, Gave, Gmax), average blood flow velocity and B1 according to (Maccotta et al., 1997). To reduce SAR deposition at 7T, we used a small FA of 15° for pCASL. Gave/Gmax = 0.6/10 mT/m were optimized by simulations to achieve highest labeling efficiency for slower blood flow velocity (15 cm/s) and B1 inhomogeneities (60, 80 and 100%) at labeling. Maximal Gmax/Gave ratio were limited to be 17 to avoid exceeding the scanner slew rate limit and potential eddy current artifacts. Fat saturation pulses were applied before GRASE readouts, the residual fat signal may be still visible in control/label images but will be cancelled out in perfusion images with pairwise subtraction of control/label images. M1 and V1 were identified from uniform (UNI) MP2RAGE (0.7-mm isotropic resolution, FOV=224×224 mm2, 224 sagittal slices, slice partial Fourier = 6/8, flip angle 1/2 =4°/5°, TE/TI1/TI2/TR=3.43/1000/3200/4500 msec, bandwidth=200 Hz/pixel, GRAPPA 3 and 37 PE reference lines, scan time=9 min 51 sec) images. ASL imaging volumes were placed perpendicular to the ‘omega’ or ‘epsilon’ shaped hand ‘knob’ of M1 (Caulo et al., 2007; Yousry et al., 1997) and parallel to a flat portion calcarine fissure (Daniel and Whitteridge, 1961) for motor and visual task experiments, respectively.
Intracranial vasculature was revealed by maximal-intensity-projection (MIP) of the UNI MP2RAGE images, and pCASL labeling plane was placed above the circle of Willis (CoW) and simultaneously perpendicular to the M3 segment of MCA, P2 segment of PCA and A2 segment of ACA (Fig.1B). Flow velocity at the labeled vessels was measured by ECG-gated phase-contrast MRI in two subjects. Average blood flow velocity at labeled arteries was 18.4±4.0 cm/sec. B1+ field maps were measured by 2D turbo-FLASH MRI and ROIs for intersections between the labeling plane and MAC/ACA/PCA were manually drawn on MP2RAGE (inv 1) images using ITK-SNAP (itksnap.org). Average B1+ at labeling was 74.0±11.5% of ideal B1+. Labeling efficiency = 82.1% was determined with the measured B1+ and flow velocity according to (Maccotta et al., 1997).
Motor and visual task experiments were conducted in two separate sessions. Each session included MP2RAGE, resting state ASL scans at two PLDs (500/1500 msec, 8 min 24 sec) and four runs of motor or visual task ASL scans (10 min 4 sec) at PLD=1000 msec. Total scan time was less than 70 mins per session. Each task run consisted of nine interleaved blocks (67.2 sec per block) with counterbalanced order of tasks and rest conditions (Fig. 1C, D). Two perfusion images were acquired in each block (one perfusion image per 33.6 s of data acquisition) and eighteen perfusion images were acquired in each task run. Resting state perfusion signals at PLD=1000 msec were extracted from the resting blocks of four task ASL runs. Resting state perfusion signals at three PLDs (500/1000/1500 msec) were used to calculate ATT, and task activation perfusion signals were acquired at the optimal PLD=1000 msec. Fig. 1C shows the paradigm of motor tasks, which consisted of unilateral finger tapping (sequential, frequency of 2 Hz) and finger brushing of the dominant hand. Participants were instructed to remain relaxed with their hands facing up during the brushing task. Participants’ fingers were brushed back and forth by a custom-made MRI safe brush at a frequency of 2 Hz. Fig. 1D shows the stimuli and paradigm of the visual task. Visual stimuli were generated in MATLAB (Mathworks Inc.) with psychophysics toolbox (https://www.psychtoolbox.net/). Stimuli were presented with the BOLDscreen 32 LCD (Cambridge Research Systems Ltd, Rochester, UK) installed at the end of MRI bore. Participants viewed the stimuli through a mirror mounted on top of the head coil. Subjects were required to keep fixation during the experiment. Before stimulus presentation, a central cue was presented at fixation for 1 second, then a pair of counter-phase flickering (7.5 Hz, 50% contrast) square wave checkerboards patterns (2 cycles per degree) were presented to the left and the right side of fixation. The size of the checkerboard discs were 7 degrees in diameter, presented at an eccentricity of 6 degrees. During the stimulus presentation, the spatial frequency of the two checkerboard patterns changed 7 times randomly and independently. Subjects were asked to pay attention to the cued checkerboard to detect occasional spatial frequency change of the attended stimulus in left or right vision field in two task runs. Successful detection of the cued pattern within 2 secs was recorded by pressing a button box. Average accuracy was 73.7±13.9% across participants. Motor and visual stimuli started 5 secs before activation ASL runs, and the plateau portion of the CBF dynamic response was average during acquisition.
2.3. Human participants
Six right-handed participants (age = 28.2±3.5 years, 2 males and 4 females) underwent motor task experiments and six participants with normal or corrected to normal vision (age = 27.7±3.7 years, 3 males and 3 females) underwent spatial visual attention experiments, respectively. All subjects refrained from caffeine intake three hours before the scan. All participants provided written informed consents according to a protocol approved by the Institutional Review Board (IRB) of the University of Southern California. Head motion was minimized by placing cushions on top and two sides of head and taping participant’s chin to coil. Experienced participants were recruited in this study and overall framewise displacement of ASL scans was less than 0.2 mm.
2.4. Signal processing
Partial Fourier reconstruction was done by the Projection Onto Convex Sets (POCS) method (Haacke et al., 1991). Dynamic ASL image volumes from resting state and task ASL runs were realigned and co-registered using SPM12 (Functional Imaging Laboratory, University College London, UK). Average framewise displacement (FD) of resting state and functional ASL runs were 0.08±0.03 and 0.19±0.07 mm in motor cortex and 0.09±0.03 and 0.13±0.03 in visual cortex. Control and label images were pairwise subtracted and summed to obtain raw perfusion and T2w GRASE-BOLD images respectively (Wong et al., 1997). Raw perfusion signals were normalized by proton density weighted M0 signals to obtain relative perfusion signals (%). Signal decay in k-space was prominent in partition direction due to long echo train length. A singular value decomposition (SVD) based deblurring algorithm was implemented and the diagram is shown in Fig. 2. k-space profile along partition direction was estimated by the extended phase graph (EPG) method (Weigel, 2015) with inputs of TE, flip angle train and T2 of arterial blood (68 msec (Krishnamurthy et al., 2014)) (Fig. 2A). The point spread function (PSF) of perfusion signal blurring along slice direction was calculated by 1-D Fourier transform of the k-space signal (Fig. 2B). Deblurring process can be considered as an inverse problem. Deblurred signal can be obtained by multiplying an inverse PSF (IPSF) matrix and acquired signal. IPSF was computed by SVD, and small singular values (elements of S < 0.1) were discarded to minimize noise amplification (Fig. 2C, D). FWHM of PSF along partition direction can be reduced from 2.15 mm to 1.37 mm (Fig. 2B). Fig. 2F and G show perfusion map from direct reconstruction (blurred along Z direction) and perfusion map processed by the proposed deblurring approach, respectively. Higher contrast between central sulcus and perfusion signal in M1 and S1 can be observed in the deblurred perfusion map.
Figure 2.
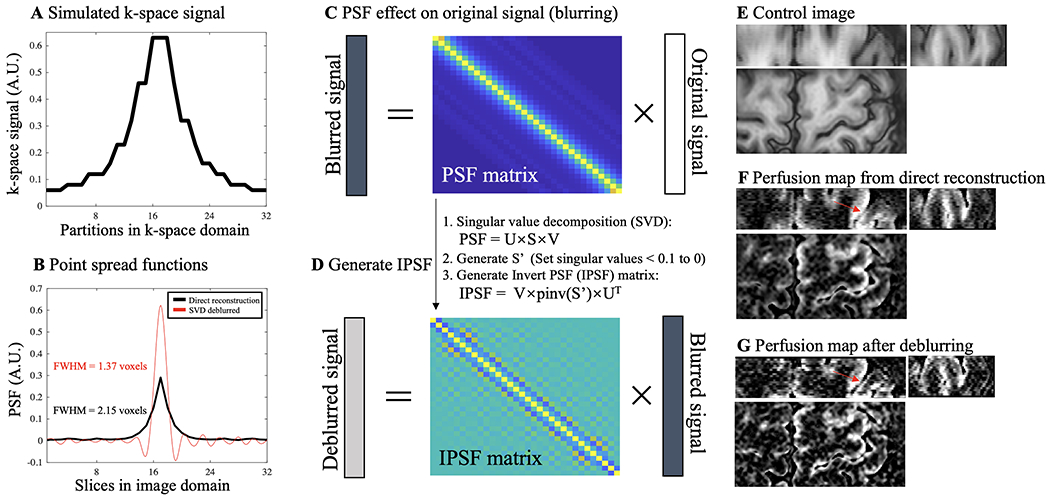
Diagram of a singular value decomposition (SVD) based deblurring process for ASL perfusion signal. A. k-space signal along 32 (24+33%oversampling) partitions was simulated by the extended phase graph (EPG) method with inputs of TE (26.78 msec), GRASE flip angle train and T2 of arterial blood (68 msec). Due to signal decay towards k-space boundaries, blurring of perfusion signal happens along slice direction. B. PSF, which indicates the degree of spatial blurring, of the perfusion signal was calculated by 1-D Fourier transform of the k-space signal and shown as the black trace (FWHM = 2.15 voxels). Red trace is the PSF after the deblurring process, as explained in C and D (FWHM = 1.37 voxels). C. Acquired perfusion signal (vector with size of 32×1) along slice direction can be expressed as the convolution between original signal (no blurring, vector with size of 32×1) and 1-D PSF. Convolution can be reformulated as multiplication between a PSF matrix (size of 32×32) and the original signal vector. D. Deblurring can be considered as an inverse problem and deblurred signal can be obtained by multiplying an inverse PSF (IPSF) matrix and blurred signal. We utilized a SVD based approach to solve IPSF. Smaller singular values (elements of S < 0.1) were discarded to minimize noise amplification. Deblurred PSF (red trace in B) can be calculated by multiplying IPSF and PSF from direction reconstruction (black trace in B). E, F and G show coronal (top left), sagittal (top right) and axial (bottom) views of control images, perfusion map from direct reconstruction (blurred along Z direction) and perfusion map processed by the proposed deblurring approach, respectively. Higher contrast between central sulcus and perfusion signal in M1 and S1 can be observed in the deblurred perfusion map (indicated by red arrows).
Resting state (PLD=1000 msec) and task activation perfusion signals were extracted and re-combined from four task ASL runs. ATT and resting state CBF map were simultaneously estimated from resting state perfusion signal at three PLDs using a weighted-delay approach (Wang et al., 2013). Task activation CBF was calculated according to (Alsop et al., 2015; Buxton et al., 1998) incorporating ATT (Alsop and Detre, 1996; Wang et al., 2002). A separate proton density weighted M0 image with the same zoomed GRASE readout was acquired for calibration. Arterial blood T1 = 2.1 sec, tissue-to-blood partition coefficient λ = 0.9 mL/g, labeling efficiency of 82.1% and 95% background suppression inversion efficiency were used for CBF quantification. CBF maps with visual attention stimuli in left or right visual fields were calculated, and corresponding hemispheres with and without attention were separated and re-combined to produce attended and unattended CBF maps. Absolute CBF (ΔCBF) and relative CBF (%CBF) changes were obtained by subtraction and division of task CBF and resting state CBF, and formulas are shown in Fig. 5C, D and Fig. 7C, D.
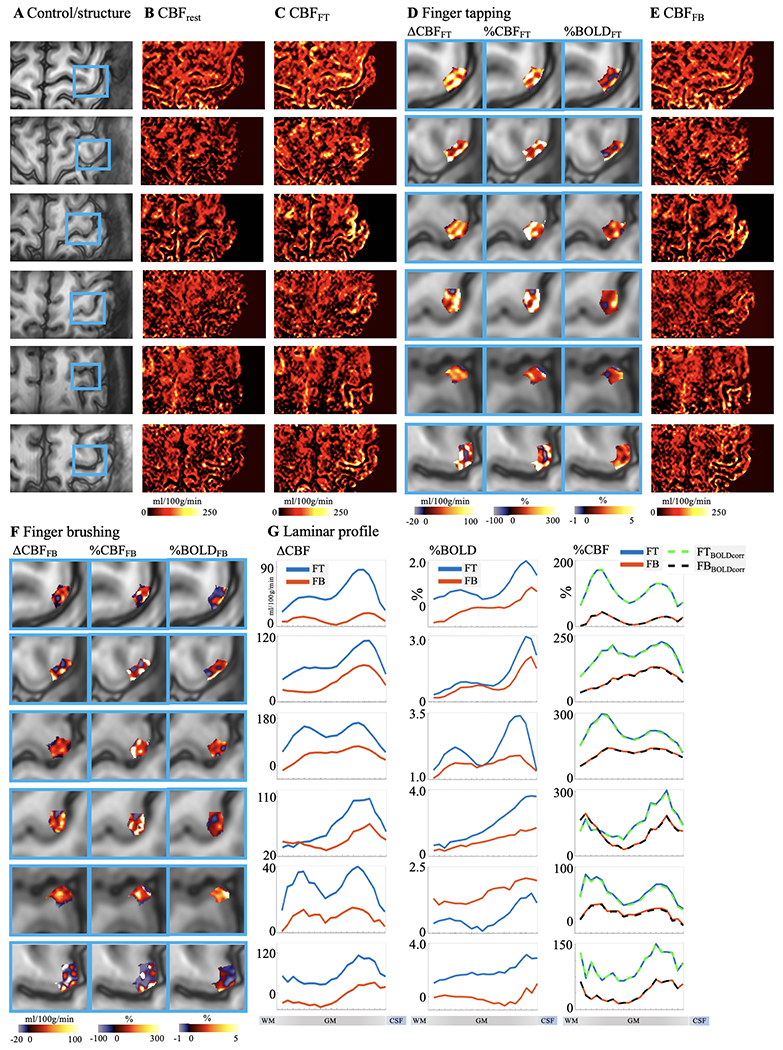
Figure 5.
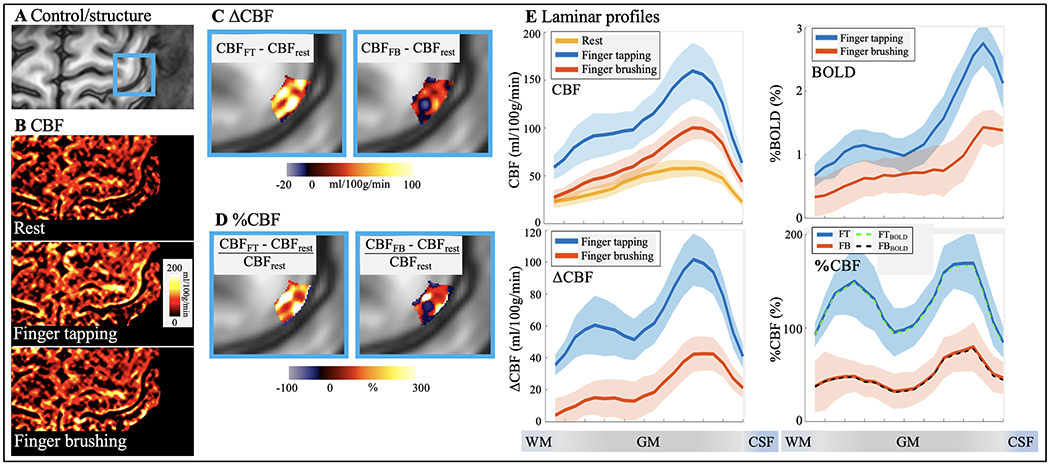
Motor tasks activated pCASL perfusion. A. GRASE image with hand knob area highlighted in blue box. B. CBF maps at rest, finger tapping and finger brushing. Absolute (C) and percentage (D) CBF increase evoked by the FT and FB tasks are highlighted in M1 hand knob area (blue boxes). E. Laminar profile of CBF at rest and two motor tasks (top left), percentage T2w GRASE-BOLD changes (top right), absolute (bottom left) and percentage (bottom right, dashed line (FTBOLD and FBBOLD) was adjusted for BOLD effects) CBF changes induced by two motor tasks. Both FT and FB induced BOLD signal changes are mostly in superficial layers. FT induced BOLD response shows a weak increase in deep layers; however, the two-peak pattern was not significant (P = 0.47) due to the large BOLD signal change in superficial layers. FT induced CBF increase shows a ‘two-peak’ pattern (P = 0.011 and P < 0.0002 for R2diff significance test of two-peak pattern of ΔCBF and %CBF, respectively) which corresponds to sensory input (superficial) and motor output (deep) layers respectively. FB induced CBF response shows a weaker increase in superficial layers which corresponds to exteroception sensory input and minimal motor output. Shaded areas indicate variations across subjects.
Figure 7.
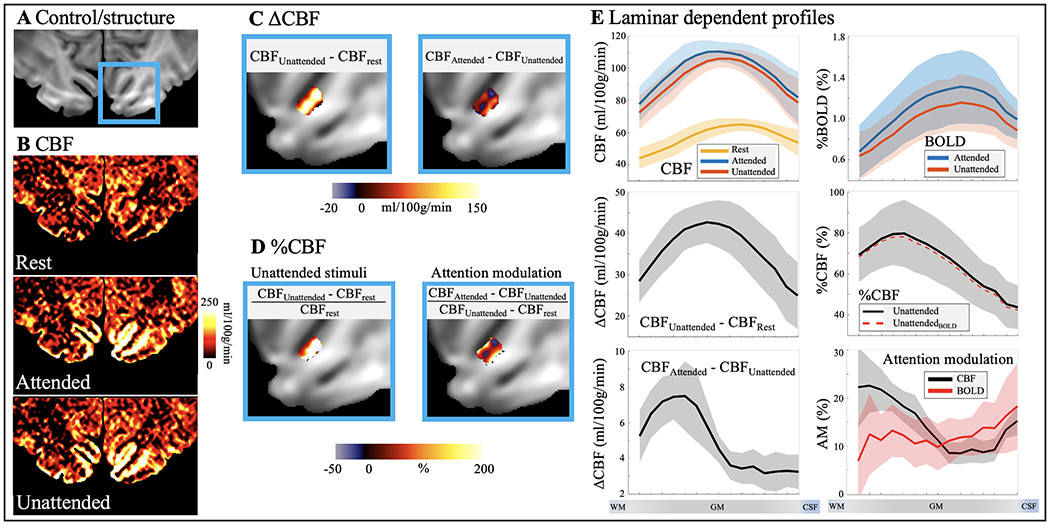
pCASL perfusion at spatial attention tasks. A. GRASE image with V1 highlighted in blue box. B. CBF maps at rest, attended and unattended visual stimuli. C. Absolute CBF increase evoked by unattended visual stimuli (left column) and spatial attention (right column) in V1. D. Relative CBF increase evoked by unattended visual stimuli (left column) and attention modulation (right column). E. Laminar profile of CBF at rest and with unattended and attended visual stimuli (top left), percentage BOLD changes (top right), absolute and relative CBF changes induced by unattended visual stimuli (middle panel, dashed lines were adjusted for BOLD effects), absolute CBF changes induced by spatial attention (bottom left) and CBF and BOLD response to attention modulation (bottom right). Both absolute and relative CBF increase evoked by unattended visual stimuli peak in middle layers. Absolute CBF increase evoked by spatial attention shows a large peak in deep layers while CBF profile of attention modulation shows a two-peak patten (P = 0.039 of R2diff two-peak pattern significance test). BOLD profile of attention modulation is relatively homogeneous across layers with a slight increase towards GM/CSF boundary (P = 0.063 of R2diff two-peak pattern significance test). Shaded areas indicate variations across subjects.
2.5. Segmentation of cortical layers in M1 and V1
ASL images were upscaled to a finer grid of 0.25×0.25×0.5 mm3 resolution to avoid singularities at the edges in angular voxel space using the AFNI ‘3dresample’ program with linear interpolation (Cox, 1996). The borderlines of CSF/GM and GM/WM in M1 hand-knob area (Caulo et al., 2007; Yousry et al., 1997) were manually drawn on ASL control images. Twenty cortical layers of M1 were segmented by LAYNII (Huber et al., 2021) using the equi-volume layering approach (Waehnert et al., 2014). Segmentation of cortical layers in V1 was done on reconstructed surface. A boundary-based algorithm was used to co-register structural MP2RAGE UNI images to ASL control images (Greve and Fischl, 2009; Saad et al., 2009). MP2RAGE volume was skull removed and segmented into WM, GM and CSF using FreeSurfer (7.1.1). AFNI/SUMA and custom python codes were used to generate the equi-volume surfaces (https://github.com/herrlich10/mripy) between WM and pial surfaces. Fifteen cortical layers in V1 were then projected back to volume space for analysis using the AFNI ‘3dSurf2Vol’ program with mapping function ‘max’ (https://afni.nimh.nih.gov/pub/dist/doc/program_help/3dSurf2Vol.html). Results of coregistration between MPRAGE UNI and ASL control images, and segmentation of cortical layers in V1 are shown in SI Fig. S3. ROIs of M1 were manually selected based on strong FT induced activation from the upper bank of omega-shaped hand-knob (Huber et al., 2017), and ROIs of V1 were defined based on visual activations in the unattended condition on the cortical surface of V1 (Ge et al., 2020; Liu et al., 2020). Laminar profiles were generated from all voxels within ROIs (157±21 voxels in each M1 layer and 7915±2013 voxels in each V1 layer were selected in upsampled space). Activation and attention modulation maps in V1 are shown in zoomed ROIs with two-peak attention modulation patterns in Fig. 7C and Fig. 8D,F,G for illustration purpose, while the laminar profiles were generated from larger V1 ROIs as shown in SI Fig. S3D. The equi-volume layering approach used in this study has been shown to have higher accuracy than the equi-distance model by taking into account the local curvature of pial and white matter surfaces into account (Waehnert et al., 2014). Considering the difference between cortical thickness in M1 (~4mm) and V1 (~2-3 mm) (Fischl and Dale, 2000), fifteen and twenty layers were segmented in V1 and M1 respectively. With a nominal 1 mm resolution, the effective resolution allows it to detect only ~4 independent data points. Hence, the defined cortical depths do not represent the MRI effective resolution. However, a large number of voxels randomly sampled at different cortical depth allowed us to derive a continuous laminar profile of neural activity (Huber et al., 2017).
Figure 8.
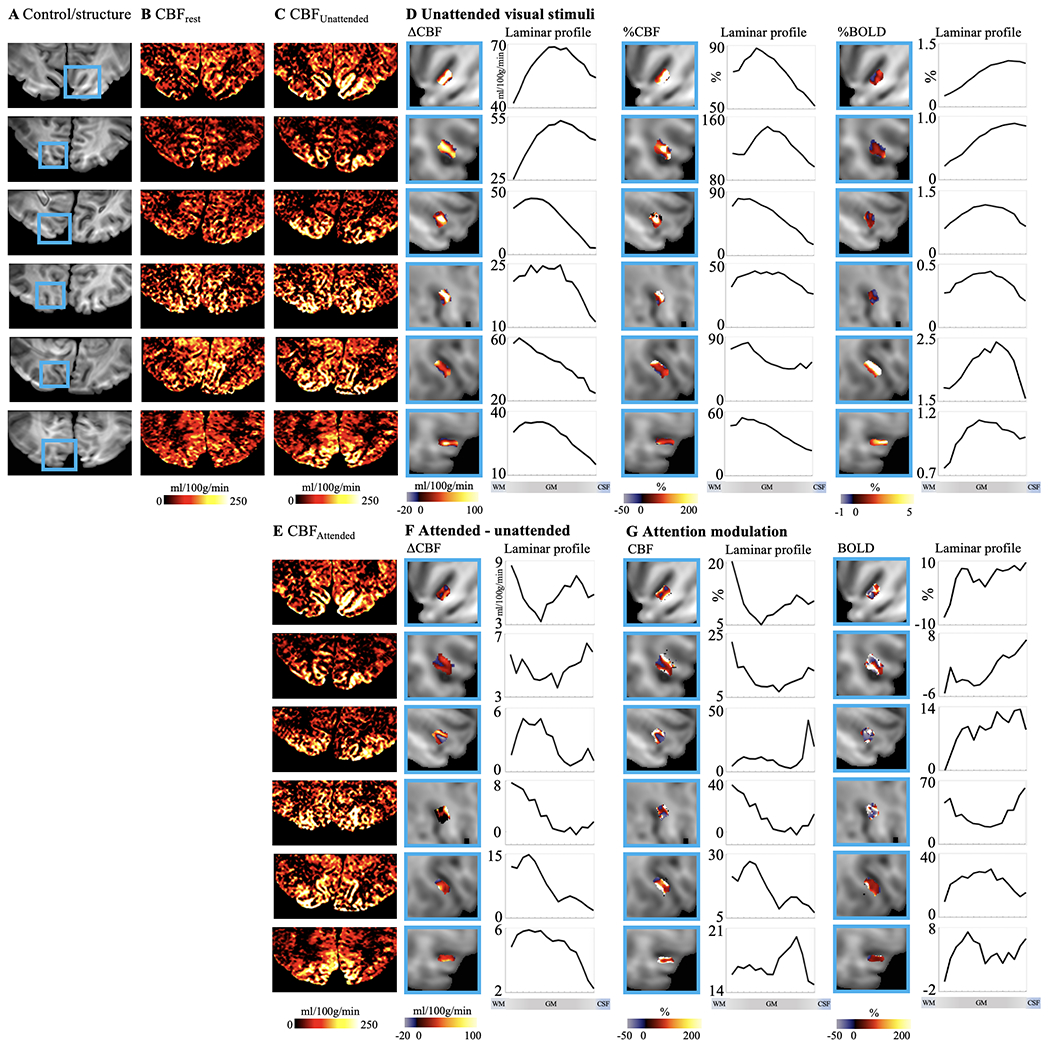
Individual results (displayed in each row) of ASL perfusion with spatial visual attention tasks. A. Control images with V1 highlighted in blue boxes. Resting stage CBF and CBF maps with unattended and attended visual stimuli are shown in B, C and E, respectively. Maps and laminar profiles of absolute CBF, relative CBF and BOLD signal change induced by unattended visual stimuli are shown in D. Maps and laminar profiles of absolute CBF change induced by attention are shown in F. Maps and laminar profiles of CBF and BOLD signal change corresponding to attention modulation are shown in G. CBF or BOLD signal changes are highlighted in blue box for illustration purpose. Laminar profiles were calculated from larger ROIs covering entire V1.
2.6. Significance test for two-peak activation pattern
Two-peak patterns were observed in CBF FT activation and attention modulation profiles. To test the significance of the two-peak pattern, we calculated R2diff for each profile. R2diff was defined as the difference between the adjust R2 estimated from curve fitting assuming two or single Gaussian distributions. Larger R2diff indicates the profile can be better described as two peaks instead of a single peak. Statistical significance of the R2diff was estimated by 5000 Boot strapping runs with random noise in each cortical layer estimated by inter-subject variation. P value was calculated as the probability that R2diff score of profile can be explained by noise only (SI Fig. S4). P < 0.05 was considered as significant.
2.7. Data and code availability statements
The data presented in this manuscript can be downloaded from our lab website (http://loft-lab.org/index-5.html). The pulse sequence will be available after we establish Material Transfer Agreement (MTA) between user’s institute and University of Southern California. MATLAB code for two-peak pattern significance test can be downloaded from our lab website (http://loft-lab.org/index-5.html).
3. Results
3.1. Laminar profile of Resting state ATT and CBF
Resting state perfusion scans were performed with the optimized zoomed 3D pCASL at 3 PLDs (500, 1000 and 1500 msec) on the motor and visual cortex, respectively. The acquired ASL control images exhibited high contrast between gray and white matter, and demonstrated sufficient coverage for the premotor, supplementary motor area (SMA), S1 and M1 areas of the motor cortex (Fig. 1A & Fig. 3A), as well as for V1 in the calcarine fissure of the visual cortex (Fig. 1A & Fig. 4A), respectively (Perfusion maps of twenty axial slices are shown in SI Fig. S5). Resting state perfusion maps at three PLDs and calculated ATT and CBF maps of motor and visual cortex are shown in Fig. 3B–D and Fig. 4B–D respectively.
Figure 3.
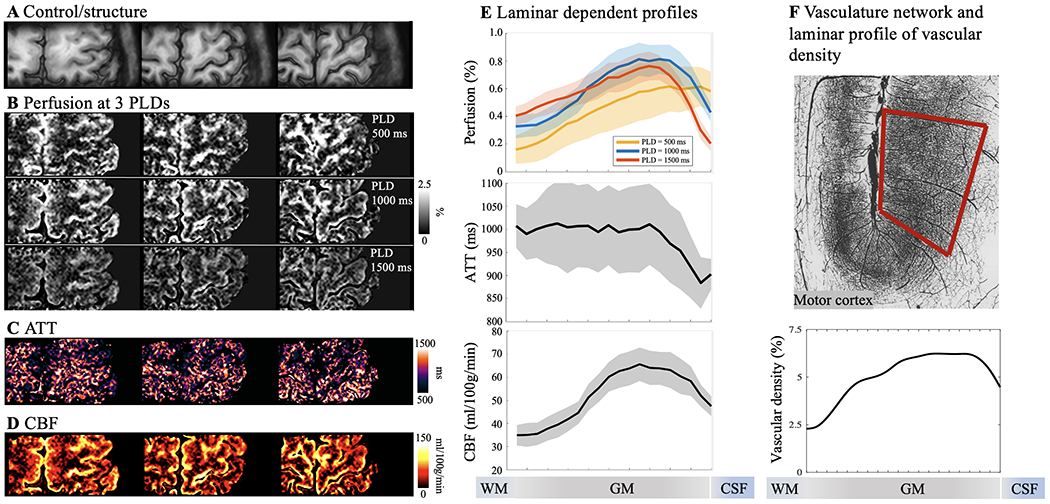
Resting state pCASL perfusion in motor cortex. A. Three slices of GRASE/control images demonstrating sufficient coverage for hand knob area in M1. B. Resting-state perfusion images acquired at three PLD of 500, 1000 and 1500 msec. Color bar indicates the percentage of perfusion signal in relation to M0. Maps of ATT (C) and resting state CBF (D) were estimated from multi-PLD perfusion signals using a weighted-delay approach. E. Laminar profiles of multi-PLD perfusion signals, ATT and resting state CBF. Perfusion signal peaks at GM/CSF boundary at an early PLD of 500 msec, and the perfusion signal peak shifts towards middle layers at later PLDs of 1000 and 1500 msec. Y-axis indicates the percentage of perfusion signal in relation to M0. ATT was lower at GM/CSF boundary indicating fast transit to pial arteries and became homogeneous in middle and deep layers. CBF was higher in middle layers indicates higher microvascular density. Shaded areas indicate variations across subjects. F. Vasculature network obtained from specimen of human brain in motor cortex (top row, frontal and parietal cortex on right and left side of central sulcus). Vessels are labeled in black and darker area indicate higher vascular density (Figure is adapted from (Duvernoy et al., 1981)). Laminar profile of relative vascular density (bottom row) calculated from inverted image intensity within the red box.
Figure 4.
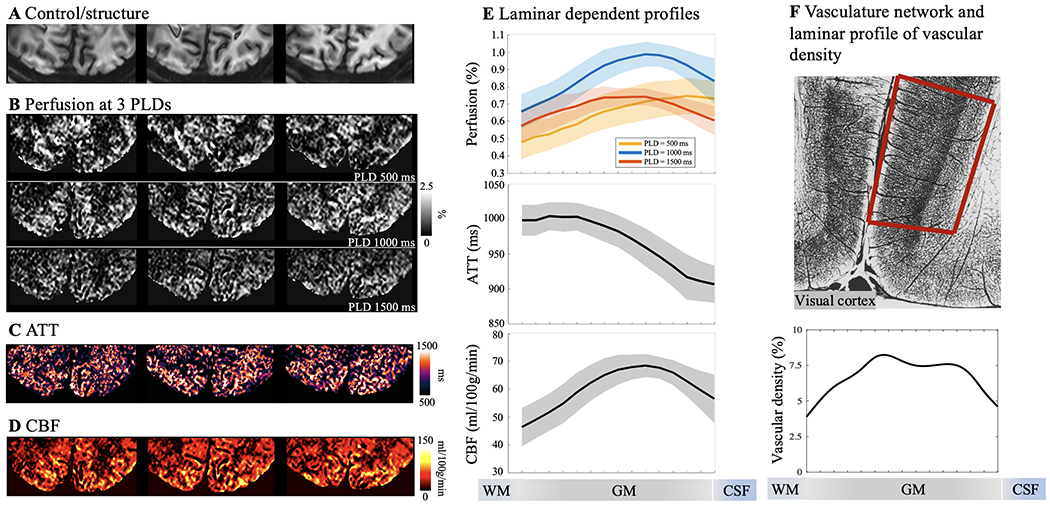
Resting state pCASL perfusion in visual cortex. A. Three slices of GRASE/control images demonstrating sufficient coverage for V1. B. Resting-state perfusion images acquired at three PLD of 500, 1000 and 1500 msec. Color bar indicates the percentage of perfusion signal in relation to M0. Maps of ATT (C) and resting state CBF (D) were estimated from multi-PLD perfusion signals using a weighted-delay approach. E. Laminar profiles of multi-PLD perfusion signals, ATT and resting state CBF. Perfusion signal peaks at GM/CSF boundary at an early PLD of 500 msec, and the perfusion signal peak shifts towards middle layers at later PLDs of 1000 and 1500 msec. Y-axis indicates the percentage of perfusion signal in relation to M0. ATT was lower at GM/CSF boundary indicating fast transit to pial arteries and became homogeneous in middle and deep layers. CBF was higher in middle layers indicates higher microvascular density. Shaded areas indicate variations across subjects. F. Vasculature network obtained from specimen of human brain in visual/striate cortex (top row). Vessels are labeled in black and darker area indicate higher vascular density (Figure is adapted from (Duvernoy et al., 1981)). Striate cortex exhibit a distinct characteristic that most dense vascular network is found in the internal granular layer (layer 4). Laminar profile of relative vascular density calculated from inverted image intensity within the red box.
The perfusion maps at the short PLD of 500 msec showed heterogeneous signals at the GM/CSF boundary, indicating insufficient time for the labeled blood to flow from the labeling plane to the cerebral cortex, and thus the majority of ASL signal still remained in pial arteries or arterioles. The perfusion maps at the longer PLD of 1000 and 1500 msec showed more homogeneous signal distribution with minimal signal remaining in CSF. As a result, the laminar profiles (Fig. 3E and Fig. 4E) of the perfusion signals at the PLD of 500 msec peaked at the GM/CSF boundary and monotonically decreased towards deep layers, while the peak perfusion signal at the PLD of 1000 and 1500 msec shifted towards middle layers. These findings are consistent with the laminar profiles of ATT (Fig. 3E and Fig. 4E) which were shortest in superficial layers (914.7±12.1 msec in M1 and 912.3±4.4 msec in V1, averaged from four layers at GM/CSF boundary) and increased towards middle to deep layers (1001.4±3.4 msec in M1 and 994.4±0.9 msec in V1, averaged from four layers at GM/WM boundary). Average resting state CBF (corrected for ATT) across cortical depths were 51.9±11.3 ml/100g/min in M1 and 60.3±7.2 ml/100g/min in V1 with peak CBF observed in a middle layer (65.6 ml/100g/min in M1 and 68.5 ml/100g/min in V1, Fig. 3E and Fig. 4E). Peak of resting state CBF is slightly shifted towards middle/deep layers in visual cortex likely due to dense vascular network in granular layer (layer 4) which does not exist in motor cortex. To the best of our knowledge, this is the first time that the time course of labeled blood flowing from pial arteries, arterioles to downstream microvasculature is shown in vivo on the human cerebral cortex. Our results of higher pial surface signal at short PLD is consistent with a previous ASL study in nonhuman primates (Zappe et al., 2008), and laminar profiles of CBF are highly consistent with microvascular density data measured on specimen of human motor and visual cortex (Duvernoy et al., 1981) (Fig. 3F & Fig. 4F).
3.2. ASL fMRI for quantifying input and output activity in M1
Perfusion fMRI scans were acquired at the PLD of 1000 ms when the majority of the labeled signal arrives at capillary/tissue space and the ASL signal reaches its peak (Fig. 3E). CBF maps at resting state and during the two motor tasks are shown in Fig. 5B. The two motor tasks elicited different laminar-dependent activation patterns. Strong and medium CBF increases evoked by the FT and FB tasks can be observed along M1 respectively, as displayed in two zoomed windows (Fig. 5C for absolute CBF change and Fig. 5D for relative CBF change). Both FT induced absolute (ΔCBF) and relative (%CBF) changes show clearly two peaks in deep (94.8±3.4 ml/100g/min or 159±7.8%) and superficial layers (57.5±1.4 ml/100g/min or 139±3.8%) respectively (Fig. 5E bottom panel, averaged from 5 layers adjacent to peak), consistent with the hypothesis that FT engages neural activity of both somatosensory and premotor input in the superficial layers and motor output in the deep layers (Huber et al., 2017; Mao et al., 2011; Weiler et al., 2008) (SI Fig. S1A).
Absolute CBF increase was much larger in the superficial layers than in the deep layers, suggesting that the superficial layers of M1 might involve extensive neural computations integrating the somatosensory and motor planning signals to generate motor output in the deep layers, which is consistent with VASO results (Beckett et al., 2020; Chai et al., 2020; Huber et al., 2015; Persichetti et al., 2020). This double peak pattern is highly reliable (P = 0.011 for ΔCBF and P < 0.0002 for %CBF, SI Fig. S4) and can be observed in all participants (Fig. 6). Motor task activated CBF maps in original resolution (1 mm3 isotropic) are shown in SI Fig. S6.
Figure 6.
Individual results (displayed in each row) of ASL perfusion with two motor tasks. A. Control images with M1 hand-knob areas highlighted in blue boxes. Resting stage CBF and CBF maps at FT and FB tasks are shown in B, C and E. Absolute CBF, relative CBF and T2w GRASE-BOLD signal change in M1 induced by FT and FB tasks are shown D and F. Laminar profiles of Absolute CBF (left column), BOLD signal (middle column) and relative CBF change (right column, dashed traces were corrected for BOLD effect) evoked by FT (blue trace) and FB (orange trace) are shown in G.
FB-induced CBF increase was much smaller averaged cross cortical layers compared to that of the FT task. The perfusion response mainly peaked in superficial layers (Fig. 5E bottom panel, 38.8±2.7 ml/100g/min or 69.3±5.7% and 15.3±0.9 ml/100g/min or 45.2±1.5% in the superficial and deep layers (averaged from 5 layers adjacent to peak) respectively), consistent with the hypothesis that FB primarily engages somatosensory input and minimal motor output (SI Fig. S1A). These results demonstrate the high spatial specificity of ASL, capable of resolving and further quantifying layer-dependent input and output activity in human M1. Both FT and FB induced BOLD signal changes are mostly in superficial layers (Fig. 5E top right). FT induced BOLD response shows a weak increase in deep layers; however, the two-peak pattern was not significant (P = 0.47) due to the large BOLD signal change in superficial layers. Furthermore, correction of BOLD signal (dividing %CBF by %BOLD) which was on the order of 1-2% had minimal effect on perfusion signal changes (Fig. 5E lower right dashed trace) (Wong et al., 1997). Our results are highly consistent with CBV fMRI data, nevertheless ASL fMRI provides additional measurements of both absolute and relative CBF changes with FT and FB inducing 73.6±12.5 ml/100g/min and 26.0±6.4 ml/100g/min or 160.6±28.6% and 51.5±22.0% CBF increase across all cortical depths. This is the first time that such detailed quantitative information on both absolute and relative perfusion activation related to the input and output activity of the motor cortex is visualized in vivo.
3.3. ASL fMRI for quantifying feedforward and feedback activity in V1
Resting state CBF and visual attention activated CBF maps are shown in Fig. 7B. The attended and unattended visual stimuli induced strong CBF increases localized along the gyri and sulci of visual cortex. Absolute CBF increases to unattended visual stimuli over baseline and attended over unattended stimuli are displayed in two zoomed windows (Fig. 7C). Fig. 7D shows the relative CBF change evoked by unattended visual stimuli over baseline (left column) and the multiplicative effect of attention modulation map (right column) defined as the ratio between CBF increase evoked by top-down attention (attended-unattended) and stimulus-driven response (unattended-baseline). Fig. 7E shows the laminar profile of CBF at rest and with unattended and attended visual stimuli (top left), BOLD changes (top right), absolute and relative CBF changes induced by unattended visual stimuli (middle panel, BOLD corrected relative CBF changes are also shown), absolute CBF changes induced by top-down attention (bottom left), and CBF and BOLD response to attention modulation (bottom right).
Both absolute and relative CBF increase evoked by unattended visual stimuli peak in middle layers, consistent with the hypothesis that that feedforward visual input from the lateral geniculate of the thalamus mainly reaches the middle layers of V1 (Felleman and Van Essen, 1991; Liu et al., 2020) (SI Fig. S1B). Average absolute and relative CBF increase evoked by unattended visual stimuli were 35.9±5.9 ml/100g/min and 65.6±12.4% across cortical layers, which is consistent with a recent study (Kashyap et al., 2021). Absolute CBF increase evoked by top-down attention shows a large peak in deep layers while the CBF profile of multiplicative attention modulation shows a two-peak pattern (P = 0.039 of two-peak pattern significance test, SI Fig. S4) in both deep (19.0±1.7%, two-layer average) and superficial layers (14.5±1.8%, two-layer average) versus middle layers (8.3±0.5%, two-layer average). These results are consistent with the hypothesis that attention operates through feedback pathways involving both deep and superficial layers (Felleman and Van Essen, 1991; Liu et al., 2020) (SI Fig. S1B). The single-peak pattern of unattended visual stimulation and double peak pattern of attention modulation is highly reliable and was observed in all participants (Fig. 8). In contrast, BOLD profile of attention modulation is relatively flat across layers with a slight increase towards GM/CSF boundary (P = 0.063 of two-peak pattern significance test). Visual task activated CBF maps in original resolution (1 mm3 isotropic) are shown in SI Fig. S6.
4. Discussion
We demonstrated that multi-delay ASL can reveal perfusion changes with PLD and quantify ATT and resting state CBF across cortical layers. Vascular architecture in human brain is specialized to maintain and regulate blood supply through surface pial arterioles (Schaffer et al., 2006), the subsurface microvascular bed and penetrating arterioles bridging the surface and subsurface networks (Baran et al., 2015). We found baseline ATT was shortest at GM and CSF boundaries indicating fast arrival of blood at pial arteries on cortical surfaces. ATT in middle and deep layers were rather homogeneous indicating a fast transit through penetrating arterioles to the subsurface microvascular bed (Baran et al., 2015; Duvernoy et al., 1981; Nishimura et al., 2007). Based on ATT profiles, we chose PLD=1000 msec for activation ASL scans in M1 and V1 for highest SNR. Optimal PLD for activation ASL in other brain regions may vary and needs to be determined by multi-delay ASL scans. Qiu et al., found ATT decreased ~80 msec during both visual and motor tasks (Qiu et al., 2010). The difference between resting-state and activation ATT doesn’t affect the CBF quantification when baseline ATT is shorter than PLD (Alsop et al., 2015; Buxton et al., 1998). However, task activation CBF can be overestimated by ~10% when baseline ATT is 100-500 msec longer than PLD. The laminar profile of baseline CBF exhibited a single peak around the middle layers and monotonically decreased towards deep and superficial layers in both M1 and V1. The CBF profile matches well with the highest capillary density observed in the middle layers as reported in anatomic studies in specimens of human brain tissue (Duvernoy et al., 1981; Lauwers et al., 2008). Additionally, we observed the peak of resting state CBF in visual cortex is more into deep layers as compared to motor cortex, which likely corresponds to a granular layer with high vascular density in visual cortex. Pathological ATT or CBF heterogeneity across cortical layers might be associated with disturbances in endoneurial metabolism or capillary morphology and implicate a number of diseases including stroke (Nishimura et al., 2007; Østergaard et al., 2013c), ischemia (Østergaard et al., 2013b), Alzheimer’s disease (Østergaard et al., 2013a), traumatic brain injury (Østergaard et al., 2014), and diabetic nephropathy (Østergaard et al., 2015). Studying laminar dependent perfusion and ATT changes may provide meaningful insights into the progression of neurological diseases.
We further demonstrated the sensitivity and spatial specificity of the proposed ASL fMRI in differentiating and quantifying input and output-driven neural activities in M1. Compared to the concurrently acquired T2w BOLD contrast, ASL fMRI was able to detect two separate peaks in superficial and deep layers of M1 (Fig. 5) across all participants (Fig. 6). Although zoomed GRASE T2w BOLD signal has shown high specificity with minimal venous bias (Beckett et al., 2020), the two-peak pattern was not significant in this study probably due to background suppression. And specificity of BOLD signals may be further improved by applying vein removal models (Havlicek and Uludağ, 2020). Our result is highly consistent with VASO fMRI data (Huber et al., 2015), supporting that both CBF and CBV based laminar fMRI can differentiate input and output activities of human M1. Nevertheless, CBF-based fMRI provides both absolute and relative perfusion activation, thereby more quantitative information on the magnitude of neural activation across cortical layers. In contrast, VASO fMRI usually measures absolute CBV changes but lacks baseline CBV, which can be separately measured by a multi-TI approach (Hua et al., 2011). Furthermore, the proposed ASL fMRI is robust to potential BOLD contamination which is on the order of 1-2%. The quantitative measurement of CBF increases to the finger tapping task revealed a larger peak in the superficial layers than in the deep layers, suggesting an important role of M1 superficial layers integrating the input signals from somatosensory and premotor cortex to generate motor output in the deep layers (Persichetti et al., 2020).
ASL fMRI was also applied with a visual spatial attention task to detect and quantify feedforward and feedback activities in the visual cortex. We observed multiplicative attention modulation in both deep and superficial layers while unattended visual stimuli induced peak CBF increase mainly in the middle layers (Fig. 7). Furthermore, the quantitative perfusion changes induced by top-down attention shows a single large peak in the deep layers. The peak of attention modulation in the deep layers was not clearly visible in concurrently acquired T2w BOLD contrast. Our result is highly consistent with the known neuroanatomy of feedforward and feedback visual pathways (Felleman and Van Essen, 1991), further supporting the high sensitivity and spatial specificity of CBF-based fMRI. The superficial and deep layers of V1 receive feedback inputs from higher cortical areas. The superficial layers also send output to higher order visual cortex, while the deep layers send output to the subcortical visual areas including the lateral geniculate nucleus (LGN) (Balaram et al., 2014; Liu et al., 2020). The multiplicative effect of attention modulation in both superficial and deep layers suggests that the control of attention operates thorough descending feedback pathway from higher cortical areas, while the predominant increase of absolute CBF in the deep layers suggest that the effect of attention mainly amplifies output signals to the subcortex (Balaram et al., 2014; Liu et al., 2020) (SI Fig. S1B).
Recent studies demonstrated the feasibility of performing ASL fMRI with high spatial resolutions (Kashyap et al., 2021; Taso et al., 2021). At ultra-high fields, ASL has the dual benefits of long tracer half-life determined by blood T1 (Zuo et al., 2013) and a super-linear relationship between SNR and field strength (Pohmann et al., 2016), resulting in a ~3 fold SNR increase at 7T as compared to 3T. However, shorter arterial blood T2 (68 msec) at 7T (Krishnamurthy et al., 2014) places a strict limit on the choice of TE to minimize signal loss as well as blurring along slice direction. We achieved minimal TE and echo-train length using zoomed imaging with half FOV along phase encoding direction, partial Fourier acquisition and segmented readout. Signal blurring along slice direction was further minimized by POCS reconstruction and a SVD based deblurring algorithm. Our labeling plane simultaneously labeled ACA, MCA and PCA, and high labeling efficiency (>80%) can be maintained when the arteries are not strictly perpendicular to the labeling plane (angle<600) according to simulations. For studies in the frontal region of the brain, labeling plane needs to be adjusted to avoid interference with frontal lobe and possibly target different segments of ACA and MCA (El-Baba and Schury, 2020). In this study, B0 is relatively homogeneous above the Circle of Willis (< ±50 Hz in >75% voxels) and has limited impact (<5%) on the labeling efficiency. For other labeling locations close to air/tissue interfaces, optimized pCASL labeling scheme with short RF duration and gap can be utilized to improve the robustness to B0 inhomogeneity (Wang et al., 2021).
We proposed a truncated-SVD based deblurring algorithm to partially restore the slice resolution (Fig. 2). The resultant point-spread function (PSF) of our method was 1.37 pixel which is sharper than or comparable to the PSFs of BOLD and CBV fMRI (Beckett et al., 2020). We performed simulations with digital phantoms to demonstrate that the proposed algorithm didn’t introduce artificial edge-enhancement features. Phantom results are summarized in SI Fig. S7. SI Fig. S8 shows individual and six-subject averaged laminar profiles of FT induced absolute CBF change, and the proposed deblurring algorithm improved the separation of FT induced CBF activation in deep and superficial layers. The proposed algorithm relies on accurate estimation of PSF of acquired perfusion signal. Variation in T2 (i.e. GM T2 = 55 msec (Emmerich et al., 2019)) and imperfect partial Fourier reconstruction can lead to 30% wider PSF of acquired signal and under-performance of the deblurring algorithm (or avoids over-correction). Singular value threshold of 0.1 provides reasonable deblurring effect in this study. Threshold smaller than 0.1 can potentially further reduces the FWHM of deblurred PSF but likely causes noise amplification and artifacts (SI Fig. S9). For example, the stripe-like patterns shown in the raw perfusion map (SI Fig. S9B) were enhanced upon applying the deblurring algorithm (SI Fig. S9C) and amplified to artificial vertical strips with a smaller threshold, as indicated by a red arrow in SI Fig. S9D. Advanced deblurring algorithm with boundary constraints and regularizations will be helpful to improve SNR and restore signal near boundary slices.
Background suppression was utilized in this study to improve SNR as recommended by (Alsop et al., 2015). However, single inversion pulse will lead to opposite sign between GM and CSF signals and potential cancelation of ASL signal in superficial layers when control signal is close to zero. We carefully optimized the BS timing to maintain sufficient GM signal after background suppression for three PLDs (SI Fig. S2). Instead of nulling GM signal at readout, we increased target nulling T1 to 2.1 secs and shifted nulling point 100 msec ahead of GRASE readout so that both control and label signals will be positive at readout. As a result, background suppressed GM signals were 8-10% of the original signal intensity (SI Fig. S2), which is lower than the 35.4% BS suppressed GM signal reported in a recent 7T pCASL study with 2D EPI readout (Meixner et al., 2021). Additionally, we acquired resting state ASL data in M1 at PLD = 1000 msec from two healthy volunteers (2 Males, age = 29/25 years) with and without background suppression (10 min 4 sec each scan) to demonstrate the impact of BS on superficial layer signals. Results are summarized in SI Fig. S10. Laminar profile of phase difference between complex control and label signals demonstrate that negative CSF signal has impact on perfusion signal in superficial layers with average ΔPhase < 15° (SI Fig. S10E). SI Fig. S10 D and F show maps and laminar profiles of perfusion signals with/without BS and calculated by complex subtraction. Two-subject averaged tSNR increased 52.1% with BS (0.70±0.13) as compared to no BS (0.46±0.19). And resting-state perfusion acquired with BS showed similar decreasing pattern towards superficial layers as compared to no BS and complex subtraction results. The impact of BS on resting-state laminar profiles acquired at different PLDs may vary with different inversion times and residual signals. Acquiring data without BS can minimize the potential CSF contamination on superficial layers, but longer scan time is required to improve SNR.
Relatively long volume TR is one limitation of this study due to segmented readout and we didn’t capture the dynamic CBF response to stimuli (Kashyap et al., 2021; Kim and Kim, 2010). Potentially our technique can be combined with accelerated image acquisition and stimulus-dithering methods to acquire dynamic CBF changes (Kim et al., 2020). With a nominal 1 mm resolution, the effective resolution allows it to detect only ~4 and ~2-3 independent data points across cortical depth in M1 and V1 respectively (Fischl and Dale, 2000), and the specificity of CBF fMRI can be improved with higher spatial resolution (i.e. <0.75 mm) (Huber et al., 2019; Kashyap et al., 2021; Pfeuffer et al., 2002). Both imaging coverage and temporal resolution of the proposed technique can be further improved by utilizing accelerated image acquisition and constrained reconstructions (Park et al., 2021; Spann et al., 2020). Other image acquisition methods such as 3D EPI with FAIR can be utilized to improve temporal and spatial resolution (0.9 mm isotropic) and is less sensitive to motion between segments while T2*/BOLD contributions can be mitigated by dividing BOLD or EPI images (Huber et al., 2015; Kashyap et al., 2021). Non-Cartesian readouts such as Stack-of-Spirals (SoS) may also be utilized to minimize T2*/BOLD contaminations (Chang et al., 2017). Distortion correction was not applied in our study as distortions were not noticeable upon visual inspection (SI Fig. S3E). Although sinc subtraction was proposed to minimize signal fluctuations due to temporal offset between control and label images (Aguirre et al., 2002; Wang et al., 2003), pairwise subtraction was used for simplicity and to avoid interpolation error for layer fMRI. Differences in perfusion signals computed from two subtraction methods were relatively small (~5%). We proposed using R2diff for significance test of the two-peak activation pattern. Other measures including Hartigan’s dip statistic (HDS), bimodality coefficient (BC), Akaike’s information criterion (AIC) (Freeman and Dale, 2013) and Larkin’s-F-scores (Huber et al., 2017; Larkin, 1979) were also proposed for multimodality versus unimodality test. For comparison, we performed AIC test, which deals with the trade-off between goodness of fit and simplicity of the model (Freeman and Dale, 2013). We found AICdiff score were positive for FT induced ΔCBF (AICdiff = 0.02, Fig. 5E) and CBF profiles of attention modulation (AICdiff = 0.09, Fig. 7E), which indicates bimodality and consistent with the proposed R2diff test. However, AICdiff was negative for laminar profiles of FT induced %CBF (AICdiff = −0.01, Fig. 5E) suggesting the profile can be slightly better explained by unimodality. This difference suggests the proposed R2diff test may not fully reconcile the potential issues of over fitting and degrees of freedom, and the findings need to be confirmed with higher SNR data. It is also feasible to perform perfusion based functional connectivity analysis of brain network dynamics with increased coverage and temporal resolution (Jann et al., 2015). The proposed technique can be further extended to obtain concurrent CBF, BOLD and CBV measurements for mapping metabolic activities (Yang et al., 2004). With the advent of even higher field strength of 10.5T MRI machine (Ertürk et al., 2017) and high density array coils (Petridou et al., 2013), the sensitivity and resolution of zoomed pCASL can be further improved.
In conclusion, we demonstrated high spatial specificity and sensitivity of laminar perfusion fMRI using 3D zoomed pCASL at 7T in detecting and quantifying the input versus output and feedforward versus feedback activities of neural circuits in the motor and visual cortices. With the unique capability for quantitative CBF measurements both at baseline and during task activation, high-resolution ASL perfusion fMRI at 7T provides an important tool for in vivo assessment of neurovascular function and metabolic activities of neural circuits across cortical layers.
Supplementary Material
Highlights:
Zoomed 3D ASL technique at 7T for laminar perfusion imaging.
Quantitative CBF measurements both at baseline and during task activation.
Laminar profiles of ATT and CBF consistent with cortical microvascular density.
Two-peak CBF finger tapping activation in human motor cortex.
Predominant CBF increase in deep layers by visual spatial attention.
5. Acknowledgments
This work was supported by the National Institute of Health (NIH) grant UH3-NS100614, S10-OD025312, R01-NS114382, R01-EB032169 and R01-EB028297.
6. References
- Aguirre GK, Detre JA, Zarahn E, Alsop DC, 2002. Experimental design and the relative sensitivity of BOLD and perfusion fMRI. Neuroimage 15, 488–500. [DOI] [PubMed] [Google Scholar]
- Alsop DC, Detre JA, 1996. Reduced transit-time sensitivity in noninvasive magnetic resonance imaging of human cerebral blood flow. Journal of Cerebral Blood Flow & Metabolism 16, 1236–1249. [DOI] [PubMed] [Google Scholar]
- Alsop DC, Detre JA, Golay X, Günther M, Hendrikse J, Hernandez-Garcia L, Lu H, MacIntosh BJ, Parkes LM, Smits M, 2015. Recommended implementation of arterial spin-labeled perfusion MRI for clinical applications: A consensus of the ISMRM perfusion study group and the European consortium for ASL in dementia. Magnetic resonance in medicine 73, 102–116. [DOI] [PMC free article] [PubMed] [Google Scholar]
- Amunts K, Zilles K, 2015. Architectonic Mapping of the Human Brain beyond Brodmann. Neuron 88, 1086–1107. [DOI] [PubMed] [Google Scholar]
- Balaram P, Young NA, Kaas JH, 2014. Histological features of layers and sublayers in cortical visual areas V1 and V2 of chimpanzees, macaque monkeys, and humans. Eye and brain 6, 5. [DOI] [PMC free article] [PubMed] [Google Scholar]
- Baran U, Li Y, Wang RK, 2015. Vasodynamics of pial and penetrating arterioles in relation to arteriolo-arteriolar anastomosis after focal stroke. Neurophotonics 2, 025006. [DOI] [PMC free article] [PubMed] [Google Scholar]
- Beckett AJ, Dadakova T, Townsend J, Huber L, Park S, Feinberg DA, 2020. Comparison of BOLD and CBV using 3D EPI and 3D GRASE for cortical layer functional MRI at 7 T. Magnetic resonance in medicine 84, 3128–3145. [DOI] [PMC free article] [PubMed] [Google Scholar]
- Broadman K, 1909. Vergleichende Lokalisationslehre der Grosshirnrinde in ihren Prinzipien dargestellt auf Grund des Zellenbaues : Brodmann, K : Free Download, Borrow, and Streaming : Internet Archive. Leipzig, Barth. [Google Scholar]
- Buxton RB, Frank LR, Wong EC, Siewert B, Warach S, Edelman RR, 1998. A general kinetic model for quantitative perfusion imaging with arterial spin labeling. Magnetic resonance in medicine 40, 383–396. [DOI] [PubMed] [Google Scholar]
- Caulo M, Briganti C, Mattei P, Perfetti B, Ferretti A, Romani G, Tartaro A, Colosimo C, 2007. New morphologic variants of the hand motor cortex as seen with MR imaging in a large study population. American Journal of Neuroradiology 28, 1480–1485. [DOI] [PMC free article] [PubMed] [Google Scholar]
- Chai Y, Li L, Huber L, Poser BA, Bandettini PA, 2020. Integrated VASO and perfusion contrast: A new tool for laminar functional MRI. NeuroImage 207, 116358. [DOI] [PMC free article] [PubMed] [Google Scholar]
- Chaigneau E, Oheim M, Audinat E, Charpak S, 2003. Two-photon imaging of capillary blood flow in olfactory bulb glomeruli. Proceedings of the National Academy of Sciences 100, 13081–13086. [DOI] [PMC free article] [PubMed] [Google Scholar]
- Chang YV, Vidorreta M, Wang Z, Detre JA, 2017. 3D-accelerated, stack-of-spirals acquisitions and reconstruction of arterial spin labeling MRI. Magnetic resonance in medicine 78, 1405–1419. [DOI] [PMC free article] [PubMed] [Google Scholar]
- Chen Z, Xue R, Zhang P, Sun K, Zuo Z, An J, Chen J, He S, Chen L, Wang DJJ, 2017. Multi-phase passband balanced SSFP fMRI with 50 ms sampling rate at 7 Tesla enables high precision in resolving 100 ms neuronal events. Magnetic Resonance Imaging 35, 20–28. [DOI] [PubMed] [Google Scholar]
- Cox RW, 1996. AFNI: software for analysis and visualization of functional magnetic resonance neuroimages. Computers and Biomedical research 29, 162–173. [DOI] [PubMed] [Google Scholar]
- Daniel P, Whitteridge D, 1961. The representation of the visual field on the cerebral cortex in monkeys. The Journal of physiology 159, 203–221. [DOI] [PMC free article] [PubMed] [Google Scholar]
- Detre JA, Wang JJ, 2002. Technical aspects and utility of fMRI using BOLD and ASL. Clinical Neurophysiology 113, 621–634. [DOI] [PubMed] [Google Scholar]
- Duong TQ, Kim DS, Ugurbil K, Kim SG, 2001. Localized cerebral blood flow response at submillimeter columnar resolution. Proc Natl Acad Sci U S A 98, 10904–10909. [DOI] [PMC free article] [PubMed] [Google Scholar]
- Duvernoy HM, Delon S, Vannson J, 1981. Cortical blood vessels of the human brain. Brain research bulletin 7, 519–579. [DOI] [PubMed] [Google Scholar]
- El-Baba RM, Schury MP, 2020. Neuroanatomy, frontal cortex. [PubMed] [Google Scholar]
- Emmerich J, Flassbeck S, Schmidt S, Bachert P, Ladd ME, Straub S, 2019. Rapid and accurate dictionary-based T2 mapping from multi-echo turbo spin echo data at 7 Tesla. Journal of Magnetic Resonance Imaging 49, 1253–1262. [DOI] [PubMed] [Google Scholar]
- Ertürk MA, Wu X, Eryaman Y, Van de Moortele PF, Auerbach EJ, Lagore RL, DelaBarre L, Vaughan JT, Uğurbil K, Adriany G, 2017. Toward imaging the body at 10.5 tesla. Magnetic resonance in medicine 77, 434–443. [DOI] [PMC free article] [PubMed] [Google Scholar]
- Feinberg DA, Hoenninger J, Crooks L, Watts J, Kaufman L, Arakawa M. 1985.Inner Volume MR imaging: Technical concepts and their application. Radiology 156, 743–747. [DOI] [PubMed] [Google Scholar]
- Feinberg DA. Ramanna S. 2015. Arterial spin labeled, segmented, interleaved 3D GRASE MRI, US patent 7898254.
- Felleman DJ, Van Essen DC, 1991. Distributed hierarchical processing in the primate cerebral cortex. Cerebral cortex (New York, NY: 1991) 1, 1–47. [DOI] [PubMed] [Google Scholar]
- Fischl B, Dale AM, 2000. Measuring the thickness of the human cerebral cortex from magnetic resonance images. Proceedings of the National Academy of Sciences 97, 11050–11055. [DOI] [PMC free article] [PubMed] [Google Scholar]
- Freeman JB, Dale R, 2013. Assessing bimodality to detect the presence of a dual cognitive process. Behavior research methods 45, 83–97. [DOI] [PubMed] [Google Scholar]
- Gardener A, Gowland P, Francis S, 2009. Implementation of quantitative perfusion imaging using pulsed arterial spin labeling at ultra-high field. Magnetic Resonance in Medicine: An Official Journal of the International Society for Magnetic Resonance in Medicine 61, 874–882. [DOI] [PubMed] [Google Scholar]
- Ge Y, Zhou H, Qian C, Zhang P, Wang L, He S, 2020. Adaptation to feedback representation of illusory orientation produced from flash grab effect. Nature communications 11, 1–12. [DOI] [PMC free article] [PubMed] [Google Scholar]
- Greve DN, Fischl B, 2009. Accurate and robust brain image alignment using boundary-based registration. Neuroimage 48, 63–72. [DOI] [PMC free article] [PubMed] [Google Scholar]
- Haacke EM, Lindskogj E, Lin W, 1991. A fast, iterative, partial-Fourier technique capable of local phase recovery. Journal of Magnetic Resonance (1969) 92, 126–145. [Google Scholar]
- Hall CN, Reynell C, Gesslein B, Hamilton NB, Mishra A, Sutherland BA, O’Farrell FM, Buchan AM, Lauritzen M, Attwell D, 2014. Capillary pericytes regulate cerebral blood flow in health and disease. Nature 508, 55–60. [DOI] [PMC free article] [PubMed] [Google Scholar]
- Hamilton NB, Attwell D, Hall CN, 2010. Pericyte-mediated regulation of capillary diameter: a component of neurovascular coupling in health and disease. Frontiers in neuroenergetics 2, 5. [DOI] [PMC free article] [PubMed] [Google Scholar]
- Havlicek M, Uludağ K, 2020. A dynamical model of the laminar BOLD response. NeuroImage 204, 116209. [DOI] [PubMed] [Google Scholar]
- Hua J, Qin Q, Pekar JJ, van Zijl PC, 2011. Measurement of absolute arterial cerebral blood volume in human brain without using a contrast agent. NMR in biomedicine 24, 1313–1325. [DOI] [PMC free article] [PubMed] [Google Scholar]
- Huber L, Goense J, Kennerley AJ, Trampel R, Guidi M, Reimer E, Ivanov D, Neef N, Gauthier CJ, Turner R, Moller HE, 2015. Cortical lamina-dependent blood volume changes in human brain at 7 T. Neuroimage 107, 23–33. [DOI] [PubMed] [Google Scholar]
- Huber L, Handwerker DA, Jangraw DC, Chen G, Hall A, Stüber C, Gonzalez-Castillo J, Ivanov D, Marrett S, Guidi M, 2017. High-resolution CBV-fMRI allows mapping of laminar activity and connectivity of cortical input and output in human M1. Neuron 96, 1253–1263. e1257. [DOI] [PMC free article] [PubMed] [Google Scholar]
- Huber L, Uludag K, Moller HE, 2019. Non-BOLD contrast for laminar fMRI in humans: CBF, CBV, and CMRO2. Neuroimage 197, 742–760. [DOI] [PubMed] [Google Scholar]
- Huber LR, Poser BA, Bandettini PA, Arora K, Wagstyl K, Cho S, Goense J, Nothnagel N, Morgan AT, van den Hurk J, 2021. LAYNII: a software suite for layer-fMRI. NeuroImage 237, 118091. [DOI] [PMC free article] [PubMed] [Google Scholar]
- Ivanov D, Gardumi A, Haast RA, Pfeuffer J, Poser BA, Uludağ K, 2017. Comparison of 3 T and 7 T ASL techniques for concurrent functional perfusion and BOLD studies. Neuroimage 156, 363–376. [DOI] [PubMed] [Google Scholar]
- Ivanov D, Kashyap S, Haast RA, Janssens S, Huber L, Poser BA, Uludağ K, 2018. Human whole-brain sub-millimeter cerebral blood flow map using 7T ASL. 26th Annual Meeting of the International Society for Magnetic Resonance in Medicine. 2018. [Google Scholar]
- Jann K, Gee DG, Kilroy E, Schwab S, Smith RX, Cannon TD, Wang DJ, 2015. Functional connectivity in BOLD and CBF data: similarity and reliability of resting brain networks. Neuroimage 106, 111–122. [DOI] [PMC free article] [PubMed] [Google Scholar]
- Kashyap S, Ivanov D, Havlicek M, Huber L, Poser BA, Uludağ K, 2021. Sub-millimetre resolution laminar fMRI using Arterial Spin Labelling in humans at 7 T. Plos one 16, e0250504. [DOI] [PMC free article] [PubMed] [Google Scholar]
- Kemper VG, De Martino F, Vu AT, Poser BA, Feinberg DA, Goebel R, Yacoub E, 2015. Sub-millimeter T2 weighted fMRI at 7 T: comparison of 3D-GRASE and 2D SE-EPI. Front Neurosci 9, 163. [DOI] [PMC free article] [PubMed] [Google Scholar]
- Kim JH, Taylor AJ, Wang DJ, Zou X, Ress D, 2020. Dynamics of the cerebral blood flow response to brief neural activity in human visual cortex. Journal of Cerebral Blood Flow & Metabolism 40, 1823–1837. [DOI] [PMC free article] [PubMed] [Google Scholar]
- Kim T, Kim S-G, 2010. Cortical layer-dependent arterial blood volume changes: improved spatial specificity relative to BOLD fMRI. Neuroimage 49, 1340–1349. [DOI] [PMC free article] [PubMed] [Google Scholar]
- Koopmans PJ, Barth M, Orzada S, Norris DG, 2011. Multi-echo fMRI of the cortical laminae in humans at 7 T. NeuroImage 56, 1276–1285. [DOI] [PubMed] [Google Scholar]
- Krishnamurthy LC, Liu P, Xu F, Uh J, Dimitrov I, Lu H, 2014. Dependence of blood T2 on oxygenation at 7 T: in vitro calibration and in vivo application. Magnetic resonance in medicine 71, 2035–2042. [DOI] [PMC free article] [PubMed] [Google Scholar]
- Larkin RP, 1979. An algorithm for assessing bimodality vs. unimodality in a univariate distribution. Behavior Research Methods & Instrumentation 11, 467–468. [Google Scholar]
- Lauwers F, Cassot F, Lauwers-Cances V, Puwanarajah P, Duvernoy H, 2008. Morphometry of the human cerebral cortex microcirculation: general characteristics and space-related profiles. Neuroimage 39, 936–948. [DOI] [PubMed] [Google Scholar]
- Li W, Grgac K, Huang A, Yadav N, Qin Q, van Zijl PC, 2016. Quantitative theory for the longitudinal relaxation time of blood water. Magn Reson Med 76, 270–281. [DOI] [PMC free article] [PubMed] [Google Scholar]
- Liu C, Guo F, Qian C, Zhang Z, Sun K, Wang DJ, He S, Zhang P, 2020. Layer-dependent multiplicative effects of spatial attention on contrast responses in human early visual cortex. Prog Neurobiol, 101897. [DOI] [PubMed] [Google Scholar]
- Lu H, Golay X, Pekar JJ, Van Zijl PC, 2003. Functional magnetic resonance imaging based on changes in vascular space occupancy. Magn Reson Med 50, 263–274. [DOI] [PubMed] [Google Scholar]
- Maccotta L, Detre JA, Alsop DC, 1997. The efficiency of adiabatic inversion for perfusion imaging by arterial spin labeling. NMR in Biomedicine: An International Journal Devoted to the Development and Application of Magnetic Resonance In Vivo 10, 216–221. [DOI] [PubMed] [Google Scholar]
- Mao T, Kusefoglu D, Hooks BM, Huber D, Petreanu L, Svoboda K, 2011. Long-range neuronal circuits underlying the interaction between sensory and motor cortex. Neuron 72, 111–123. [DOI] [PMC free article] [PubMed] [Google Scholar]
- Meixner CR, Eisen CK, Schmitter S, Müller M, Herrler J, Hensel B, Dörfler A, Uder M, Nagel AM, 2021. Hybrid-shimming and gradient adaptions for improved pseudo-continuous arterial spin labeling at 7 Tesla. Magnetic Resonance in Medicine. [DOI] [PubMed] [Google Scholar]
- Nishimura N, Schaffer CB, Friedman B, Lyden PD, Kleinfeld D, 2007. Penetrating arterioles are a bottleneck in the perfusion of neocortex. Proceedings of the National Academy of Sciences 104, 365–370. [DOI] [PMC free article] [PubMed] [Google Scholar]
- Olman CA, Harel N, Feinberg DA, He S, Zhang P, Ugurbil K, Yacoub E, 2012. Layer-specific fMRI reflects different neuronal computations at different depths in human V1. PLoS One 7, e32536. [DOI] [PMC free article] [PubMed] [Google Scholar]
- Park S, Torrisi S, Townsend JD, Beckett A, Feinberg DA, 2021. Highly accelerated submillimeter resolution 3D GRASE with controlled blurring in-weighted functional MRI at 7 Tesla: A feasibility study. Magnetic Resonance in Medicine 85, 2490–2506. [DOI] [PMC free article] [PubMed] [Google Scholar]
- Peppiatt CM, Howarth C, Mobbs P, Attwell D, 2006. Bidirectional control of CNS capillary diameter by pericytes. Nature 443, 700–704. [DOI] [PMC free article] [PubMed] [Google Scholar]
- Persichetti AS, Avery JA, Huber L, Merriam EP, Martin A, 2020. Layer-specific contributions to imagined and executed hand movements in human primary motor cortex. Current Biology 30, 1721–1725. e1723. [DOI] [PMC free article] [PubMed] [Google Scholar]
- Petridou N, Italiaander M, van de Bank B, Siero J, Luijten P, Klomp D, 2013. Pushing the limits of high-resolution functional MRI using a simple high-density multi-element coil design. NMR in biomedicine 26, 65–73. [DOI] [PubMed] [Google Scholar]
- Pfeuffer J, Adriany G, Shmuel A, Yacoub E, Van De Moortele PF, Hu X, Ugurbil K, 2002. Perfusion-based high-resolution functional imaging in the human brain at 7 Tesla. Magnetic Resonance in Medicine: An Official Journal of the International Society for Magnetic Resonance in Medicine 47, 903–911. [DOI] [PubMed] [Google Scholar]
- Pohmann R, Speck O, Scheffler K, 2016. Signal-to-noise ratio and MR tissue parameters in human brain imaging at 3, 7, and 9.4 tesla using current receive coil arrays. Magnetic resonance in medicine 75, 801–809. [DOI] [PubMed] [Google Scholar]
- Polimeni JR, Fischl B, Greve DN, Wald LL, 2010. Laminar analysis of 7T BOLD using an imposed spatial activation pattern in human V1. Neuroimage 52, 1334–1346. [DOI] [PMC free article] [PubMed] [Google Scholar]
- Qiu M, Paul Maguire R, Arora J, Planeta-Wilson B, Weinzimmer D, Wang J, Wang Y, Kim H, Rajeevan N, Huang Y, 2010. Arterial transit time effects in pulsed arterial spin labeling CBF mapping: insight from a PET and MR study in normal human subjects. Magnetic Resonance in Medicine: An Official Journal of the International Society for Magnetic Resonance in Medicine 63, 374–384. [DOI] [PMC free article] [PubMed] [Google Scholar]
- Rane SD, Gore JC, 2013. Measurement of T1 of human arterial and venous blood at 7 T. Magnetic resonance imaging 31, 477–479. [DOI] [PMC free article] [PubMed] [Google Scholar]
- Ress D, Glover GH, Liu J, Wandell B, 2007. Laminar profiles of functional activity in the human brain. neuroimage 34, 74–84. [DOI] [PubMed] [Google Scholar]
- Saad ZS, Glen DR, Chen G, Beauchamp MS, Desai R, Cox RW, 2009. A new method for improving functional-to-structural MRI alignment using local Pearson correlation. Neuroimage 44, 839–848. [DOI] [PMC free article] [PubMed] [Google Scholar]
- Schaffer CB, Friedman B, Nishimura N, Schroeder LF, Tsai PS, Ebner FF, Lyden PD, Kleinfeld D, 2006. Two-photon imaging of cortical surface microvessels reveals a robust redistribution in blood flow after vascular occlusion. PLoS Biol 4, e22. [DOI] [PMC free article] [PubMed] [Google Scholar]
- Shipp S, 2007. Structure and function of the cerebral cortex. Curr Biol 17, R443–449. [DOI] [PubMed] [Google Scholar]
- Spann SM, Shao X, Wang DJ, Aigner CS, Schloegl M, Bredies K, Stollberger R, 2020. Robust single-shot acquisition of high resolution whole brain ASL images by combining time-dependent 2D CAPIRINHA sampling with spatio-temporal TGV reconstruction. NeuroImage 206, 116337. [DOI] [PMC free article] [PubMed] [Google Scholar]
- Taso M, Munsch F, Zhao L, Alsop DC, 2021. Regional and depth-dependence of cortical blood-flow assessed with high-resolution Arterial Spin Labeling (ASL). Journal of Cerebral Blood Flow & Metabolism, 0271678X20982382. [DOI] [PMC free article] [PubMed] [Google Scholar]
- Waehnert M, Dinse J, Weiss M, Streicher MN, Waehnert P, Geyer S, Turner R, Bazin P-L, 2014. Anatomically motivated modeling of cortical laminae. Neuroimage 93, 210–220. [DOI] [PubMed] [Google Scholar]
- Wang DJ, Alger JR, Qiao JX, Gunther M, Pope WB, Saver JL, Salamon N, Liebeskind DS, Investigators US, 2013. Multi-delay multi-parametric arterial spin-labeled perfusion MRI in acute ischemic stroke—comparison with dynamic susceptibility contrast enhanced perfusion imaging. NeuroImage: Clinical 3, 1–7. [DOI] [PMC free article] [PubMed] [Google Scholar]
- Wang J, Aguirre GK, Kimberg DY, Roc AC, Li L, Detre JA, 2003. Arterial spin labeling perfusion fMRI with very low task frequency. Magnetic Resonance in Medicine: An Official Journal of the International Society for Magnetic Resonance in Medicine 49, 796–802. [DOI] [PubMed] [Google Scholar]
- Wang J, Alsop DC, Li L, Listerud J, Gonzalez-At JB, Schnall MD, Detre JA, 2002. Comparison of quantitative perfusion imaging using arterial spin labeling at 1.5 and 4.0 Tesla. Magnetic Resonance in Medicine: An Official Journal of the International Society for Magnetic Resonance in Medicine 48, 242–254. [DOI] [PubMed] [Google Scholar]
- Wang K, Ma SJ, Shao X, Zhao C, Shou Q, Yan L, Wang DJ, 2021. Optimization of pseudo-continuous arterial spin labeling at 7T with parallel transmission B1 shimming. Magnetic Resonance in Medicine. [DOI] [PMC free article] [PubMed] [Google Scholar]
- Weigel M, 2015. Extended phase graphs: dephasing, RF pulses, and echoes-pure and simple. Journal of Magnetic Resonance Imaging 41, 266–295. [DOI] [PubMed] [Google Scholar]
- Weiler N, Wood L, Yu J, Solla SA, Shepherd GM, 2008. Top-down laminar organization of the excitatory network in motor cortex. Nature neuroscience 11, 360–366. [DOI] [PMC free article] [PubMed] [Google Scholar]
- Wong EC, Buxton RB, Frank LR, 1997. Implementation of quantitative perfusion imaging techniques for functional brain mapping using pulsed arterial spin labeling. NMR in Biomedicine: An International Journal Devoted to the Development and Application of Magnetic Resonance In Vivo 10, 237–249. [DOI] [PubMed] [Google Scholar]
- Wu WC, Fernández-Seara M, Detre JA, Wehrli FW, Wang J, 2007. A theoretical and experimental investigation of the tagging efficiency of pseudocontinuous arterial spin labeling. Magn Reson Med 58, 1020–1027. [DOI] [PubMed] [Google Scholar]
- Yang Y, Gu H, Stein EA, 2004. Simultaneous MRI acquisition of blood volume, blood flow, and blood oxygenation information during brain activation. Magnetic Resonance in Medicine: An Official Journal of the International Society for Magnetic Resonance in Medicine 52, 1407–1417. [DOI] [PubMed] [Google Scholar]
- Yousry T, Schmid U, Alkadhi H, Schmidt D, Peraud A, Buettner A, Winkler P, 1997. Localization of the motor hand area to a knob on the precentral gyrus. A new landmark. Brain: a journal of neurology 120, 141–157. [DOI] [PubMed] [Google Scholar]
- Zappe AC, Pfeuffer J, Merkle H, Logothetis NK, Goense JB, 2008. The effect of labeling parameters on perfusion-based fMRI in nonhuman primates. Journal of Cerebral Blood Flow & Metabolism 28, 640–652. [DOI] [PubMed] [Google Scholar]
- Zuo Z, Wang R, Zhuo Y, Xue R, Lawrence KSS, Wang DJ, 2013. Turbo-FLASH based arterial spin labeled perfusion MRI at 7 T. PloS one 8. [DOI] [PMC free article] [PubMed] [Google Scholar]
- Østergaard L, Aamand R, Gutiérrez-Jiménez E, Ho Y-CL, Blicher JU, Madsen SM, Nagenthiraja K, Dalby RB, Drasbek KR, Møller A, 2013a. The capillary dysfunction hypothesis of Alzheimer’s disease. Neurobiology of aging 34, 1018–1031. [DOI] [PubMed] [Google Scholar]
- Østergaard L, Aamand R, Karabegovic S, Tietze A, Blicher JU, Mikkelsen IK, Iversen NK, Secher N, Engedal TS, Anzabi M, 2013b. The role of the microcirculation in delayed cerebral ischemia and chronic degenerative changes after subarachnoid hemorrhage. Journal of Cerebral Blood Flow & Metabolism 33, 1825–1837. [DOI] [PMC free article] [PubMed] [Google Scholar]
- Østergaard L, Engedal TS, Aamand R, Mikkelsen R, Iversen NK, Anzabi M, Næss-Schmidt ET, Drasbek KR, Bay V, Blicher JU, 2014. Capillary transit time heterogeneity and flow-metabolism coupling after traumatic brain injury. Journal of Cerebral Blood Flow & Metabolism 34, 1585–1598. [DOI] [PMC free article] [PubMed] [Google Scholar]
- Østergaard L, Finnerup NB, Terkelsen AJ, Olesen RA, Drasbek KR, Knudsen L, Jespersen SN, Frystyk J, Charles M, Thomsen RW, 2015. The effects of capillary dysfunction on oxygen and glucose extraction in diabetic neuropathy. Diabetologia 58, 666–677. [DOI] [PMC free article] [PubMed] [Google Scholar]
- Østergaard L, Jespersen SN, Mouridsen K, Mikkelsen IK, Jonsdottír KÝ, Tietze A, Blicher JU, Aamand R, Hjort N, Iversen NK, 2013c. The role of the cerebral capillaries in acute ischemic stroke: the extended penumbra model. Journal of Cerebral Blood Flow & Metabolism 33, 635–648. [DOI] [PMC free article] [PubMed] [Google Scholar]
Associated Data
This section collects any data citations, data availability statements, or supplementary materials included in this article.
Supplementary Materials
Data Availability Statement
The data presented in this manuscript can be downloaded from our lab website (http://loft-lab.org/index-5.html). The pulse sequence will be available after we establish Material Transfer Agreement (MTA) between user’s institute and University of Southern California. MATLAB code for two-peak pattern significance test can be downloaded from our lab website (http://loft-lab.org/index-5.html).