

Abstract
Objectives:
The 1-month Graded Chronic Pain Scale (GCPS) commonly used in clinical studies has never been validated. This study compares the GCPS 1-month with the 6-months version for reliability and validity.
Methods:
The Validation Project included 521 subjects with at least one temporomandibular disorder for cross-sectional data and 74 subjects for test-retest data. Internal reliability, stability, and construct validity were used for testing the 1-month version. Comparisons were made between the two versions for characteristic pain intensity (CPI), interference, and chronic pain grade (CPG).
Results:
For GCPS 1-month, internal consistency for pain intensity and interference was high (Cronbach’s alpha=0.87 and 0.94, respectively), and temporal stability was high for CPI (intraclass correlation coefficient (ICC)=0.91), interference (ICC=0.85), and CPG (weighted kappa=0.88). ICC or kappa between the two versions was 0.78 (CPI), 0.66 (interference), and 0.69 (CPG); high-impact pain, in contrast, was 0.50. Construct validity exhibited higher correlations with predictor variables for 1-month version attributes of CPI, interference, and CPG. Modified Bland-Altman plots indicated that both versions measure CPI well.
Discussion:
Overall, reliability of the 1-month GCPS is equal to or better than the 6-months version for pain intensity, disability days, pain interference, CPG, and high-impact pain. However, consistency between versions is lower for measures of disability days and interference, and for the derived measures of CPG and high-impact pain; highly skewed distributions and increasing disagreement in reported status over the time periods affect the measures of function. Therefore, we recommend that GCPS-1 month only be used to calculate pain intensity and pain interference.
Keywords: pain, psychometric properties, measurement, disability, TMD
Introduction
The Graded Chronic Pain Scale (GCPS), developed for use in general population surveys and care settings, facilitates measurement of pain severity and pain disability.1 GCPS Version 1.0 is a reliable and validated measure2,3 of only seven items yielding three useful measures: characteristic pain intensity (CPI), pain interference, and pain-related disability.
The GCPS 6-months has established acceptable psychometric properties for reliability, validity, and utility.4 Among individuals with a temporomandibular disorder (TMD), internal consistency (Cronbach’s alpha) of GCPS-6 is good to excellent for pain intensity (0.84, lower bound 95%CL=0.82) and interference (0.95, lower bound 95%CL=0.94); temporal stability is good to excellent for CPI (concordance correlation coefficient (CCC)=0.91), interference (CCC=0.89), and chronic pain grade (weighted kappa=0.87). In addition, the GCPS-6 exhibits anticipated correlations for convergent validity (i.e., 0.35-0.64) and discriminant validity (i.e., 0.0-0.43); the range of correlations within each type of validation evidence was consistent with assumptions underlying these two types of validity.5 The corresponding psychometric characteristics of the GCPS 1-month are unknown; obtaining such evidence represents one aim of this report.
The 6-months reference frame nicely captures the broad cycles of changes in pain and its impact on function.1 Yet the 6-months reference frame proves to be a limitation in certain settings; for example, pain status at the end of treatment in short-term clinical trials or current pain status in clinical settings. The ordered categories in the GCPS 6-month classification have demonstrated treatment-oriented utility.6,7 However, the categories are not so sensitive to change,8 an important characteristic when assessing short time periods such as clinical trials.9-12 In contrast, the pain intensity and pain interference scales are assumed to reflect sufficient sensitivity to change. But the longer period (six months) of assessment can easily overlap a period of presumed active change in a short clinical trial, resulting in under-estimating the degree of change.
In addition, a 6-months period for assessment is of some concern for pain reporting due to decay in retrospective memory of long-term periods. Short-term recall of pain experience appears excellent: end-of-day pain ratings correlate highly (r≥0.85) with pain ratings made during the day,13 and reliability at 24 hours ranges from ICC=0.93-0.97, depending on the pain scale.14 But the accuracy of pain recall beyond such short periods remains an ongoing question.15,16 For a short 1-week period, pain recall is highly influenced by present pain intensity, peak pain intensity, and end pain experience of painful episodes, whereas pain intensity recall is variably influenced by pain type, mood, and duration of pain episodes.17-20 In comparing different clinically-relevant recall intervals of 1-week, 1-month, and 6-months, the reliability of retrospective self-report of pain characteristics over the 6-months recall compared to daily diaries was under-reported, influenced by gender, and poorer for those with persistent pain compared to those with recurrent pain.21 Those findings suggest the value of signal episodes for memory storage and later recall and demonstrate that recall over a 6-months period is worse than for a 1-month period. Other findings point to shorter periods of 2-weeks of recall as good and perhaps even 3-months as potentially accurate.1 Collectively, the stated factors affect the reliability of the assessment of pain and its impact and point to the value of a shorter rather than longer time-framed GCPS version for certain applications.
Preliminary results regarding the reliability and validity of the GCPS pain and interference items, based on a 1-month version of the GCPS items compared to targeted SF36 subscales and two additional pain- and disability-relevant items in a back pain sample, indicated convergent validity in the 0.6-0.8 range and test-retest reliability (ICC) in the 0.7-0.8 range. These results demonstrated the potential usefulness of the GCPS pain intensity and interference items for a 1-month reference frame for assessing in patients with back pain. Moreover, the results highlighted the need for investigation in other pain disorders and with more targeted analyses.22 However, these results did not address the potential comparability of a 1-month reference period to a 6-months period. In summary, no published comprehensive psychometric data exist comparing the 1-month version to the 6-months version for internal consistency, temporal stability, and validity. This study therefore sought to compare the 1-month to the 6-months version for reliability and validity.
Methods
Participants and study design
The RDC/TMD (Research Diagnostic Criteria for Temporomandibular Disorders) Validation Project (primary study and several nested sub-studies) was conducted 2001-2007; comprehensive descriptions of the inclusion criteria for that project are available.4,23,24 In brief, participants were recruited from a facial pain clinic and from the surrounding community. Individuals with any type of presumptive temporomandibular disorder (TMD), whether single or multiple, and individuals without such disorders were enrolled into the primary study, while exclusion criteria were oriented towards health concerns or systemic diseases that would potentially affect the reliability and validity of pain reporting or would potentially affect presentation of disease within the temporomandibular joint (TMJ). These individuals also had other comorbid pain disorders, as reported elsewhere.4 See Table 1 (Appendix). A total of 724 individuals participated in the primary study, and subsets of individuals participated in each sub-study.23 For this report, we have selected individuals from the primary study and from two of the sub-studies; Figure1 (Appendix).
Primary study.
Among other study instruments, participants completed a filter question in the RDC/TMD Patient History Questionnaire that asked “Have you had pain in the face, jaw, temple, in front of the ear, or in the ear in the past month?” (henceforth termed “facial pain”). A response of ‘yes’ directed participants to complete the next block of items, which comprised the GCPS 6-months, and ‘no’ led to skipping those items. Regardless of the response to that filter question, all participants (including those who had no pain) completed the GCPS 1-month. Only participants who answered ‘yes’ to the filter question were selected for the present report, which insured that evaluation of the properties of a pain assessment instrument for the preceding 1-month period would be conducted on individuals who reported pain during that period and therefore also completed the GCPS 6-months. The additional inclusion criterion was having complete data on both the GCPS 6-months and 1-month (defined below). Presence of a pain diagnosis was not part of the inclusion criterion; the target population for using the GCPS 1-month instrument is anyone with pain, regardless of whether that pain is sufficient for a diagnosis. The cross-sectional data included 516 participants who reported ‘yes’ to the above filter question; of them, six individuals had either incomplete or incongruent data on one or both of the instruments of interest and were dropped from all analyses. The remaining 510 participants were used for primary analyses.
Sub-studies.
Two additional datasets from the Validation Project emerged from two separate test-retest reliability studies that were conducted with some of the participants already enrolled in the primary study to assess stability of measured constructs. Test-retest study 1 (n=74) assessed instruments used as part of the physical diagnosis for TMDs, and test-retest study 2 (n=74) assessed instruments used for measuring psychosocial constructs. These two sub-sets of individuals have been previously described;4,23 both sub-sets were comparable for age, sex, race, education, and presence of painful TMD diagnoses. In brief, individuals in study 1 were required to have reported pain in the prior 30 days, and they were assessed again at a targeted interval of three days. Individuals in study 2 were required to have some degree of distress, and they were assessed again at a targeted interval of 14 days. The differing intervals were selected on the basis of the assumed maximal period for stability of the respective primary constructs of interest. The GCPS 6-months, an intrinsic part of the Patient History Questionnaire, was therefore assessed in test-retest study 1, whereas the GCPS 1-month, a component of the Axis II portion of the project, was included in test-retest study 2.
For the purposes of this study, the intervals between the two test-retest administrations of each version of the GCPS were trimmed in order to keep the intervals focused. From the GCPS 6-months dataset, five individuals were dropped due to intervals of <3 days or >7 days and five individuals were dropped due to incomplete data. The test-retest interval for the remaining sample (n=64) ranged from 3-7 days, and 97% completed both administrations at the requested interval of three days. From the GCPS 1-month dataset, seven individuals were dropped due to intervals =1 day or >15 days. The test-retest interval for the remaining sample (n=67) ranged from 7-15 days, and 76% completed both administrations at the requested interval of 14 days.
Sample characterization measures
Age, sex, race, education, and income were measured using the self-report Patient History Questionnaire of the RDC/TMD. In the same questionnaire, pain-chronicity was queried asking for number of years or months that facial pain had been present. Reference standard TMD diagnoses were assigned by consensus, as part of the RDC/TMD validation process, from two calibrated examiners for each participant.25 Age was left as a continuous variable. Race was categorized into “White” and “Non-white,” and Education was categorized into “High school or less,” “Some college,” and “College graduate.” Income categories remained as administered, see Table 1. Diagnoses were reduced to binary indicator variables for each of TMD pain disorders, temporomandibular joint internal disk derangements, and degenerative joint disease; these diagnoses are not mutually exclusive.
Table 1.
Descriptive characteristics of study sample (n=510).
| Continuous variables | ||||
|---|---|---|---|---|
| N | Mean | SD | Range | |
| Age (years) | 510 | 37.0 | 13.0 | 18.1 – 67.5 |
| Pain chronicity (years) | 503 | 8.9 | 8.9 | 0.08 - 40 |
| Categorical variables | ||||
| Domain and level | N | % (n=510) | ||
| Sex | ||||
| Female | 441 | 86.5 | ||
| Male | 69 | 13.5 | ||
| Race | ||||
| White | 469 | 92.0 | ||
| Non-white | 41 | 8.0 | ||
| Education | ||||
| High school or less | 152 | 29.8 | ||
| Some college | 236 | 46.3 | ||
| College graduate | 121 | 23.7 | ||
| Missing | 1 | 0.2 | ||
| Income (USD) | ||||
| <20K | 127 | 24.9 | ||
| 20-40K | 105 | 20.6 | ||
| 40-60K | 89 | 17.5 | ||
| 60-80K | 79 | 15.5 | ||
| >80K | 105 | 20.6 | ||
| Did not report | 5 | 1.0 | ||
| Diagnosis* | ||||
| Non-TMD case | 6 | 1.2 | ||
| Painful TMD | 309 | 60.6 | ||
| TMJ internal derangement | 415 | 81.4 | ||
| TMJ degenerative joint disease | 203 | 39.8 | ||
Disorder groups are not mutually exclusive; percentages therefore do not add up to 100.
Primary instruments
Both GCPS 6-months and 1-month contain identical questions with the exception of the reference periods of the prior 6-months (180 days) and 1 month (30 days), respectively. Item content includes current pain intensity and worst and average pain intensity over the prior reference period. These questions assess pain intensity using a 0-10 numeric rating scale (NRS), 0=“no pain” and 10=“pain as bad as could be”. A characteristic pain intensity (CPI) score is calculated by multiplying the mean of these three ratings by 10. The number of disability days that one was kept from usual activities was asked, again using the respective time frames (180 days; 30 days); the number of days in the 6-months version is assigned to 0-3 disability days points according to established guidelines,26 whereas there is no method for the 1-month version. The degree of facial pain interference with each of daily activities, recreational/social/family activities, and work/housework activities in the past reference period is also rated on a 0-10 NRS, with 0=“no interference” and 10=“unable to carry on activities”. The pain-related activity interference score is calculated by multiplying the mean of these three ratings by 10; these scores are then assigned to 0-3 interference points. For each of CPI and interference score computations in the primary study dataset, one missing value among the three component scores was allowed; missingness occurred in only two persons, but we retained this standard approach to partial missing data for purposes of generalizability.
The GCPS 6-months classifies individuals into grades of chronic pain: grade 0 (no pain), grade 1 (low pain intensity and low pain-related disability), grade 2 (high pain intensity and low pain-related disability), grade 3 (moderate pain-related disability), and grade 4 (high pain-related disability). Grade 2 has also been usefully split into grade 2a (high pain intensity and no pain-related disability) and grade 2b (high pain intensity and low pain-related disability).6,7,27,28 These grades have also been reduced to a dichotomous (yes/no) classification for high-impact pain.27,29
The GCPS 1-month required, for this report, development of a classification rule for determination of cut-points from disability days, in order to assign disability days points. The first determination of possible cut-points was to compute disability days points from the GCPS 6-months. At each of four ordinal levels of the 0-3 disability days points for the 6-months version, the proportions 82.8%, 5.8%, 5.2%, and 6.2% were observed, respectively. Based on these proportions, the cut-points of 0, 2, 3, and 5 were selected for the 1-month version, which would best reproduce the GCPS 6-months proportions (resultant: 79.7%, 5.2%, 5.4%, 9.7%). Three other contrasting sets of cut-points were created (0, 1, 3, 6; 0, 2, 3, 6; and 0, 2, 4, 6); the results (estimates and 95% confidence limits) for test-retest agreement and for comparison to the 6-months version did not differ substantially from the outcome of the proportion-based set. Thus, we only report findings for the latter.
Points for interference in normal activities are assigned based on the 0-100 interference scale; presumably the three items that comprise that scale function similarly whether over a 30-day or 6-months period, but this is an empirical question. Two sets of interference points were created: one using the published cut-points (0, 30, 50, 70), and another using cut-points (i.e., 0, 14, 32, 61) that resulted in the same proportions in the 1-month version, as compared to those derived using the published cut-points in the 6-months version. The results (estimates and 95% confidence limits) did not differ substantially between the two approaches; consequently, we retained the published cut-points from GCPS 6-months for computing interference points from GCPS 1-month.
Chronic pain grade for the 1-month version was then created using the standard computational rules and the total disability points (sum of disability days points and interference points) from the above methods. The GCPS 1-month classification was then evaluated for test-retest reliability and equivalence to the classification emerging from the GCPS 6-months version. For both GCPS 1-month and GCPS 6-months classifications, high-impact pain was also computed: Grades 1 and 2a were considered to be “low”, while grades 2b, 3, and 4 were considered “high”. Per selection criteria for this study, the primary-study sample did not include individuals with grade 0. The instrument and final scoring rules are available elsewhere1.
Validity measures
Specific measures were selected for assessing the relative validity of the GCPS 1-month instrument, with reference to their previously established associations with the GCPS 6-month instrument; a superset of these measures had been previously identified for assessment battery validation.4,30 In order to better understand long vs. short reference periods in pain-reporting, the 1-month and 6-months GCPS were compared with other measures of person attributes for similar or differential influence of TMD-relevant symptom reporting.31 The variables selected for this set of analyses differed in their reference time periods, ranging from 2-4 weeks, and therefore the reference periods overlapped minimally with the reference period of the GCPS 6-months and substantially with the GCPS 1-month, even though administration of all instruments was largely concurrent. The measures selected were also expected to exhibit a range of coefficients, allowing better assessment of the relative validity for each of 1-month and 6-months GCPS, as described next.
Validity exists in degrees and is typically assessed within the classical test theory approach of construct validation using a convergent-discriminant validity matrix. The individual coefficients within that matrix were interpreted as weak (say, ≤0.4, i.e., ≤16% of the variance) vs. strong (say, ≥0.7, i.e., ≥50% of the variance), but in relative terms to each other given that this is a 3-way matrix. An expected strong correlation would demonstrate convergent validity, while an expected weak correlation would demonstrate discriminant validity. Using each of the 1-month and 6-months GCPSs for comparison with the validity measures, the relative pattern of coefficients comparing 1-month vs 6-months version performance was regarded as more relevant than convergent-discriminant validation per se for the present study, given that GCPS 6-month instrument is already considered valid for assessing both pain intensity and pain-related disability.32
The original Symptoms Checklist-90 (SCL90) is a 90-item instrument that assesses a broad range of psychological symptoms by querying participants regarding how much they have been bothered by each symptom on a 5-step ordinal scale (“not at all” to “extremely”). While the SCL90 provides measures across nine subscales, the three subscales with the best-known associations with pain were used for this study: depression, anxiety, and somatization (hereafter: physical symptoms).33 The items for these subscales in the SCL90 are identical to those in the SCL90R. This instrument has demonstrated good to excellent internal consistency (Cronbach’s alpha ranging from 0.77 to 0.90) and test-retest reliability (ranging from 0.78 to 0.90) for all subscales.33 The relevance of these subscales to TMDs and to pain is widely known.30,34,35 All three scales were expected to demonstrate a modest association (i.e., Pearson r<0.5) with each of pain and interference measures.
The Multidimensional Pain Inventory (MPI)36,37 is a 60-item instrument assessing cognitive, behavioral, and affective responses to pain. Subscales of the MPI demonstrate good to excellent internal consistency ranging from 0.73 to 0.90 and fair to good test-retest reliability (from 0.68 to 0.83) in chronic pain patients.38 Based on previously demonstrated associations of three MPI subscales (pain severity, general activity, activity interference) with GCPS 6-month, the following expectations were held for the GCPS 1-month version: Pain severity was expected to show strong association with CPI and a weaker relationship with interference (both as convergent validity); general activity was expected to show a weak association; and activity interference was expected to show a strong association with GCPS interference and chronic pain grade.
The General Health Questionnaire-28 (GHQ-28) is a 28-item instrument with demonstrated validity in screening for psychiatric disorders.39 It consists of four groups of seven questions assessing somatic symptoms, anxiety and insomnia, social dysfunction, and severe depression; the total score is interpreted as emotional distress. When correlated with the GCPS 6-months, each of CPI, interference, and chronic pain grade show low associations with the GHQ-28.4 Correspondingly, the GHQ-28 was expected to show a weak association with the GCPS 1-month.
The SF-12 version 2 (SF-12v2) is a health-related quality of life measure and includes two subscales, physical component summary (PCS) and mental component summary (MCS); higher scores denote healthier states. The SF-12v2 demonstrates good internal consistency of 0.77–0.80 and good temporal stability of 0.76–0.89.40,41 The PCS shows moderate associations with GCPS 6-months interference and chronic pain grade; consequently it was expected to also show a moderate association with interference and pain grade, and a weak association with CPI in the GCPS 1-month. The MCS, in contrast, shows weak associations with CPI, interference, and chronic pain grade in the 6-months version and was also expected to show weak associations with GCPS 1-month. The scoring direction of PCS and MCS scores was reversed for consistency with the other comparison variables.
Statistical analysis
Predefined criteria for assessing outcomes entailed that the GCPS 1-month would have to meet or exceed, in relation to the GCPS 6-months, the following: 1) reliability in the form of internal consistency; 2) agreement in the form of temporal stability; 3) consistency of items and classification compared to GCPS 6-months; 4) construct validity42 of subscales and classification as assessed by correlational analysis with other relevant constructs [i.e., low/weak (Pearson r≤0.35), modest/moderate (r=0.36–0.67), strong/high (r≥0.68)];43 and 5) sensitivity of high-impact pain identification compared to GCPS 6-months as the reference standard.
Descriptive statistics (min, max, mean, standard deviation, median, skewness and kurtosis) were computed for each item and subscale, for each of the GCPS 1-month and 6-months. T-test and Wilcoxon test were used to determine significant differences at α=0.05 between measures of 1-month and 6-months versions, based on parametric or nonparametric distributions, respectively, as determined by inspection of mean vs. median and skew/kurtosis. Precision of measures for each of CPI, number of disability days, and interference was computed as the following statistics: mean difference, standard deviation of the difference, mean absolute difference, and root mean square difference between GCPS 1-month and 6-months; standard error of measurement (SEM) for GCPS 1-month; and proportion of individuals with differences between GCPS 1-month and 6-months which exceeded 1.96 times the GCPS 6-months SEM.
Reliability in the form of internal consistency of the two subscales (CPI, interference) for each of GCPS1-month and GCPS 6-months was assessed using Cronbach’s alpha and its 95% lower bound confidence limit. The expectation was that items within each subscale and GCPS version would demonstrate similar estimates.
Agreement in the form of temporal stability of the items, subscales, and chronic pain grade was assessed within each GCPS version. Dimensional measures were assessed using the intraclass correlation coefficient (ICC) for agreement (Model 2),44,45 as based on the instrument measuring the same attribute on both occasions and requirement that systematic difference be incorporated into the coefficient. The ordinal GCPS classification was assessed using quadratic weighted Kappa,46 and the dichotomous high-impact pain classification was assessed using unweighted Kappa. Confidence limits (CL; 95%) were computed for each type of estimate. Proportion of participants with inconsistent high-impact pain across the test-retest period was computed using high-impact pain status at Time 2 as the reference standard. Interpretation of the kappa statistics was based on the following cut-offs: <0.4, slight to fair agreement; 0.4 to <0.6, moderate; 0.6 to <0.8, substantial; and 0.8-1.0, almost to perfect.47 Since inferences from weighted kappa and ICC are strongly related,48 the same cut-offs were used for the ICC statistic in order to maintain consistency in interpretation.
Validity in the form of consistency of the GCPS 1-month compared to GCPS 6-months was assessed using the ICC for consistency (Model 3).44,49 Since the two versions of the GCPS assess different time periods and assess pain experience and its impact that are necessarily expected to vary across time, assuming agreement as a null hypothesis would be inappropriate. Consistency, in contrast, allows for systematic difference in the scores from the two instruments, thereby focusing only on the variance attributable to the persons and to residual error.49 In order to compare disability days, which exist within 0-30 and 0-180 day metrics within GCPS 1-month and 6-months, respectively, reported disability days for each version was converted to a proportion ranging 0-100. In addition, for each of CPI, disability days (as proportion), and interference score, we used scatterplots of the difference in the scores from each version, plotted against the scores from the GCPS 1-month version, in order to depict the impact of differing time reference periods. The plots include systematic bias (mean difference) and limits of agreement (±2 standard deviations from the mean difference). The limits of agreement was defined as D ± 1.96*sd where D is the mean difference and sd is the standard deviation of the individual d values;50 the plots therefore depict systematic bias (mean difference) and limits of agreement (±2 standard deviations from the mean difference).
Validity between the comparison variable and each attribute of the GCPS was computed using a Pearson correlation for dimensional variables and Spearman correlation for ordinal variables. No significance tests were considered for these statistics, since the purpose was to use them for pattern analysis based on expectation regarding degree of association and to compare between 1-month and 6-months versions.
Finally, area under the curve (AUC) of a receiver operating characteristic analysis was determined for high-impact pain (as a binary variable) when classified by the 1-month version compared to the 6-months version as the reference standard. False positive and false negative rates were consequently determined. In addition, GCPS 1-month with all grades retained was compared to high-impact GCPS 6-months, in order to determine whether the optimal cut-point for high-impact pain was at Grade 2b in the 1-month reference period.51
All analyses were conducted using Stata 16.1.
Results
Descriptive characteristics (Table 1, Table 2, Figure 1).
Table 2.
Descriptive statistics of items and subscales for each of GCPS 1-month and GCPS 6-months (n=510). Paired comparisons of 1-month vs 6-months, two-tailed.
| Measures | GCPS 1-month | GCPS 6-months | ||||||
|---|---|---|---|---|---|---|---|---|
| Min/Max | Mean (SD) | Median | Skew/Kurt | Min/Max | Mean (SD) | Median | Skew/Kurt | |
| Characteristic Pain Intensity1 | 3.3/100 | 45.7 (21.8) | 43.3 | 0.20/2.21 | 6.7/100 | 51.3 (20.1) | 50.0 | −0.03/2.42 |
| Current pain1 | 0/10 | 3.1 (2.6) | 2.5 | 0.71/2.55 | 0/10 | 3.5 (2.4) | 3 | 0.40/2.26 |
| Worst pain1 | 1/10 | 6.5 (2.6) | 7 | −0.42/2.11 | 1/10 | 6.9 (2.3) | 7 | −0.64/2.65 |
| Average pain1 | 0/10 | 4.1 (2.2) | 4 | 0.40/2.49 | 0/10 | 4.9 (2.2) | 5 | 0.21/2.43 |
| (raw) Number of disability days2 | 0/30 | 1.5 (4.1) | 0 | 4.32/24.6 | 0/180 | 8.6 (27.4) | 0 | 4.67/26.1 |
| (proportion) Number of disability days3 | 0/100 | 5.0 (13.8) | 0 | 4.32/24.6 | 0/100 | 4.8 (15.2) | 0 | 4.67/26.1 |
| Interference4 | 0/100 | 13.5 (19.1) | 6.7 | 1.85/6.13 | 0/100 | 19.8 (22.4) | 10 | 1.27/3.94 |
| Daily activity4 | 0/10 | 1.5 (2.0) | 1 | 1.52/4.84 | 0/10 | 2.3 (2.4) | 2 | 1.02/3.19 |
| Recreational4 | 0/10 | 1.3 (2.1) | 0 | 2.03/6.80 | 0/10 | 2.0 (2.4) | 1 | 1.29/3.93 |
| Work activity4 | 0/10 | 1.2 (2.0) | 0 | 1.92/6.43 | 0/10 | 1.7 (2.3) | 1 | 1.42/4.28 |
Note: skew -0.5 to 0.5: approximately symmetric; ∣0.5 – 1.0∣ moderate skewed; >∣1∣ highly skewed
Comparison with t-test, significant at p<0.05
No comparison performed: raw variables are non-commensurate
Comparison with Wilcoxon, not significantly different
Comparison with Wilcoxon, significant at p<0.05
Figure 1.
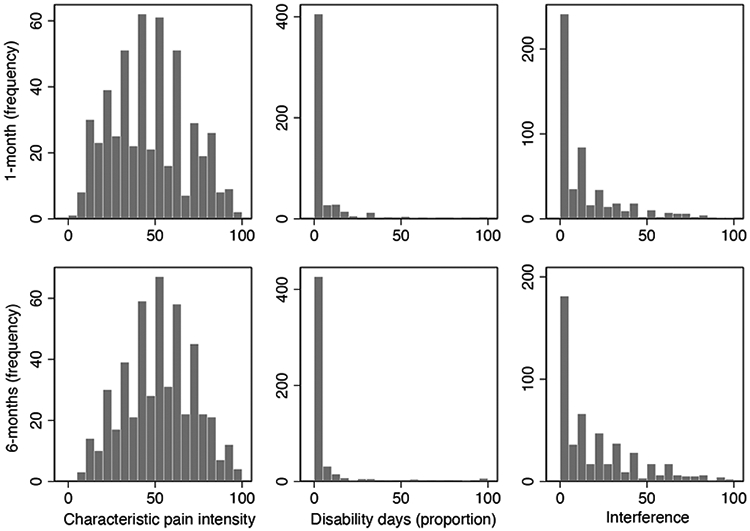
Distribution of values for CPI, disability days, and interference, for each of 1-month and 6-months versions.
Consistent with the Validation Project study sample, individuals who met selection criteria were predominantly white female with at least some college education and spanning the income range. Age ranged from 18–68 years, and pain chronicity ranged from sub-acute to 40 years. All of the prevalent forms of TMDs were represented in this sample. As shown in Figure 1 and in Table 2, all items and subscales, in comparing 1-month vs 6-months, exhibited similar distributions and the same range. The mean and median values were comparable for CPI and its component items, whereas disability days, the interference subscale, and its component items exhibited varying extents of skew. The mean and median values for CPI and interference, and their respective component items, reported for the recent 1-month, were significantly lower than for the 6-months period. Only number of disability days (rescaled as proportion) was reported similarly for the two periods.
Internal Consistency (Table 3).
Table 3.
Internal consistency and temporal stability measured as agreement.
Reliability statistics are compared for Graded Chronic Pain Scale (GCPS) 1-month version & GCPS 6-months version. Sample sizes: internal consistency, n=510; temporal stability for 1-month version, n=67; and temporal stability for 6-months version, n=64.
| GCPS 1-month | GCPS 6-months | |||
|---|---|---|---|---|
| Measures | Estimate | 95% CL4 | Estimate | 95% CL4 |
| Internal consistency of subscales 1 | ||||
| Characteristic Pain Intensity | 0.87 | 0.85 | 0.83 | 0.81 |
| Interference | 0.94 | 0.93 | 0.95 | 0.94 |
| Temporal stability of subscales2, items2, and classifications3 | ||||
| Characteristic Pain Intensity | 0.91 | 0.86 – 0.95 | 0.90 | 0.84 – 0.94 |
| Current pain intensity | 0.62 | 0.45 – 0.75 | 0.70 | 0.55 – 0.81 |
| Worst pain, past interval | 0.96 | 0.93 – 0.97 | 0.90 | 0.84 – 0.94 |
| Average pain, past interval | 0.88 | 0.81 – 0.92 | 0.85 | 0.76 – 0.91 |
| Number of disability days, past interval | 0.89 | 0.83 – 0.93 | 0.66 | 0.49 – 0.78 |
| Interference | 0.85 | 0.76 – 0.90 | 0.88 | 0.81 – 0.93 |
| Daily activity interference, past interval | 0.82 | 0.72 – 0.89 | 0.77 | 0.65 – 0.86 |
| Recreational interference, past interval | 0.77 | 0.65 – 0.85 | 0.86 | 0.78 – 0.91 |
| Work activity interference, past interval | 0.84 | 0.75 – 0.90 | 0.91 | 0.85 – 0.94 |
| Chronic Pain Grade | 0.88 | 0.81 – 0.95 | 0.77 | 0.66 – 0.86 |
| High-impact pain | 0.89 | 0.79 – 0.96 | 0.72 | 0.52 – 0.86 |
Internal consistency was determined by Cronbach’s alpha.
Temporal stability for subscales and items was assessed as intraclass correlation coefficient (ICC) for agreement.
Temporal stability for chronic pain grade and high-impact pain were assessed using weighted kappa and standard kappa, respectively.
CL: confidence limits. For internal consistency variables, 95% confidence limit (CL) represents lower-bound only
The internal consistency coefficients of the items within each of CPI and interference scores were equally reliable when comparing GCPS 1-month and GCPS 6-months. Of note, Cronbach’s alpha for 1-month CPI was greater than that for 6-months CPI, suggesting recency effects in accuracy of recall. The interference score, perhaps not surprisingly given the absence of the most labile measure – current pain intensity, exhibited greater internal consistency than that for CPI within each GCPS version.
Agreement (Table 3).
Temporal stability, assessed as ICC for agreement between two administrations of the same GCPS version, for each of CPI and interference differed some in comparing the coefficients for 1-month vs. 6-months versions. The substantial overlap in CLs indicates that the estimates, hovering around 0.88, remain excellent. The stability coefficients of the single-item components of those two composite scores are all in the excellent range, with the exception of the stability of current pain intensity. Of note, however, was that for the 1-month version the stability coefficient for worst pain reporting was significantly better than current pain or average pain intensity. For the 6-months version, worst pain reporting over the preceding 6-months also exhibited greater stability than for current pain. Stability of reporting number of disability days for GCPS 1-month was notably higher at 0.89 compared to the GSPC 6-months version at 0.66, suggesting that recency of recall is a distinct advantage for the 30-day reference period of GCPS 1-month, despite the much longer period for test-retest assessment of the inevitable good vs. bad days.
The temporal stability of cut-points for disability days was 0.88 (95%CLs 0.81,0.92) in GCPS 1-month and 0.90 (95%CL 0.85,0.94) in GCPS 6-months, whereas for the interference score it was 0.64 (95%CL 0.47,0.76) in the GCPS 1-month and 0.85 (95%CL 0.76,0.90) in GCPS 6-months. For both types of cut-points, the point estimates did not differ between 1-month and 6-months versions. The total points (sum of disability days points and interference points) exhibited temporal stability 0.84 (95%CL 0.76,0.90) for GCPS 1-month and 0.90 (95%CL 0.84,0.94) for GCPS 6-months. While the temporal stability of chronic pain grade and associated high-impact pain were equal and higher for GCPS 1-month than the respective measures from GCPS 6-months, the estimates were not significantly higher.
The stability of classification was computed as AUC for each of 1-month and 6-months versions, using classification at the retest administration as the reference standard; AUC was 89% and 83%, respectively. Change in classification from first to second administration, for each of GCPS 1-month and 6-months, occurred in 8% and 16%, respectively, of individuals.
Measurement precision.
As indicated in Table 4, standard error of measurement (SEM) was comparable across the two versions (GCPS 1-month vs. 6-months) for CPI (8.0 vs. 8.1) and interference (4.6 vs. 5.2). However, for disability days, SEM was 1.3 for the 1-month reference period and 11.3 for the 6-months reference period. When the number of disability days was converted to a percentage of the respective period, SEM was 4.6 for the 1-month period and 8.9 for the 6-months period.
Table 4.
Precision of measurement and comparison of GCPS 1-month with GCPS 6-months.
| GCPS attribute | Measurement precision of primary attributes |
Comparison of mean score: GCPS 1-month versus GCPS 6-months |
|||||||
|---|---|---|---|---|---|---|---|---|---|
| GCPS 1- month |
GCPS 6- months |
||||||||
| SD | SEM | SD | SEM | Mean difference |
SD of mean difference |
Mean abs difference |
RMS difference |
Proportion of differences < 1.96 SEM |
|
| CPI | 21.8 | 8.0 | 20.1 | 8.1 | −5.6 | 14.0 | 11.4 | 15.0 | 0.90 |
| Disability days* | 5.0 | 4.6 | 4.8 | 8.9 | 0.2 | 14.0 | 4.7 | 14.0 | 0.33 |
| Interference | 13.5 | 4.6 | 19.8 | 5.2 | −6.3 | 17.1 | 11.2 | 18.2 | 0.69 |
scaled as proportion of respective time periods
Reliability (Table 5; Figure 2).
Table 5.
Consistency between respective Graded Chronic Pain Scale (GCPS) 1-month & GCPS 6-months items, subscales, and classifications from GCPS and high-impact pain (n=510). All estimates p<0.000.
| Measures | Estimate1 | 95% CL2 |
|---|---|---|
| Characteristic Pain Intensity | 0.78 | 0.74 – 0.81 |
| Current pain intensity | 0.66 | 0.61 – 0.70 |
| Worst pain, past interval | 0.75 | 0.70 – 0.78 |
| Average pain, past interval | 0.67 | 0.62 – 0.71 |
| Number of disability days, past interval | 0.54 | 0.47 – 0.60 |
| Interference | 0.66 | 0.61 – 0.71 |
| Daily activity interference, past interval | 0.61 | 0.56 – 0.66 |
| Recreational interference, past interval | 0.64 | 0.58 – 0.68 |
| Work activity interference, past interval | 0.63 | 0.58 – 0.68 |
| Chronic Pain Grade3 | 0.69 | 0.58 – 0.74 |
| High-impact pain4 | 0.50 | 0.42 – 0.59 |
Unless otherwise stated, estimate refers to the intraclass correlation coefficient (ICC) for consistency. Chronic pain grade and high-impact pain were assessed using weighted kappa and standard kappa, respectively.
CL: confidence limits
Percent agreement: 96.5
Percent agreement: 95.1
Figure 2.

Consistency between GCPS 1-month and 6-months of primary component measures. Values from GCPS 1-month and 6-months versions are plotted as difference (computed as 1-month – 6-months) on y-axis, and the GCPS 1-month score is plotted on the x-axis. Figures A (characteristic pain intensity) and C (interference score) display mean of the differences as significantly different from 0, whereas in Figure B (disability days, computed as proportion of the days within the respective periods), the mean difference was not different from 0. The upper and lower bounds, marked as 95%CL, represent 1.96 SDs. Jitter was added to each plot in order to better separate individuals with same x-y values. Regression results are described in the text.
CPI was the most consistent (ICC=0.78) in comparing 1- vs. 6-months versions, followed by the interference score (ICC=0.66), and finally by disability days (ICC=0.54), with each of these estimates surrounded by largely non-overlapping CLs. In addition, the 1-month CPI, as a composite measure, exhibited significantly greater consistency with the 6-months CPI compared to two of its three component measures. The stand-out component measure was worst pain intensity, which also exhibited the highest temporal stability among the three pain intensity measures, especially for the 1-month version (Table 3). Each of the single items comprising the interference score exhibited consistency of approximately 0.61-0.64 between 1- and 6-months versions. Plots for each of CPI, disability days, and interference score are presented in Figure 2. The plots and table show the mean bias ± SD between 1-month and 6-months for CPI as −5.6 ±14.0, and limits of agreement −33.0 and 21.7 (Figure 2a); for disability days as 0.1 ±4.3, and limits of agreement −8.2 and 8.3 (Figure 2b); and for interference as −6.3 ±17.1, and limits of agreement −39.9 and 27.2 (Figure 2c). Regression of the difference score on GCPS 1-month score indicated a significant (p<0.001) slope for each of the three measures: CPI, beta=0.28; disability days (proportional), beta=0.40; and interference score, beta=0.21. After CPI and worst pain intensity, GCPS grade had the third strongest relationship (reliability of 0.69) between 1- and 6-months versions, illustrating the value of a composite index. High-impact pain classification, based on 1-month vs that of 6-months, was moderate at 0.50.
Validity (Table 6; Figure 3).
Table 6.
Validity comparison variables. Dark grey cells indicate observed stronger correlations, light grey cells indicate observed modest correlations, and non-shaded cells indicate observed weak correlations. Values shown are Pearson correlations except as indicated by * which denotes Spearman correlations for all associations with that variable. Sample sizes: n=510 for all analyses, except: Pain severity, n=509; Activity interference, n=509, General activity, n=509; Mental and Physical Component Summary, n=495.
| GCPS 1-month | GCPS 6-months | |||||
|---|---|---|---|---|---|---|
| Validity measures (time periods) | Characteristic Pain Intensity |
Interference | Chronic Pain Grade* |
Characteristic Pain Intensity |
Interference | Chronic Pain Grade* |
| Pain severity1 (1 week) | 0.83 | 0.57 | 0.72 | 0.68 | 0.52 | 0.61 |
| General distress2 (few weeks) | 0.22 | 0.31 | 0.27 | 0.21 | 0.32 | 0.20 |
| Depression3 | 0.23 | 0.29 | 0.28 | 0.18 | 0.28 | 0.20 |
| Anxiety3 | 0.22 | 0.29 | 0.21 | 0.17 | 0.25 | 0.10 |
| Physical symptoms3 | 0.36 | 0.37 | 0.40 | 0.28 | 0.32 | 0.30 |
| Mental Component Summary4 (1 month) | 0.06 | 0.17 | 0.13 | 0.05 | 0.16 | 0.04 |
| General activity1 (1 week) | −0.03 | −0.09 | −0.06 | −0.01 | −0.07 | −0.06 |
| Activity interference1 (Not defined) | 0.50 | 0.61 | 0.56 | 0.44 | 0.54 | 0.48 |
| Physical Component Summary4 (1 month) | 0.34 | 0.38 | 0.35 | 0.28 | 0.37 | 0.34 |
Source: Multidimensional Pain Inventory (MPI); reference time periods are approximate because the time period for some items is not defined.
Source: General Health Questionnaire-28 (GHQ)
Source: Symptom Checklist-90 (SCL90)
Source: Short Form-12 (version 2) (SF12v2); scores reversed: higher values reflect worse attribute.
Figure 3.

Comparison to other variables
Scatter plots of observed correlation coefficients are shown for the three GCPS attributes in Table 6: characteristic pain intensity (CPI; A), interference (B), and chronic pain grade (1-4, C). Each correlation coefficient (see Table 6) assesses the relationship between the indicated validity predictor with the 1-month version and with the 6-months version. Each plot includes a line of unity (red) representing the location of equal correlations between the comparison variable with GCPS 1-month and the comparison variable with GCPS 6-months. Within each plot, the correlation coefficients and the label for the respective comparison variable are shown; see Table 5 for details regarding each label and respective sample sizes. A least-squares regression line (black) is added in order to help demonstrate the rank order of the coefficients as a group. If rank-order did not hold jointly for both 1-month and 6-months versions, the position of the correlation coefficients for a given pair of associations would be located away from the regression line; for example, in Figure C, Physical CS (Component Summary) is located on the line of unity but away from the regression line that unites all of the other correlations for GCPS grade, indicating that Physical CS has a relatively equal correlation with GCPS 6-months and GCPS 1-month, in contrast to the context provided by all of the other variables which have greater correlation with GCPS 1-month. For all other correlation coefficients in Figures A, B, and C, their joint magnitude, in relating the strength of association with each of GCPS 1-month and GCPS 6-months, follows a strongly linear structure. The line of unity illustrates the relatively greater strength of association for the predictor variables as a group with GCPS 1-month, vs with GCPS 6-months. For each of CPI, interference, and GCPS grade, the dimension shifts from general activity at the low end to pain severity at the high end. And, for each of CPI, interference, and GCPS grade, general activity exhibits equal association with each of GCPS versions, whereas pain severity exhibits a stronger association with GCPS 1-month.
Starting with CPI 1-month and 6-months, respectively, the correlations with pain severity were 0.83 and 0.68, which denotes a strong relationship between two pain intensity measures assessing the same recent period; correlations with activity interference were 0.50 and 0.44, which indicates that pain and activity have an expected modest relationship; and the correlations with the rest of the validity measures were notably lower, explaining 0-14% of the variance and representing clear discriminant validity. Continuing with interference 1-month and 6-months, correlations with pain severity decreased relative to CPI and denoted evidence of discriminate validity, correlations with activity interference were maximal, which denoted convergence validity, and the correlations with the rest of the validity measures were notably lower, explaining 05-14% of the variance and representing clear discriminant validity. Finally, with chronic pain grade 1-month and 6-months, correlations with pain severity were 0.72 and 0.61, explained by the high proportion of individuals with Grades 1 and IIa; correlations with activity interference were 0.56 and 0.48, again, expected as modest convergent validity; and the correlations with the rest of the validity measures were notably lower, explaining 0-14% of the variance and representing clear discriminant validity.
For each comparison variable, the correlations with each of the GCPS 6-months version attributes were generally attenuated, compared to the respective 1-month attribute. In considering the comparison variables as a group and noting the observed weak, moderate, and strong correlations between the comparison variable and the indicated GCPS attribute, the coefficients within the corresponding columns for GCPS 1-month out-performed the 6-months versions. For example, the coefficient for pain severity within each of the 1-month versions of CPI, interference, and chronic pain grade were greater by 0.15, 0.05, and 0.11 from each of the 6-months versions, respectively.
This rank ordering is perhaps better illustrated in Figure 3, a scatter plot of observed labeled correlation coefficients comparing the values obtained for the 1-month version with those for the 6-months version, where the three plots correspond to the three attributes shown for each of GCPS 1-month and 6-months in Table 6. Within each plot, a least-squares black regression line was added to help demonstrate any divergence in the rank order of the coefficients. If rank-order did not hold jointly for each of GCPS 1-month and 6-months versions, the coefficient would be located far away from the black regression line. The red line of unity was also included as another reference point, which would indicate equal strength of association for GCPS 1-month and GCPS 6-months relationships with the validity predictors. However, the presence of the black regression line in the lower triangle (albeit marginally) for all three attributes indicated relatively greater strength of association for GCPS 1-month attributes compared to those in the 6-months version.
Accuracy.
The AUC comparing binary high-impact pain from GCPS 1-month with that from 6-months as the reference standard was 0.76, with sensitivity of 62% and specificity of 90%. The optimal cut-point in comparing all grades of GCPS 1-month with high-impact pain at 6-months was at the grade of 2b, with same AUC, sensitivity, and specificity.
Discussion
The present study compared the reliability and validity of the GCPS 1-month version to the 6-months version in a representative sample of individuals with chronic TMDs and found that, overall, the GCPS 1-month has very good psychometric properties, while the GCPS 6-months, with a few exceptions, is nearly as good. Present findings are consistent with prior reports indicating that the accuracy of pain report in comparison to daily diary data worsens with longer recall periods.21 Overall, these findings suggest that individuals with chronic pain retrospectively report their pain characteristics with sufficiently comparable fidelity regardless of whether the reference period is the prior 1-month or prior 6-months. However, the reference period matters greatly, and pain characteristics, other than pain intensity, measured from one reference period cannot be substituted for the other reference period. Pain grade and presence of high-impact pain are reference period-specific. Moreover, restricting the GCPS 1-month to pain intensity and pain interference, two parallel dimensional measures with the best psychometric properties, would better serve assessment goals for a short-term period and cleanly separate purpose from the assessment of high-impact pain.
Reliability of the subscales for CPI and interference was acceptable and comparable when contrasting the two GCPS versions. Composite indices of CPI and interference were better than the individual items for both versions. Taken together, the three temporal stability findings suggest that recency of recall is a distinct advantage for the 30-day reference period of the 1-month version and that worst pain is a signal episode promoting better memory and recall in both GCPS versions. One implication is that the 6-months-based pain classification may not accurately reflect the individual’s current status.
Four sets of cut-points were considered for scoring disability days: 0, 1, 3, 6; 0, 2, 3, 5; 0, 2, 3, 6; and 0, 2, 4, 6. In considering the contrasting sets of cut-points for the GCPS 1-month disability days points, the point estimates for consistency did not differ between the four versions. Given the highly skewed distribution of this measure, further tweaking of cut-offs for assigning points to 1-month disability days would not be productive beyond the final selected version of 0, 2, 3, 5. In other words, disability days, as a proportion of the reference period, was a relatively poor measure when attempting to compare reference periods. Moreover, the accuracy of capturing the extent of pain-related disability may also be affected by continuous pain vs. discrete episodes,21 which affects recall of memory. Consequently, we recommend that the measurement of 1-month disability days be considered secondary or omitted. Within the respective reference periods and acknowledging that the pain-related disability classification of the person may differ according to GCPS version, ignoring 1-month disability days implies that 1-month chronic pain grade classification would not be computed and consequently the high-impact pain classification would not be used. Further explanation on the low validity of the high-impact pain classification is provided below.
In comparing 1-month and 6-months versions, CPI remained an excellent measure for pain intensity, whereas interference score was less so though still acceptable as a reliable and consistent measure of the person. These constructs can be appropriately measured at baseline in a clinical trial using GCPS 1-month. The implication is that with chronic pain, the reporting of intensity and interference from a 6-months period is relatively stable, while the agreement at a 6-months interval with daily diary data is affected by under-estimation in the pain report in 57% and by over-estimation in 20% of cases.21 In summary, while the GCPS 1-month outperforms the 6-month version in some areas, both versions are equally acceptable in terms of psychometric properties. Item and subscale scores should be interpreted equivalently (i.e., at the construct level).
Validity of the 1-month GCPS can be assessed in several ways. Concepts of validity as assessed through construct validity using other measures known to affect pain experience indicate consistency of relationships when contrasting GCPS1-month vs. GCPS 6-months, yet with a trend towards stronger relationships for the GCPS 1-month, which is not surprising given the shorter time frame of the 1-month version overlaps well with the shorter time frames of the other related constructs. In considering the relationships between individual components of the GCPS 1-month and 6-months with the validity measures, the correlations with pain severity and with activity interference were notably stronger for convergent validity, while the rest of the measures had modest relationships, indicating discriminant validity. For CPI, the correlations with pain severity were the strongest and were less strong with activity interference, again an expected pattern; moreover, a somewhat strong relationship would be expected with activity interference, given that pain inhibits function (or the motivation to function). In contrast, for GCPS interference, the relative strength of the correlations with pain severity and activity interference were reversed relative to those exhibited by CPI, again demonstrating an expected pattern for convergent validity. These results, based on persons with TMDs, are comparable to those in individuals with chronic back pain, also assessed with GCPS 1-month,22 for both internal consistency and temporal stability of the two composite measures. The Short Form pain severity measure correlates comparably with CPI and interference for both those with TMD and back pain. In contrast, and as expected, physical function (SF36) correlates higher with both CPI and interference in those with back pain compared to the lower correlations by PCS (as a SF12 surrogate for the physical function scale) in those with TMDs. Consequently, we regard results from the present sample as generalizing broadly to application of the GCPS 1-month for those with musculoskeletal pain.
The validity of high-impact pain classification, based on 1-month vs. that of 6-months, was moderate at 0.50, perhaps reflective of the short-term instability of classification with GCPS 1-month (weighted Kappa=0.69). As indicated, this short-term instability in classification by the 1-month version, affecting the validity of high-impact pain classification, points to changes in patient status perhaps due to intermittent adaptive coping by individuals who are on the border between low- and high-impact pain and suggests that too much variability in status exists within a short period for a reliable classification. For example, coping could increase when pain-related disability increases, and then, when the individual is functioning better, coping would decrease; conditional coping would lead to back-and-forth classification as having high-impact pain. For those with greater severity of high-impact pain, a process such as fear-avoidance could facilitate such individuals remaining within the high-impact category,52 yet report less pain-related disability after receiving treatment for the fear-avoidance.53 Sensitivity of 62% and specificity of 90% for GCPS 1-month highlight how the short reference period can lead to nearly 40% false negatives (and only 10% false positives) relative to a classification based on longer term. These findings suggest that the classification of high-impact pain should rely on a longer assessment period, and that the importance of high-impact pain may lie within identified co-variates as potential modifiable risk factors and thus as treatment targets. Examples of such modifiable risk factors include illness attribution to injury, other pain disorders, fear-avoidance, or catastrophizing, and, based on our results, their relevance should be considered on the basis of a longer (e.g., 6-months) reference period for classifying the individual as having high-impact pain.
The comparisons investigated here between recalled pain and disability over a prior 1-month vs. 6-months period should be contrasted with recent developments in assessing high-impact pain.29 Acknowledging that differing time periods used by pain and disability instruments result in considerable challenge in equating such data, the most recently recommended measure for assessing the presence of high-impact pain uses reference periods of both 3-months and 7-days.29 Based on our comparison of the GCPS 1-month with the GCPS 6-months, we note that classifying individuals with some days of pain in the past three months as chronic pain absent (Grade 0) without assessing disability would potentially under-estimate the prevalence of chronic pain, and that the 7-day reference period from the PEG does not generalize well to the 3-months reference period. This mixed use of short and long time periods would require further assessment to ground it in day-to-day life as one might attempt to retrieve from memory. While this approach for identifying individuals with high-impact pain is highly efficient, the suggested replacement of this approach for that pioneered by the GCPS for clinical use appears to create limitations in what a clinician’s mind needs to entertain regarding progress (or not) with treatment. Similarly, we see limitations in identifying individuals with high-impact pain for research when the goal is to understand the impact of individual conditions on the individual.27,54
Despite the remarkable similarity in the mean disability days reported as a proportion when comparing GCPS 1-month and 6-months, the poorer correspondence in the respective points for disability days results in non-commensurate reporting of disability days from a shorter period nested within a longer period. This is probably influenced by memory (better for just prior 30-day period than for prior 6-months period) but is probably more so a function of the dynamic character of pain’s impact. While the selected approaches for each of disability days cut-points and interference scale cut-points were not the best performing, an equal consideration is maintenance of a coherent scoring method between GCPS versions.
Some potential limitations are worth noting. The primary concerns are the use of a single disease sample, TMDs, and the overlapping periods of assessment by the GCPS 1-month and 6-months without an accompanying use of a daily diary for pain intensity, pain interference, and pain disability days. We do not believe that the restriction to only those with TMD represents a substantial real limitation, given the abundant literature already comparing pain and interference assessment amongst those with TMDs, headache, and back pain by the 6-month GCPS as comparable.2,26,55 And, because the present findings extend beyond, but are consistent with, those initially reported for a preliminary GCPS 1-month instrument in back pain, the application of the well-published findings from the 6-months instrument to 1-month assessment in TMDs appears justified. The use of daily diaries as the reference standard for any symptom assessment instrument that asks the respondent to integrate a period of time is well-established; the findings for pain instruments generally show high concordance.13,56 Of note, however, in comparing the 1-month to the 6-months versions, we are asking if the 1-month is as good as the already established 6-months version; the only way to know if the 1-month version were better (i.e., greater reliability and validity) would be by using daily symptom diaries.
The strengths of this study are that the age and chronicity range insure reasonable generalizability to the population of interest and that the diagnostic heterogeneity demonstrates that the observed relationships apply to musculoskeletal conditions, broadly. Consequently, a GCPS with a shorter reference frame may prove to have better clinical utility than the GCPS 6-months. In addition, a recently developed diagnostic system utilizes the prior 1-month (30-days) as a reference period for the necessary presence of pain for pain-based diagnoses.57 In addition to the advantages of a short version, as already described, a 1-month version would assess the same time period as the clinical physical examination (Axis I) and bio-behavioral questionnaires (Axis II) of the Diagnostic Criteria for Temporomandibular Disorders.57
While other measures exist for pain intensity and pain interference (e.g., single item pain intensity measures; PROMIS pain intensity and pain interference measures; Brief Pain Inventory, BPI), the 1-month CGPS 1-month has some specific advantages: (1) single items for assessment of pain over a time period other than very recent and short are less reliable and have greater difficulty for interpretation; (2) there is value in having a pain intensity measure parallel in structure for a short period (e.g., clinical trials, coordinated with time frame for diagnostic criteria) that can be coupled with the same pain intensity measure for a longer period (e.g., baseline for a clinical trial, assessing pain prior to entry into a study), and the GCPS 1-month and 6-months versions are perfectly coupled; (3) there is also value in having a pain intensity and pain interference measure that is long enough to better capture day-to-day variations, and the selection of 24-hours (from the BPI) vs. 30-days (from the GCPS 1-month) should be based on specific need; (4) the GCPS-1 month version automatically incorporates the interference dimension which clinicians will often choose to ignore as part of a standard measure; (5) a minimum number of items (three for each of pain intensity and pain interference) provide strong measures for two constructs; and (6) paper and pencil instruments that are sufficiently brief remain useful in many clinical settings.
Conclusion
Reliability of the GCPS 1-month out-performs the 6-months version for pain intensity and pain interference; the GCPS 1-month is equally valid with the GCPS 6-months for those constructs. The reported number of pain disability days, if measured in the GCPS 1-month, should be regarded as representative of only the prior 30 days; the pain disability classification, based on only a 1-month window, should not be used. Sensitivity to change remains an important attribute requiring further research.
Supplementary Material
Acknowledgments
This research was funded by National Institutes of Health (NIH/NIDCR) [grant number U01-DE013331]. The authors report no conflict of interest.
Footnotes
GCPS 1-month instrument and scoring manual can be downloaded from https://ubwp.buffalo.edu/rdc-tmdinternational/other-instruments-2/
Contributor Information
S. Sharma, Department of Oral Diagnostic Sciences, University at Buffalo, School of Dental Medicine, Buffalo, New York, USA; Department of Orofacial Pain and Jaw Function, Faculty of Odontology, Malmö University, Malmö, Sweden.
M. A. Kallen, Department of Medical Social Sciences, Feinberg School of Medicine, Northwestern University, Chicago, Illinois, USA.
R. Ohrbach, Department of Oral Diagnostic Sciences, University at Buffalo, School of Dental Medicine, Buffalo, New York, USA.
References
- 1.Von Korff M Assessment of chronic pain in epidemiological and health services research: Empirical bases and new directions. In: Turk DC, Melzack R, eds. Handbook of Pain Assessment. New York: Guilford Press, 2011:455–473. [Google Scholar]
- 2.Von Korff M, Dworkin SF, LeResche L. Graded chronic pain status: an epidemiologic evaluation. Pain 1990;40:279–291. [DOI] [PubMed] [Google Scholar]
- 3.Von Korff M, Dworkin SF, LeResche L, et al. An epidemiologic comparison of pain complaints. Pain 1988;32:173–183. [DOI] [PubMed] [Google Scholar]
- 4.Ohrbach R, Turner JA, Sherman JJ, et al. Research Diagnostic Criteria for Temporomandibular Disorders. IV: Evaluation of Psychometric Properties of the Axis II Measures. J Orofacial Pain 2010;24:48–62. [PMC free article] [PubMed] [Google Scholar]
- 5.Ghiselli EE, Campbell JP, Zedeck S. Measurement Theory for the Behavioral Sciences. New York: W.H.Freeman and Company, 1981. [Google Scholar]
- 6.Dworkin SF, Huggins KH, Wilson L, et al. A randomized clinical trial using research diagnostic criteria for temporomandibular disorders-axis II to target clinic cases for a tailored self-care TMD treatment program. J Orofacial Pain 2002;16:48–63. [PubMed] [Google Scholar]
- 7.Dworkin SF, Turner JA, Mancl L, et al. A randomized clinical trial of a tailored comprehensive care treatment program for temporomandibular disorders. J Orofacial Pain 2002;16:259–276. [PubMed] [Google Scholar]
- 8.Hawker GA, Mian S, Kendzerska T, et al. Measures of adult pain: Visual Analog Scale for Pain (VAS Pain), Numeric Rating Scale for Pain (NRS pain), McGill Pain Questionnaire (MPQ), Short-Form McGill Pain Questionnaire (SF-MPQ), Chronic Pain Grade Scale (CPGS), Short Form-36 Bodily Pain Scale (SF-36 BPS), and Measure of Intermittent and Constant Osteoarthritis Pain (ICOAP). Arthritis Care Res 2011;63:S240–S252. [DOI] [PubMed] [Google Scholar]
- 9.de Vet HC, Terwee C, Mokkink L, et al. Measurement in Medicine. New York: Cambridge University Press, 2011. [Google Scholar]
- 10.Streiner DL, Norman GR. Health Measurement Scales: A Practical Guide to Their Development and Use. New York: Oxford University Press, 2008. [Google Scholar]
- 11.Ostelo RW, Deyo RA, Stratford P, et al. Interpreting change scores for pain and functional status in low back pain: towards international consensus regarding minimal important change. Spine 2008;33:90–94. [DOI] [PubMed] [Google Scholar]
- 12.Stratford PW, Riddle DL. Assessing sensitivity to change: choosing the appropriate change coefficient. Health Qual Life Outcomes 2005;3:1–7. [DOI] [PMC free article] [PubMed] [Google Scholar]
- 13.Allen KD, Coffman CJ, Golightly YM, et al. Comparison of Pain Measures Among Patients With Osteoarthritis. J Pain 2010;11:522–527. [DOI] [PubMed] [Google Scholar]
- 14.Alghadir AH, Anwer S, Iqbal A, et al. Test–retest reliability, validity, and minimum detectable change of visual analog, numerical rating, and verbal rating scales for measurement of osteoarthritic knee pain. J Pain Res 2018;11:851. [DOI] [PMC free article] [PubMed] [Google Scholar]
- 15.Adamczyk WM, Farley D, Wiercioch-Kuzianik K, et al. Memory of pain in adults: a protocol for systematic review and meta-analysis. Syst Rev 2019;8:1–6. [DOI] [PMC free article] [PubMed] [Google Scholar]
- 16.Erskine A, Morley S, Pearce S. Memory for pain: a review. Pain 1990;41:265. [DOI] [PubMed] [Google Scholar]
- 17.Eich E, Reeves JL, Jaeger B, et al. Memory for pain: relation between past and present pain intensity. Pain 1985;23:375–380. [DOI] [PubMed] [Google Scholar]
- 18.Jamison RN, Sbrocco T, Parris WCV. The influence of physical and psychosocial factors on accuracy of memory for pain in chronic pain patients. Pain 1989;37:289–294. [DOI] [PubMed] [Google Scholar]
- 19.Mason S, Fauerbach J, Haythornthwaite J. Assessment of acute pain, pain relief, and patient satisfaction. In: Turk DC, Melzack R, eds. Handbook of Pain Assessment. New York: Guilford Press, 2011:283–293. [Google Scholar]
- 20.Bąbel P Memory of pain and affect associated with migraine and non-migraine headaches. Memory 2015;23:864–875. [DOI] [PubMed] [Google Scholar]
- 21.McGorry RW, Webster BS, Snook SH, et al. Accuracy of pain recall in chronic and recurrent low back pain. J Occup Rehabil 1999;9:169–178. [Google Scholar]
- 22.Underwood MR, Barnett AG, Vickers MR. Evaluation of two time-specific back pain outcome measures. Spine 1999;24:1104–1112. [DOI] [PubMed] [Google Scholar]
- 23.Ohrbach R. Assessment and further development of RDC/TMD Axis II biobehavioural instruments: a research programme progress report. J Oral Rehabil 2010;37:784–798. [DOI] [PMC free article] [PubMed] [Google Scholar]
- 24.Schiffman EL, Truelove EL, Ohrbach R, et al. The Research Diagnostic Criteria for Temporomandibular Disorders. I: overview and methodology for assessment of validity. J Orofacial Pain 2010;24: [PMC free article] [PubMed] [Google Scholar]
- 25.Schiffman EL, Ohrbach R, Truelove EL, et al. The Research Diagnostic Criteria for Temporomandibular Disorders. V: Methods used to establish and validate revised Axis I diagnostic algorithms. J Orofacial Pain 2010;24:63–78. [PMC free article] [PubMed] [Google Scholar]
- 26.Von Korff M, Ormel J, Keefe FJ, et al. Grading the severity of chronic pain. Pain 1992;50:133–149. [DOI] [PubMed] [Google Scholar]
- 27.Ohrbach R, Sharma S, Fillingim RB, et al. Clinical characteristics of pain among five chronic overlapping pain conditions. J Oral Facial Pain Headache 2020;34:s29–s42ad. [DOI] [PMC free article] [PubMed] [Google Scholar]
- 28.Ohrbach R, Fillingim RB, Mulkey F, et al. Clinical findings and pain symptoms as potential risk factors for chronic TMD: Descriptive data and empirically identified domains from the OPPERA case-control study. J Pain 2011;12:T27–T45. [DOI] [PMC free article] [PubMed] [Google Scholar]
- 29.Von Korff M, DeBar LL, Krebs EE, et al. Graded chronic pain scale revised: mild, bothersome, and high-impact chronic pain. Pain 2020;161:651–661. [DOI] [PMC free article] [PubMed] [Google Scholar]
- 30.Dworkin SF, Sherman JJ, Mancl L, et al. Reliability, validity, and clinical utility of RDC/TMD Axis II scales: Depression, non-specific physical symptoms, and graded chronic pain. J Orofacial Pain 2002;16:207–220. [PubMed] [Google Scholar]
- 31.Sharma S, Slade GD, Fillingim RB, et al. Attributes germane to temporomandibular disorders and their associations with five chronic overlapping pain conditions. J Oral Facial Pain Headache 2020;34:s57–s72e. [DOI] [PMC free article] [PubMed] [Google Scholar]
- 32.Von Korff M Epidemiologic and survey methods: chronic pain assessment. In: Turk DC, Melzack R, eds. Handbook of Pain Assessment. New York: Guilford Press, 1992:389–406. [Google Scholar]
- 33.Derogatis LR. SCL-90-R: Symptom Checklist-90-R. Administration, Scoring and Procedures Manual. Minneapolis, MN: National Computer Systems, 1994. [Google Scholar]
- 34.Fillingim RB, Ohrbach R, Greenspan JD, et al. Associations of psychological factors with multiple chronic overlapping pain conditions. J Oral Facial Pain Headache 2020;34:s85–s100a. [DOI] [PMC free article] [PubMed] [Google Scholar]
- 35.Suvinen TI, Reade PC, Hanes KR, et al. Temporomandibular disorder subtypes according to self-reported physical and psychosocial variables in female patients: a re-evaluation. J Oral Rehabil 2005;32:166–173. [DOI] [PubMed] [Google Scholar]
- 36.Rudy TE, Turk DC, Zaki HS, et al. An empirical taxometric alternative to traditional classification of temporomandibular disorders. Pain 1989;36:311–320. [DOI] [PubMed] [Google Scholar]
- 37.Flor H, Turk DC. Chronic back pain and rheumatoid arthritis: predicting pain and disability from cognitive variables. J Behav Med 1988;11:251–265. [DOI] [PubMed] [Google Scholar]
- 38.Kerns RD, Turk DC, Rudy TE. The West Haven-Yale Multidimensional Pain Inventory (WHYMPI). Pain 1985;23:345–356. [DOI] [PubMed] [Google Scholar]
- 39.Goldberg DP, Gater R, Sartorius N, et al. The validity of two versions of the GHQ in the WHO study of mental illness in general health care. Psychol Med 1997;27:191–197. [DOI] [PubMed] [Google Scholar]
- 40.Ware JE Jr., Kosinski M, Keller SD. A 12-Item Short-Form Health Survey: construction of scales and preliminary tests of reliability and validity. Medical Care 1996;34:220–233. [DOI] [PubMed] [Google Scholar]
- 41.Luo X, Lynn George M, Kakouras I, et al. Reliability, validity, and responsiveness of the short form 12-item survey (SF-12) in patients with back pain. Spine 2003;28:1739–1745. [DOI] [PubMed] [Google Scholar]
- 42.Devellis RF. Scale Development Theory and Applications. California: Sage Publications, Inc., 2003. [Google Scholar]
- 43.Taylor R Interpretation of the correlation coefficient: a basic review. J Diagn Med Sonogr 1990;6:35–39. [Google Scholar]
- 44.Shrout PE, Fleiss JL. Intraclass correlations: uses in assessing rater reliability. Psychol Bull 1979;86:420–428. [DOI] [PubMed] [Google Scholar]
- 45.Berchtold A Test–retest: agreement or reliability? Methodological Innovations 2016;9:2059799116672875. [Google Scholar]
- 46.Cohen J Weighted kappa: Nominal scale agreement provision for scaled disagreement or partial credit. Psychol Bull 1968;70:213. [DOI] [PubMed] [Google Scholar]
- 47.Landis JR, Koch GG. The measurement of observer agreement for categorical data. Biometrics 1977;159–174. [PubMed] [Google Scholar]
- 48.Fleiss JL, Cohen J. The equivalence of weighted kappa and the intraclass correlation coefficient as measures of reliability. Educational and Psychological Measurement 1973;33:613–619. [Google Scholar]
- 49.de Vet HC, Terwee CB, Knol DL, et al. When to use agreement versus reliability measures. J Clin Epidemiol 2006;59:1033–1039. [DOI] [PubMed] [Google Scholar]
- 50.Bland JM, Altman DG. Statistical methods for assessing agreement between two methods of clinical measurement. Lancet 1986;1:307–310. [PubMed] [Google Scholar]
- 51.Liu X Classification accuracy and cut point selection. Stat Med 2012;31:2676–2686. [DOI] [PubMed] [Google Scholar]
- 52.Rogers DG, Protti TA, Smitherman TA. Fear, Avoidance, and Disability in Headache Disorders. Curr Pain Headache Rep 2020;24:33–33. [DOI] [PubMed] [Google Scholar]
- 53.Zale EL, Ditre JW. Pain-related fear, disability, and the fear-avoidance model of chronic pain. Curr Opin Psychol 2015;5:24–30. [DOI] [PMC free article] [PubMed] [Google Scholar]
- 54.Ohrbach R, Fillingim RB, Greenspan JD, et al. Authors' Response: When You Come to the Fork in the Road, Take It! Future Research into Chronic Pain as a General Condition. J Oral Facial Pain Headache 2020;34:s12–s14. [DOI] [PubMed] [Google Scholar]
- 55.Von Korff M, LeResche L, Dworkin SF. First onset of common pain symptoms: a prospective study of depression as a risk factor. Pain 1993;55:251–258. [DOI] [PubMed] [Google Scholar]
- 56.Heapy A, Dziura J, Buta E, et al. Using Multiple Daily Pain Ratings to Improve Reliability and Assay Sensitivity: How Many Is Enough? J Pain 2014;15:1360–1365. [DOI] [PubMed] [Google Scholar]
- 57.Schiffman E, Ohrbach R, Truelove E, et al. Diagnostic Criteria for Temporomandibular Disorders (DC/TMD) for Clinical and Research Applications: Recommendations of the International RDC/TMD Consortium Network and Orofacial Pain Special Interest Group. J Oral Facial Pain Headache 2014;28:6–27. [DOI] [PMC free article] [PubMed] [Google Scholar]
Associated Data
This section collects any data citations, data availability statements, or supplementary materials included in this article.