Abstract
Drug-resistant melanoma is very difficult to treat, and a novel approach is needed to overcome resistance. The present study aims at identifying the alternate pathways utilized in the dual drug-resistant mouse melanoma cells (B16F10R) for their survival and proliferation. The dual drug-resistant mouse melanoma, B16F10R, was established by treating the cells with a combination of U0126 (MEK1/2 inhibitor) and LY294002 (PI3K-AKT kinase inhibitor) in a dose-escalating manner till they attained a resistance fold factor of ≥2. The altered phosphoproteome in the B16F10R, as compared to the parental B16F10C, was analyzed using a high-resolution Orbitrap Fusion Tribrid mass spectrometer. Histone deacetylases 2 (HDAC2) was validated for its role in drug resistance by using its inhibitor, valproic acid (VPA). In the B16F10R cells, 363 altered phosphoproteins were identified, among which 126 were hyperphosphorylated, and 137 were hypophosphorylated (1.5-fold change). Pathway analysis shows the altered phosphoproteins are from RNA metabolism and cell cycle proteins. Inhibition of HDAC2 by VPA induces apoptosis in B16F10C and B16F10R. The present study highlights the role of HDAC2, a cell cycle regulator, in the development of resistance to dual drugs in murine melanoma. Therefore, designing leads for targeting HDAC2 along with key signaling pathways may be explored in treatment strategies.
Keywords: B16F10, drug resistance, histone deacetylase 2, melanoma, phosphoproteomics, Ras pathway, model, cell lines, chemotherapy, cancer
Introduction
Melanoma is the most dangerous form of skin cancer. Compared to other cancers, melanoma has a relatively extensive set of identified signaling pathways and associated mutations implicated in disease progression [1]. Metastatic melanoma presents an aggressive behavior and tends to metastasize rapidly, and it is considered to have intrinsic resistance to chemotherapy, leading to poor prognosis [2].
The Ras signaling pathway proteins play crucial roles in controlling the activity of several other signaling pathways that regulate normal cellular proliferation. Deregulated Ras proteins significantly contribute to the malignant phenotype of melanoma and are the most common targets for melanoma. In many instances, even after treatment with Ras protein inhibitors, melanoma activates other pathways for proliferation and survival. Several factors contributing to this chemo-resistance are proposed, including increased efflux system, repair, and activation of altered signaling pathways associated with metabolism [3,4].
The RAS/RAF/MEK/ERK (MAPK) and the RAS/PI3K/PTEN/AKT (AKT) are key signaling pathways that are frequently hyper activated and deregulated in melanoma through gene alterations [5]. In melanoma, both positive and negative associations are found between these two pathways [6], with parallel activation and interconnection at different stages [7-9]. Therefore, these signaling pathways are considered important targets in tumor therapy.
Targeted therapies using BRAF and MEK inhibitors, i.e., upstream and downstream of the MAPK pathway, are promising since they have shown impressive clinical responses [10]. Similarly, co-inhibition of PI3K and AKT from AKT pathway are also reported [11]. However, within a year, the tumor becomes resistant to such therapies suggesting the need for more combination therapeutic targets [12]. The mechanism involving these combination therapies is unknown. Therefore, the emerging concept is to tackle the tumor resistance issue with combined targeting of both MAPK and AKT signal transduction pathways [13-15].
Understanding the signaling events is crucial for, (i) studying the alterations leading to cell survival in dual drug resistance, and (ii) among the altered molecules identifying targets for reversing the drug resistance [16]. Although primary tumors, paraffin-embedded samples, cancer cell lines, xenografts, tumor primary cell cultures, and genetically engineered mice, are currently used for this purpose [17,18], the most common method is the development of specific drug-resistant cancer cell lines and studying them at a molecular level [19-21]. The frequently used models to study drug resistance consists of, isogenic pairs of drug-resistant and drug-sensitive (control) cell lines. Development of drug-resistant cell lines using a single drug is already reported [19]. There are limited studies on the development and characterization of dual or multidrug resistance cell line models. Therefore, the current study explores a novel approach of simultaneously inhibiting both signal transduction pathways, i.e., MAPK and AKT, with a combination of two drugs, U0126 (MEK inhibitor), and LY294002 (PI3K inhibitor), for the development of a novel, dual drug resistant mouse melanoma B16F10 model, through gradual induction with the drug combination.
Proteomic analysis is a high-throughput experimental approach that involves studying large-scale proteins-which are translated genetic information-and identify their role in the structure, function, and control of biological processes and pathways. Activation and suppression of proteins is influenced by the post-translational modifications (PTMs). For example, phosphorylation of proteins alters the signal transduction pathways and the ensuing regulation of many cellular processes. Therefore, a better understanding of the alterations in the phosphoproteome of drug-resistant cancer cells and identifying the alternate targets to overcome the drug resistance in them is the need of the hour. Although it is known that the ERK1/2 pathway regulates cellular processes through phosphorylation of key proteins, most studies on development of drug resistance by inhibition of the Ras pathway are focused on gene expression [22]. However, the counteracting phospho-activation of other pathways for survival is reported to be critical in the mechanisms leading to resistance in melanoma [23]. Despite the recent progress in the study of the underlying mechanisms involved in the development of drug resistance in melanoma, little is known about the phosphoproteomic profiling of the inhibited Ras pathway. Therefore, this study uses a phosphoproteomic approach for the identification of novel protein biomarkers that may serve as targets for reversal of drug resistance. The comparison of the phosphoproteomic profile of drug-resistant (B16F10R) versus the drug-sensitive mouse melanoma cells (B16F10C) by using high-resolution tandem mass spectrometry (LC-MS/MS) was adopted for the identification of the altered proteins.
The present study aims at identification of alternate signaling molecules, activated for cell survival and proliferation, in a novel dual drug-resistant mouse melanoma (B16F10) model. U0126 (MEK inhibitor), and LY294002 (PI3K inhibitor), which inhibit two parallel sites of Ras pathway, MEK and PI3K, were used for the development of dual drug resistance. High-resolution liquid chromatography-tandem mass spectrometry was used to evaluate the proteomic and phosphoproteomic expression of the dual drug resistant cell line and its parental cell line. The alterations in the phosphoprotein profile in the drug resistant B16F10R, as compared to that of drug sensitive B16F10C, identified key molecules which could be responsible for resistance towards the drugs used to create this model, and the ensuing cell survival. For validation, valproic acid (VPA) an inhibitor specific for inhibition of histone deacetylase (HDAC1 and HDAC2) was used. VPA is known to elongate the G1 phase of the cell cycle, inhibits HDAC expression and induces cell apoptosis [24].
Materials and methods
Cell lines and culture conditions
A mouse melanoma cell line B16F10, purchased from the National Centre For Cell Science (NCCS Pune, India), were cultured in Dulbecco’s Modified Eagle Medium (DMEM), containing 10% fetal bovine serum (FBS) and 1% antibiotics (100 U/mL penicillin G and 100 mg/mL streptomycin), in a humidified incubator with 5% CO2 at 37°C. U0126 (MEK inhibitor), LY294002 (PI3K inhibitor), procured from Calbiochem, USA, were dissolved in DMSO (Himedia, India), aliquoted for one-time use, and stored at -20°C. Valproic acid (VPA), was purchased from Sigma-Aldrich (St. Louis, MO, USA) and dissolved in DMEM medium just prior to use.
Development of drug-resistant model
Drug-resistant melanoma sublines, B16F10R, were established from parental melanoma cell line (B16F10C) by treating the cells with a combination of U0126 and LY294002 in a dose-escalating manner as follows: a) To start with, one-tenth the concentrations of the IC50 values of U0126 and LY294002, were added to the medium and, b) The medium was replaced every 4th day with fresh media containing the combination of drugs. c) Cell cultures were passaged by trypsinization after 70% confluency. d) When cell death was minimal, the cells were treated with an increase in the dose of the drug combination. The procedure (a-d) was repeated until the concentration of the drugs combination reached IC50 values of the parental cells. The development of resistance to the drug combination (ERK1/2 and AKT inhibitors) was assessed by MTT assay. Cell lines were regarded to be resistant to the drug if the fold resistance factor was ≥2 and used for further experiments [66].
Measurement of cell viability
Cell viability was measured by MTT assay using the methods published earlier [67]. Cells were treated with different concentrations of drugs or vehicle (DMSO) for 72 h, and the 50% inhibition concentrations (IC50) were derived from the dose-response curve. For the development of the drug-resistant model, melanoma cells were cultured in DMEM medium containing the inhibitors, U0126 and LY294002, as described earlier. The fold resistance factor was calculated from IC50 values using the following formula: Fold resistance = IC50 drug-resistant cells/IC50 parental cells. Cell lines were regarded to be resistant to a drug if the resistance factor was ≥2 [66].
Characterization of the drug-resistant cell line models
Live/dead (PI/AO) staining for cell survival
In 24-well plate, cells (5×10⁴) were seeded per well and incubated overnight for attachment. Cells were treated with indicated drugs for 24 h. Following incubation old media was replaced with media (0.5 mL) containing dyes acridine orange (0.01 mg/mL; AO) and propidium iodide (0.01 mg/mL; PI) and incubated for 30 min at 37°C in the dark. PI stains dead cells red and AO stain live cells green. Cells were visualized in phase-contrast microscopy using ZOE Fluorescent Cell Imager (Bio-Rad, Hercules, CA).
Clonogenic survival assay for cell proliferation
B16F10C and B16F10R were trypsinized, counted by trypan blue method and plated onto culture dishes (35 mm) at a density of 300 cells/dish, and incubated for 14-15 days. After incubation, culture dishes were washed with 1X PBS (Himedia, India), fixed with methanol: acetone (1:1 v/v) and stained with Giemsa (Sigma-Aldrich, St. Louis, MO, USA) for 1 h. The remaining staining solution was removed, and culture dishes were washed with distilled water and dried at room temperature. Colonies (>50 cells) were counted under a stereomicroscope (Stemi DV4, Carl Zeiss, Germany).
Liquid chromatography-tandem mass spectrometry (LC-MS/MS) and data analysis
To elucidate mechanisms involved, a systematic quantitative comparison of the phosphoproteome of drug-resistant cells B16F10R versus parental cells B16F10C was performed by mass spectrometry. To meet the high reproducibility of sample preparation two biological replicates of parental and drug-resistant cells were used. Schematic representation of the workflow is given in Figure 1.
Figure 1.
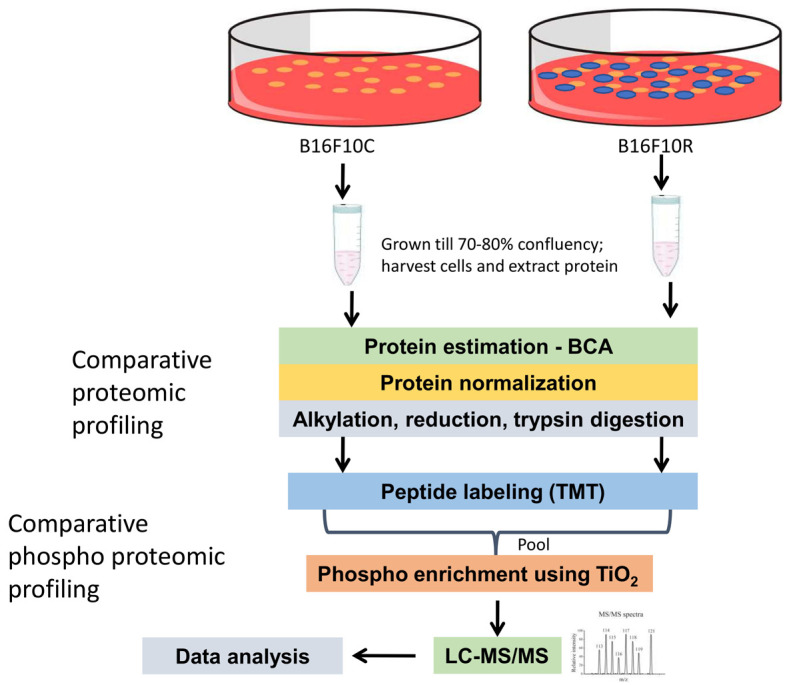
Schematic representation of the workflow for the quantitative proteomic and phosphoproteomic analysis of parental B16F10 cells and drug-resistant B16F10 cells. Cells were allowed to grow to 80% confluency (control were vehicle-treated while resistant cells were treated with 10 µM of U0126 and LY294002). Cells were lysed with lysis buffer and protein samples were digested with trypsin followed by TMT labeling. Samples were pooled after fractionation and phospho-peptides were enriched using TiO2 beads. The resulting samples were analyzed on an Orbitrap Fusion mass spectrometer.
Sample preparation for mass spectrometry analysis
Cells were seeded in 100 mm tissue culture dishes and incubated until 80% confluence. Culture dishes were washed 5 times with chilled 1X PBS (Himedia, India) and serum-starved in DMEM without FBS for 8 hours. After serum starvation, dishes were washed 5 times with chilled PBS. PBS was removed, and cells were lysed using cell lysis buffer (1 mL) containing 4% SDS in 50 mM TEABC (Sigma-Aldrich, India), and phosphatase inhibitors (1 mM sodium orthovanadate, 2.5 mM sodium pyrophosphate, and 1 mM β-glycerophosphate). Cells were harvested using plastic cell scraper (Himedia, Mumbai) and transferred into a centrifuge tube (2 mL) (Axygen, CA, USA). All tubes were sonicated on ice (three cycles of 30 sec with 30% amplitude on a pulse of 5 sec on and off each), and incubated on a dry block at 95°C for 10 min. Tubes were centrifuged at 13,700 rpm for 30 min at room temperature. The supernatant was aliquoted and stored at -80°C until further analysis. Total protein concentration was determined using a bicinchoninic acid (BCA) protein assay kit (Pierce Chemical, Rockford, IL) and BSA (stock 1 mg/mL) was used as a standard.
For quantitative phosphoproteomics equal amount of proteins (800 µg) from B16F10R and B16F10C were reduced by using DTT (10 mM) at 60°C for 20 min. Alkylation was carried out by treating with iodoacetamide (20 mM) at room temperature for 20 min in the dark. The lysate was further subjected to acetone precipitation, and the pellet was dissolved in 50 mM TEABC buffer. Trypsin (Worthington Biochemical Corporation, Lakewood, NJ, USA) digestion was performed (1:20 w/w-trypsin/sample ratio) for 16-18 h at 37°C.
TMT labeling
Trypsin-digested peptides (800 µgms) from each group were labeled with Amine-Reactive Tandem Mass Tag Reagents (TMT6 Label Reagents; Thermo Scientific; #90068) according to the manufacturer’s protocol. The TMT labels were reconstituted before labeling in 24 µL of anhydrous acetonitrile (Sigma-Aldrich, India) and added to the appropriate sample for labeling over 1 h incubation at room temperature (RT). The control cells were labeled with reagent 126 and 128, and resistant cells were labeled with 129 and 131. After 15 min, 5% hydroxylamine (8 µL) was added to quench each reaction. After quenching the reaction, all samples were pooled together and processed for fractionation by basic RPLC.
Basic reverse phase chromatography (bRPLC)-based fractionation
Fractionation of the TMT labeled pooled peptide digest was done using bRPLC. The pooled digested sample was loaded on Waters XBridge column (Waters Corporation, Milford, MA, USA; 130 Å, 5 µm, 250×4.6 mm) using a Hitachi LaChrom Elite HPLC system, maintaining a flow rate of 0.5 mL/min. The peptide separation was achieved using a 130-min gradient, at a flow rate of 0.5 mL/min of solvent A (10 mM TEABC buffer, pH ~8.5) and B (10 mM TEABC buffer, 90% acetonitrile, pH ~8.5). The fractionation was continued at 97% solvent A for 20 min, followed by 3% solvent B for 0-5 min, 10% solvent B for 5-10 min, 10-35% solvent B for 10-40 min, and 100% solvent B for 40-45 min gradient. Flow-through fractions were collected in a 96-well plate and were finally concatenated into 6 fractions. Pooled fractions were lyophilized and stored at -80°C until they were subjected to phosphopeptide enrichment.
Enrichment of phosphopeptides using Titanium dioxide (TiO2)
The phosphoserine/threonine peptides were enriched by TiO2 and analyzed on an Orbitrap Fusion Tribrid mass spectrometer. The schematic workflow of TMT-based phosphoproteomics analysis is shown in Figure 1. TiO2-based phosphopeptide enrichment of 6 fractions obtained was carried out as described by Larsen and group [68]. Briefly, TiO2 beads were incubated with 2, 5-dihydroxybenzoic acid (DHB) solution (80% ACN, 1% TFA, 3% DHB) for 2-4 h at room temperature. Each fraction was resuspended in DHB and incubated with pre-treated TiO2 beads in the ratio 1:2 (TiO2:peptides). Phosphopeptide-bound TiO2 beads were washed once with wash solution 1 (80% ACN, 3% TFA), wash solution 2 (80% ACN, 1% TFA), and wash solution 3 (80% ACN, 0.1% TFA). Peptides were eluted three times with 40 μL of elution buffer (4% ammonia, 40% ACN) into collection tubes containing 40 μL of 3% TFA. Samples were dried and desalted by using C18 StageTip column and stored at -80°C until LC-MS/MS analysis. LC-MS/MS analysis of phosphoserine/threonine enriched sample was carried out in duplicate and the acquired mass spectrometry data was processed and searched using MASCOT and SEQUEST search algorithms.
LC-MS/MS and data analysis
LC-MS/MS analysis of the samples was performed using Orbitrap Fusion Tribrid mass spectrometer (Thermo Fisher Scientific, Bremen, Germany) interfaced with Easy-nLC-1200 (Thermo Scientific, Bremen, Germany). The phosphopeptides obtained after C18 cleaning were resuspended in 0.1% formic acid (Solvent A) and loaded onto the trap column (Thermo Scientific, 75 µm×2 cm, nanoViper, 3 µm, 100Å) filled with C18 at a flow rate of 4 µL/min. The peptides were further resolved onto an analytical column (Thermo Scientific EASY-Spray RSLC C18 2 µm 15×50 µm) with a flow rate of 300 nL/min, using a step gradient of 5-35% solvent B (0.1% formic acid in 80% acetonitrile) for the first 105 min, and 35-100% solvent B for 105-126 min. The total run time was set to 130 min. Data were acquired in data dependent acquisition mode at a scan range of 400-1600, and in positive mode with a maximum injection time of 55 msec using an Orbitrap mass analyzer at a mass resolution of 60,000 at 400 m/z. Top 15 intense precursor ions were selected for each duty cycle and subjected to higher energy collision-induced dissociation with 34% normalized collision energy.
Bioinformatics data analysis
The enriched phosphoserine and phosphothreonine containing peptides were analyzed on Orbitrap Fusion Tribrid mass spectrometer and LC-MS/MS data were searched in SEQUEST and Mascot (version 2.5.1; Matrix Science, London, United Kingdom) search algorithm against RefSeq mouse protein database (version containing entries with common contaminants) using Proteome Discoverer 2.1 (PD) (Thermo Fisher Scientific, Bremen, Germany). The workflow for PD search included spectrum selector, MASCOT, SEQUEST search nodes, peptide validator, event detector, precursor quantifier, and phosphorRS nodes. Oxidation of methionine, phosphorylation at serine, threonine and tyrosine (+79.966 Da) and TMT labeling at lysine were set as variable modifications, and carbamidomethylation of cysteine was set as a fixed modification. The precursor mass tolerance was set at 10 ppm, and 0.05 Da was set for fragment ion tolerance. Trypsin was used as a proteolytic enzyme with a maximum of one missed cleavage. The data were searched against the decoy database with a 1% false discovery rate cutoff at the peptide level. The abundance of information of proteins and phosphopeptides were extracted from PD into excel files. The intensity values of the proteins in the datasheet were normalized and fold changes in resistant cells versus control cells were calculated. The cut-off values of different phosphoproteins were appointed as follows: a relative abundance of more than 1.5 was considered hyperphosphorylated or lower than 0.66 times was considered as hyophosphorylated. Using the Mus musculus genome as a background dataset biological network analyses of the differentially expressed phosphoproteins were identified using DAVID Pathway analysis tool [69], Panther Pathway analysis tool [70], Human Protein Reference Database (HPRD) [71] and String Protein interaction analysis [72].
Validation of the altered phosphoproteins identified by LC-MS/MS
Validation of the proteins altered and identified from phosphoproteome analysis, was done by (i) Literature survey on the role of these proteins in drug resistance, and (ii) Specific inhibitor of one of the key proteins was used and changes in cell morphology and induction of apoptosis were studied.
Literature-based validation
Gene databases, PubMed databases (https://www.ncbi.nlm.nih.gov/gene), Uniport database (https://www.uniprot.org) and Genecard (https://www.genecards.org) were searched for earlier reports on the roles of the altered proteins (identified by LC-MS/MS) in drug resistance. One of the proteins was used for further validation.
MTT assay for evaluating cytotoxic effects of VPA on B16F10R and B16F10C
B16F10C and B16F10R cells were treated with varied concentrations (0.1-15 mM) of VPA for 72 h. From the dose-response curve, IC50 values were calculated using the formula y = b + ax. An IC50 value is the concentration of the drug which results in 50% cell death.
Western blot analysis for apoptotic proteins in VPA treated melanoma cells
B16F10C and B16F10R cells were seeded (1×10⁵ cells) in 30 mm tissue culture dish and allowed to adhere overnight. Cells were re-fed with fresh media with or without VPA (2 mM). After 24 h of incubation, cells were lysed using a lysis buffer consisting of Tris-HCl (10 mM), NaCl (100 mM), EDTA (1 mM), NaF (1 mM), Triton-x-100 (1%), SDS (0.1%) and deoxycholate (0.5%). Total protein was quantified using the Bradford assay and equal amount of protein was loaded for electrophoresis on 10% SDS-polyacrylamide gels, and transferred onto nitrocellulose membranes, followed by immunodetection with the following antibody probes: cleaved caspase 3, cleaved caspase 9, pyruvate dehydrogenase complex, and β-actin. Detection was done by chemiluminescence. ImageJ was used to calculate the intensity of each band and statistically significant difference (P<0.05) was calculated using GraphPad Prism 7.
Cell morphology by Papanicolaou (Pap) staining of cells after VPA treatment
Pap staining is intended to stain and check cellular morphology in clinical pathology. Pap stain comprises five dyes in three solutions: Natural dye hematoxylin stains cell nuclei blue, Orange Green 6, first counter stain, stains cytoplasm containing matured and keratinized cells. Eosin Azure, second counter stain which is a polychrome mixture of eosin Y, light green SF and Bismarck brown gives a pink colour to the cytoplasm. Light green SF stains blue to the cytoplasm of metabolically active cells.
RAPID PAP stain kit (Bio Lab Diagnostics) was used for cell staining. Control and drug-resistant cells in the culture flask were trypsinized and centrifuged. The cell pellet (approximately 106 cells) was suspended in PBS (100 µL) and transferred on a clean glass slide, smeared uniformly, and immediately fixed by placing in ice-cold ethanol (95%) for 20 min. Slides were dipped into 80% and 50% ethanol for 30 sec each, and rinsed with water gently. Excess water was blotted out, the slide was kept on staining rack, added few drops of nuclear stain for 1 min. The slide was washed in running water, then with wash buffer (3-5 drops) for 20 sec. The slide was dehydrated with dehydrant solution for 1 min and then stained with cytoplasm stain for 1 min. The slide was washed under tap water, dehydrated with dehydrant for 1 min, mounted with D.P.X and covered with a coverslip. The cell morphology was observed under a light microscope.
In silico docking of pyruvate on HDAC2
In silico docking of pyruvate on HDAC2 was done as described earlier [58] where VPA was docked on HDAC2.
Results
Schematic representation of the workflow is given in Figure 1.
Dose-response curves of U0126, LY294002, and their combination
The cytotoxic effects of varying concentrations of U0126 (MEK1/2 inhibitor), LY294002 (PI3K-AKT kinase inhibitor) and the drug combination, i.e., U0126 (10 µM) + LY294002 (10 µM), on the B16F10 mouse melanoma cell lines was analyzed by MTT assay after 72 h of treatment. The dose-response curves of drug treatment showed a dose-dependent decrease in cell viability % (Figure 2). The cell viability % was lesser (Figure 2C) in the drug combination than in the individual drugs in B16F10 melanoma suggesting that the combination of drugs had more cytotoxic potential then the individual drugs.
Figure 2.
Dose-response curves of the drugs, U0126, and LY294002, and their combination. Effects of U0126 and LY294002 on proliferation in B16F10 mouse melanoma cells (A-C) was done by MTT assay after 72 h of treatment. Data shown are mean ± SEM of three replicate wells. The B16F10 cells were treated with 5-60 µM of U0126 (A) and LY294002 (B). Drug combination (C) was done in the concentration range 5-50 µM, i.e., 5 µM U0126 + 5 µM Ly294002 to 50 µM U0126 + 50 µM Ly294002. A graph was plotted with concentration of the inhibitor (X-axis) vs cell death % (Y-axis) and the IC50 values were calculated using the formula y = b + ax. The IC50 value is the concentration of the drug which results in 50% cell death.
As shown in Table 1, in B16F10 cells the IC50 value of U0126, LY294002 and combination treatment of U0126 and LY294002 were 25.29±1.4 µM, 16.43±1.2 µM, and 10.19±1.0 µM, respectively. The IC50 values of the drug combination were lower than the individual drug treatment.
Table 1.
IC50 values of the inhibitors and their combination against B16F10 cells
| Sl. No. | Inhibitor | IC50 values (µM) |
|---|---|---|
|
| ||
| B16F10 | ||
| 1 | U0126 | 25.29±1.4 |
| 2 | LY294002 | 16.43±1.2 |
| 3 | U0126 + LY294002 | 10.19±1.0 |
B16F10 is mouse melanoma cell line. Drug combination is U0126 (10 µM) + LY294002 (10 µM). IC50 - Concentration of compound required for 50% inhibition of cell viability determined using MTT assay. The results represent the mean ± standard deviations of three repeats.
Assessment of resistance fold factor of drug-resistant melanoma cell lines
The IC50 value had increased to 21.08±1.8 µM for B16F10R (Supplementary Figure 1). B16F10 attained a resistance fold factor of 2 after 15 months of drug combination treatment. Hence B16F10 was considered drug-resistant and designated as B16F10R (B16F10 resistant sub-line) and used for further experiments.
Confirmation of resistance in B16F10R cells
The Live/Dead cell assay was performed with the following: B16F10C untreated with drug combination, B16F10C treated with drugs combination and dual drug resistant B16F10R. The treatment of B16F10C with drug combination showed cell death as compared to untreated B16F10C cells (Figure 3A and 3B). Treatment of B16F10R cells with the drug combination, did not show any significant cell death (Figure 3C) and was comparable to untreated B16F10C cells (Figure 3A).
Figure 3.
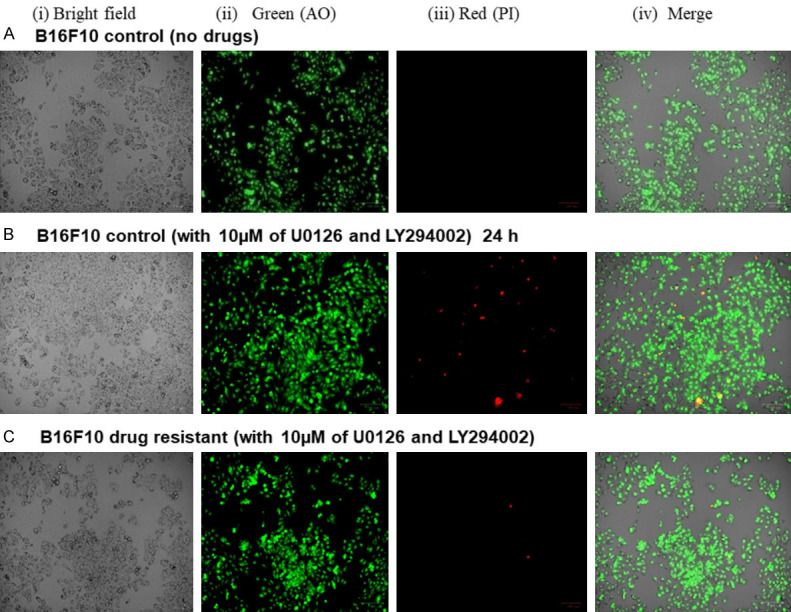
Live/Dead assay of B16F10C and B16F10R cells. The live/dead assay was performed by acridine orange (AO) and propidium iodide (PI) staining. A shows the result of untreated control B16F10C cells; B shows the results control B16F10C cells treated with the drug combination of U0126 (10 µM) and LY294002 (10 µM); C shows the results B16F10R cells treated with the drug combination. Images were taken phase-contrast microscopy using ZOE Fluorescent Cell Imager (Bio-Rad). Bright field images are from the normal light with no filter. Live cells appeared green in color (AO stain) and dead cells appear red in color.
Qualitative assessment of the clonogenic cell survival assay showed that the B16F10C were sensitive to the treatment of the drug combination (Figure 4B), with cell death after incubation of the cells in the drug combination for 14 days while the growth of the B16F10R cells was unaffected (Figure 4C). This result was similar to that of untreated B16F10C control cells (Figure 4A). The resistant subline was proliferating as well as the untreated controls.
Figure 4.
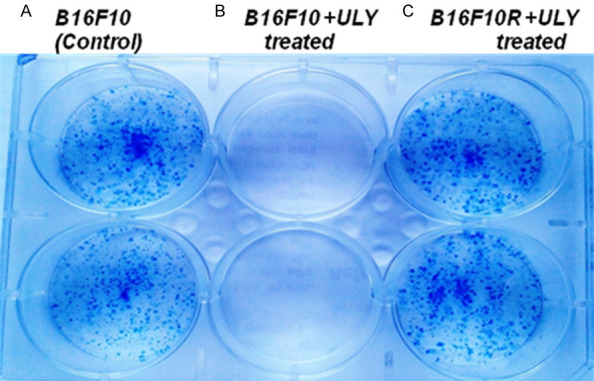
Clonogenic assay with B16F10C and B16F10R cells. Abbreviation: ‘ULY’; combination treatment of U0126 (10 µM) and LY294002 (10 µM). A shows the result of untreated control B16F10C cells; B and C show the B16F10C and B16F10R cells with combination treatment U0126 (10 µM) and LY294002 (10 µM). The experiment was done in duplicates and was assessed qualitatively.
Quantitative proteomic and phosphoproteomic analysis
Tandem Mass Tags (TMT)-based quantitative phosphoproteomics was done to characterize the signaling mechanisms in B16F10R cells resistant to a combination of U0126 and LY294002.
The proteome data obtained for LC-MS/MS matched against the NCBI mouseRefSeq83 database using Proteome discoverer 2.1 (PD2.1), identified 9965 peptides belonging to 2990 proteins groups. The proteins within a group were ranked according to the number of peptide sequences, the number of protein sequence motifs (PSMs), their protein scores, and the sequence coverage.
Among the 221 altered proteins, 150 were downregulated (fold change ≤0.66), while 71 were overexpressed (fold change ≥1.5). Overexpressed proteins: metallothionein (MT) 1 (4.5 fold increase) and MT2 (3.1 fold increase) have featured among the ten proteins with the highest fold increase (Table 2).
Table 2.
Altered proteins in B16F10R cells as compared to the B16F10C cells
| Sl. no. | Gene Symbol | Description | Fold increase | Sl. no. | Gene Symbol | Description | Fold decrease |
|---|---|---|---|---|---|---|---|
| 1 | Mt1 | Metallothionein-1 | 4.52 | 1 | Tpm2 | Tropomyosin beta chain isoform Tpm2.2st | 0.25 |
| 2 | Garnl3 | GTPase-activating Rap/Ran-GAP domain-like protein 3 isoform X1 | 3.76 | 2 | Tmprss13 | Transmembrane protease serine 13 isoform X1 | 0.29 |
| 3 | Ak1 | Adenylate kinase isoenzyme 1 isoform 1 | 3.41 | 3 | Ptma | Prothymosin alpha | 0.30 |
| 4 | C4b | Complement C4-B isoform X1 | 3.32 | 4 | Sfr1 | Swi5-dependent recombination DNA repair protein 1 homolog | 0.31 |
| 5 | Adh7 | Alcohol dehydrogenase class 4 mu/sigma chain | 3.28 | 5 | Fdps | Farnesyl pyrophosphate synthase isoform 1 precursor | 0.34 |
| 6 | Lcorl | Ligand-dependent nuclear receptor corepressor-like protein isoform X1 | 3.20 | 6 | Lipa | Lysosomal acid lipase/cholesteryl ester hydrolase precursor | 0.36 |
| 7 | Des | Desmin | 3.12 | 7 | Irak4 | Interleukin-1 receptor-associated kinase 4 | 0.37 |
| 8 | Mt2 | Metallothionein-2 | 3.06 | 8 | Espn | Espin isoform X1 | 0.37 |
| 9 | Gripap1 | GRIP1-associated protein 1 isoform X1 | 3.02 | 9 | Tcea1 | Transcription elongation factor A protein 1 isoform 3 | 0.37 |
| 10 | C7 | Complement component C7 precursor | 2.95 | 10 | Ndufab1 | Acyl carrier protein, mitochondrial isoform X1 | 0.38 |
The data obtained for LC-MS/MS was analyzed using Proteome discoverer 2.1, which compares the LC-MS/MS data against mouse database. Altered proteins include both increased and decreased proteins. This table shows 10 proteins with highest fold increase and 10 proteins with highest fold decrease, their gene symbol, and their fold change, i.e., concentration in B16F10R cells/concentration in B16F10C cells.
Down-regulated proteins: Proteins such as tropomyosin β chain isoform (0.25 fold decrease) and lysosomal acid lipase/cholesteryl ester hydrolase precursor (0.36 fold decrease) were among the 10 least altered proteins (Table 2). In addition to these serine/threonine protein phosphatase 2A (PP2R-1β), a dephosphorylating enzyme, was found to be downregulated by 0.59 fold (since only the top 10 down-regulated are shown in Table 2, this enzyme is not shown in Table 2).
The MASCOT and SEQUEST search algorithms integrated on Proteome Discoverer suite of the LC-MS/MS data identified 8915 phosphopeptide-spectral matches with a false discovery rate (FDR) of 1%. PhosphoRS probability cutoff of 75% was used for unambiguous localization of phosphorylation sites, which lead to the identification of 1844 unique phosphopeptides corresponding to 1630 proteins. Among the 1630 proteins identified, 263 phosphoproteins were differentially altered-126 were hyperphosphorylated (>1.5 fold) and 137 were hypophosphorylated (<0.66 fold) (Figure 5). The distribution of phosphorylated residues was highest on serine (85.8%) followed by threonine residues (13%) and tyrosine residues (1.2%).
Figure 5.
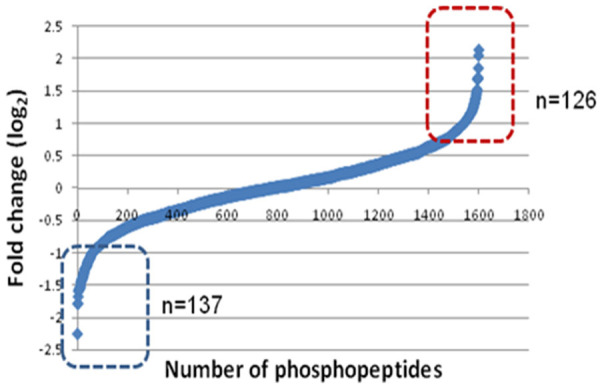
Analysis of altered phosphoproteome in B16F10R cells. TiO2-based enrichment strategy was followed to enrich the phosphopeptides. The boxes indicated altered, i.e., up-regulated (in red box) and down-regulated (in blue box) proteins.
Bioinformatic analysis of the differentially phosphorylated proteins (n = 363 proteins) by the DAVID functional annotation tool showed that some of the altered proteins belonged to five major pathways (Table 3). Some of the proteins, i.e., RNA-binding protein 8A isoform (Rbm8a), apoptotic chromatin condensation inducer in the nucleus isoform 2 (Acin1), protein CASC3 (Casc3), RNA-binding protein with serine-rich domain 1 isoform 1 (Rnps1), serine/arginine repetitive matrix protein (Srrm), and pinin 1 (Pnn1) were associated with more than one pathway, while certain other proteins were found exclusively in one pathway, i.e., cyclin-dependent kinase 2 (Cdk2), histone deacetylase 2 (HDAC2), DNA replication licensing factor MCM2 (Mcm2), and structural maintenance of chromosomes protein 3 (SMC3) associated with the cell cycle. Yet another protein, which is hyperphosphorylated by 1.73-fold is pyruvate dehydrogenase E1 component subunit alpha (PDHA1), which links glycolysis to the TCA cycle. Hyperphosphorylation inactivates this enzyme and pyruvate accumulates since it is not converted to acetyl CoA.
Table 3.
Categorization of the phosphoproteins altered in B16F10R cells based on the pathways they are associated with
| Sl. No. | KEGG Pathway | Protein count | Name of the protein |
|---|---|---|---|
| 1 | Spliceosome | 11 | Ddx46, Rbm17, Rbm8a, SNW1, U2surp, Acin1, Srsf1, Srsf4, Snrnp70, Tra2a, Tra2b |
| 2 | RNA transport | 11 | Rbm8a, Thoc5, Acin1, Casc3, Eif3b, Eif4g1, Eif4b, Eif5b, Pnn, Rnps1, Srrm1 |
| 3 | mRNA surveillance pathway | 7 | Fip1l1, Rbm8a, Acin1, Casc3, Pnn, Rnps1, Srrm1 |
| 4 | Protein processing in endoplasmic reticulum | 5 | Dnaja2, Nsfl1c, Sec61b, Canx, Rrbp1 |
| 5 | Cell cycle | 4 | Cdk2, HDAC2, Mcm2, Smc3 |
DAVID Functional Annotation Chart software was used for the categorization of the altered phosphoproteins into various cellular pathways. KEGG: Kyoto Encyclopedia of Genes and Genomes is bioinformatics software for associating genomes to metabolism.
Classification of the altered proteins based on their biological processes, molecular functions, and subcellular localization was performed using PANTHER software [25]. This software compared the phosphoproteomic data against the Mus musculus database, and suggested the involvement of the following four major pathways in the development of drug-resistance: (i) RNA metabolism/spliceosome, (ii) developmental process, (iii) metabolic process, and (iv) cell cycle proteins (Figure 6).
Figure 6.
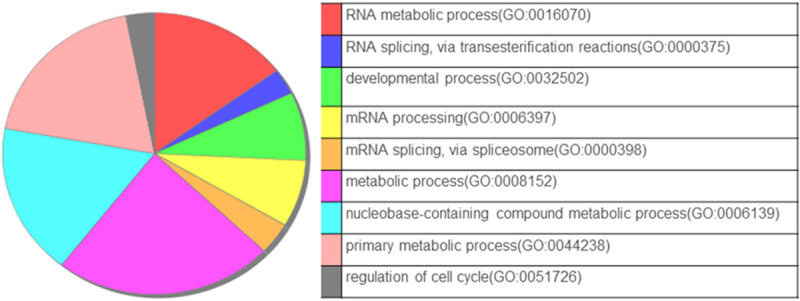
Biological function analysis of the phosphoproteins altered in B16F10R. Annotation enrichment analysis of altered phosphoproteins in B16F10R was done using the Panther Multiple Pie Chart tool.
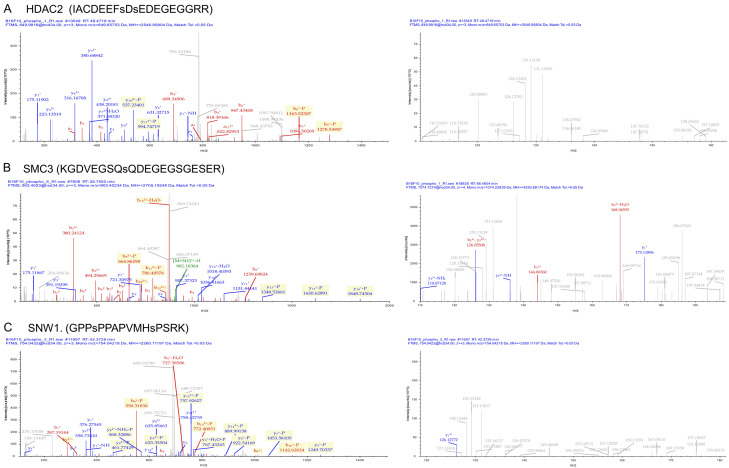
Comparison of the phosphoproteins identified in the present study with the Human Protein Reference Database (HPRD) database identified 74 novel phosphosites on 47 proteins in the B16F10R as compared to B16F10C. Complete list of novel phosposites identified is given in Supplementary Table 1. Literature-based validation of some of the identified hyperphosphorylated proteins showed that histone deacetylases 2 (HDAC2), structural maintenance of chromosome 3 (SMC3), and proto-oncogene tyrosine-protein kinase (SRC) are well reported for their role in drug-resistance. The MS/MS spectra of the hyperphosphorylated proteins, i.e., HDAC2, SMC3, and SNW1 are shown in Figure 7.
Figure 7.
Phosphoproteins involved in drug resistance in B16F10R cells. Representative MS spectra of hyperphosphorylated proteins. (A) Phosphorylation of peptides on HDAC 2; (B) SMC3 and (C) SNW1 were differentially hyper phosphorylated as evidenced by MS spectra showing the changes in the relative abundance of phosphopeptides.
STRING functional protein association networks tool identified: (i) RNA splicing-regulatory proteins-Hnrnpa2b1, Snrnp70, Rbm17, Rbm17, Tra2b, U2surp, Srsf4, Snw1, Acin1, and (ii) Cell cycle proteins-HDAC2, Mcm2, Cdk2, SMC3 (Figure 8). Most of these proteins have multiple phosphorylation sites such as HDAC2 (S4222, S424), SMC3 (S1067) and SNW1 (S4, S12).
Figure 8.
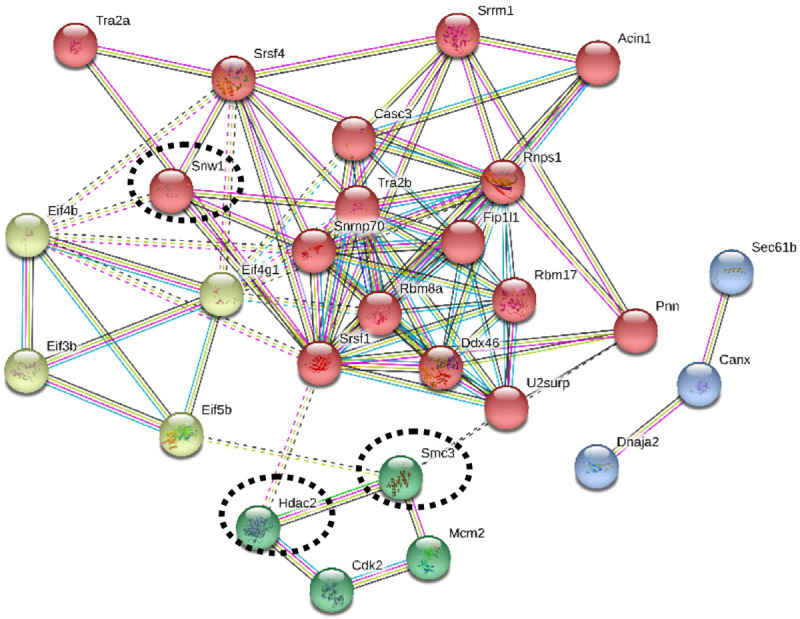
Protein-protein interactions of the phosphoproteins identified in B16F10R cells. The protein-protein interaction of the phosphoproteins identified in the study were analysed with the STRING tool. Colour coding: Red circles indicate the spliceosome and mRNA surveillance pathway; Green circles indicate cell cycle proteins; Light green circles indicate RNA transport proteins; Blue circles indicate protein processing in endoplasmic reticulum. Thick lines indicate strong interaction and the dotted lines indicate predicted interactions.
Role of HDAC2 in the drug resistance of B16F10R
HDAC2 was one of the hyperphosphorylated proteins in the B16F10R melanoma model developed in this study. Valproic acid (VPA), a well-established inhibitor of HDAC2, was used for validation of its role in the survival of B16F10R cells.
A dose-dependent curve of VPA treated B16F10C and B16F10R cell lines showed a concentration-dependent reduction in cell viability (Figure 9).
Figure 9.
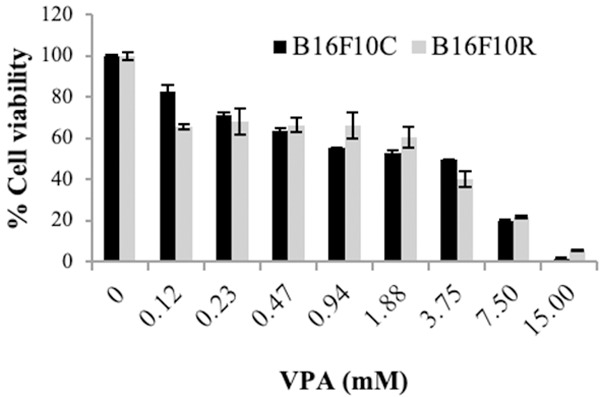
Cytotoxic effects of VPA on B16F10C and B6F10R cell lines. Both parental and resistant B16F10 cell lines were treated with varying concentrations of VPA (0.1-15 mM) for 72 h and MTT assay was performed. Data shown are means ± SEM of three replicate wells. A graph was plotted with concentration of the VPA (X-axis) vs cell viability % (Y-axis) and the IC50 values were calculated using the formula y = b + ax. An IC50 value is the concentration of the drug which results in 50% cell death. Control (dark bars) and resistant (light bars).
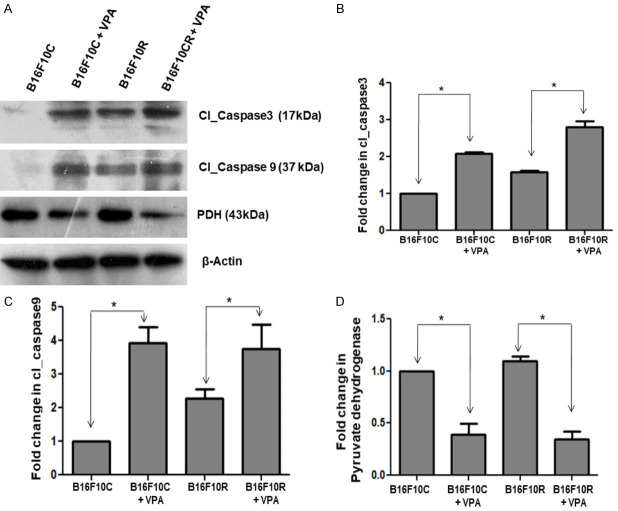
Western blot showed that (i) The level of cleaved caspase_3 and caspase_9 were (markers of apoptosis) higher in the B16F10R cells compared to the B16F10C cells (Figure 10B, 10C). (ii) Treatment of B16F10C and B16F10R cell lines with VPA (2 mM) increased the concentration of cleaved caspase_3 and cleaved caspase_9 (Figure 10A-C) significantly (P<0.05) as compared to the untreated cells, suggesting that inhibition of HDAC2 with VPA induces apoptosis of the cells. (iii) In addition, there was a decrease in the pyruvate dehydrogenase enzyme complex (PDH), which converts pyruvate (a product of glycolysis) to acetyl CoA, starting material of TCA cycle, a source of energy to the cells.
Figure 10.
Western blot analysis of the valproic acid-treated B16F10C and B16F10R cells. Control (B16F10C) and drug-resistant (B16F10R) cells were treated with VPA (2 mM) for 24 h and cells were lysed using lysis buffer. Apoptotic proteins-cleaved Caspase-3 (Cl_Caspase 3), cleaved Caspase-9 (Cl_Caspase) and pyruvate dehydrogenase complex (PDH) were detected by western blots in both untreated (B16F10C and B16F10R) and VPA treated cells (B16F10C+VPA and B16F10R+VPA). (A) Western blot of the different proteins. β-actin served as loading control. The comparison of the quantified proteins Cl_Caspase 3, Cl_Caspase 9 and PDH are shown (B-D), respectively. *indicates the statistically significant difference (P<0.05).
Further cell morphology analysis of B16F10R cells showed marked changes in morphology, upon treatment with VPA (Figure 11F). The VPA treated cells showed varied morphologies like irregular star-like or spindle-shaped (Figure 11E, 11F) compared to untreated B16F10R cells (Figure 11B, 11C). The number of cells in the VPA treated B16F10R was considerably less than in untreated B16F10R (Figure 11A, 11D).
Figure 11.
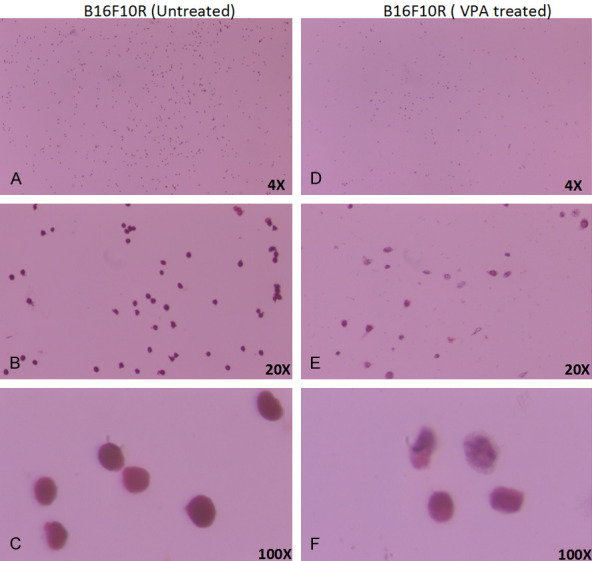
Morphological changes in drug-resistant melanoma (B16F10R) cells upon VPA treatment. B16F10R cells were treated with VPA (2 mM) for 24 h. Image of untreated B16F10R in objectives magnification of, (A) 4×; (B) 20×; and (C) 100×; after 24 h after VPA treatment: (D) 4×; (E) 20×; and (F) 100×. Cells were stained using Pap stain method. Cell morphology was captured under a light microscope (Olympus CX41).
In silico docking of valproic acid on HDAC2
The in silico docking of pyruvate on HDAC2 showed an inhibitory constant of 1.77 mM and binding affinity -3.75. Pyruvate binds with HDAC2 at Arginine39 with two interactions (Figure 12).
Figure 12.
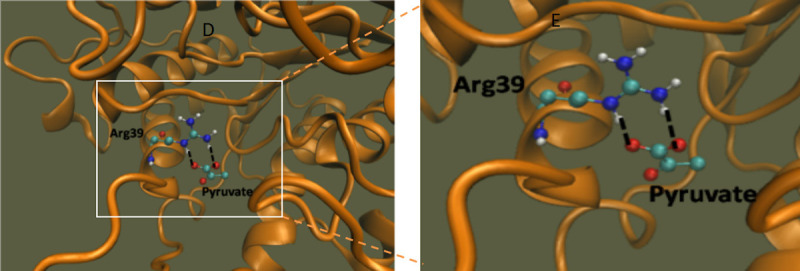
Docking of pyruvate on HDAC2. Molecular interaction of HDAC2 with pyruvate. The black dashed lines indicate the interactions of the ligand with the labeled amino acid residues.
Discussion
Development of resistance to anticancer therapy is a major challenge in the successful treatment of cancer. In many instances, these drug-resistant tumors also often exhibit cross-resistance to other pathway inhibitors. Therefore, it is crucial to understand the alteration in underlying molecular networks that drive the cancer resistance. In the present study, a novel dual drug resistant melanoma model, B16F10R, was developed, which was resistant to a combination of inhibitors of two parallel signaling cascades PI3K-AKT and MEK-ERK of Ras pathway.
U0126 and LY294002 used in this study are already established inhibitors of these pathways [26]. Targeting the Ras with single drug was ineffective due to the negative feedback regulation of MEK and its downstream protein BRAF. Alternatively, the co-inhibition of both RAF and MEK, upstream and downstream of Ras-Raf-MEK-ERK, was effective in improving patient’s survival [27]. However, within a year, the patients developed drug resistance. Yet another treatment option was to cotarget PI3K-AKT and MEK-ERK pathways, which show synergistic response in vitro and in vivo in NRAS mutant melanoma [12]. Hence this study adopted a unique approach, i.e., parallel inhibition/co-targeting of MAPK and AKT, with a combination of U0126 (ERK1/2 inhibitor) and LY294002 (PI3K-AKT kinase inhibitor), for the development of the dual drug resistant melanoma model for better understanding of the underlying mechanisms of the ensuing drug resistance to the dual drugs. In the present study, the mouse melanoma drug-resistant model, B16F10R, took around 15 months of drug combination treatment, i.e., continuous exposure to drugs with a gradual increase in the concentration of the drugs till they attained a resistance fold factor ≥2, when it was considered as ‘Resistant/B16F10R’ as established earlier by [21].
The action of the U0126 (MEK1/2 inhibitor) or LY294002 (PI3K-AKT kinase inhibitor) in the B16F10R cells was confirmed by increased IC50 values. Furthermore, the cell viability and the cell proliferation abilities of the B16F10R cells were checked by Live/Dead assay and clonogenic assay, respectively. Although the B16F10C cells treated with the drug combination showed decreased proliferation, the cell viability and proliferation ability of the B16F10R cells treated with the drug combination was similar to that of the untreated B16F10C control cells. A similar effect is shown by Villanueva et al., (2010), in mutant BRAFV600E melanoma resistant to BRAF inhibitors, where they have co-targeted MEK and IGF-1R/PI3K [28]. The growth rate of the drug combination treated resistant cells was similar to that of the untreated control cells. Zhang et al., (2010), have shown that drug-resistant cells grow/proliferate as well as the untreated parental cells in gastric carcinoma cell lines [29]. This confirms that the cells are resistant to the treatment of drugs/drug combinations used.
The functional and metabolic differences between B16F10C and B16F10R cells were investigated by quantitative proteomic analysis using LC-MS/MS. The proteome of the B16F10R showed 71 overexpressed and 150 downregulated proteins. In an earlier study with proteome of drug-resistant BRAF mutated melanoma, about 317 proteins were found to be down-regulated and 151 overexpressed. The altered proteins were mostly associated with certain pathways reprogrammed in the resistant cells, i.e., amino acid metabolism and energy generation systems such as glycolysis, citric acid cycle were down-regulated, and the proteins of the cell cycle and DNA metabolism were overexpressed [30]. The proteome data of the present study also showed alteration in the proteins of energy generating pathways glycolysis and the citric acid cycle.
Among the ten most overexpressed proteins of the present study, MMP-1 and MMP-2 showed a 4.52- and 3.06-fold increase, respectively, in the B16F10R cells. Overexpression of MMP’s is associated with the metastasis and invasion of cancers [31,32].
In addition, although not one of the ten most downregulated proteins in the proteome profile of the novel dual drug resistant cells, a downregulation (downregulated by 0.59-fold) of serine/threonine protein phosphatase 2A (Pppp2R1B), which is a dephosphorylating enzyme was observed. This enzyme is known to dephosphorylate the kinases that are associated with signaling pathways in cells [33].
The phosphoproteome profile of B16F10R cells of the present study identified 263 phosphoproteins which were differentially phosphorylated, among which, 126 were hyperphosphorylated and 137 were hypophosphorylated. Pathway categorization of the altered phosphoproteins showed most of them belonged to either RNA metabolism or metabolic processes and a few were cell cycle regulators. Among proteins hyperphosphorylated in the dual drug resistant melanoma model B16F10R of the present study the cell cycle proteins-HDAC2, SMC3, SNW1 and SRC - are reported to play a role in drug resistance.
Histone deacetylases (HDAC)
Histone deacetylases (HDAC) are one of the new targets that are being pursued in cancer therapeutics. The present study indicates the hyperphosphorylation of HDAC2 in B16F10R cells. And it is previously reported that hyperphosphorylated HDAC indicates therapeutic failure due to drug resistance [34-37]. HDAC2 is an important regulator of compact chromosomes which means less gene expression, and the mechanism of HDAC inhibitors (HDACis) is the induction of chromosome de-condensation and sensitization to chemotherapy. Histone acetylation-deacetylation status of the cell is the most commonly studied regulatory processes of transcription. Histone acetyltransferases (HATs) and HDAC compete to add or remove acetyl groups on lysine residues of histones, respectively [38,39]. The acetylation of histones by HATs is associated with chromatin de-condensation and transcriptional activation; whereas the deacetylation of histones by HDACs is associated with condensation of the chromosome and related transcriptional silencing. It is reported that any change, either in the expression or activity, of HDAC enzymes may lead to carcinogenesis, and specific HDAC enzyme is associated with particular malignancies. Inhibition of HDAC2 is reported to decrease cell proliferation which would be a potential target in conditions like cancer. Marchion et al., (2009), show that the depletion of HDAC2, but not of HDAC1, or HDAC6, sensitize the breast cancer cells and induce cell death [40]. Furthermore, in pancreatic ductal adenocarcinoma (PDAC) cells, HDAC2, but not HDAC1, confers resistance towards etoposide, the topoisomerase II inhibitor [35]. Several reports show the association of hyperphosphorylated HDAC with the development of drug resistance [34-37]. These reports suggest that, HDAC2 may be important for the development of resistance in the present study model.
Structural maintenance of chromosome 3 (SMC3)
The structural maintenance of chromosome 3 (SMC3) (formerly called Bamacan, Cspg6, HCAP, SmcD, or Mmip1) protein is a constituent of a number of nuclear multimeric protein complex, cohesin, that plays an essential role during the segregation of sister chromatids and is likely to be a component of the signaling network in which BRCA1 maintains genomic stability [41,42]. Hyperphosphorylation of SMC3 is known to trigger genomic instability or have stabilized the chromosomal architecture and separation resulting in drug resistance [42,43].
SRC
The present study demonstrated that the hyperphosphorylation of proto-oncogene tyrosine-protein kinase (SRC) in B16F10R cells. SRC is involved in regulating cell proliferation, migration, signal transduction, and other associated functions [44]. The elevated levels of SRC tyrosine kinase has a close correlation with tumor multidrug resistance, and inhibition of SRC tyrosine kinase using specific inhibitor (such as sunitinib), which is reflected as reduced level of SRC phosphorylation and reversing the drug resistance to drug sensitivity [45-49]. Recently PLX4720 resistant melanoma showed elevated levels of EGFR and SRC kinases [50]. Suggesting the role of SRC tyrosine kinase in intrinsic and acquired resistance, and it can be used as a therapeutic target in patients for whom there are currently no effective treatments. SRC is found to crosstalk with several pathways such as EGFR [51] and STAT [52] pathways. Targeting SRC may reactivate ERK and AKT [53,54]. Therefore combination targeting approach may be a potent strategy to overcome this resistance.
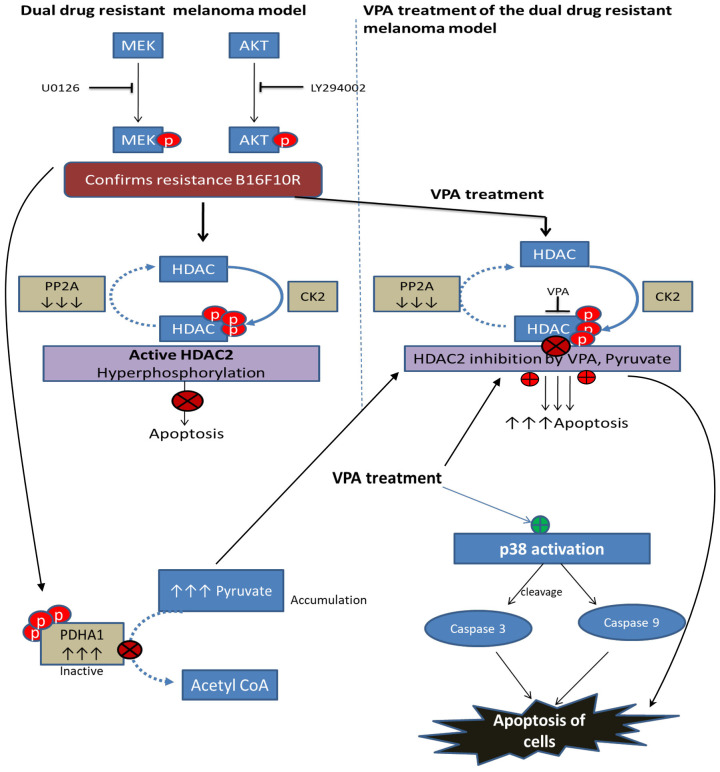
Casein Kinase 2 (CK2) and protein phosphatase 2A (PP2A) are the enzymes that phosphorylate and dephosphorylate HDAC2, respectively. Phosphorylated HDAC2 is active and will deacetylate the chromatin repressing the transcriptional events and the cell cycle is arrested. The proteome analysis of the dual drug resistant melanoma developed in the present study has also shown that PP2A is one of the down regulated proteins which explains hyperphosphorylation of HDAC2. The common phosphorylation sites for the HDAC2 activity are S394, S421, S422, S423, and S424. For the basal activity of HDAC2, S422, and S424 phosphosites are important and the mutation on these sites could lead to a suppression of the overall phosphorylation level of HDAC2 [55]. Though the HDAC1 and HDAC2 have 85% sequence similarity in phosphosites, the HDAC1 showed slightly reduced phosphorylation (0.71) in drug resistant cells as compared to HDAC2 probably due to differently regulated mechanism.
The present study shows the inhibition of phosphorylated HDAC2 by VPA. HDAC2 binds to the cancer/testis antigens, such as CAGE, and leads to multi-drug resistance by decreasing p53 expression in melanoma cells.
HDAC2 inactivation or inhibition enhance the senescence-like G(1) cell cycle arrest by upregulating the cyclin-dependent kinase inhibitor p21 and p53. Suppression of HDAC2 activity by abexinostat, an HDAC inhibitor (HDACi), reverses the resistance towards pazopanib in renal cell carcinoma which is in phase I clinical trial [56]. Hence VPA, an HDACi, which can bind directly to HDAC2, was used to check whether the resistance of the unique dual drug resistant model developed in this study would be reversed. The authors have also reported the chemosensitizing effects of VPA on mouse melanoma B16F10 [57], and radiosensitizing effects of VPA in dual drug resistant mouse and human melanoma [58]. In the present study, treatment of B16F10C and B16F10R cells with VPA induced apoptosis, confirming its anticancer activity irrespective of drug sensitive or resistant state of cells making HDAC2, the target of VPA, as a potential therapeutic target. That inhibitor of HDAC2 induces apoptosis in cancer cells has been reported earlier [59-61]. However, VPA is nontoxic to normal cells [62] which makes it a potential therapeutic lead molecule.
In addition, VPA treatment also showed significant decrease in PDH enzyme in both parental and resistant cells. This is suggestive of an accumulation of pyruvate, the substrate of PDH. Pyruvate is also reported to be an HDAC inhibitor [63]. The authors have earlier shown by in silico docking, that there is hydrophobic interaction between pyruvate and Arg39 of HDAC2. Since the inhibition of pyruvate is similar to that of VPA [58,64], it is suggestive that the treatment of VPA has dual inhibitory action on HDAC2 (i) by VPA itself and the other (ii) by the accumulated pyruvate in the dual drug resistant cell model developed in this study (Figure 13). Inhibition of HDAC2 with VPA also activates p38 which is a pro-apoptotic protein responsible for cell death [65].
Conclusions
Using proteomic technology, the present study has identified several altered phosphoproteins and data analysis suggested that multiple RNA splicing-regulatory proteins and cell cycle proteins may play a role in maintaining its drug-resistant state. Among them, Histone deacetylases 2 (HDAC2), SRC protein-tyrosine kinase (SRC) and Structural maintenance of chromosome 3 protein (SMC) have been well reported in the literature for their role in drug-resistant melanoma.
Further, VPA which is a well-known HDAC inhibitor, was used to test the induction of apoptosis. Treatment of low dose of VPA induces apoptosis in both parental and drug-resistant cells, suggesting the potential role of HDAC inhibition in cancer.
Acknowledgements
We would also like to acknowledge Yenepoya Research Centre and Department of Biochemistry, Yenepoya (Deemed to be University) for infrastructure and core facility support for conducting this research. The authors also thank the Institute of Bioinformatics, Bangalore, for extending the use of HPLC facility and Thermo Fisher Scientific Limited (Mass spectrometry division), Bangalore, for the use of mass spectrometry facility. We also acknowledge the help given by Dr. Ramdas Nayak, Professor, and Head, and Dr. Anuradha Rao, Professor, Department of Pathology, Yenepoya Medical College, for their help in cytology studies. The work was supported by funding from Board of Research in Nuclear Sciences (Ref no. 2013/34/8) sanctioned to DU and Yenepoya University Seed grant (Ref no. YU/YRC/Seed Grant/2016) to VRP. BSK received financial assistance as Senior Research Fellowship (Ref No. 08/652(001)/2017-EMR-l) from Council for Scientific and Industrial Research (CSIR), India.
Disclosure of conflict of interest
None.
Supporting Information
References
- 1.Haluska FG, Tsao H, Wu H, Haluska FS, Lazar A, Goel V. Genetic alterations in signaling pathways in melanoma. Clin Cancer Res. 2006;12:2301s–2307s. doi: 10.1158/1078-0432.CCR-05-2518. [DOI] [PubMed] [Google Scholar]
- 2.Perera E, Gnaneswaran N, Jennens R, Sinclair R. Malignant melanoma. Healthcare (Basel) 2013;2:1–19. doi: 10.3390/healthcare2010001. [DOI] [PMC free article] [PubMed] [Google Scholar]
- 3.Domingues B, Lopes JM, Soares P, Populo H. Melanoma treatment in review. Immunotargets Ther. 2018;7:35–49. doi: 10.2147/ITT.S134842. [DOI] [PMC free article] [PubMed] [Google Scholar]
- 4.Kunz M, Vera J. Modelling of protein kinase signaling pathways in melanoma and other cancers. Cancers (Basel) 2019;11:465. doi: 10.3390/cancers11040465. [DOI] [PMC free article] [PubMed] [Google Scholar]
- 5.Yajima I, Kumasaka MY, Thang ND, Goto Y, Takeda K, Yamanoshita O, Iida M, Ohgami N, Tamura H, Kawamoto Y, Kato M. RAS/RAF/MEK/ERK and PI3K/PTEN/AKT signaling in malignant melanoma progression and therapy. Dermatol Res Pract. 2012;2012:354191. doi: 10.1155/2012/354191. [DOI] [PMC free article] [PubMed] [Google Scholar]
- 6.Tsao H, Goel V, Wu H, Yang G, Haluska FG. Genetic interaction between NRAS and BRAF mutations and PTEN/MMAC1 inactivation in melanoma. J Invest Dermatol. 2004;122:337–341. doi: 10.1046/j.0022-202X.2004.22243.x. [DOI] [PMC free article] [PubMed] [Google Scholar]
- 7.Liu S, Gao G, Yan D, Chen X, Yao X, Guo S, Li G, Zhao Y. Effects of miR-145-5p through NRAS on the cell proliferation, apoptosis, migration, and invasion in melanoma by inhibiting MAPK and PI3K/AKT pathways. Cancer Med. 2017;6:819–833. doi: 10.1002/cam4.1030. [DOI] [PMC free article] [PubMed] [Google Scholar] [Retracted]
- 8.Perkinton MS, Ip JK, Wood GL, Crossthwaite AJ, Williams RJ. Phosphatidylinositol 3-kinase is a central mediator of NMDA receptor signalling to MAP kinase (Erk1/2), Akt/PKB and CREB in striatal neurones. J Neurochem. 2002;80:239–254. doi: 10.1046/j.0022-3042.2001.00699.x. [DOI] [PubMed] [Google Scholar]
- 9.York RD, Molliver DC, Grewal SS, Stenberg PE, McCleskey EW, Stork PJ. Role of phosphoinositide 3-kinase and endocytosis in nerve growth factor-induced extracellular signal-regulated kinase activation via Ras and Rap1. Mol Cell Biol. 2000;20:8069–8083. doi: 10.1128/mcb.20.21.8069-8083.2000. [DOI] [PMC free article] [PubMed] [Google Scholar]
- 10.Wong MH, Xue A, Baxter RC, Pavlakis N, Smith RC. Upstream and downstream co-inhibition of mitogen-activated protein kinase and PI3K/Akt/mTOR pathways in pancreatic ductal adenocarcinoma. Neoplasia. 2016;18:425–435. doi: 10.1016/j.neo.2016.06.001. [DOI] [PMC free article] [PubMed] [Google Scholar]
- 11.Ciolczyk-Wierzbicka D, Gil D, Laidler P. Treatment of melanoma with selected inhibitors of signaling kinases effectively reduces proliferation and induces expression of cell cycle inhibitors. Med Oncol. 2017;35:7. doi: 10.1007/s12032-017-1069-0. [DOI] [PMC free article] [PubMed] [Google Scholar]
- 12.Welsh SJ, Rizos H, Scolyer RA, Long GV. Resistance to combination BRAF and MEK inhibition in metastatic melanoma: where to next? Eur J Cancer. 2016;62:76–85. doi: 10.1016/j.ejca.2016.04.005. [DOI] [PubMed] [Google Scholar]
- 13.Meier F, Busch S, Lasithiotakis K, Kulms D, Garbe C, Maczey E, Herlyn M, Schittek B. Combined targeting of MAPK and AKT signalling pathways is a promising strategy for melanoma treatment. Br J Dermatol. 2007;156:1204–1213. doi: 10.1111/j.1365-2133.2007.07821.x. [DOI] [PubMed] [Google Scholar]
- 14.Posch C, Moslehi H, Feeney L, Green GA, Ebaee A, Feichtenschlager V, Chong K, Peng L, Dimon MT, Phillips T, Daud AI, McCalmont TH, LeBoit PE, Ortiz-Urda S. Combined targeting of MEK and PI3K/mTOR effector pathways is necessary to effectively inhibit NRAS mutant melanoma in vitro and in vivo. Proc Natl Acad Sci U S A. 2013;110:4015–4020. doi: 10.1073/pnas.1216013110. [DOI] [PMC free article] [PubMed] [Google Scholar]
- 15.Atefi M, von Euw E, Attar N, Ng C, Chu C, Guo D, Nazarian R, Chmielowski B, Glaspy JA, Comin-Anduix B, Mischel PS, Lo RS, Ribas A. Reversing melanoma cross-resistance to BRAF and MEK inhibitors by co-targeting the AKT/mTOR pathway. PLoS One. 2011;6:e28973. doi: 10.1371/journal.pone.0028973. [DOI] [PMC free article] [PubMed] [Google Scholar]
- 16.Gotwals P, Cameron S, Cipolletta D, Cremasco V, Crystal A, Hewes B, Mueller B, Quaratino S, Sabatos-Peyton C, Petruzzelli L, Engelman JA, Dranoff G. Prospects for combining targeted and conventional cancer therapy with immunotherapy. Nat Rev Cancer. 2017;17:286–301. doi: 10.1038/nrc.2017.17. [DOI] [PubMed] [Google Scholar]
- 17.Goodspeed A, Heiser LM, Gray JW, Costello JC. Tumor-derived cell lines as molecular models of cancer pharmacogenomics. Mol Cancer Res. 2016;14:3–13. doi: 10.1158/1541-7786.MCR-15-0189. [DOI] [PMC free article] [PubMed] [Google Scholar]
- 18.Ferreira SA, Vasconcelos JL, Cavalcanti CL, Rego MJ, Beltrao EI. Sialic acid differential expression in non-melanoma skin cancer biopsies. Med Mol Morphol. 2013;46:198–202. doi: 10.1007/s00795-013-0025-0. [DOI] [PubMed] [Google Scholar]
- 19.Xavier CP, Pesic M, Vasconcelos MH. Understanding cancer drug resistance by developing and studying resistant cell line models. Curr Cancer Drug Targets. 2016;16:226–237. doi: 10.2174/1568009616666151113120705. [DOI] [PubMed] [Google Scholar]
- 20.Gillet JP, Varma S, Gottesman MM. The clinical relevance of cancer cell lines. J Natl Cancer Inst. 2013;105:452–458. doi: 10.1093/jnci/djt007. [DOI] [PMC free article] [PubMed] [Google Scholar]
- 21.McDermott M, Eustace AJ, Busschots S, Breen L, Crown J, Clynes M, O’Donovan N, Stordal B. In vitro development of chemotherapy and targeted therapy drug-resistant cancer cell lines: a practical guide with case studies. Front Oncol. 2014;4:40. doi: 10.3389/fonc.2014.00040. [DOI] [PMC free article] [PubMed] [Google Scholar]
- 22.Song C, Piva M, Sun L, Hong A, Moriceau G, Kong X, Zhang H, Lomeli S, Qian J, Yu CC, Damoiseaux R, Kelley MC, Dahlman KB, Scumpia PO, Sosman JA, Johnson DB, Ribas A, Hugo W, Lo RS. Recurrent tumor cell-intrinsic and -extrinsic alterations during MAPKi-induced melanoma regression and early adaptation. Cancer Discov. 2017;7:1248–1265. doi: 10.1158/2159-8290.CD-17-0401. [DOI] [PMC free article] [PubMed] [Google Scholar]
- 23.Basken J, Stuart SA, Kavran AJ, Lee T, Ebmeier CC, Old WM, Ahn NG. Specificity of phosphorylation responses to mitogen activated protein (MAP) kinase pathway inhibitors in melanoma cells. Mol Cell Proteomics. 2018;17:550–564. doi: 10.1074/mcp.RA117.000335. [DOI] [PMC free article] [PubMed] [Google Scholar]
- 24.Ma XJ, Wang YS, Gu WP, Zhao X. The role and possible molecular mechanism of valproic acid in the growth of MCF-7 breast cancer cells. Croat Med J. 2017;58:349–357. doi: 10.3325/cmj.2017.58.349. [DOI] [PMC free article] [PubMed] [Google Scholar]
- 25.Huang da W, Sherman BT, Lempicki RA. Bioinformatics enrichment tools: paths toward the comprehensive functional analysis of large gene lists. Nucleic Acids Res. 2009;37:1–13. doi: 10.1093/nar/gkn923. [DOI] [PMC free article] [PubMed] [Google Scholar]
- 26.Smalley KS, Haass NK, Brafford PA, Lioni M, Flaherty KT, Herlyn M. Multiple signaling pathways must be targeted to overcome drug resistance in cell lines derived from melanoma metastases. Mol Cancer Ther. 2006;5:1136–1144. doi: 10.1158/1535-7163.MCT-06-0084. [DOI] [PubMed] [Google Scholar]
- 27.Flaherty KT, Infante JR, Daud A, Gonzalez R, Kefford RF, Sosman J, Hamid O, Schuchter L, Cebon J, Ibrahim N, Kudchadkar R, Burris HA 3rd, Falchook G, Algazi A, Lewis K, Long GV, Puzanov I, Lebowitz P, Singh A, Little S, Sun P, Allred A, Ouellet D, Kim KB, Patel K, Weber J. Combined BRAF and MEK inhibition in melanoma with BRAF V600 mutations. N Engl J Med. 2012;367:1694–1703. doi: 10.1056/NEJMoa1210093. [DOI] [PMC free article] [PubMed] [Google Scholar]
- 28.Villanueva J, Vultur A, Lee JT, Somasundaram R, Fukunaga-Kalabis M, Cipolla AK, Wubbenhorst B, Xu X, Gimotty PA, Kee D, Santiago-Walker AE, Letrero R, D’Andrea K, Pushparajan A, Hayden JE, Brown KD, Laquerre S, McArthur GA, Sosman JA, Nathanson KL, Herlyn M. Acquired resistance to BRAF inhibitors mediated by a RAF kinase switch in melanoma can be overcome by cotargeting MEK and IGF-1R/PI3K. Cancer Cell. 2010;18:683–695. doi: 10.1016/j.ccr.2010.11.023. [DOI] [PMC free article] [PubMed] [Google Scholar]
- 29.Zhang X, Yashiro M, Qiu H, Nishii T, Matsuzaki T, Hirakawa K. Establishment and characterization of multidrug-resistant gastric cancer cell lines. Anticancer Res. 2010;30:915–921. [PubMed] [Google Scholar]
- 30.Parker R, Vella LJ, Xavier D, Amirkhani A, Parker J, Cebon J, Molloy MP. Phosphoproteomic analysis of cell-based resistance to BRAF inhibitor therapy in melanoma. Front Oncol. 2015;5:95. doi: 10.3389/fonc.2015.00095. [DOI] [PMC free article] [PubMed] [Google Scholar]
- 31.Kohrmann A, Kammerer U, Kapp M, Dietl J, Anacker J. Expression of matrix metalloproteinases (MMPs) in primary human breast cancer and breast cancer cell lines: new findings and review of the literature. BMC Cancer. 2009;9:188. doi: 10.1186/1471-2407-9-188. [DOI] [PMC free article] [PubMed] [Google Scholar]
- 32.Mook OR, Frederiks WM, Van Noorden CJ. The role of gelatinases in colorectal cancer progression and metastasis. Biochim Biophys Acta. 2004;1705:69–89. doi: 10.1016/j.bbcan.2004.09.006. [DOI] [PubMed] [Google Scholar]
- 33.Khanna A, Pimanda JE, Westermarck J. Cancerous inhibitor of protein phosphatase 2A, an emerging human oncoprotein and a potential cancer therapy target. Cancer Res. 2013;73:6548–6553. doi: 10.1158/0008-5472.CAN-13-1994. [DOI] [PubMed] [Google Scholar]
- 34.Roy M, Mukherjee S. Reversal of resistance towards cisplatin by curcumin in cervical cancer cells. Asian Pac J Cancer Prev. 2014;15:1403–1410. doi: 10.7314/apjcp.2014.15.3.1403. [DOI] [PubMed] [Google Scholar]
- 35.Fritsche P, Seidler B, Schuler S, Schnieke A, Gottlicher M, Schmid RM, Saur D, Schneider G. HDAC2 mediates therapeutic resistance of pancreatic cancer cells via the BH3-only protein NOXA. Gut. 2009;58:1399–1409. doi: 10.1136/gut.2009.180711. [DOI] [PubMed] [Google Scholar]
- 36.Bao L, Diao H, Dong N, Su X, Wang B, Mo Q, Yu H, Wang X, Chen C. Histone deacetylase inhibitor induces cell apoptosis and cycle arrest in lung cancer cells via mitochondrial injury and p53 up-acetylation. Cell Biol Toxicol. 2016;32:469–482. doi: 10.1007/s10565-016-9347-8. [DOI] [PMC free article] [PubMed] [Google Scholar]
- 37.Munster PN, Thurn KT, Thomas S, Raha P, Lacevic M, Miller A, Melisko M, Ismail-Khan R, Rugo H, Moasser M, Minton SE. A phase II study of the histone deacetylase inhibitor vorinostat combined with tamoxifen for the treatment of patients with hormone therapy-resistant breast cancer. Br J Cancer. 2011;104:1828–1835. doi: 10.1038/bjc.2011.156. [DOI] [PMC free article] [PubMed] [Google Scholar]
- 38.Allfrey VG, Faulkner R, Mirsky AE. Acetylation and methylation of histones and their possible role in the regulation of RNA synthesis. Proc Natl Acad Sci U S A. 1964;51:786–794. doi: 10.1073/pnas.51.5.786. [DOI] [PMC free article] [PubMed] [Google Scholar]
- 39.Grunstein M. Histone acetylation in chromatin structure and transcription. Nature. 1997;389:349–352. doi: 10.1038/38664. [DOI] [PubMed] [Google Scholar]
- 40.Marchion DC, Bicaku E, Daud AI, Richon V, Sullivan DM, Munster PN. Sequence-specific potentiation of topoisomerase II inhibitors by the histone deacetylase inhibitor suberoylanilide hydroxamic acid. J Cell Biochem. 2004;92:223–237. doi: 10.1002/jcb.20045. [DOI] [PubMed] [Google Scholar]
- 41.Mito Y, Sugimoto A, Yamamoto M. Distinct developmental function of two Caenorhabditis elegans homologs of the cohesin subunit Scc1/Rad21. Mol Biol Cell. 2003;14:2399–2409. doi: 10.1091/mbc.E02-09-0603. [DOI] [PMC free article] [PubMed] [Google Scholar]
- 42.Ghiselli G, Coffee N, Munnery CE, Koratkar R, Siracusa LD. The cohesin SMC3 is a target the for beta-catenin/TCF4 transactivation pathway. J Biol Chem. 2003;278:20259–20267. doi: 10.1074/jbc.M209511200. [DOI] [PubMed] [Google Scholar]
- 43.Ghiselli G, Iozzo RV. Overexpression of bamacan/SMC3 causes transformation. J Biol Chem. 2000;275:20235–20238. doi: 10.1074/jbc.C000213200. [DOI] [PubMed] [Google Scholar]
- 44.Parsons SJ, Parsons JT. Src family kinases, key regulators of signal transduction. Oncogene. 2004;23:7906–7909. doi: 10.1038/sj.onc.1208160. [DOI] [PubMed] [Google Scholar]
- 45.Peterson-Roth E, Brdlik CM, Glazer PM. Src-induced cisplatin resistance mediated by cell-to-cell communication. Cancer Res. 2009;69:3619–3624. doi: 10.1158/0008-5472.CAN-08-0985. [DOI] [PMC free article] [PubMed] [Google Scholar]
- 46.Zhang K, Wang X, Wang H. Effect and mechanism of Src tyrosine kinase inhibitor sunitinib on the drug-resistance reversal of human A549/DDP cisplatin-resistant lung cancer cell line. Mol Med Rep. 2014;10:2065–2072. doi: 10.3892/mmr.2014.2440. [DOI] [PubMed] [Google Scholar]
- 47.Chen J, Elfiky A, Han M, Chen C, Saif MW. The role of Src in colon cancer and its therapeutic implications. Clin Colorectal Cancer. 2014;13:5–13. doi: 10.1016/j.clcc.2013.10.003. [DOI] [PubMed] [Google Scholar]
- 48.Wei L, Zhou Y, Dai Q, Qiao C, Zhao L, Hui H, Lu N, Guo QL. Oroxylin A induces dissociation of hexokinase II from the mitochondria and inhibits glycolysis by SIRT3-mediated deacetylation of cyclophilin D in breast carcinoma. Cell Death Dis. 2013;4:e601. doi: 10.1038/cddis.2013.131. [DOI] [PMC free article] [PubMed] [Google Scholar]
- 49.Crystal AS, Shaw AT, Sequist LV, Friboulet L, Niederst MJ, Lockerman EL, Frias RL, Gainor JF, Amzallag A, Greninger P, Lee D, Kalsy A, Gomez-Caraballo M, Elamine L, Howe E, Hur W, Lifshits E, Robinson HE, Katayama R, Faber AC, Awad MM, Ramaswamy S, Mino-Kenudson M, Iafrate AJ, Benes CH, Engelman JA. Patient-derived models of acquired resistance can identify effective drug combinations for cancer. Science. 2014;346:1480–1486. doi: 10.1126/science.1254721. [DOI] [PMC free article] [PubMed] [Google Scholar]
- 50.Girotti MR, Pedersen M, Sanchez-Laorden B, Viros A, Turajlic S, Niculescu-Duvaz D, Zambon A, Sinclair J, Hayes A, Gore M, Lorigan P, Springer C, Larkin J, Jorgensen C, Marais R. Inhibiting EGF receptor or SRC family kinase signaling overcomes BRAF inhibitor resistance in melanoma. Cancer Discov. 2013;3:158–167. doi: 10.1158/2159-8290.CD-12-0386. [DOI] [PMC free article] [PubMed] [Google Scholar]
- 51.Zhang J, Kalyankrishna S, Wislez M, Thilaganathan N, Saigal B, Wei W, Ma L, Wistuba II, Johnson FM, Kurie JM. SRC-family kinases are activated in non-small cell lung cancer and promote the survival of epidermal growth factor receptor-dependent cell lines. Am J Pathol. 2007;170:366–376. doi: 10.2353/ajpath.2007.060706. [DOI] [PMC free article] [PubMed] [Google Scholar]
- 52.Chiang YC, Chen YY, Hsieh SF, Chiang CJ, You SL, Cheng WF, Lai MS, Chen CA. Screening frequency and histologic type influence the efficacy of cervical cancer screening: a nationwide cohort study. Taiwan J Obstet Gynecol. 2017;56:442–448. doi: 10.1016/j.tjog.2017.01.010. [DOI] [PubMed] [Google Scholar]
- 53.Ochi N, Goto D, Yamane H, Yamagishi T, Honda Y, Monobe Y, Kawamoto H, Takigawa N. Obstructive jaundice caused by intraductal metastasis of lung adenocarcinoma. Onco Targets Ther. 2014;7:1847–1850. doi: 10.2147/OTT.S68757. [DOI] [PMC free article] [PubMed] [Google Scholar]
- 54.Ichihara E, Westover D, Meador CB, Yan Y, Bauer JA, Lu P, Ye F, Kulick A, de Stanchina E, McEwen R, Ladanyi M, Cross D, Pao W, Lovly CM. SFK/FAK signaling attenuates osimertinib efficacy in both drug-sensitive and drug-resistant models of EGFR-mutant lung cancer. Cancer Res. 2017;77:2990–3000. doi: 10.1158/0008-5472.CAN-16-2300. [DOI] [PMC free article] [PubMed] [Google Scholar]
- 55.Adenuga D, Rahman I. Protein kinase CK2-mediated phosphorylation of HDAC2 regulates co-repressor formation, deacetylase activity and acetylation of HDAC2 by cigarette smoke and aldehydes. Arch Biochem Biophys. 2010;498:62–73. doi: 10.1016/j.abb.2010.04.002. [DOI] [PMC free article] [PubMed] [Google Scholar]
- 56.Aggarwal R, Thomas S, Pawlowska N, Bartelink I, Grabowsky J, Jahan T, Cripps A, Harb A, Leng J, Reinert A, Mastroserio I, Truong TG, Ryan CJ, Munster PN. Inhibiting histone deacetylase as a means to reverse resistance to angiogenesis inhibitors: phase I study of abexinostat plus pazopanib in advanced solid tumor malignancies. J. Clin. Oncol. 2017;35:1231–1239. doi: 10.1200/JCO.2016.70.5350. [DOI] [PMC free article] [PubMed] [Google Scholar]
- 57.Kalal BS, Pai VR, Upadhya D. Valproic acid reduces tumor cell survival and proliferation with inhibitors of downstream molecules of epidermal growth factor receptor pathway. J Pharmacol Pharmacother. 2018;9:11–16. [Google Scholar]
- 58.Kalal BS, Pai VR, Behera SK, Somashekarappa HM. HDAC2 inhibitor valproic acid increases radiation sensitivity of drug-resistant melanoma cells. Med Sci (Basel) 2019;7:51. doi: 10.3390/medsci7030051. [DOI] [PMC free article] [PubMed] [Google Scholar]
- 59.Ma P, Pan H, Montgomery RL, Olson EN, Schultz RM. Compensatory functions of histone deacetylase 1 (HDAC1) and HDAC2 regulate transcription and apoptosis during mouse oocyte development. Proc Natl Acad Sci U S A. 2012;109:E481–489. doi: 10.1073/pnas.1118403109. [DOI] [PMC free article] [PubMed] [Google Scholar]
- 60.Schuler S, Fritsche P, Diersch S, Arlt A, Schmid RM, Saur D, Schneider G. HDAC2 attenuates TRAIL-induced apoptosis of pancreatic cancer cells. Mol Cancer. 2010;9:80. doi: 10.1186/1476-4598-9-80. [DOI] [PMC free article] [PubMed] [Google Scholar]
- 61.Li S, Wang F, Qu Y, Chen X, Gao M, Yang J, Zhang D, Zhang N, Li W, Liu H. HDAC2 regulates cell proliferation, cell cycle progression and cell apoptosis in esophageal squamous cell carcinoma EC9706 cells. Oncol Lett. 2017;13:403–409. doi: 10.3892/ol.2016.5436. [DOI] [PMC free article] [PubMed] [Google Scholar]
- 62.Chateauvieux S, Morceau F, Dicato M, Diederich M. Molecular and therapeutic potential and toxicity of valproic acid. J Biomed Biotechnol. 2010;2010:479364. doi: 10.1155/2010/479364. [DOI] [PMC free article] [PubMed] [Google Scholar]
- 63.Thangaraju M, Gopal E, Martin PM, Ananth S, Smith SB, Prasad PD, Sterneck E, Ganapathy V. SLC5A8 triggers tumor cell apoptosis through pyruvate-dependent inhibition of histone deacetylases. Cancer Res. 2006;66:11560–11564. doi: 10.1158/0008-5472.CAN-06-1950. [DOI] [PubMed] [Google Scholar]
- 64.Kalal BS, Modi PK, Upadhya D, Saha P, Prasad TSK, Pai VR. Inhibition of bone morphogenetic proteins signaling suppresses metastasis melanoma: a proteomics approach. Am J Transl Res. 2021;13:11081–11093. [PMC free article] [PubMed] [Google Scholar]
- 65.Xie N, Wang C, Lin Y, Li H, Chen L, Zhang T, Sun Y, Zhang Y, Yin D, Chi Z. The role of p38 MAPK in valproic acid induced microglia apoptosis. Neurosci Lett. 2010;482:51–56. doi: 10.1016/j.neulet.2010.07.004. [DOI] [PubMed] [Google Scholar]
- 66.Rohde D, Brehmer B, Kapp T, Valdor M, Jakse G. Induction of drug-resistant bladder carcinoma cells in vitro: impact on polychemotherapy with cisplatin, methotrexate and vinblastine (CMV) Urol Res. 1998;26:249–257. doi: 10.1007/s002400050053. [DOI] [PubMed] [Google Scholar]
- 67.van Meerloo J, Kaspers GJ, Cloos J. Cell sensitivity assays: the MTT assay. Methods Mol Biol. 2011;731:237–245. doi: 10.1007/978-1-61779-080-5_20. [DOI] [PubMed] [Google Scholar]
- 68.Larsen MR, Thingholm TE, Jensen ON, Roepstorff P, Jorgensen TJ. Highly selective enrichment of phosphorylated peptides from peptide mixtures using titanium dioxide microcolumns. Mol Cell Proteomics. 2005;4:873–886. doi: 10.1074/mcp.T500007-MCP200. [DOI] [PubMed] [Google Scholar]
- 69.Huang DW, Sherman BT, Tan Q, Collins JR, Alvord WG, Roayaei J, Stephens R, Baseler MW, Lane HC, Lempicki RA. The DAVID gene functional classification tool: a novel biological module-centric algorithm to functionally analyze large gene lists. Genome Biol. 2007;8:R183. doi: 10.1186/gb-2007-8-9-r183. [DOI] [PMC free article] [PubMed] [Google Scholar]
- 70.Mi H, Huang X, Muruganujan A, Tang H, Mills C, Kang D, Thomas PD. PANTHER version 11: expanded annotation data from gene ontology and reactome pathways, and data analysis tool enhancements. Nucleic Acids Res. 2017;45:D183–D189. doi: 10.1093/nar/gkw1138. [DOI] [PMC free article] [PubMed] [Google Scholar]
- 71.Keshava Prasad TS, Goel R, Kandasamy K, Keerthikumar S, Kumar S, Mathivanan S, Telikicherla D, Raju R, Shafreen B, Venugopal A, Balakrishnan L, Marimuthu A, Banerjee S, Somanathan DS, Sebastian A, Rani S, Ray S, Harrys Kishore CJ, Kanth S, Ahmed M, Kashyap MK, Mohmood R, Ramachandra YL, Krishna V, Rahiman BA, Mohan S, Ranganathan P, Ramabadran S, Chaerkady R, Pandey A. Human protein reference database--2009 update. Nucleic Acids Res. 2009;37:D767–772. doi: 10.1093/nar/gkn892. [DOI] [PMC free article] [PubMed] [Google Scholar]
- 72.Szklarczyk D, Morris JH, Cook H, Kuhn M, Wyder S, Simonovic M, Santos A, Doncheva NT, Roth A, Bork P, Jensen LJ, von Mering C. The STRING database in 2017: quality-controlled protein-protein association networks, made broadly accessible. Nucleic Acids Res. 2017;45:D362–D368. doi: 10.1093/nar/gkw937. [DOI] [PMC free article] [PubMed] [Google Scholar]
Associated Data
This section collects any data citations, data availability statements, or supplementary materials included in this article.


