Abstract
PRODORIC is worldwide one of the largest collections of prokaryotic transcription factor binding sites from multiple bacterial sources with corresponding interpretation and visualization tools. With the introduction of PRODORIC2 in 2017, the transition to a modern web interface and maintainable backend was started. With this latest PRODORIC release the database backend is now fully API-based and provides programmatical access to the complete PRODORIC data. The visualization tools Genome Browser and ProdoNet from the original PRODORIC have been reintroduced and were integrated into the PRODORIC website. Missing input and output options from the original Virtual Footprint were added again for position weight matrix pattern-based searches. The whole PRODORIC dataset was reannotated. Every transcription factor binding site was re-evaluated to increase the overall database quality. During this process, additional parameters, like bound effectors, regulation type and different types of experimental evidence have been added for every transcription factor. Additionally, 109 new transcription factors and 6 new organisms have been added. PRODORIC is publicly available at https://www.prodoric.de.
INTRODUCTION
Transcription factors (TFs) are proteins that regulate the transcription of genes by binding to corresponding regulatory DNA regions usually localized in the proximity to the transcriptional start site of a gene or operon often designated as promoters (1,2). Depending on the position of this DNA binding site, the TF can act as an activator or repressor for the target genes (3). The first level of transcriptional regulation in bacteria is mediated by the different DNA-binding sigma subunits of the RNA polymerase responding to various environmental stimuli (4,5). However, genes are usually not only regulated by only one, but rather by many TFs. In this way intra- and extracellular stimuli are integrated at one promoter site. Extracellular signals are often processed by two-component regulatory systems (TCS) consisting of a usually membrane bound histidine kinase sensor and a cytosolic response regulator (6,7). Signal molecules bind to the receptor domain of the histidine kinase resulting in autophosphorylation of the histidine kinase domain. The phosphoryl group gets subsequently transferred to the receiver domain of the response regulator. Phosphorylation activates the regulatory activity of the response regulator and its binding to the target gene. Intercellular signal transduction is often mediated by transcription factors containing a ligand binding domain and a DNA binding domain. The ligand binds to the transcription factor leading to a conformational change in the DNA binding domain which results in an increase or decrease in promoter binding affinity (8). Classical examples are the catabolite activator protein CAP and the repressor of the lactose operon LacI (9,10).
There are many databases covering transcription factors, TCSs or signal transduction pathways in prokaryotes: P2CS (11) contains TCSs of all available bacterial and archaeal genomes and their classification. The Swiss Institute of Bioinformatics (SIB) TCS database (12) contains a large dataset of predicted TCSs based on a Bayesian model. The MiST database (13) contains a large collection of signal transduction pathways for a large amount of organisms. KEGG (14) also provides a TCS pathway map, covering TCS-regulated genes. While these databases contain a comprehensive overview of available TCSs and TFs in various organisms, none of them provides the binding sites of the corresponding response regulators. BioCyc (15) aggregates biological data for thousands of prokaryotic genomes from various databases as well as from manual annotation. This includes a large amount of regulatory data, including TF binding site positions on the promoter region, phosphorylation reactions, regulatory data, TF binding site consensus sequences and graphical representation of regulated operons. However, BioCyc does not provide individual binding site sequences and access to the data is limited due to the commercial character of the database. Other databases are covering transcription factor binding sites for single bacterial organisms like RegulonDB or EcoCyc for Escherichia coli (16–18), DBTBS for Bacillus subtilis (19), CoryneRegNet for Corynebacteria (20), RhizioRegNet for Rhizobia (21). While all the database resources mentioned above offer a large quantity of gene regulation related data, none of them focusses on exclusively experimental validated transcription factor binding sites for different organisms. Additionally, none of the databases provides tools for the prediction of TF binding sites based on existing binding site sequences.
To integrate as many bacterial transcription factor binding sites as possible PRODORIC was established in 2003 (22) containing transcription factor binding sites from five organisms, E. coli, B. subtilis, Pseudomonas aeruginosa, Listeria monocytogenes and Helicobacter pylori. With the 2005 update Virtual Footprint, a tool for in silico regulon prediction, was integrated into PRODORIC (23). ProdoNet, a tool for identification and visualization of gene regulatory networks based on data stored in PRODORIC or generated by Virtual Footprint, was released in 2008 (24). The latest release of PRODORIC in 2017 started the overhaul and modernization of PRODORIC to bring the database to a state-of-the-art visual and technological standard for future developments (25).
Here we finally conclude this transition process of the almost two decades old database to present a modern, easy to use and highly effective bioinformatics tool.
DATABASE CURATION
The literature curation process of the last 18 years was carefully re-evaluated in the light of our aim to provide solely high quality data in PRODORIC. Thus, we defined clear guidelines for data curation and the corresponding experimental evidences required for data inclusion into the PRODORIC database. For this purpose, the complete database content was reannotated. During this process, transcription factor binding sites not matching these guidelines were removed. Additionally, duplicate transcription factor binding site annotations, for example with different binding site length or alternative names, were merged into one dataset. These merged and deleted datasets are still part of the database, but redirect to the combined dataset or show a deletion note, respectively.
Introduction of the parameter ‘Experimental Evidence’
PRODORIC now distinguishes between three types of experimental evidences for a DNA binding site of a transcriptional regulator, which are ‘In vivo expression evidence’, ‘Physical protein-DNA binding evidence’ and ‘Binding site variation evidence’. Correspondingly, different methods for every evidence group were defined. Those evidence groups are based on Evidence and Conclusion Ontology (ECO) (26).
In vivo expression evidence (ECO:0000049) describes the ability to change the expression of a gene when the transcription factor of interest is bound to the corresponding promoter region. In vivo methods sustaining this experimental evidence group include any kind of reporter gene-based expression assay, like β-Glucuronidase activity assays (27), β-galactosidase activity assay (28) or fluorescence based reporter assays (29). Here, the promoter region containing the transcription factor binding site is cloned to the reporter gene and the expression is either measured with and without transcription factor (mutant strain). Importantly, results from solely high throughput methods, like RNAseq or DNA microarrays are not sufficient for inclusion of the observed gene regulation phenomenon to the database. Nevertheless, the automated solid interpretation of such data with respect to the corresponding underlying gene regulatory networks will be subject to future PRODORIC developments.
Physical protein–DNA binding evidence (ECO:0000136) describes the actual physical binding of a transcription factor to a specific segment of DNA. In vitro methods including ‘footprint assays’ or gel retardation/electrophoretic mobility shift assays (EMSA) are widely used to detect the binding of regulators to a specific segment of DNA. Common methods are DNaseI footprinting assay (30), methylation protection/interference assay, 10-phenanthroline-copper footprint (31) and hydroxyl radical protection footprint (32). The binding region is either defined by the protected area of the footprint assay or by the DNA fragment successfully used for gel retardation assay.
Binding site variation evidence describes the verification of an actual DNA binding motif of a transcriptional regulator of interest by site-directed mutagenesis (ECO:0005528) or successive deletion (ECO:0001038) of the binding region in order to define an exact location and DNA sequence composition of the actual DNA binding site. Both techniques are usually combined with in vivo expression assay, footprint analyses or EMSAs.
For every binding site, the experimental method was extracted from the literature and is displayed on the matrix summary description. Additionally, a circular evidence indicator with three segments, representing the three evidence groups, is displayed for every binding site.
Sigma factors
Sigma factors are the environmental signal-specific DNA-binding subunits of RNA polymerase and essential for transcriptional initiation. They mediate environmental signals, including nitrogen status, heat and extreme heat shock, various environmental stresses, the need for flagella formation or iron transport (33–35). Sigma factors bind around the –35 and –10 regions of a classical bacteria promoter near the transcriptional start site (36). While some sigma factors need a specific spacer region length between the conserved –35 and –10 motifs, other sigma factors tolerate different spacer lengths (37). Previously, PRODORIC stored two distinct binding-sites for –35 and –10 consensus sequences for almost all sigma factors. In the latest version of PRODORIC, sigma factors are stored as one database entry, containing the aligned conserved –35 and –10 regions separated by a variable spacer region. Most sigma factor binding sites are defined by experimentally determined transcriptional start sites using the primer extension technology (38) and therefore may not have experimental evidence as described above.
Activation and repression of gene expression, influence of operon structures
PRODORIC now collects the regulatory mode of action (activation or repression) for every regulatory site. Additionally, the regulatory influence of effector binding or phosphorylation by a sensor histidine kinase is recorded. This information is displayed for every binding site and in the matrix summary.
A transcription factor can regulate a single gene or multiple genes organized in an operon. While some publications provide all genes in a regulated operon when describing a transcription factor binding site, many publications only use the first gene in an operon. To get the maximum amount of information about the regulated genes, we automatically use the operon database ODB (39) to check if a regulated gene is part of an operon and add any missing genes of the potential operon. This is now automatically performed by matching the gene or operon name from the literature to the known operons from ODB.
Database statistics
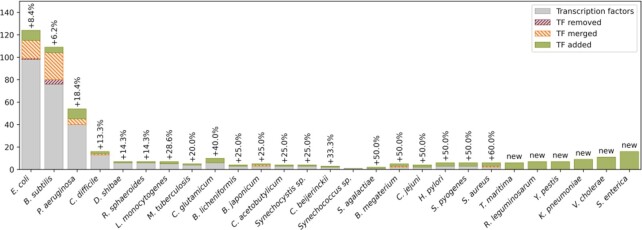
The 2017 release of PRODORIC contained 307 transcription factors from 21 different organisms. During current reannotation of PRODORIC, 49 transcription factors, mainly sigma factors, have been merged with other datasets. Five transcription factor datasets have been removed: the transcription attenuation proteins MtrB (MX000015 and MX000056) and PyrR (MX000061) from B. subtilis, the RNA chaperone CspA (MX000117) from E. coli and SenS (MX000063) from B. subtilis, was found not experimentally verified since no corresponding DNA binding site sequences were found in the literature. Moreover, 109 transcription factors were added to the database, 53 to existing organisms and 56 to newly added organisms (Figure 1, Table 1). PRODORIC now covers transcription factor binding sites for 27 organisms. We have added 6 new organisms in this release: the H2 producing, hyperthermophilic and anaerobic bacterium Thermotoga maritima (40), the plant growth-promoting Rhizobium leguminosarum (41) and the human pathogens Yersinia pestis (42), Klebsiella pneumoniae (43,44), Vibrio cholerae (45) and Salmonella enterica (46,47). The 2017 release of PRODORIC contained 4106 binding sites. During reannotation 936 binding sites were merged resulting in a new dataset, 436 binding sites were deleted (including 13 from deleted TFs) and 517 binding sites were added to PRODORIC (Table 1).
Figure 1.
Number of transcription factors per organism compared to the 2017 release of PRODORIC. Gray bars are the transcription factors in the previous version of PRODORIC. Red and orange hatched boxes are the transcription factors removed from PRODORIC or merged with other datasets, respectively. Green bars are new transcription factors added in this release. Numbers above the bars are the increase in percent compared to the 2017 release minus removed or merged datasets.
Table 1.
Absolute numbers of PRODORICs transcription factors (TFs) and transcription factor binding sites (TFBSs) in the 2021 release compared to the 2017 release
| 2017 release | Merged | Deleted | Added | 2021 release | |
|---|---|---|---|---|---|
| TFs | 307 | 49 | 5 | 109 | 362 |
| TFBSs | 4106 | 936 | 436 | 517 | 3238 |
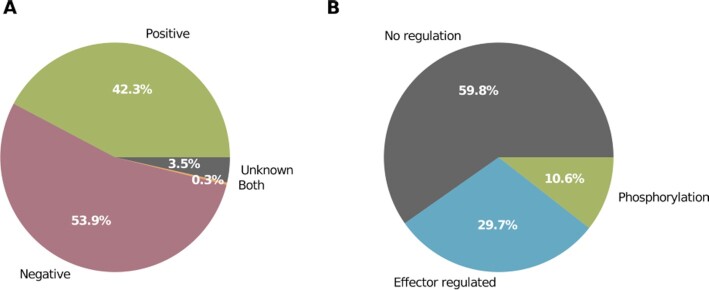
The new PRODORIC release now contains functional regulatory data for every transcription factor: 53.9% of the regulated operons are positively regulated, 42.3% are negatively regulated, for 3.5% of the genes the regulatory effect is unknown and 0.3% of the genes are positively or negatively regulated when the transcription factor is bound to the promoter (Figure 2A). For 29.7% of the regulated genes, one or more effector molecule is recorded, 10.6% are controlled by a two-component system and phosphorylation of the corresponding response regulator and for the remaining 59.8% no additional information about regulation was given (Figure 2B).
Figure 2.
Additional regulatory data for 1875 different operons. Multiple binding sites per operon have been omitted. (A) Regulatory mode of action for operons. (B) Transcription factor binding regulation.
Every binding site in PRODORIC is based on experimental evidence categorized into the three groups outlined above. The majority of the binding sites are based on physical protein-DNA interaction binding (27.9%), in vivo expression evidence (20%) or both (26.5%). 2.4% of the binding sites are based on DNA binding site variation evidence experiments together with physical protein-DNA binding evidence, 2.7% DNA binding site variation evidence together with in vivo expression evidence and 11.3% of the binding sites are based on all three types of experimental evidence (Figure 3). The only exception of this approach relies to most sigma factors, which make 9.1% of the binding sites in PRODORIC.
Figure 3.
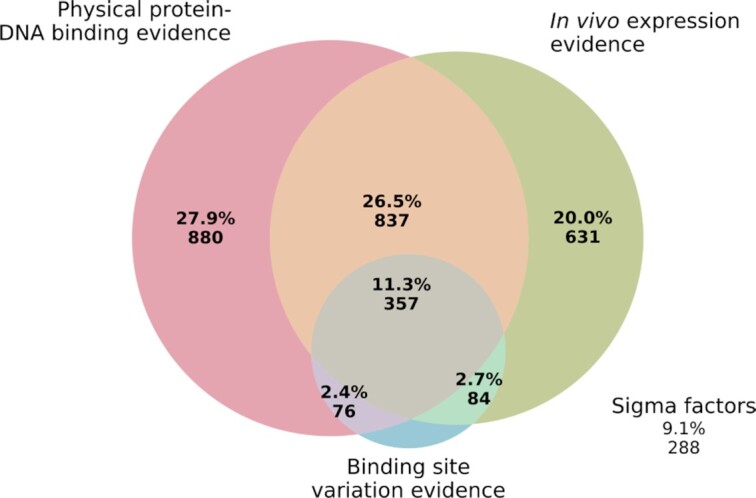
Venn diagram showing the number of binding sites elucidated by experiments categorized into three groups of experimental evidence. Sigma factors are not categorized into the three groups of experimental evidence.
MAJOR IMPROVEMENTS
With the 2017 release of PRODORIC2, a transition phase was started to implement a modern and maintainable state-of-the-art version of PRODORIC, which paves the path for future applications. For the course of this transition phase, the original PRODORIC website (http://www.prodoric.de) was kept active and the new version was released as PRODORIC2 (http://www.prodoric2.de). With this release the transition is over and PRODORIC is unified again, bringing back some of the features missing in PRODORIC2 and is consequently released simply as PRODORIC again (https://www.prodoric.de).
Backend infrastructure
We chose Python (48) as primary language for the future development of PRODORIC. Python is widely used in application development, scientific data analysis and webserver backend programming, this makes Python the perfect choice for the future developments of PRODORIC. PRODORIC uses FastAPI to access the database and provide the data on a representational state transfer (REST) application programming interface (API).
The new database backend is based on the non-relational NoSQL database MongoDB. Here, data is stored as documents in JSON format rather than in tables. The structure of those documents is flexible and not bound to a pre-defined schema, which makes future changes of the database easier. Additionally, MongoDB is horizontally scalable if more computational power is needed in the future.
Application Programming Interface
All PRODORIC data is available under Creative Commons Attribution-NonCommercial 4.0 (CC BY-NC 4.0) license. The data can be downloaded in CSV and JSON format or accessed through the REST API. A variety of endpoints is provided to access the data stored in the database and to submit Virtual Footprint analysis to the PRODORIC server. A full interactive API documentation is available at https://www.prodoric.de/api/.
Website
The PRODORIC website now fully supports mobile devices, replacing result tables with a tile view on small screen sizes. The website is build on the VueJS framework, which reduces server accesses to API calls once the page has been loaded.
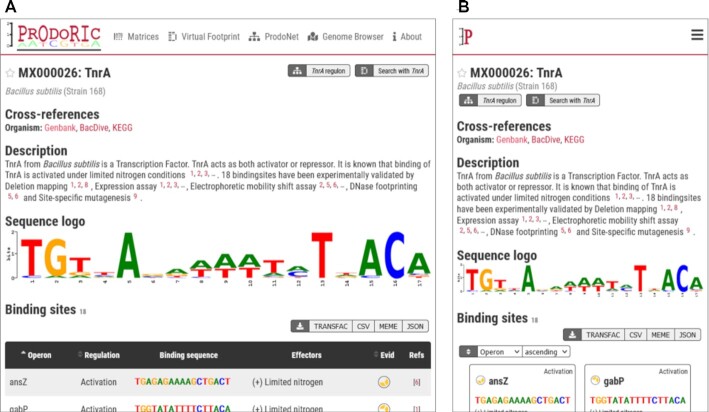
The core of PRODORICs data is the transcription factor or matrix summary page. The page includes cross-references to the organism specific databases BacDive (49), Genbank (50) and KEGG (14), and the protein-specific databases RCSB Protein Data Bank (PDB) (51) and Uniprot (52). Additionally, a text summary of the transcription factors characteristics, links to PRODORICs tools, the sequence logo, the list of binding sites and all literature references are part of the summary page (Figure 4). The sequence logo of the binding site is downloadable in SVG and PNG format, the binding site data is downloadable in CSV, FASTA and TRANSFAC (53) format. Additionally, we added download in MEME (54) and JSON formats to the new PRODORIC release.
Figure 4.
Matrix summary page of the transcription factor TnrA of B. subtilis (MX000026). (A) Desktop view with binding site table. (B) Mobile view with binding sites in tile view.
Regulation by certain effectors or via trans-phosphorylation is described in the corresponding text summary and for every binding site. The experimental evidence is displayed as a circle with three segments representing the various types of experiments described earlier. The color code indicates the number of evidence classes covered by the corresponding experiments extracted from literature (Figure 5).
Figure 5.
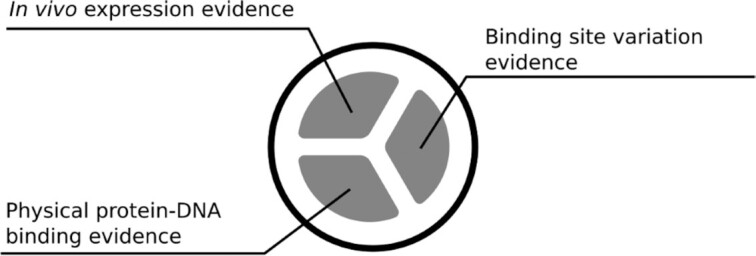
Experimental evidence indicator used on the PRODORIC website. The three segments represent the three evidence groups. Independently from the evidence group, segments can have three colors, red (one evidence group covered), yellow (two groups covered) and green (all three groups covered).
The matrices list is sortable and searchable and gives a quick overview of the transcription factor binding site characteristics. In the tabular view, the colorized consensus sequence of the binding motif is displayed and in the mobile view the sequence logo is displayed.
Improved Virtual Footprint
The Virtual Footprint tool for the prediction of transcription factor binding sites (23), was rewritten in Python to fit into the new PRODORIC ecosystem. The 2017 release of PRODORIC only covered the genome wide search with one transcription factor (regulon analysis), omitting many popular features of the original PRODORIC. We now reintroduced features like the search with multiple transcription factors in smaller sequences, like promoter regions (promoter analysis).
One of the major limitations of the 2017 release of PRODORICs Virtual Footprint was the limitation of searching Genbank files previously stored on the PRODORIC webserver. While a large amount of Genbank files were available, newly elucidated genomes needed to be manually added regularly to the server. However, this approach limited the search function to publicly available Genbank genomes only. To address both issues, PRODORIC now allows for three different types of sequence inputs: 1. The user can directly search for Genbank entries available at the NCBI (50). The PRODORIC website uses the Entrez programming utilities (55) to access all Genbank entries and uploads the Genbank files to the PRODORIC server, if needed. The PRODORIC server stores frequently used Genbank files in a prepared JSON format for quick access. 2. Genbank files can directly be uploaded to PRODORIC, allowing to search in unpublished Genbank files. 3. Upload and text input of sequences in FASTA format is also available, however, result mapping to genes is only available when Genbank files are used as input. In addition to the search for binding sites stored in PRODORIC, the user can now define a custom matrix in FASTA format. PRODORIC calculates the position weight matrix for the custom input and displays the resulting sequence logo.
The Genome Browser is back
The Genome Browser is now reintroduced into the PRODORIC website. The new version is dynamic and genes are visualized on the corresponding genome sequence in high quality. The identical Genbank inputs as for Virtual Footprint are available for the Genome Browser visualization. All data processing and storage can be done locally without upload of data to the PRODORIC webserver. Similar to the original version of the Genome Browser of PRODORIC, Genbank genomes can be visualized graphically and additionally in the DNA sequence mode. Thus, genes are displayed on an interactive map and additionally on the level of the genome sequence. The new Virtual Footprint tool links directly to the regulatory region in the Genome Browser and significantly improves the visualization of the Virtual Footprint results on the genome level.
Newly integrated network visualization
In 2008 ProdoNet, a web-application for the visualization of gene regulatory networks, was released (24). ProdoNet was based on experimental gene regulatory data of the PRODORIC database and regulon predictions from the Virtual Footprint tool. Originally, the network visualization of ProdoNet was implemented as a Java applet and was not accessible anymore. Thus, we implemented gene network visualization based on ProdoNet for this version of PRODORIC using the vis.js network library. Currently, PRODORICs new network view only visualizes the data present in PRODORIC. For most organisms in PRODORIC, experimentally validated gene regulation data is limited. Therefore, mapping of experimental data is not implemented. Clearly, this is the next step in PRODORIC development.
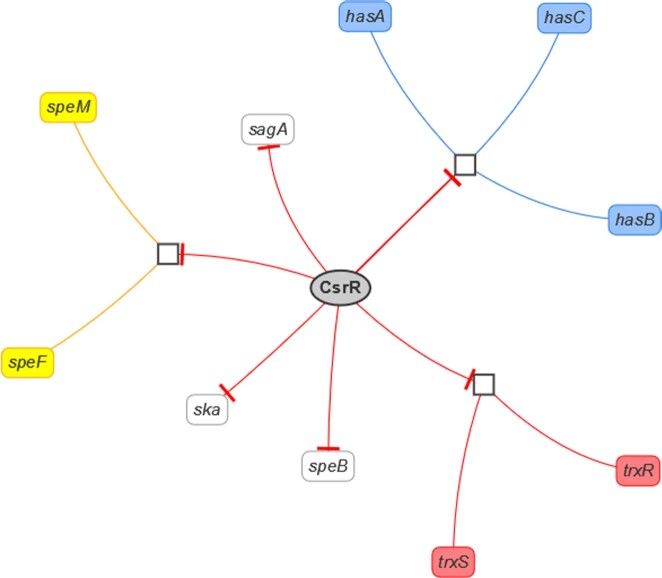
Network visualization is available for single transcription factor entries or all transcription factors for an organism in PRODORIC. Genes of regulated operons are locally grouped together, the type of regulation is indicated by the arrow connecting the transcription factor and regulation of the transcription factor can be selected (if one or more effector, condition or kinase is given) and the graph adapts to the change (Figure 6). The network can be downloaded in PNG and JSON format.
Figure 6.
Network visualization example of the transcription factor CsrR from Streptococcus pyogenes (MX000041). The transcription factor (grey ellipse) regulates operons (white square) or genes (rounded box), the regulation type is indicated by arrows: activation (green), repression (red). The expression of the transcription factor is indicated by the dashed grey arrow. The color of the genes indicates members of the same operon.
CONCLUSION
With this major upgrade, PRODORIC left the transition phase started in 2017. The new Python and MongoDB-based backend will allow for more rapid progress in future developments. Many missing features from the original PRODORIC have been reintroduced to PRODORIC, like Genome Browser, ProdoNet network visualization, promoter analysis and custom matrices. With the reannotation of the whole database, we increased the quality of the data stored in PRODORIC by addition of regulatory information and experimental evidence for every binding site. Beside the qualitative improvements, we added more than 100 new transcription factors to existing organisms and to six new organisms like Y. pestis, S. enterica and V. cholerae.
We created the new PRODORIC website with a mobile first approach to make the database as accessible as possible when using mobile devices. This works perfectly for text based content. However, while Genome Browser and ProdoNet are fully functional on mobile devices, the best user experience is achieved on larger screen sizes.
The reintroduction of regulatory network visualization to PRODORIC will allow future mapping of experimental data to the regulatory networks stored in PRODORIC. However, for the most organisms only a small amount of transcription factors are stored in PRODORIC. Even E. coli, the organism with the most transcription factors in PRODORIC does not cover all 147 predicted transcription factors (56). Future additions to the PRODORIC database have to focus on addition to the existing organisms to allow for a reliable mapping of transcriptional data to a regulatory network. To increase the number of binding sites and transcription factors, PRODORICs data curation process would highly benefit from text mining to pre-select publications for manual curation.
There are many transcription factors which only bind to one specific binding site, regulating only one promoter. So far, those transcription factors have not been added to PRODORIC, because this would result in a position weight matrix constructed from just one binding sequence. A similar problem exists for matrices with only few binding sites, where the specificity of the conserved nucleotides can not be determined correctly. As many transcription factors bind as dimers to palindromic repeats, one possible approach would be to only use the conserved half-sites of the binding sites to construct a position weight matrix and use two half-site matrices with a non-specific spacer region of the correct length for the Virtual Footprint search. Another approach would be to cluster conserved transcription factor binding sites from multiple organisms to construct a position weight matrix.
Additionally, genes are not only regulated by TFs binding to a promoter region. The location of a TF binding side with respect to the transcriptional start site, multi-promoter-operons or overlap with other competing transcription factor or sigma factor binding sites are currently not covered by PRODORIC. Here, PRODORIC needs to expand in the future, to cover the actual complex promoter structure and to convey a comprehensive overview of regulation at the multiple signal integration level.
The switch to Python as primary programming language will allow us to create a PRODORIC Python package, that provides convenient access to the PRODORIC data via the REST API, local Virtual Footprint analysis and data visualization.
ACKNOWLEDGEMENTS
We thank Oona Rössler and Alina Mayer for reannotating all PRODORIC data and the curation of transcription factor binding sites for the new organisms.
Contributor Information
Christian-Alexander Dudek, Institute of Microbiology and Braunschweig Integrated Centre of Systems Biology (BRICS), Technische Universität Braunschweig, Rebenring 56, Braunschweig D-38106, Germany.
Dieter Jahn, Institute of Microbiology and Braunschweig Integrated Centre of Systems Biology (BRICS), Technische Universität Braunschweig, Rebenring 56, Braunschweig D-38106, Germany.
FUNDING
Funding for open access charge: TU Braunschweig Open Access Publication Fund.
Conflict of interest statement. None declared.
REFERENCES
- 1. Abril A.G., Rama J.L.R., Sánchez-Pérez A., Villa T.G.. Prokaryotic sigma factors and their transcriptional counterparts in Archaea and Eukarya. Appl. Microbiol. Biot. 2020; 104:4289–4302. [DOI] [PubMed] [Google Scholar]
- 2. Griesenbeck J., Tschochner H., Grohmann D.. Structure and function of RNA polymerases and the transcription machineries. Macromol. Protein Complexes. 2017; 225–270. [DOI] [PubMed] [Google Scholar]
- 3. Browning D.F., Busby S.J.. Local and global regulation of transcription initiation in bacteria. Nat. Rev. Microbiol. 2016; 14:638–650. [DOI] [PubMed] [Google Scholar]
- 4. Davis M.C., Kesthely C.A., Franklin E.A., MacLellan S.R.. The essential activities of the bacterial sigma factor. Can. J. Microbiol. 2017; 63:89–99. [DOI] [PubMed] [Google Scholar]
- 5. Laudet V. Evolution of the nuclear receptor superfamily: early diversification from an ancestral orphan receptor. J. Mol. Endocrinol. 1997; 19:207–226. [DOI] [PubMed] [Google Scholar]
- 6. Padilla-Vaca F., Mondragon-Jaimes V., Franco B.. General aspects of two-component regulatory circuits in bacteria: domains, signals and roles. Curr. Protein Peptide Sci. 2017; 18:990–1004. [DOI] [PubMed] [Google Scholar]
- 7. Groisman E.A. Feedback control of two-component regulatory systems. Annu. Rev. Microbiol. 2016; 70:103–124. [DOI] [PMC free article] [PubMed] [Google Scholar]
- 8. Perez-Rueda E., Martinez-Nuñez M.A.. The repertoire of DNA-binding transcription factors in prokaryotes: functional and evolutionary lessons. Sci. Prog. 2012; 95:315–329. [DOI] [PMC free article] [PubMed] [Google Scholar]
- 9. Lewis M., Chang G., Horton N.C., Kercher M.A., Pace H.C., Schumacher M.A., Brennan R.G., Lu P.. Crystal structure of the lactose operon repressor and its complexes with DNA and inducer. Science. 1996; 271:1247–1254. [DOI] [PubMed] [Google Scholar]
- 10. Lawson C.L., Swigon D., Murakami K.S., Darst S.A., Berman H.M., Ebright R.H.. Catabolite activator protein: DNA binding and transcription activation. Curr. Opin. Struc. Biol. 2004; 14:10–20. [DOI] [PMC free article] [PubMed] [Google Scholar]
- 11. Ortet P., Whitworth D.E., Santaella C., Achouak W., Barakat M.. P2CS: updates of the prokaryotic two-component systems database. Nucleic Acids Res. 2015; 43:D536–D541. [DOI] [PMC free article] [PubMed] [Google Scholar]
- 12. Burger L., Van Nimwegen E.. Accurate prediction of protein–protein interactions from sequence alignments using a Bayesian method. Mol. Syst. Biol. 2008; 4:165. [DOI] [PMC free article] [PubMed] [Google Scholar]
- 13. Gumerov V.M., Ortega D.R., Adebali O., Ulrich L.E., Zhulin I.B.. MiST 3.0: an updated microbial signal transduction database with an emphasis on chemosensory systems. Nucleic Acids Res. 2020; 48:D459–D464. [DOI] [PMC free article] [PubMed] [Google Scholar]
- 14. Kanehisa M., Goto S.. KEGG: kyoto encyclopedia of genes and genomes. Nucleic Acids Res. 2000; 28:27–30. [DOI] [PMC free article] [PubMed] [Google Scholar]
- 15. Karp P.D., Billington R., Caspi R., Fulcher C.A., Latendresse M., Kothari A., Keseler I.M., Krummenacker M., Midford P.E., Ong Q.et al.. The BioCyc collection of microbial genomes and metabolic pathways. Brief. Bioinform. 2019; 20:1085–1093. [DOI] [PMC free article] [PubMed] [Google Scholar]
- 16. Salgado H., Martínez-Flores I., Bustamante V.H., Alquicira-Hernández K., García-Sotelo J.S., García-Alonso D., Collado-Vides J.. Using RegulonDB, the Escherichia coli K-12 gene regulatory transcriptional network database. Curr.Protoc. Bioinformatics. 2018; 61:1.32.1–1.32.30. [DOI] [PMC free article] [PubMed] [Google Scholar]
- 17. Karp P., Ong W., Paley S., Billington R., Caspi R., Fulcher C., Kothari A., Krummenacker M., Latendresse M., Midford P.et al.. The EcoCyc database. EcoSal Plus. 2018; 8: 10.1128/ecosalplus.esp-0006-2018. [DOI] [PMC free article] [PubMed] [Google Scholar]
- 18. Santos-Zavaleta A., Salgado H., Gama-Castro S., Sánchez-Pérez M., Gómez-Romero L., Ledezma-Tejeida D., García-Sotelo J.S., Alquicira-Hernández K., Muñiz-Rascado L.J., Peña-Loredo P.et al.. RegulonDB v 10.5: tackling challenges to unify classic and high throughput knowledge of gene regulation in E.coli K-12. Nucleic Acids Res. 2019; 47:D212–D220. [DOI] [PMC free article] [PubMed] [Google Scholar]
- 19. Sierro N., Makita Y., de Hoon M., Nakai K.. DBTBS: a database of transcriptional regulation in Bacillus subtilis containing upstream intergenic conservation information. Nucleic Acids Res. 2008; 36:D93–D96. [DOI] [PMC free article] [PubMed] [Google Scholar]
- 20. Parise M. T.D., Parise D., Kato R.B., Pauling J.K., Tauch A., de Carvalho Azevedo V.A., Baumbach J.. CoryneRegNet 7, the reference database and analysis platform for corynebacterial gene regulatory networks. Scientific Data. 2020; 7:142. [DOI] [PMC free article] [PubMed] [Google Scholar]
- 21. Krol E., Blom J., Winnebald J., Berhörster A., Barnett M.J., Goesmann A., Baumbach J., Becker A.. RhizoRegNet—a database of rhizobial transcription factors and regulatory networks. J. Biotechnol. 2011; 155:127–134. [DOI] [PubMed] [Google Scholar]
- 22. Münch R., Hiller K., Barg H., Heldt D., Linz S., Wingender E., Jahn D.. PRODORIC: prokaryotic database of gene regulation. Nucleic Acids Res. 2003; 31:266–269. [DOI] [PMC free article] [PubMed] [Google Scholar]
- 23. Münch R., Hiller K., Grote A., Scheer M., Klein J., Schobert M., Jahn D.. Virtual Footprint and PRODORIC: an integrative framework for regulon prediction in prokaryotes. Bioinformatics. 2005; 21:4187–4189. [DOI] [PubMed] [Google Scholar]
- 24. Klein J., Leupold S., Münch R., Pommerenke C., Johl T., Kärst U., Jänsch L., Jahn D., Retter I.. ProdoNet: identification and visualization of prokaryotic gene regulatory and metabolic networks. Nucleic Acids Res. 2008; 36:W460–W464. [DOI] [PMC free article] [PubMed] [Google Scholar]
- 25. Eckweiler D., Dudek C.-A., Hartlich J., Brötje D., Jahn D.. PRODORIC2: the bacterial gene regulation database in 2018. Nucleic Acids Res. 2017; 46:D320–D326. [DOI] [PMC free article] [PubMed] [Google Scholar]
- 26. Giglio M., Tauber R., Nadendla S., Munro J., Olley D., Ball S., Mitraka E., Schriml L.M., Gaudet P., Hobbs E.T.et al.. ECO, the Evidence & Conclusion Ontology: community standard for evidence information. Nucleic Acids Res. 2019; 47:D1186–D1194. [DOI] [PMC free article] [PubMed] [Google Scholar]
- 27. Jefferson R.A., Burgess S.M., Hirsh D.. beta-Glucuronidase from Escherichia coli as a gene-fusion marker. Proc. Natl. Acad. Sci. U.S.A. 1986; 83:8447–8451. [DOI] [PMC free article] [PubMed] [Google Scholar]
- 28. Richmond M., Gray J., Stine C.. Beta-galactosidase: review of recent research related to technological application, nutritional concerns, and immobilization. J. Dairy. Sci. 1981; 64:1759–1771. [Google Scholar]
- 29. Sussman H.E. Choosing the best reporter assay. The Scientist. 2001; 15:25–25. [Google Scholar]
- 30. Brenowitz M., Senear D.F., Kingston R.E.. DNase I footprint analysis of protein-DNA binding. Curr. Protoc. Mol. Biol. 1989; Chapter 12:Unit 12.4. [DOI] [PubMed] [Google Scholar]
- 31. Basak S., Nagaraja V.. A versatile in vivo footprinting technique using 1, 10-phenanthroline–copper complex to study important cellular processes. Nucleic Acids Res. 2001; 29:e105. [DOI] [PMC free article] [PubMed] [Google Scholar]
- 32. Carey M., Smale S.T.. Hydroxyl-radical footprinting. Cold Spring Harbor Protoc. 2007; 2007: 10.1101/pdb.prot4810. [DOI] [PubMed] [Google Scholar]
- 33. Burgess R.R., Anthony L.. How sigma docks to RNA polymerase and what sigma does. Curr. Opin. Microbiol. 2001; 4:126–131. [DOI] [PubMed] [Google Scholar]
- 34. Jishage M., Ishihama A.. Transcriptional organization and in vivo role of the Escherichia coli rsd gene, encoding the regulator of RNA polymerase sigma D. J. Bacteriol. 1999; 181:3768–3776. [DOI] [PMC free article] [PubMed] [Google Scholar]
- 35. Helmann J.D., Chamberlin M.J.. Structure and function of bacterial sigma factors. Annu. Rev. Biochem. 1988; 57:839–872. [DOI] [PubMed] [Google Scholar]
- 36. Merrick M.J. In a class of its own – the RNA polymerase sigma factor σ;54 (σN). Mol. Microbiol. 1993; 10:903–909. [DOI] [PubMed] [Google Scholar]
- 37. Gaballa A., Guariglia-Oropeza V., Dürr F., Butcher B.G., Chen A.Y., Chandrangsu P., Helmann J.D.. Modulation of extracytoplasmic function (ECF) sigma factor promoter selectivity by spacer region sequence. Nucleic Acids Res. 2017; 46:134–145. [DOI] [PMC free article] [PubMed] [Google Scholar]
- 38. Carey M.F., Peterson C.L., Smale S.T.. The primer extension assay. Cold Spring Harbor Protoc. 2013; 2013:164–73. [DOI] [PubMed] [Google Scholar]
- 39. Okuda S., Yoshizawa A.C.. ODB: a database for operon organizations, 2011 update. Nucleic Acids Res. 2010; 39:D552–D555. [DOI] [PMC free article] [PubMed] [Google Scholar]
- 40. Conners S.B., Mongodin E.F., Johnson M.R., Montero C.I., Nelson K.E., Kelly R.M.. Microbial biochemistry, physiology, and biotechnology of hyperthermophilic Thermotoga species. FEMS Microbiol. Rev. 2006; 30:872–905. [DOI] [PubMed] [Google Scholar]
- 41. Yanni Y.G., Rizk R.Y., Abd El-Fattah F.K., Squartini A., Corich V., Giacomini A., de Bruijn F., Rademaker J., Maya-Flores J., Ostrom P.et al.. The beneficial plant growth-promoting association of Rhizobium leguminosarum bv. trifolii with rice roots. Funct. Plant. Biol. 2001; 28:845–870. [Google Scholar]
- 42. Achtman M., Morelli G., Zhu P., Wirth T., Diehl I., Kusecek B., Vogler A.J., Wagner D.M., Allender C.J., Easterday W.R.et al.. Microevolution and history of the plague bacillus, Yersinia pestis. Proc. Natl. Acad. Sci. U.S.A. 2004; 101:17837–17842. [DOI] [PMC free article] [PubMed] [Google Scholar]
- 43. Munoz-Price L.S., Poirel L., Bonomo R.A., Schwaber M.J., Daikos G.L., Cormican M., Cornaglia G., Garau J., Gniadkowski M., Hayden M.K.et al.. Clinical epidemiology of the global expansion of Klebsiella pneumoniae carbapenemases. Lancet Infect. Dis. 2013; 13:785–796. [DOI] [PMC free article] [PubMed] [Google Scholar]
- 44. Martin R.M., Bachman M.A.. Colonization, infection, and the accessory genome of Klebsiella pneumoniae. Front. Cell Infect. Mi. 2018; 8:4. [DOI] [PMC free article] [PubMed] [Google Scholar]
- 45. Faruque S.M., Albert M.J., Mekalanos J.J.. Epidemiology, genetics, and ecology of toxigenic Vibrio cholerae. Microbiol. Mol. Biol. R. 1998; 62:1301–1314. [DOI] [PMC free article] [PubMed] [Google Scholar]
- 46. Hensel M. Evolution of pathogenicity islands of Salmonella enterica. Int. J. Med. Microbiol. 2004; 294:95–102. [DOI] [PubMed] [Google Scholar]
- 47. Knodler L.A., Elfenbein J.R.. Salmonella enterica. Trends Microbiol. 2019; 27:964–965. [DOI] [PubMed] [Google Scholar]
- 48. Van Rossum G., Drake F.L.. Python 3 Reference Manual. 2009; Scotts Valley, CA: CreateSpace. [Google Scholar]
- 49. Reimer L.C., Vetcininova A., Carbasse J.S., Söhngen C., Gleim D., Ebeling C., Overmann J.. BacDive in 2019: bacterial phenotypic data for high-throughput biodiversity analysis. Nucleic Acids Res. 2018; 47:D631–D636. [DOI] [PMC free article] [PubMed] [Google Scholar]
- 50. Sayers E.W., Cavanaugh M., Clark K., Ostell J., Pruitt K.D., Karsch-Mizrachi I.. GenBank. Nucleic Acids Res. 2018; 47:D94–D99. [DOI] [PMC free article] [PubMed] [Google Scholar]
- 51. Burley S.K., Bhikadiya C., Bi C., Bittrich S., Chen L., Crichlow G.V., Christie C.H., Dalenberg K., Di Costanzo L., Duarte J.M.et al.. RCSB Protein Data Bank: powerful new tools for exploring 3D structures of biological macromolecules for basic and applied research and education in fundamental biology, biomedicine, biotechnology, bioengineering and energy sciences. Nucleic Acids Res. 2020; 49:D437–D451. [DOI] [PMC free article] [PubMed] [Google Scholar]
- 52. The UniProt Consortium UniProt: the universal protein knowledgebase in 2021. Nucleic Acids Res. 2020; 49:D480–D489. [DOI] [PMC free article] [PubMed] [Google Scholar]
- 53. Wingender E. The TRANSFAC project as an example of framework technology that supports the analysis of genomic regulation. Brief. Bioinform. 2008; 9:326–332. [DOI] [PubMed] [Google Scholar]
- 54. Bailey T.L., Johnson J., Grant C.E., Noble W.S.. The MEME Suite. Nucleic Acids Res. 2015; 43:W39–W49. [DOI] [PMC free article] [PubMed] [Google Scholar]
- 55. Sayers E., Wheeler D.. Building Customized Data Pipelines Using the Entrez Programming Utilities (eUtils). 2004; NCBI. [Google Scholar]
- 56. Fang X., Sastry A., Mih N., Kim D., Tan J., Yurkovich J.T., Lloyd C.J., Gao Y., Yang L., Palsson B.O.. Global transcriptional regulatory network for Escherichia coli robustly connects gene expression to transcription factor activities. Proc. Natl. Acad. Sci. U.S.A. 2017; 114:10286–10291. [DOI] [PMC free article] [PubMed] [Google Scholar]


