Abstract
Background
With the rapid advances of genetic and genomic technologies, the pathophysiological mechanisms of idiopathic pulmonary fibrosis (IPF) were gradually becoming clear, however, the prognosis of IPF was still poor. This study aimed to systematically explore the ferroptosis-related genes model associated with prognosis in IPF patients.
Methods
Datasets were collected from the Gene Expression Omnibus (GEO). The least absolute shrinkage and selection operator (LASSO) Cox regression analysis was applied to create a multi-gene predicted model from patients with IPF in the Freiburg cohort of the GSE70866 dataset. The Siena cohort and the Leuven cohort were used for validation.
Results
Nineteen differentially expressed genes (DEGs) between the patients with IPF and control were associated with poor prognosis based on the univariate Cox regression analysis (all P < 0.05). According to the median value of the risk score derived from an 8-ferroptosis-related genes signature, the three cohorts’ patients were stratified into two risk groups. Prognosis of high-risk group (high risk score) was significantly poorer compared with low-risk group in the three cohorts. According to multivariate Cox regression analyses, the risk score was an independently predictor for poor prognosis in the three cohorts. Receiver operating characteristic (ROC) curve analysis and decision curve analysis (DCA) confirmed the signature's predictive value in the three cohorts. According to functional analysis, inflammation- and immune-related pathways and biological process could participate in the progression of IPF.
Conclusions
These results imply that the 8-ferroptosis-related genes signature in the bronchoalveolar lavage samples might be an effective model to predict the poor prognosis of IPF.
Supplementary Information
The online version contains supplementary material available at 10.1186/s12890-021-01799-7.
Keywords: Idiopathic pulmonary fibrosis, Gene signature, Ferroptosis, Prognosis, Inflammation, Immune response
Introduction
Characterized by fibrosis or structural deformations, idiopathic pulmonary fibrosis (IPF) is a chronic and progressive interstitial lung disease of unknown etiology [1, 2]. In the United States, incidence of IPF in people aged 18–64 years was 6.1 new cases per 100,000 person-years [3]. Currently, pirfenidone and nintedanib have been approved by the United States Food and Drug Administration to treat patients with IPF [4, 5]. However, the prognosis of IPF is still poor, the median survival time is usually 2–3 years after diagnosis [6, 7], and the 5-year survival rate is less than 40% [8]. Therefore, it is very important to explore the novel prognostic models associated with prognosis in patients with IPF.
As a kind of special biological sample, bronchoalveolar lavage fluid (BALF) contains the accumulation of extravasated inflammatory cells and cytokines reflecting the microenvironment around the alveoli, and studies have verified that changes in the alveolar microenvironment are correlated with the progression of IPF [9]. A study has constructed a 4-genes signature of bronchoalveolar lavage cells, which may be an effective prognostic tool to deliver more personalized treatment decisions for patients with IPF [10]. Ferroptosis is a newly described form of caspase-independent regulated cell death (RCD) characterized by cellular accumulation of reactive oxygen species (ROS) driven through iron-dependent lipid [11, 12]. Studies have found that ferroptosis was associated with the fibrosis of many organs such as liver, heart, and lung, and the ROS accumulation and oxidative stress may be the primary inducer of ferroptosis in this process [13–17]. In addition, iron overload may cause lung fibrosis according to increased lipid peroxidation and decreased glutathione peroxidase 4 (GPX4) activity in lung tissues [18]. However, whether the ferroptosis-related genes are associated with prognosis of patients with IPF is unclear. Furthermore, the systematic exploration of the prognostic signature based on ferroptosis-related genes between the patients with IPF and subjects in the control group is also absent.
Therefore, according to the dataset from the Gene Expression Omnibus (GEO), the study aimed to systematically explore the prognostic value of an 8-ferroptosis-related genes signature in patients with IPF. Finally, we explored the possible mechanisms based on functional enrichment analysis.
Materials and methods
Acquisition of data
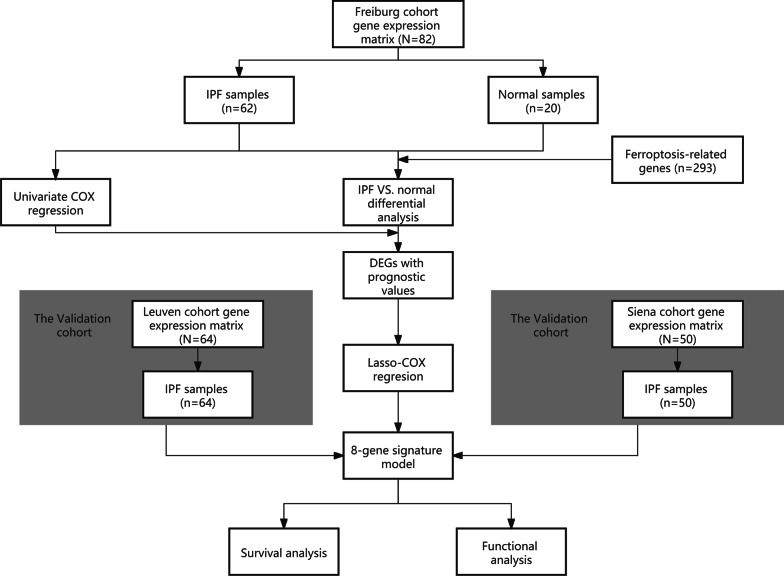
The workflow of this study was shown in Fig. 1. On the GEO database (http://www.ncbi.nlm.nih.gov/geo/), we selected datasets must meet the following items: (1) the detected samples came from the bronchoalveolar lavage (BAL) of patients with IPF or control group; (2) raw data or a gene expression matrix should be provided; (3) the dataset must contain information regarding the prognostic status. Finally, one dataset, GSE70866 was identified (platform: GPL14550 and GPL17077). IPF diagnosis in this dataset was established by a multidisciplinary board at each institution based on the American Thoracic Society/European Respiratory Society criteria [19, 20] and was confirmed to be consistent with guidelines published in 2011 [2]. Approval of the Ethics Committee was not required because the information of patients was obtained from the GEO.
Fig. 1.
Workflow of this study
Ferroptosis-related genes (FRGs) were acquired from GeneCards database (https://www.genecards.org/) by searching the terms “ferroptosis” and PubMed by searching the terms “Ferroptosis [MeSH] OR Ferroptosis* [tiab]”. Consequently, 103 FRGs and 190 FRGs were respectively obtained from GeneCards and PubMed in the study (Additional file 7: Table S1).
Construction and validation of a prognostic ferroptosis-related gene signature
This study included a discovery cohort consisted of 20 normal people and 62 patients from Freiburg, Germany, and two independent validation cohorts: Siena, Italy (50 patients) and Leuven, Belgium (64 patients, Table 1). The differentially expressed genes (DEGs) between patients with IPF and controls were identified by R package "limma" with a false discovery rate (FDR) < 0.05 in the Freiburg cohort [21]. Cox regression analysis was performed for prognostic value of the ferroptosis-related genes according to R package “survival” (https://github.com/therneau/survival, v.3.2–7) or SPSS Statistics 23 (IBM SPSS). Heatmap was constructed according to R packages “pheatmap” (v1.0.12). An interaction network for the ferroptosis-related DEGs with significant prognostic value was generated by the STRING database (version 11.0) [22] and visualized by Cytoscape (a software platform for visualizing complex networks, version v3.6.1). In order to minimize the risk of overfitting, a prognostic model was constructed by LASSO-penalized (least absolute shrinkage and selection operator) Cox regression analysis according to the R package "glmnet" (v.4.1-1) [23, 24]. The independent variable in the Cox regression was the expression matrix of candidate ferroptosis-related DEGs with significant prognostic value, and the response variables were survival status of patients in the Freiburg cohort. Following the minimum criteria, penalty parameter (λ) for the model was determined by ten-fold cross-validation (the value of λ corresponding to the lowest partial likelihood deviance). The risk scores of the patients were calculated based on each gene’s expression level and its corresponding regression coefficient as follows: score = sum (each gene’s expression × corresponding coefficient). The patients were stratified into high-risk and low-risk groups according to the median value of the risk score. Based on the expression of genes in the predicted model, principal component analysis (PCA) was performed in the GraphPad Prism 9. Besides, t-distributed stochastic neighbor embedding (t-SNE) were carried out to seek the distribution of different groups using the "Rtsne" R package (v.0.15). The optimal cut-off expression value of each gene of the model was determined for the survival analysis by the "surv_cutpoint" function of the R package "survminer" (https://cran.r-project.org/web/packages/survminer/index.html, v.0.4.9). The time‐dependent ROC curve was constructed to evaluate the predictive value of the risk score according to the R package "survivalROC" (https://CRAN.R-project.org/package=survivalROC,v.1.0.3).
Table 1.
Clinical characteristics of the patients with IPF used in this study
| Characteristics | Freiburg cohort | Siena cohort | Leuven cohort |
|---|---|---|---|
| No. of patients | 62 | 50 | 64 |
| Age (median, range) | 69 (63–75) | 69 ± 11 | 68 ± 9 |
| Gender (%) | |||
| Female | 9 (14.5) | 10 (20.0) | 13 (20.3) |
| male | 53 (85.5) | 40 (80.0) | 51 (79.7) |
| GAP | |||
| Stage I | 17 (27.4) | 14 (28.0) | 25 (39.1) |
| Stage II | 32 (51.6) | 20 (40.0) | 31 (48.4) |
| Stage III | 13 (21.0) | 16 (32.0) | 8 (12.5) |
| Survival status | |||
| Time to death (months) | 18 (6–32) | 14 ± 9 | 12 (7–24) |
| Censored | 17 (27.4) | 19 (38.0) | 40 (62.5) |
Values are presented as median (IQR), mean ± SD or n (%)
GAP gender, age and physiologic variables, IQR interquartile range, SD standard deviation
Decision curve analysis (DCA) was performed to evaluate whether the prognostic model could help improve clinical decision-making. The y-axis represents the net benefit, and the x-axis indicates the probability of the threshold value. By using “stdca.R” (http://www.decisioncurveanalysis.org/) [25], DCA was used to determine the clinical usefulness of the signature.
Functional enrichment analysis
Based on the DEGs (|log2FC|> 1, FDR < 0.05) between the high-risk and low-risk groups, Gene Ontology (GO) and Kyoto Encyclopedia of Genes and Genomes (KEGG) analyses were conducted by the R package "clusterProfiler" (v.3.18.1) [26]. P values were adjusted with the Benjamini & Hochberg (BH) correction. The infiltrating score of 19 immune cells and the activity of 15 immune-related pathways (Additional file 8: Table S2) [27] were calculated with single-sample gene set enrichment analysis (ssGSEA) using the R package "gsva" (v.1.38.2) [28].
Statistical analysis
R software (Version 4.0.3) and SPSS Statistics 23 (IBM SPSS) was used for statistical analysis. When the data were normally distributed, means for continuous variables were compared according to independent group t tests [described as mean ± SD (standard deviation)]; otherwise, the Mann–Whitney test was used (data were described as median [interquartile range [IQR])]. Categorical variables were described as number (%) and were compared by Chi-square test or the Fisher exact test. Kaplan–Meier analysis with the log-rank test was used to compare the survival between different groups. Univariate and multivariate Cox regression was used to estimate the hazard ratio (HR) to identify predictors of mortality. Some statistical analyses were visualized by GraphPad Prism 9. Bilateral test (the test level α = 0.05) was used.
Results
Identification of prognostic ferroptosis-related DEGs in the Freiburg cohort
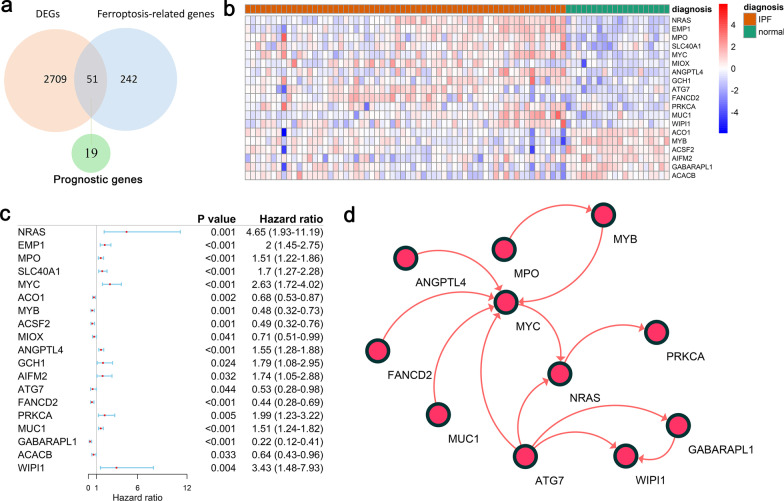
Of the 293 ferroptosis-related genes, 51 (17.4%) were differentially expressed between patients with IPF and controls, and 19 of them were correlated with prognosis according to the univariate Cox regression analysis (Fig. 2a–c). The interaction network among the 19 genes was showed in Fig. 2d.
Fig. 2.
Identification of prognostic genes in the Freiburg cohort. (a) The intersection of genes between the DEGs and ferroptosis-related genes. (b) Heatmap plot of 19 prognostic DEGs. Red represents expression level of genes were up-regulated, blue represents expression level of genes were down-regulated. A relative color scheme uses the minimum and maximum values in each row to convert values to colors. (c) Forest plots of the univariate Cox regression analysis of the 19 prognostic DEGs. (d) A protein–protein interaction network for the 19 prognostic DEGs, 8 genes were excluded due to no connection with other genes
Construction of a prognostic model in the Freiburg cohort
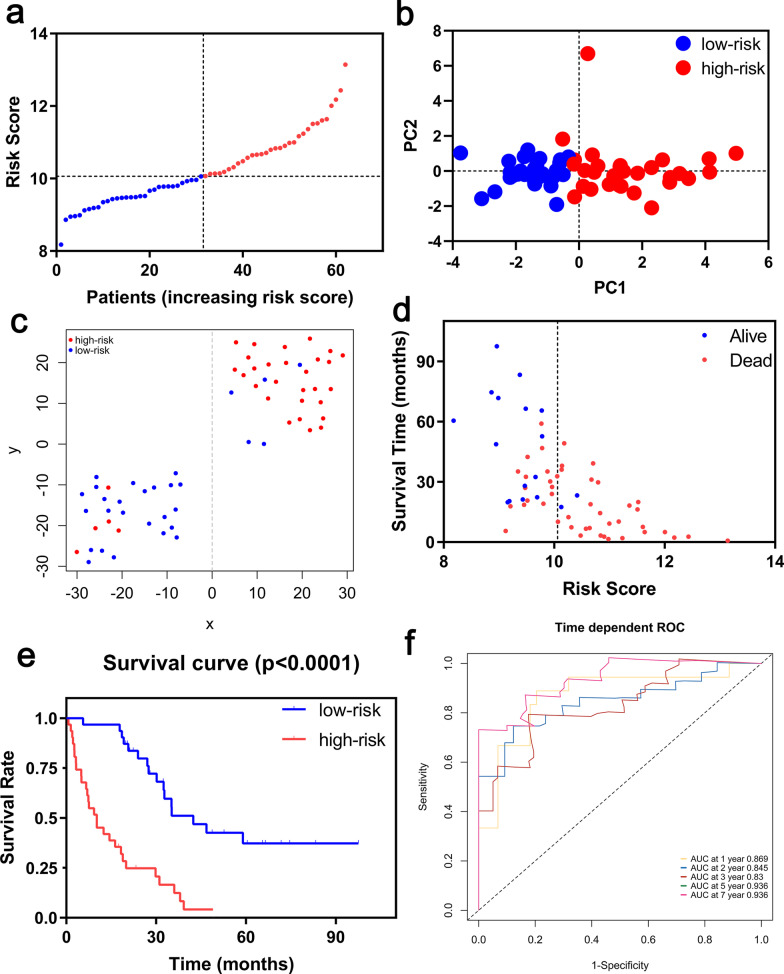
A prognostic model was established by LASSO Cox regression analysis using the expression profile of the 19 genes mentioned above. An 8-ferroptosis-related genes signature was constructed based on the optimal value of λ (Additional file 1: Figure S1), and the survival analyses of the 8 genes according to the optimal cut-off expression value of each gene were showed in the Additional file 2: Figure S2. The risk score was calculated as follows: 0.447056157 * expression level of NRAS + 0.008853087 * expression level of EMP1 + 0.283483044 * expression level of SLC40A1 + 0.308932641 * expression level of MYC + 0.191156392 * expression level of ANGPTL4 + 0.312166561 * expression level of PRKCA + 0.072692152 * expression level of MUC1—0.200150039 * expression level of GABARAPL1. According to the median cut-off value, the patients were stratified into a high-risk group (n = 31) and a low-risk group (n = 31) (Fig. 3a). The risk score was significantly positively correlated with GAP score and mortality in the Freiburg cohort (Table 2). PCA and t-SNE analysis demonstrated the patients in different risk groups were distributed in two directions (Fig. 3b, c). Patients in the high-risk group had a higher probability of death earlier than those in the low-risk group (Fig. 3d, e). Time-dependent ROC curves was used to evaluated the predictive performance of the risk score for mortality, and the area under the curve (AUC) reached 0.869 at 1 year, 0.845 at 2 years, 0.83 at 3 years and 0.936 at 5, 7 years (Fig. 3f).
Fig. 3.
Prognostic analysis of the 8-gene signature model in the Freiburg cohort. (a) The distribution and median value of the risk scores. (b) PCA plot. (c) t-SNE analysis. (d) The distributions of survival status, survival time and risk score. (e) Kaplan–Meier curves for the survival between high-risk and low-risk patients. (f) Time-dependent ROC curves for the predictive value of the risk score
Table 2.
Baseline characteristics of the patients in different risk groups
| Characteristics | Freiburg cohort | Siena cohort | Leuven cohort | ||||||
|---|---|---|---|---|---|---|---|---|---|
| High risk | Low risk | P value | High risk | Low risk | P valve | High risk | Low risk | P value | |
| Age, years | 65.74 ± 10.06 | 69.06 ± 7.82 | 0.262 | 70.08 ± 11.34 | 67.28 ± 11.13 | 0.383 | 68.53 ± 7.80 | 67.97 ± 9.35 | 0.795 |
| ≥ 60 | 22 (71.0) | 27 (87.1) | 0.119 | 20 (80.0) | 22 (88.0) | 0.702 | 29 (90.6) | 27 (84.4) | 0.708 |
| < 60 | 9 (29.0) | 4 (12.9) | 5 (20.0) | 3 (12.0) | 3 (9.4) | 5 (15.6) | |||
| Gender | 1.000 | 0.480 | 0.120 | ||||||
| Female | 5 (16.1) | 4 (12.9) | 4 (16.0) | 6 (24.0) | 4 (12.5) | 9 (28.1) | |||
| Male | 26 (83.9) | 27 (87.1) | 21 (84.0) | 19 (76.0) | 28 (87.5) | 23 (71.9) | |||
| GAP | 0.027 | 0.051 | 0.080 | ||||||
| Stage I | 4 (12.9) | 13 (41.9) | 5 (20.0) | 9 (36.0) | 8 (25.0) | 17 (53.1) | |||
| Stage II | 18 (58.1) | 14 (45.2) | 8 (32.0) | 12 (48.0) | 19 (59.4) | 12 (37.5) | |||
| Stage III | 9 (29.0) | 4 (12.9) | 12 (48.0) | 4 (16.0) | 5 (15.6) | 3 (9.4) | |||
| Survival status | < 0.001 | 0.001 | 0.002 | ||||||
| Dead | 29 (93.5) | 16 (51.6) | 21 (84.0) | 10 (40.0) | 18 (56.3) | 6 (18.8) | |||
| Censored | 2 (6.5) | 15 (48.4) | 4 (16.0) | 15 (60.0) | 14 (43.7) | 26 (81.2) | |||
Values are presented as mean ± SD or n (%)
GAP gender, age and physiologic variables, SD standard deviation
The decision curves of the prognostic model in the Freiburg cohort were shown in Additional file 3: Figure S3a. The black solid line indicates no intervention, and the net benefit is zero. The gray solid line represents the intervention, at which the net benefit is an oblique line with a negative slope. The red dotted line represents the realized profits of the 8-ferroptosis-related genes model. The decision curve showed that, at threshold values of 0.2–0.5, the greatest clinical benefit will be obtained from the prognostic model with 8-ferroptosis-related genes.
Validation of the signature in the Siena and Leuven cohort
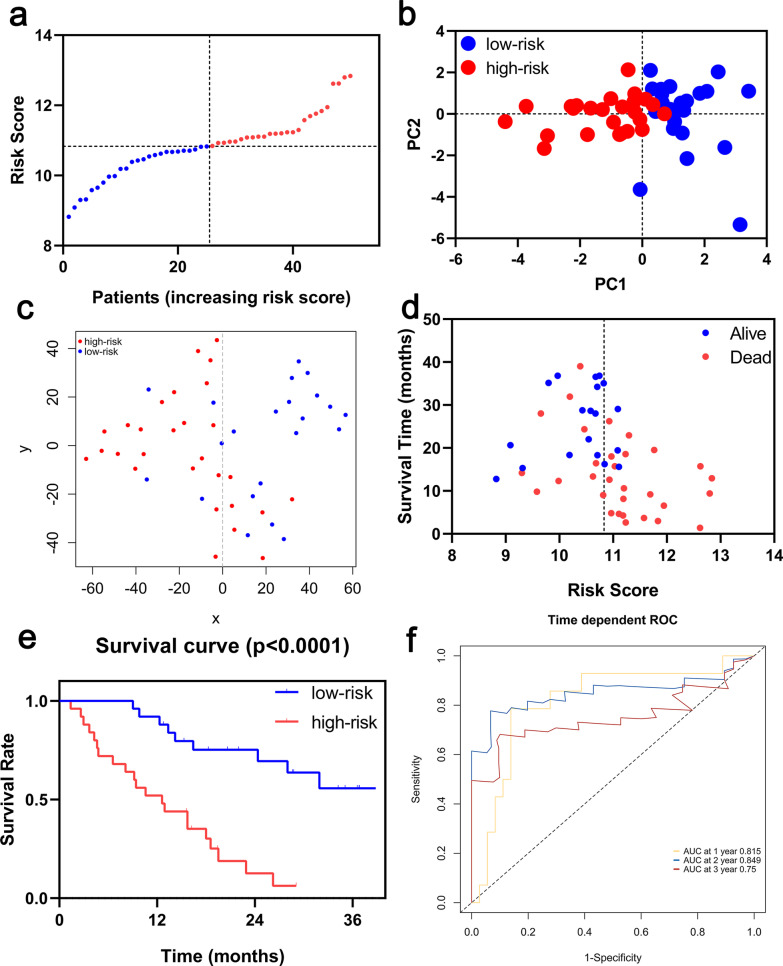
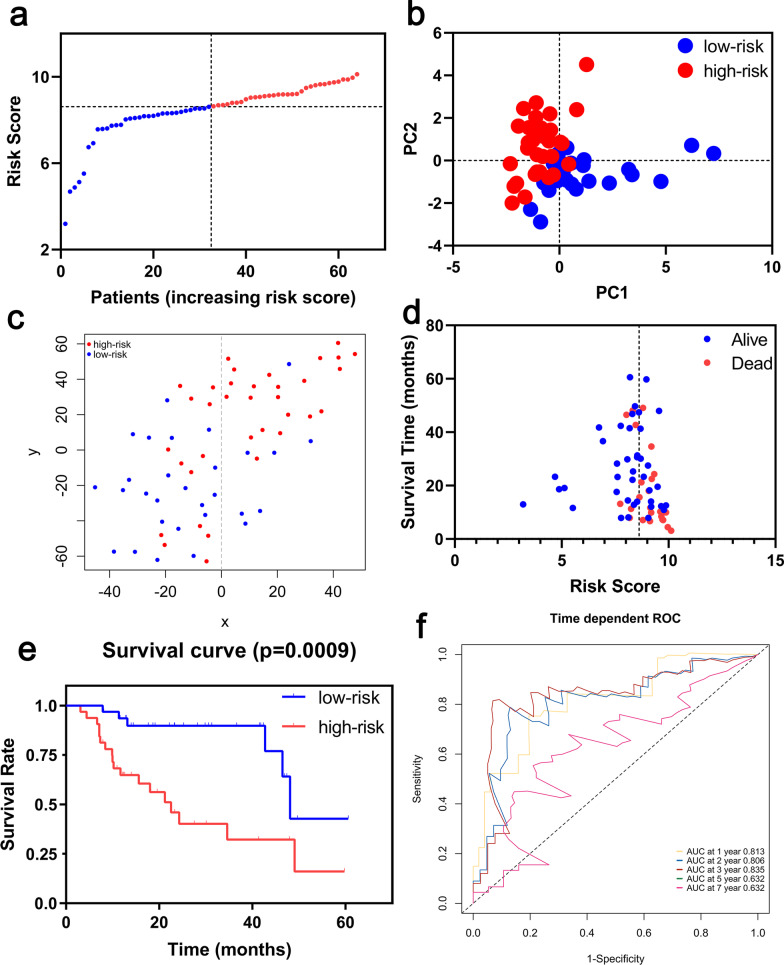
Survival analyses of the 8 genes in the ferroptosis-related signature showed that these genes were associated with poor prognosis in the Siena cohort and the Leuven cohort (all P < 0.05, Additional files 4, 5: Figures S4, S5). To test the robustness of the signature constructed from the Freiburg cohort, the patients from the Siena and Leuven cohorts were also divided into high- or low-risk groups respectively according to the median value of risk score calculated with the same formula in the Freiburg cohort (Figs. 4a, 5a, respectively). The patients in the high-risk group were also associated with higher mortality in the Siena cohort and Leuven cohort, respectively (Table 2). PCA and t-SNE analysis demonstrated that patients in two subgroups were distributed in discrete directions (Figs. 4b, c, 5b, c). Consistently, high-risk patients were more likely to encounter death earlier and had higher mortality compared with low-risk patients (Figs. 4d, e, 5d, e). In addition, the AUC of the 8-genes signature was 0.815 at 1 year, 0.849 at 2 years, and 0.750 at 3 years in Siena cohort (Fig. 4f), and, the AUC of the 8-gene signature was 0.813 at 1 year, 0.806 at 2 years, 0.835 at 3 years and 0.632 at 5 years in Leuven cohort (Fig. 5f). Furthermore, The DCA showed that the risk score was more likely to have better clinical benefit than GAP (Additional file 3: Figure S3b–c).
Fig. 4.
Prognostic analysis of the 8-gene signature model in the Siena cohort. (a) The distribution and median value of the risk scores. (b) PCA plot. (c) t-SNE analysis. (d) The distributions of survival status, survival time and risk score. (e) Kaplan–Meier curves for the survival between high-risk and low-risk patients. (f) Time-dependent ROC curves for the predictive value of the risk score
Fig. 5.
Prognostic analysis of the 8-gene signature model in the Leuven cohort. (a) The distribution and median value of the risk scores. (b) PCA plot. (c) t-SNE analysis. (d) The distributions of survival status, survival time and risk score. (e) Kaplan–Meier curves for the survival between high-risk and low-risk patients. (f) Time-dependent ROC curves for the predictive value of the risk score
Independent prognostic value of the signature
In univariate Cox regression analyses, the risk score was significantly positively correlated with mortality in the Freiburg cohort, Siena cohort and Leuven cohort (HR = 5.06, 95% CI 2.64–9.68, P < 0.001; HR = 5.52, 95% CI 2.36–12.89, P < 0.001; HR = 4.25, 95% CI 1.68–10.77, P = 0.002, respectively, Fig. 6). After correcting for other confounding factors, the risk score was still an independent predictor for mortality in multivariate Cox regression analysis (Freiburg cohort: HR = 4.61, 95% CI 2.35–9.06, P < 0.001; Siena cohort: HR = 7.61, 95% CI 2.83–20.49, P < 0.001; Leuven cohort: HR = 3.17, 95% CI 1.23–8.14, P = 0.017; Fig. 6).
Fig. 6.
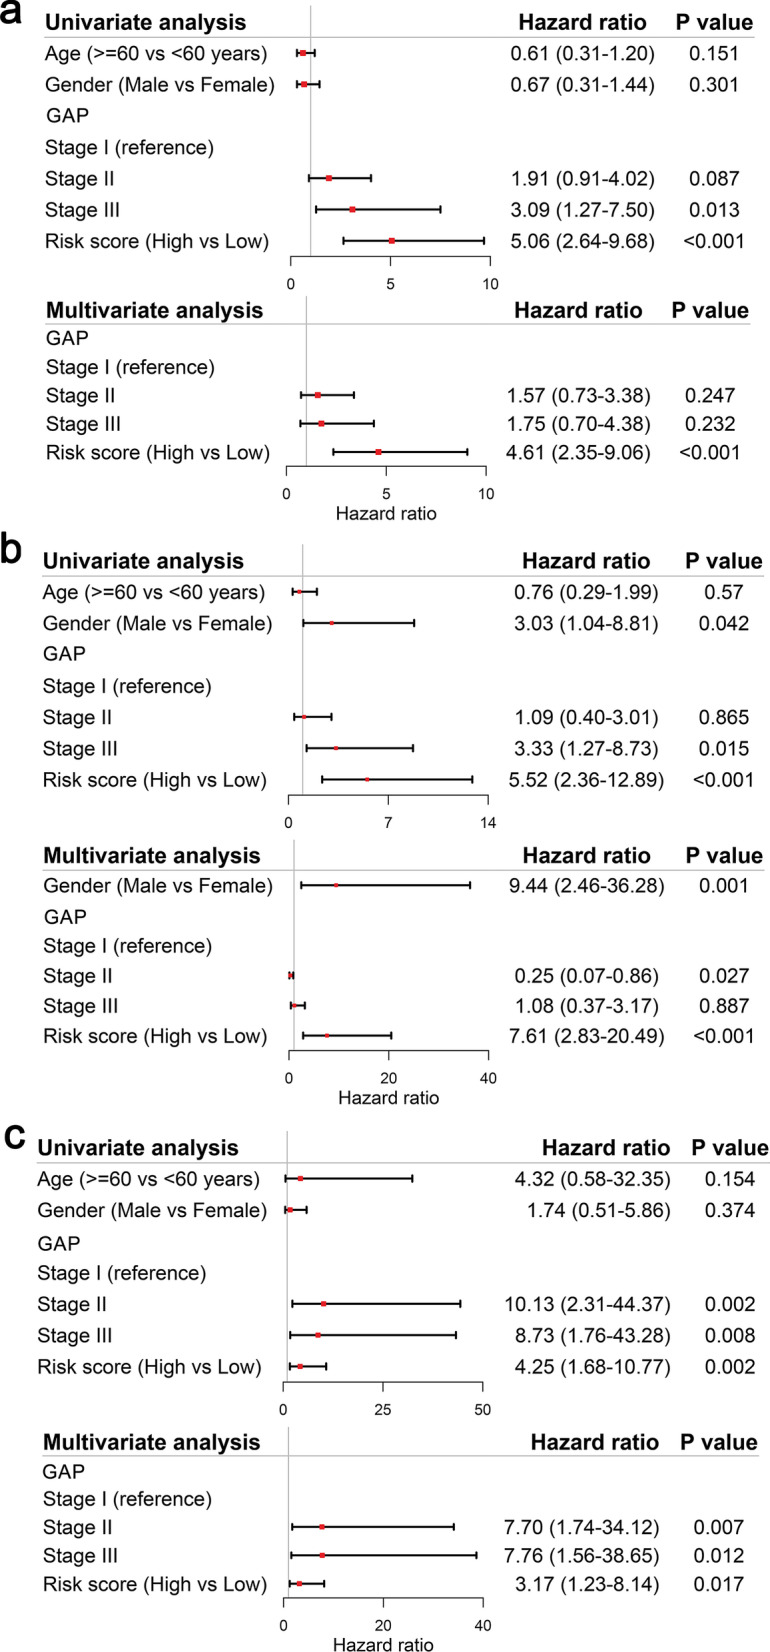
Results of the univariate and multivariate Cox regression analyses regarding mortality in the Freiburg cohort (a) and in the Siena validation cohort (b), and in the Leuven validation cohort (c)
Functional analyses in the Freiburg and the Siena cohort
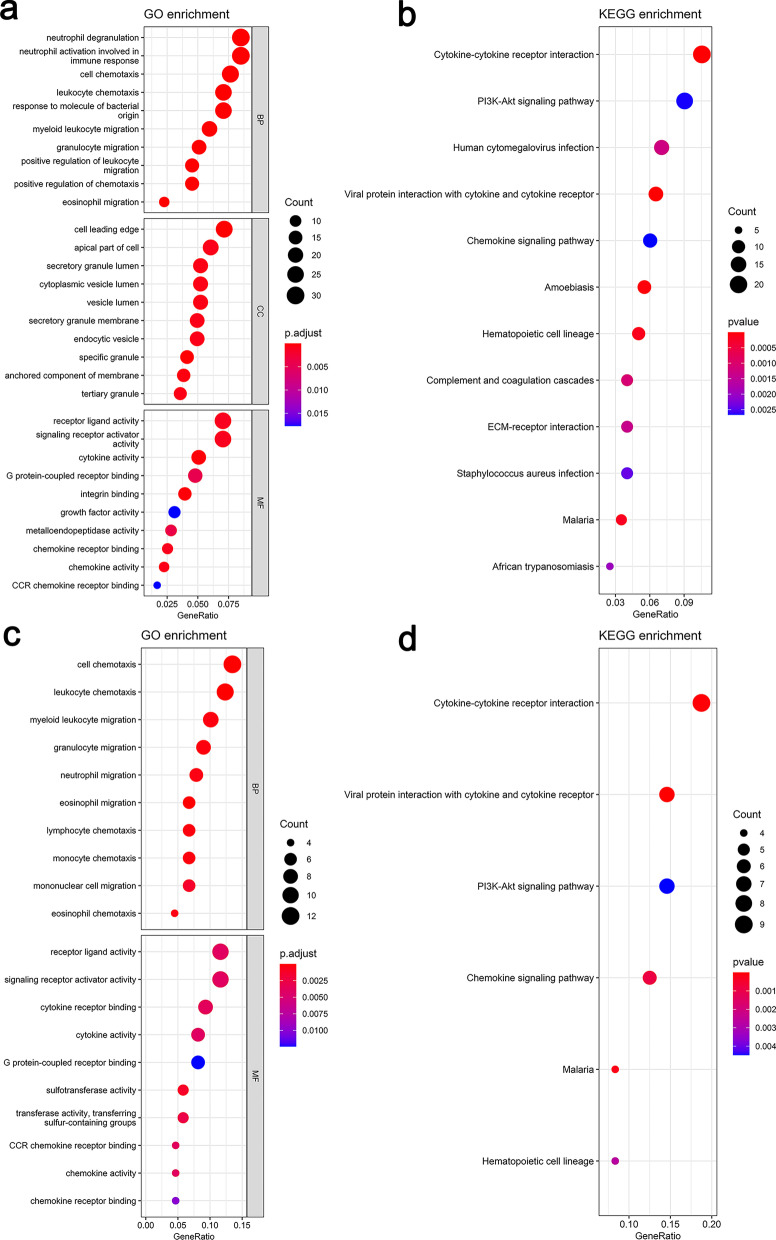
In order to reveal the underlying biological functions and pathways that were correlated with the risk score, GO enrichment and KEGG pathway analyses were used to perform the DEGs between the high-risk and low-risk groups in the Freiburg and the Siena cohort. DEGs were enriched in inflammation- and immune-related GO and KEGG pathways such as receptor ligand activity, signaling receptor activator activity, cytokine activity, G protein-coupled receptor binding, CCR chemokine receptor binding, cytokine-cytokine receptor interaction, and chemokine receptor binding (Fig. 7) etc. As to Leuven cohort, the number of differential genes obtained under the same criteria was too small to perform functional enrichment analysis, so it was excluded.
Fig. 7.
Significant GO terms and KEGG pathway analysis. a The top 10 significant terms for biological processes (BP), cellular component (CC), molecular function (MF) respectively in the Freiburg cohort. b The significant terms for KEGG pathways in the Freiburg cohort. c The top 10 significant terms for biological processes (BP), molecular function (MF) respectively in the Siena validation cohort. d The significant terms for KEGG pathways in the Siena validation cohort
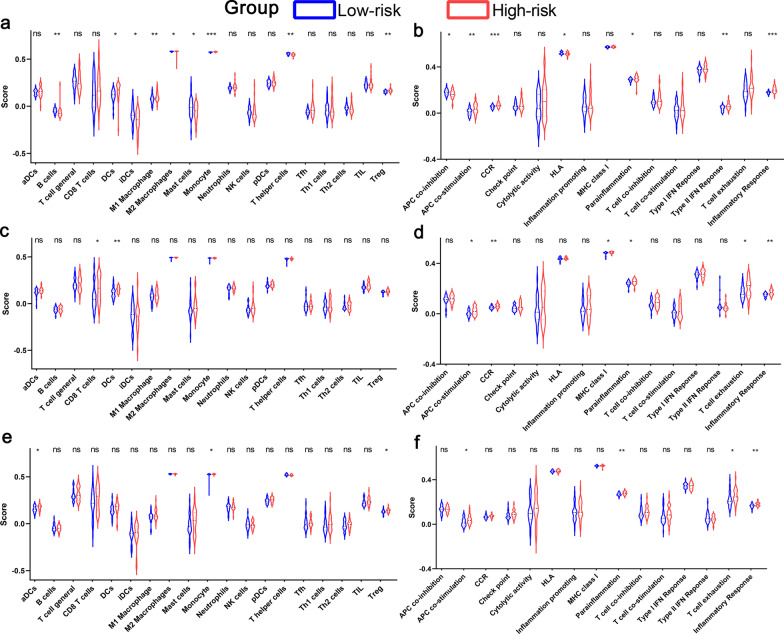
To further explore the potential association between immune status and the risk score, ssGSEA was applied to quantify the enrichment scores of diverse immune cell subpopulations, related functions or pathways in the three cohorts. The scores of APC (antigen presenting cell) co-stimulation, parainflammation and inflammatory response were significantly higher in the patients of high-risk group compared with patients of low-risk group in the three cohorts (Fig. 8).
Fig. 8.
Comparison of the ssGSEA scores between low-risk and high-risk groups in the Freiburg cohort (a, b), in the Siena validation cohort (c, d), and in the Leuven validation cohort (e, f). The scores of 19 immune cells (a, c, e) and 15 immune-related functions (b, d, f) are displayed in violin plots. DC, Dendritic Cell; TIL, Tumor infiltrates lymphocytes; CCR, cytokine-cytokine receptor. P values were showed as: ns, not significant; *, P < 0.05; **, P < 0.01; ***, P < 0.001
The signature for the diagnosis of IPF
Compared with controls, risk score was significantly higher in the patients with IPF (P < 0.001, Additional file 6: Figure S6a). Based on the ROC curve analysis, the optimal cut-off value (9.148) of risk factor might have potential values in helping clinicians to identify patients with IPF, with a sensitivity of 90.3% and a specificity of 85.0% (AUC: 0.925, 95% CI 0.861–0.989; P < 0.001, Additional file 6: Figure S6b). According to ssGSEA, the dysfunction of immune response may be observed in the patients with IPF (Additional file 6: Figure S6c, d).
Discussion
IPF is a chronic and serious lung disease. Lung tissue-based molecular genomic models [29, 30] have been found to be correlated with prognosis in patients with IPF. However, the procedure of lung biopsy is dangerous, which limits the applicability of such genomic signatures. The BAL cells gather on the outer surface of the alveoli and are usually collected by bronchoscope, and their gene expression is predictive of survival in IPF [9]. Therefore, the construction of the multi-gene signature of BAL cells is very important for the prediction of prognosis in patients with IPF. In this study, 51 ferroptosis-related DEGs were identified in IPF samples compared to normal controls in the Freiburg cohort from GSE70866 dataset, and 19 DEGs of them were associated with poor prognosis of IPF. We constructed a novel prognostic model integrating 8 ferroptosis-related DEGs and validated it in two external cohorts. In addition, the ROC curve confirmed the predictive value of risk score for prognosis. Functional analyses showed that inflammation- and immune-related pathways were enriched. Furthermore, according to DCA, using risk score or combination of risk score and GAP got more benefit compared with GAP only, suggesting that the 8-ferroptosis-related genes model can improve making clinical decisions to some extent.
Although several previous studies [15, 31] have suggested that a few genes might regulate ferroptosis in IPF, their relevance to survival in IPF patients is still largely unknown. Oxidative stress is thought to be involved in the development of alveolar damage, inflammation and fibrosis [32]. It has been found that in patients with IPF, lipid peroxidation and DNA oxidation are increased while antioxidant markers such as glutathione and Haem oxygenase (HO)-1 are reduced [12, 17]. We speculated that an imbalance of oxidants and antioxidants in the organism leads to increased production of ROS and altered iron homeostasis, which triggers ferroptosis characterized by iron-accumulation and participates in the progress of IPF. In this study, the 8-ferroptosis-related genes signature was associated not only with the diagnosis but also with the prognosis of IPF, which suggested that ferroptosis might participate the development and progression of IPF.
The prognostic model proposed in this study was consisted of 8 ferroptosis-related genes (NRAS, EMP1, SLC40A1, MYC, ANGPTL4, PRKCA, MUC1, GABARAPL1). In the current study, seven of the genes (NRAS, EMP1, SLC40A1, MYC, ANGPTL4, PRKCA, MUC1) in the prognostic model were up-regulated, while GABARAPL1 was down-regulated. Furthermore, these genes could be roughly divided into four categories, including inflammation or immune response (NRAS, PRKCA, MYC, SLC40A1), protein binding (GABARAPL1, EMP1), p53 binding (MUC1), angiogenesis (ANGPTL4) according to DAVID (http://david.abcc.ncifcrf.gov/) [33]. In terms of inflammation or immune response, the activation of PRKCA is involved in a calcium-mediated process participating in cystic fibrosis [34]. NRAS encodes GTPases involved in cell growth, proliferation and differentiation, and its protein products lead to downstream signaling events [35, 36]. MYC may promote the exacerbation of pulmonary fibrosis according to immune regulation [37, 38], and be a key gene according to the interaction network. MYC produces c-myc proto-oncoprotein, which acts down-stream of multiple growth factor signaling pathways, and MYC amplification was significantly associated with squamous cell lung carcinoma (SCC) in IPF patients [38]. SLC40A1 encodes Ferroportin which has an important role in the hypoferremic response to inflammation [39, 40]. P53 was considered to a novel regulatory factor in the process of ferroptosis with the dual effects on ferroptosis through transcriptional or post-translational mechanism [15, 41]. MUC1 may participate in the ferroptosis regulation by influencing p53 expression. ANGPTL4 (an angiopoietin-like protein belonging to a superfamily of secreted proteins) is involved in angiogenesis, which could be related to the development of pulmonary fibrosis [42]. A study [43] found that EMP1 could mediate cell density-regulated ferroptosis. GABARAP family members are involved in autophagosome maturation, and compared to normal tissues, the reduced expression of GABARAPL1 has been reported in various cancer cell lines [44]. The link between these results and ours remains to be determined, which need further study for the verification.
Although the underlying mechanisms of pulmonary diseases susceptibility to ferroptosis have been an intense research area in the past few years, the potential regulatory mechanism between IPF immunity and ferroptosis is still elusive. Based on the DEGs between different risk groups, functional enrichment analysis was performed, and we discovered that the inflammation- and immune-related pathways were enriched. Actually, inflammation- and immune-related pathways play vital role in the development of IPF, and immune processes can coordinate existing fibrotic responses [30, 45]. Interestingly, in this study, there was a significant difference in the process of antigen presentation between the low-risk group and the high-risk group. One possible theory is that ferroptosis cells emit different signals to attract antigen-presenting cells (APCs) to the site where cells die of ferroptosis [46]. Importantly, the pathogenesis of IPF is accompanied by a mass proliferation of macrophages. By changing phenotypes, such as classic activated macrophages (M1) and alternative activated macrophages (M2), macrophages participate in the pathogenesis of IPF and maintain the homeostasis of the lung environment [47]. In the Freiburg cohort, significant differences in M1 macrophages and M2 macrophages were observed between the low-risk group and high-risk group, however, there were no significant difference in the Leuven cohort and Siena cohort, which may be caused by the differences of patients or groups. In addition, higher risk scores were associated with impaired immune function, including the activity of the type II IFN response and T cell exhaustion as well as the fractions of Treg cells. Therefore, weakened immunity of high-risk patients may be a reason for their poor prognosis.
There are some limitations in this study. First, the model was constructed and validated based on the retrospective data from GEO, and the samples of every cohort were relatively small. A larger-sample prospective studies are needed to test its clinical application. Second, the inherent disadvantage of building a prediction model by considering only a single feature is inevitable. Many important prognostic genes in IPF might have been excluded. Third, clinical parameters such as lung function, treatment measures, underlying diseases and so on were absent in the datasets, thereby, the represent mean of the signature was limited. Forth, the treatment of patients with IPF was unknown in the three cohorts, which may affect outcome. Finally, it should be stressed that the relations between the risk score and immune activity have not yet been addressed in experiments.
Conclusion
In conclusion, this study established a novel prognostic signature of 8 ferroptosis-related genes. The risk score might be an effective model to predict the poor prognosis of IPF. In addition, the potential mechanisms between prognosis and inflammation- and immune-related response in IPF remain poorly understood, which needs further investigation.
Supplementary Information
Additional file 1: Figure S1. Construction of an 8-gene signature model in the Freiburg cohort. (a) LASSO coefficient profiles of the expression of 19 prognostic DEGs. (b) Selection of the penalty parameter (λ) in the LASSO model via 10-fold cross-validation.
Additional file 2: Figure S2. Survival analyses based on the optimal cut-off expression value of each gene in the Freiburg cohort. (a) NRAS. (b) EMP1. (c)SLC40A1. (d) MYC. (e) ANGPTL4. (f) PRKCA. (g) MUC1. (h) GABARAPL1.
Additional file 3: Figure S3. DCA for the survival prediction model of IPF in the Freiburg cohorts (a), Siena cohort (b), and Leuven cohort (c).
Additional file 4: Figure S4. Survival analyses based on the optimal cut-off expression value of each gene in the Siena validation cohort. (a) NRAS. (b) EMP1. (c)SLC40A1. (d) MYC. (e) ANGPTL4. (f) PRKCA. (g) MUC1. (h) GABARAPL1.
Additional file 5: Figure S5. Survival analyses based on the optimal cut-off expression value of each gene in the Leuven validation cohort. (a) NRAS. (b) EMP1. (c)SLC40A1. (d) MYC. (e) ANGPTL4. (f) PRKCA. (g) MUC1. (h) GABARAPL1.
Additional file 6: Figure S6. Comparison of the risk score between normal people and patients with IPF in the Freiburg cohort (a). Receiver operating characteristic (ROC) curve of the risk score for predictive value of IPF (b). Comparison of the ssGSEA scores between normal people and IPF patients in the Freiburg cohort (c, d). DC, Dendritic Cell; TIL, Tumor infiltrates lymphocytes; CCR, cytokine-cytokine receptor. P values were showed as: ns, not significant; *, P< 0.05; **, P< 0.01; ***, P< 0.001.
Additional file 7: Table S1. The 293 ferroptosis-related genes used in the study.
Additional file 8: Table S2. The annotated gene set file used in ssGSEA.
Acknowledgements
Not applicable.
Abbreviations
- IPF
Idiopathic pulmonary fibrosis
- DEGs
Differentially expressed genes
- LASSO
Least absolute shrinkage and selection operator
- ROC
Receiver operating characteristic
- GEO
Gene Expression Omnibus
- PCA
Principal component analysis
- RCD
Regulated cell death
- ROS
Reactive oxygen species
- t-SNE
T-distributed stochastic neighbor embedding
- DCA
Decision curve analysis
- GO
Gene ontology
- KEGG
Kyoto Encyclopedia of Genes and Genomes
- SD
Standard deviation
- IQR
Interquartile range
- HR
Hazard ratio
- AUC
Area under the curves
- MF
Molecular function
- BP
Biological processes
- CC
Cellular component
- BAL
Bronchoalveolar lavage
Authors' contributions
MHW, DPY and YY performed data analysis. YWH and YS performed data collection, prepared the first manuscript draft, validated data collection, refined the research idea, performed data analysis and edited manuscripts. YPL developed the research idea, performed data collection, validated data collection, prepared the first manuscript draft, refined the research idea, and edited manuscripts. HC and SWN refined the research idea, validated data collection and edited manuscripts. All authors read and approved the final manuscript. HC and SWN are the guarantors of the manuscript. All authors read and approved the final manuscript.
Funding
Not applicable.
Availability of data and materials
The datasets used and/or analyzed in the current study are available in the GEO repository, https://doi.org/10.1164/rccm.201712-2551OC [9].
Declarations
Ethics approval and consent to participate
Not applicable.
Consent for publication
Not applicable.
Competing interests
The authors declare that they have no competing interests.
Footnotes
Publisher's Note
Springer Nature remains neutral with regard to jurisdictional claims in published maps and institutional affiliations.
Yaowu He, Yu Shang and Yupeng Li have contributed equally to this article
Contributor Information
Shangwei Ning, Email: ningsw@ems.hrbmu.edu.cn.
Hong Chen, Email: chenhong744563@aliyun.com.
References
- 1.King TE, Pardo A, Selman M. Idiopathic pulmonary fibrosis. Lancet. 2011;378(9807):1949–1961. doi: 10.1016/S0140-6736(11)60052-4. [DOI] [PubMed] [Google Scholar]
- 2.Raghu G, Collard HR, Egan JJ, Martinez FJ, Behr J, Brown KK, et al. An official ATS/ERS/JRS/ALAT statement: idiopathic pulmonary fibrosis: evidence-based guidelines for diagnosis and management. Am J Respir Crit Care Med. 2011;183(6):788–824. doi: 10.1164/rccm.2009-040GL. [DOI] [PMC free article] [PubMed] [Google Scholar]
- 3.Raghu G, Chen SY, Hou Q, Yeh WS, Collard HR. Incidence and prevalence of idiopathic pulmonary fibrosis in US adults 18–64 years old. Eur Respir J. 2016;48(1):179–186. doi: 10.1183/13993003.01653-2015. [DOI] [PubMed] [Google Scholar]
- 4.King TE, Bradford WZ, Castro-Bernardini S, Fagan EA, Glaspole I, Glassberg MK, et al. A phase 3 trial of pirfenidone in patients with idiopathic pulmonary fibrosis. N Engl J Med. 2014;370(22):2083–2092. doi: 10.1056/NEJMoa1402582. [DOI] [PubMed] [Google Scholar]
- 5.Lederer DJ, Martinez FJ. Idiopathic pulmonary fibrosis. N Engl J Med. 2018;378(19):1811–1823. doi: 10.1056/NEJMra1705751. [DOI] [PubMed] [Google Scholar]
- 6.King TE, Albera C, Bradford WZ, Costabel U, du Bois RM, Leff JA, et al. All-cause mortality rate in patients with idiopathic pulmonary fibrosis. Implications for the design and execution of clinical trials. Am J Respir Crit Care Med. 2014;189(7):825–831. doi: 10.1164/rccm.201311-1951OC. [DOI] [PubMed] [Google Scholar]
- 7.King TE, Jr, Tooze JA, Schwarz MI, Brown KR, Cherniack RM. Predicting survival in idiopathic pulmonary fibrosis: scoring system and survival model. Am J Respir Crit Care Med. 2001;164(7):1171–1181. doi: 10.1164/ajrccm.164.7.2003140. [DOI] [PubMed] [Google Scholar]
- 8.Navaratnam V, Fleming KM, West J, Smith CJ, Jenkins RG, Fogarty A, et al. The rising incidence of idiopathic pulmonary fibrosis in the UK. Thorax. 2011;66(6):462–467. doi: 10.1136/thx.2010.148031. [DOI] [PubMed] [Google Scholar]
- 9.Prasse A, Binder H, Schupp JC, Kayser G, Bargagli E, Jaeger B, et al. BAL cell gene expression is indicative of outcome and airway basal cell involvement in idiopathic Pul monary fibrosis. Am J Respir Crit Care Med. 2019;199(5):622–630. doi: 10.1164/rccm.201712-2551OC. [DOI] [PMC free article] [PubMed] [Google Scholar]
- 10.Xia Y, Lei C, Yang D, Luo H. Construction and validation of a bronchoalveolar lavage cell-associated gene signature for prognosis prediction in idiopathic pulmonary fibrosis. Int Immunopharmacol. 2021;92:107369. doi: 10.1016/j.intimp.2021.107369. [DOI] [PubMed] [Google Scholar]
- 11.Dixon SJ, Lemberg KM, Lamprecht MR, Skouta R, Zaitsev EM, Gleason CE, et al. Ferroptosis: an iron-dependent form of nonapoptotic cell death. Cell. 2012;149(5):1060–1072. doi: 10.1016/j.cell.2012.03.042. [DOI] [PMC free article] [PubMed] [Google Scholar]
- 12.Cameli P, Carleo A, Bergantini L, Landi C, Prasse A, Bargagli E. Oxidant/antioxidant disequilibrium in idiopathic pulmonary fibrosis pathogenesis. Inflammation. 2020;43(1):1–7. doi: 10.1007/s10753-019-01059-1. [DOI] [PubMed] [Google Scholar]
- 13.Wang L, Zhang Z, Li M, Wang F, Jia Y, Zhang F, et al. P53-dependent induction of ferroptosis is required for artemether to alleviate carbon tetrachloride-induced liver fibrosis and hepatic stellate cell activation. IUBMB Life. 2019;71(1):45–56. doi: 10.1002/iub.1895. [DOI] [PubMed] [Google Scholar]
- 14.Fang X, Wang H, Han D, Xie E, Yang X, Wei J, et al. Ferroptosis as a target for protection against cardiomyopathy. Proc Natl Acad Sci USA. 2019;116(7):2672–2680. doi: 10.1073/pnas.1821022116. [DOI] [PMC free article] [PubMed] [Google Scholar]
- 15.Tao N, Li K, Liu J. Molecular mechanisms of ferroptosis and its role in pulmonary disease. Oxid Med Cell Longev. 2020;2020:9547127. doi: 10.1155/2020/9547127. [DOI] [PMC free article] [PubMed] [Google Scholar]
- 16.Li X, Zhuang X, Qiao T. Role of ferroptosis in the process of acute radiation-induced lung injury in mice. Biochem Biophys Res Commun. 2019;519(2):240–245. doi: 10.1016/j.bbrc.2019.08.165. [DOI] [PubMed] [Google Scholar]
- 17.Paliogiannis P, Fois AG, Collu C, Bandinu A, Zinellu E, Carru C, et al. Oxidative stress-linked biomarkers in idiopathic pulmonary fibrosis: a systematic review and meta-analysis. Biomark Med. 2018;12(10):1175–1184. doi: 10.2217/bmm-2018-0108. [DOI] [PubMed] [Google Scholar]
- 18.Yatmark P, Morales NP, Chaisri U, Wichaiyo S, Hemstapat W, Srichairatanakool S, et al. Effects of iron chelators on pulmonary iron overload and oxidative stress in beta-thalassemic mice. Pharmacology. 2015;96(3–4):192–199. doi: 10.1159/000438994. [DOI] [PubMed] [Google Scholar]
- 19.American Thoracic Society Idiopathic pulmonary fibrosis: diagnosis and treatment. International consensus statement, American Thoracic Society (ATS), and the European Respiratory Society (ERS) Am J Respir Crit Care Med. 2000;161(2):646–664. doi: 10.1164/ajrccm.161.2.ats3-00. [DOI] [PubMed] [Google Scholar]
- 20.American Thoracic S, European Respiratory S. American Thoracic Society/European Respiratory Society International Multidisciplinary Consensus Classification of the Idiopathic Interstitial Pneumonias. This joint statement of the American Thoracic Society (ATS), and the European Respiratory Society (ERS) was adopted by the ATS board of directors, June 2001 and by the ERS Executive Committee, June 2001. Am J Respir Crit Care Med. 2002;165(2):277–304. [DOI] [PubMed]
- 21.Ritchie ME, Phipson B, Wu D, Hu Y, Law CW, Shi W, et al. limma powers differential expression analyses for RNA-sequencing and microarray studies. Nucleic Acids Res. 2015;43(7):e47. doi: 10.1093/nar/gkv007. [DOI] [PMC free article] [PubMed] [Google Scholar]
- 22.Szklarczyk D, Franceschini A, Kuhn M, Simonovic M, Roth A, Minguez P, et al. The STRING database in 2011: functional interaction networks of proteins, globally integrated and scored. Nucleic Acids Res. 2011;39(Database issue):D561–D568. doi: 10.1093/nar/gkq973. [DOI] [PMC free article] [PubMed] [Google Scholar]
- 23.Simon N, Friedman J, Hastie T, Tibshirani R. Regularization paths for Cox's proportional hazards model via coordinate descent. J Stat Softw. 2011;39(5):1–13. doi: 10.18637/jss.v039.i05. [DOI] [PMC free article] [PubMed] [Google Scholar]
- 24.Tibshirani R. The lasso method for variable selection in the Cox model. Stat Med. 1997;16(4):385–395. doi: 10.1002/(sici)1097-0258(19970228)16:4<385::aid-sim380>3.0.co;2-3. [DOI] [PubMed] [Google Scholar]
- 25.Vickers AJ, Elkin EB. Decision curve analysis: a novel method for evaluating prediction models. Med Decis Making. 2006;26(6):565–574. doi: 10.1177/0272989X06295361. [DOI] [PMC free article] [PubMed] [Google Scholar]
- 26.Yu G, Wang LG, Han Y, He QY. clusterProfiler: an R package for comparing biological themes among gene clusters. OMICS. 2012;16(5):284–287. doi: 10.1089/omi.2011.0118. [DOI] [PMC free article] [PubMed] [Google Scholar]
- 27.Li Y, Chen S, Li X, Wang X, Li H, Ning S, et al. CD247, a potential T cell-derived disease severity and prognostic biomarker in patients with idiopathic pulmonary fibrosis. Front Immunol. 2021;12:762594. doi: 10.3389/fimmu.2021.762594. [DOI] [PMC free article] [PubMed] [Google Scholar]
- 28.Hanzelmann S, Castelo R, Guinney J. GSVA: gene set variation analysis for microarray and RNA-seq data. BMC Bioinform. 2013;14:7. doi: 10.1186/1471-2105-14-7. [DOI] [PMC free article] [PubMed] [Google Scholar]
- 29.Boon K, Bailey NW, Yang J, Steel MP, Groshong S, Kervitsky D, et al. Molecular phenotypes distinguish patients with relatively stable from progressive idiopathic pulmonary fibrosis (IPF) PLoS ONE. 2009;4(4):e5134. doi: 10.1371/journal.pone.0005134. [DOI] [PMC free article] [PubMed] [Google Scholar]
- 30.Desai O, Winkler J, Minasyan M, Herzog EL. The role of immune and inflammatory cells in idiopathic pulmonary fibrosis. Front Med. 2018;5:43. doi: 10.3389/fmed.2018.00043. [DOI] [PMC free article] [PubMed] [Google Scholar]
- 31.Minagawa S, Yoshida M, Araya J, Hara H, Imai H, Kuwano K. Regulated necrosis in pulmonary disease. A focus on necroptosis and ferroptosis. Am J Respir Cell Mol Biol. 2020;62(5):554–562. doi: 10.1165/rcmb.2019-0337TR. [DOI] [PubMed] [Google Scholar]
- 32.Cameli P, Bergantini L, Salvini M, Refini RM, Pieroni M, Bargagli E, et al. Alveolar concentration of nitric oxide as a prognostic biomarker in idiopathic pulmonary fibrosis. Nitric Oxide. 2019;89:41–45. doi: 10.1016/j.niox.2019.05.001. [DOI] [PubMed] [Google Scholar]
- 33.da Huang W, Sherman BT, Lempicki RA. Bioinformatics enrichment tools: paths toward the comprehensive functional analysis of large gene lists. Nucleic Acids Res. 2009;37(1):1–13. doi: 10.1093/nar/gkn923. [DOI] [PMC free article] [PubMed] [Google Scholar]
- 34.Averna M, Bavestrello M, Cresta F, Pedrazzi M, De Tullio R, Minicucci L, et al. Abnormal activation of calpain and protein kinase C¦Á promotes a constitutive release of matrix metall oproteinase 9 in peripheral blood mononuclear cells from cystic fibrosis patients. Arch Biochem Biophys. 2016;604:103–112. doi: 10.1016/j.abb.2016.06.015. [DOI] [PubMed] [Google Scholar]
- 35.Hancock JF. Ras proteins: different signals from different locations. Nat Rev Mol Cell Biol. 2003;4(5):373–384. doi: 10.1038/nrm1105. [DOI] [PubMed] [Google Scholar]
- 36.Pylayeva-Gupta Y, Grabocka E, Bar-Sagi D. RAS oncogenes: weaving a tumorigenic web. Nat Rev Cancer. 2011;11(11):761–774. doi: 10.1038/nrc3106. [DOI] [PMC free article] [PubMed] [Google Scholar]
- 37.Xiao T, Zou Z, Xue J, Syed BM, Sun J, Dai X, et al. LncRNA H19-mediated M2 polarization of macrophages promotes myofibroblast differentiation in pulmonary fibrosis induced by arsenic exposure. Environ Pollut. 2021;268(Pt A):115810. doi: 10.1016/j.envpol.2020.115810. [DOI] [PubMed] [Google Scholar]
- 38.Hata A, Nakajima T, Matsusaka K, Fukuyo M, Nakayama M, Morimoto J, et al. Genetic alterations in squamous cell lung cancer associated with idiopathic pulmonary fibrosis. Int J Cancer. 2021;148(12):3008–3018. doi: 10.1002/ijc.33499. [DOI] [PubMed] [Google Scholar]
- 39.Masaisa F, Breman C, Gahutu JB, Mukiibi J, Delanghe J, Philipp J. Ferroportin (SLC40A1) Q248H mutation is associated with lower circulating serum hepcidin levels in Rw andese HIV-positive women. Ann Hematol. 2012;91(6):911–916. doi: 10.1007/s00277-011-1400-3. [DOI] [PubMed] [Google Scholar]
- 40.Ludwiczek S, Aigner E, Theurl I, Weiss G. Cytokine-mediated regulation of iron transport in human monocytic cells. Blood. 2003;101(10):4148–4154. doi: 10.1182/blood-2002-08-2459. [DOI] [PubMed] [Google Scholar]
- 41.Jiang L, Kon N, Li T, Wang SJ, Su T, Hibshoosh H, et al. Ferroptosis as a p53-mediated activity during tumour suppression. Nature. 2015;520(7545):57–62. doi: 10.1038/nature14344. [DOI] [PMC free article] [PubMed] [Google Scholar]
- 42.Saito M, Mitani A, Ishimori T, Miyashita N, Isago H, Mikami Y, et al. Active mTOR in lung epithelium promotes epithelial-mesenchymal transition and enhances lung fibrosis. Am J Respir Cell Mol Biol. 2020;62(6):699–708. doi: 10.1165/rcmb.2019-0255OC. [DOI] [PubMed] [Google Scholar]
- 43.Yang WH, Ding CC, Sun T, Rupprecht G, Lin CC, Hsu D, et al. The hippo pathway effector TAZ regulates ferroptosis in renal cell carcinoma. Cell Rep. 2019;28(10):2501–8.e4. doi: 10.1016/j.celrep.2019.07.107. [DOI] [PMC free article] [PubMed] [Google Scholar]
- 44.Nemos C, Mansuy V, Vernier-Magnin S, Fraichard A, Jouvenot M, Delage-Mourroux R. Expression of gec1/GABARAPL1 versus GABARAP mRNAs in human: predominance of gec1/GABARAPL1 in the central nervous system. Brain Res Mol Brain Res. 2003;119(2):216–219. doi: 10.1016/j.molbrainres.2003.09.011. [DOI] [PubMed] [Google Scholar]
- 45.Duitman J, van den Ende T, Spek CA. Immune checkpoints as promising targets for the treatment of idiopathic pulmonary fibrosis? J Clin Med. 2019;8(10):7586. doi: 10.3390/jcm8101547. [DOI] [PMC free article] [PubMed] [Google Scholar]
- 46.Friedmann Angeli JP, Krysko DV, Conrad M. Ferroptosis at the crossroads of cancer-acquired drug resistance and immune evasion. Nat Rev Cancer. 2019;19(7):405–414. doi: 10.1038/s41568-019-0149-1. [DOI] [PubMed] [Google Scholar]
- 47.Qu Y, Hao C, Zhai R, Yao W. Folate and macrophage folate receptor in idiopathic pulmonary fibrosis disease: the potential therapeutic target? Biomed Pharmacother. 2020;131:110711. doi: 10.1016/j.biopha.2020.110711. [DOI] [PubMed] [Google Scholar]
Associated Data
This section collects any data citations, data availability statements, or supplementary materials included in this article.
Supplementary Materials
Additional file 1: Figure S1. Construction of an 8-gene signature model in the Freiburg cohort. (a) LASSO coefficient profiles of the expression of 19 prognostic DEGs. (b) Selection of the penalty parameter (λ) in the LASSO model via 10-fold cross-validation.
Additional file 2: Figure S2. Survival analyses based on the optimal cut-off expression value of each gene in the Freiburg cohort. (a) NRAS. (b) EMP1. (c)SLC40A1. (d) MYC. (e) ANGPTL4. (f) PRKCA. (g) MUC1. (h) GABARAPL1.
Additional file 3: Figure S3. DCA for the survival prediction model of IPF in the Freiburg cohorts (a), Siena cohort (b), and Leuven cohort (c).
Additional file 4: Figure S4. Survival analyses based on the optimal cut-off expression value of each gene in the Siena validation cohort. (a) NRAS. (b) EMP1. (c)SLC40A1. (d) MYC. (e) ANGPTL4. (f) PRKCA. (g) MUC1. (h) GABARAPL1.
Additional file 5: Figure S5. Survival analyses based on the optimal cut-off expression value of each gene in the Leuven validation cohort. (a) NRAS. (b) EMP1. (c)SLC40A1. (d) MYC. (e) ANGPTL4. (f) PRKCA. (g) MUC1. (h) GABARAPL1.
Additional file 6: Figure S6. Comparison of the risk score between normal people and patients with IPF in the Freiburg cohort (a). Receiver operating characteristic (ROC) curve of the risk score for predictive value of IPF (b). Comparison of the ssGSEA scores between normal people and IPF patients in the Freiburg cohort (c, d). DC, Dendritic Cell; TIL, Tumor infiltrates lymphocytes; CCR, cytokine-cytokine receptor. P values were showed as: ns, not significant; *, P< 0.05; **, P< 0.01; ***, P< 0.001.
Additional file 7: Table S1. The 293 ferroptosis-related genes used in the study.
Additional file 8: Table S2. The annotated gene set file used in ssGSEA.
Data Availability Statement
The datasets used and/or analyzed in the current study are available in the GEO repository, https://doi.org/10.1164/rccm.201712-2551OC [9].


