

Significance Statement
Renal blood filtration occurs in a functional unit called the glomerulus. The filtration barrier comprises resident cell types, i.e., podocytes, mesangial cells, and glomerular endothelial cells. We introduce a glomerular cell isolation protocol that separates these three cell types at a sufficient quantity and purity to allow for detailed protein-biochemical investigations. We demonstrate that the expression of fluorescent transgenes in glomerular cells can result in proteome artifacts, and that different mouse strains have different glomerular cell type proteomes. Further, we demonstrate the power of this globally applicable technique to identify new proteins enriched in glomerular cells and to dissect cell-specific disease responses and crosstalk between different intraglomerular cell types.
Keywords: glomerular endothelial cells, mesangial cells, podocyte, membranous nephropathy, glomerular filtration barrier, glomerulonephritis, cell biology and structure, THSD7A, slit diaphragm, timMEP
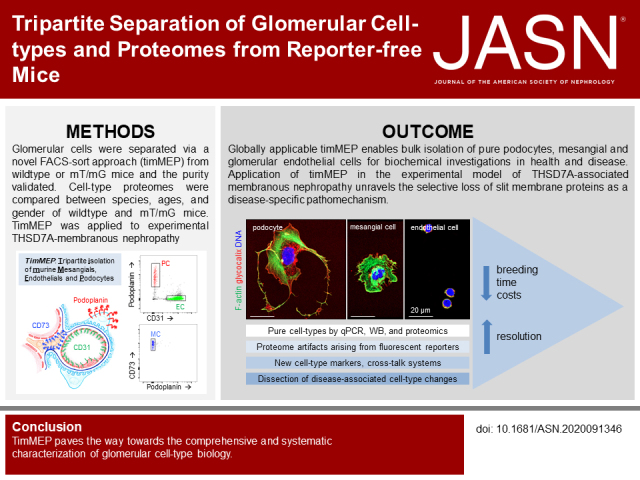
Visual Abstract
Abstract
Background
The glomerulus comprises podocytes, mesangial cells, and endothelial cells, which jointly determine glomerular filtration. Understanding this intricate functional unit beyond the transcriptome requires bulk isolation of these cell types for biochemical investigations. We developed a globally applicable tripartite isolation method for murine mesangial and endothelial cells and podocytes (timMEP).
Methods
We separated glomerular cell types from wild-type or mT/mG mice via a novel FACS approach, and validated their purity. Cell type proteomes were compared between strains, ages, and sex. We applied timMEP to the podocyte-targeting, immunologic, THSD7A-associated, model of membranous nephropathy.
Results
timMEP enabled protein-biochemical analyses of podocytes, mesangial cells, and endothelial cells derived from reporter-free mice, and allowed for the characterization of podocyte, endothelial, and mesangial proteomes of individual mice. We identified marker proteins for mesangial and endothelial proteins, and outlined protein-based, potential communication networks and phosphorylation patterns. The analysis detected cell type–specific proteome differences between mouse strains and alterations depending on sex, age, and transgene. After exposure to anti-THSD7A antibodies, timMEP resolved a fine-tuned initial stress response, chiefly in podocytes, that could not be detected by bulk glomerular analyses. The combination of proteomics with super-resolution imaging revealed a specific loss of slit diaphragm, but not of other foot process proteins, unraveling a protein-based mechanism of podocyte injury in this animal model.
Conclusion
timMEP enables glomerular cell type–resolved investigations at the transcriptional and protein-biochemical level in health and disease, while avoiding reporter-based artifacts, paving the way toward the comprehensive and systematic characterization of glomerular cell biology.
The glomerular filtration barrier (GFB) represents a sophisticated syncytium of individual cell types, i.e., podocytes, mesangial cells, and glomerular endothelial cells, which sustain the structure and regulate the function of the filtration barrier.1 Podocytes embrace the glomerular capillaries and form an intricate mesh with their interdigitating processes that are interconnected by a modified form of an adherens junction, the slit diaphragm, which ultimately bridges the filtration slits. The intraglomerular mesangial cells are situated in close contact with the endothelial cells and represent a specialized form of pericytes that provide structural support. The fenestrated endothelial cells line the glomerular capillaries and reside opposite the podocytes, separated by the glomerular basement membrane (GBM). Malfunction of any of these cell types leads to a loss of glomerular function and proteinuria, leading to the concept that these glomerular cell types interact,2 a finding also supported in silico by single-cell transcriptomic studies. However, limitations of single-cell approaches include the lack of depth of transcriptomes and the difficulty in subjecting single cells to biochemical applications to analyze their function. Therefore, analysis of glomerular injury would also benefit from the bulk isolation of all three cell types from the glomeruli of individual mice for subsequent protein-biochemical investigations.
The establishment of a globally applicable, large-scale method to isolate glomeruli from mice, using magnetic beads,3 revolutionized our understanding of glomerular injury pathways. Later, a FACS-based method to isolate podocytes from mice was developed, which has further enhanced the cellular resolution of glomerular injury patterns, but with an isolated focus on podocytes.4–6 This technique relies on the use of mT/mG mice that exhibit a transgenic, intracellular expression of enhanced green fluorescent protein (eGFP) in podocytes, and of tdTomato in nonpodocytes, under control of a Cre promotor7 or other genetically encoded reporters.8 However, this method has significant limitations. First, before podocyte isolation, the mouse models of interest are required to be crossed to mT/mG mice, resulting in costly, time-, and mouse-consuming breeding, with the risk of genetic background changes that are often accompanied by a change in susceptibility to established injury models. Further, only podocytes are isolated from the mouse, the other glomerular cells are indistinguishable from each other through the expression of tdTomato. These limitations are particularly important in diseases with altered glomerular composition, such as podocyte loss or mesangial expansion.
The aim of this study was to develop a (1) globally applicable, and (2) economic (in terms of cost, time, and mice) isolation protocol of all three glomerular cell types, from an individual mouse, in sufficient amounts and at a sufficient purity to enable physiologic, pathophysiologic, protein-biochemical, and omics investigations of in vivo mouse models. This glomerular cell isolation technique adds a new level of biochemical resolution of glomerular cell types that is not possible using single-cell technologies, spatial transcriptomics, or spatial proteomics.
Methods
Animals
Male and female C57BL/6 mice and BALB/c mice were purchased from Charles River (Sulzfeld, Germany) at the age of 10–14 weeks. mT/mG mice (ICR;Sv129/J;C57BL/6)5 were provided by T.B.H. (III Medical Clinic, University Medical Center Hamburg-Eppendorf, Hamburg, Germany). Mice had free access to water and standard chow, were synchronized to a 12-hour light/dark cycle, and euthanized by cervical dissection for kidney removal. Anti-THSD7A membranous nephropathy (MN) was induced by intravenous injection of 180 µl (1,4 mg per 30 g mouse) rabbit anti-THSD7A antibodies, or unspecific rabbit IgG as control, in male BALB/c mice aged 12–22 weeks.9 Urine was collected after spontaneous urination on day 1 and 7 before euthanasia. Cells isolated via the tripartite isolation method for murine mesangial and endothelial cells and podocytes (timMEP) were analyzed by quantitative PCR (qPCR; days 1 and 7) and by proteomics (day 7).
Measurement of Proteinuria
Urine samples were collected over 3–5 hours in a metabolic cage with free access to water. Urinary albumin content was quantified using a commercially available ELISA system (Bethyl) according to the manufacturer’s instructions, using an ELISA plate reader (BioTek), as described.10 Albumin levels were standardized against urine creatinine values, determined according to the Jaffe method, for the same individuals.
Glomerular Cell Isolation
Kidneys were harvested, perfused with magnetic DynaBeads, and glomeruli were isolated as previously described.3 We then isolated podocytes, mesangial cells, and endothelial cells (a detailed protocol is provided in Supplemental Appendix 1). In brief, collected and pelleted, decapsulated glomeruli were dissolved in digestion buffer. The digestion buffer contained 1000 µg/ml Liberase TL (Roche), 100 U/ml DNase1 (Roche), 10% FCS, 1% insulin/transferrin/selenium, 1% penicillin/streptomycin, and 25 mM HEPES dissolved in 1× RPMI 1640 (Gibco). Cells were incubated for 2 hours at 37°C and 1400 rpm, and repeatedly, diversely, mechanically stressed by vortexing, shearing (with a 27-gauge needle), and pipetting (inspired by Boerries et al.5) using Pasteur and Eppendorf pipettes to promote maximum cellular separation. A DynaMag magnet was used to separate glomerular remnants and DynaBeads from single cells. After 5 minutes in the DynaMag, the single cell–containing supernatant was collected. Cells were pelleted (10 min, 4°C, 1000 × g) and washed once with magnetic cell sorting buffer (PBS with 0.5% BSA and 2 mM EDTA). After centrifugation, the supernatant was carefully removed to avoid any disturbance of the very fragile cell pellet. Subsequently, cells were stained with the cell-specific antibodies Podoplanin (podocytes), CD73 (mesangial cells), CD31 (endothelial cells), CD45 (leukocytes), and a LIVE/DEAD stain (Invitrogen), as listed in Supplemental Table 1. After incubation (30 minutes at 4°C in complete darkness), cells were washed once more, resuspended in magnetic cell sorting buffer, and sieved through 40-µm sieves into the FACS tubes. Cells for the native proteomic experiments were sorted using a FACSAria Fusion (BD Biosciences), applying the strategy shown in Supplemental Figure 1A. However, we then revised this strategy to compensate for slight and minor crosscontamination of podocytes in the mesangial cells, which became evident in this proteomic dataset (Supplemental Figures 1B and 2). We only recommend using the strategy shown in Figure 1D for sorting, which was used for all other depicted experiments (i.e., qPCR and proteomics of THSD7A-MN glomerular cells, cell culture, and Western blot).
Figure 1.

FACS strategy from wild-type and mT/mG mice for tripartite isolation of glomerular cell types allows bulk isolation of podocyte, mesangial and endothelial cells. (A) Scheme of a glomerular loop depicting the localization of the cell-specific markers used for the FACS strategy. (B) Confocal micrographs depicting labeled podocytes (pc; podoplanin, red), endothelial cells (ec; CD31, green), and mesangial cells (CD73, blue) in a 4% PFA fixed-frozen section of a murine kidney. DNA was visualized using Hoechst. (C) Gating strategy of glomerular single cells derived from an mT/mG mouse, demonstrating a distinct podocyte (eGFP+/tdTomato−, red), endothelial cell (tdTomato+/eGFP−/CD31+/CD73−, green), and mesangial cell (tdTomato+/eGFP−/CD73+/CD31−, blue) population. The unlabeled cells represent contaminating cells such as tubular cells. The left lower panel exhibits a representative high-resolution confocal image of the intrinsic GFP and tdTomato expression in an mT/mG glomerulus from an optically cleared kidney section. The histologic panel exhibits intrinsic GFP and tdTomato fluorescence of a glomerular capillary loop of an optically cleared 300-µm kidney slice. (D) Gating strategy of glomerular single cells isolated from a wild-type mouse exhibiting a distinct podocyte (PC; podoplanin+/CD73−/CD31−, red), endothelial cell (EC; CD31+/CD73−/podoplanin−, green), and mesangial cell (MC; CD73+/CD31−/podoplanin−, blue) population. The unlabeled cells represent contaminating cells such as tubular cells. FSC-A, forward scatter area; FSC-W, forward scatter width; SSC-A, side scatter area.
Sample Preparation and Mass Spectrometry Analysis
Cell pellets were snap frozen and stored at −80°C. For comparison of different strains, approximately 50,000 cells were analyzed. Cells were resuspended in 4% SDS and 10 mM Tris and heated at 95°C for 10 minutes. Then, solubilized proteins were reduced and alkylated using 5 mM dithiothreitol and 10 mM iodoacetate, respectively. Proteins were digested and prepared using the SP3 protocol, with modifications, as previously described.11,12 For deeper protein analysis, we obtained pellets of 1 million cells from mT/mG mice. These pellets were resuspended in 8 M urea and 5 mM Tris in liquid chromatography–mass spectrometry–grade water, sonicated for 1 minute using an ultrasonication pulse (0.1 second cycle, 10% strength), and spun down at 16000 × g at 4°C. Protein concentration (for 1 million cells) was determined using a commercial BCA assay (Thermo). Proteins were then reduced and alkylated as described above. Proteins were digested using a protease in-solution digestion protocol, with a modified SP3 protocol11,13 (50,000 cells), or in-solution digestion.14 We used trypsin for all digestion steps. Tryptic peptides were analyzed using a nanoscale liquid chromatography–tandem mass spectrometry hardware setup, consisting of a nanoflow LC (flow, 200 nl/min) coupled to an Orbitrap QExactive Plus tandem mass spectrometer. The peptides were separated using a gradient for reverse-phase separation, consisting of buffer A and buffer B, with ascending concentrations of buffer B (80% acetonitrile, 0.1% formic acid) over buffer A (0.1% formic acid). The peptides from 50,000 cells were separated using a 1 hour gradient. The peptides from 1 million cells were separated using a 2.5 hour gradient.
Bioinformatic Analysis
Protein raw files were searched using MaxQuant and the LFQ algorithm15,16 with searches against a UniProt mouse proteome reference database released in January 2018. Search criteria were alkylation on cysteines as a fixed modification, and amino-terminal acetylation and methionine oxidation as variable modifications. Default criteria were used, meaning that PSM, peptide, and protein false discovery rates (FDRs) were set at 0.01. The LFQ algorithm was enabled, and “match between run” was enabled. The data were analyzed using Perseus version 1.5.5.3, with filtering for the embedded annotations as contaminant, reverse, or proteins identified by site only. Only proteins in at least 60% of samples were retained, and missing values were imputed using default imputation parameters (downshift SD, 2; width, 0.3). Gene Ontology term and UniProt keyword annotation and enrichment were performed using the embedded terms.17 Radar plots were generated using the ggradar package (Rstudio; https://github.com/ricardo-bion/ggradar), with default settings. The generated .txt files have been shared (see Data Sharing Statement). Differentially expressed proteins were defined by ANOVA with an FDR-corrected P value of <0.01 to adjust for multiple testing. For these proteins, we defined criteria for the identification of new glomerular cell–enriched proteins as follows: (1) a log2 fold change of two between podocytes and nonpodocytes; (2) a negative search result in PubMed (https://www.ncbi.nlm.nih.gov/pubmed) with the keywords “protein of interest” and “podocyte” or “glomerular” or “renal” or “kidney,” “protein of interest” and “mesangium” or “mesangial” or “glomerular” or “renal” or “kidney,” and “protein of interest” and “endothelial” or “endothelium” or “glomerular” or “renal” or “kidney”; and (3) a validated cell-of-interest expression pattern in the human protein atlas (https://www.proteinatlas.org/search). From significantly enriched podocytes, protein-protein interaction networks were generated using STRINGdb18 and filtered for high confidence (>0.9) on the basis of experimental or database evidence only. Then, protein networks were imported into Cytoscape version 3.3,19 and all edges that were not between two different cell types and the associated nodes were removed.
Phosphorylation Patterns
To determine phosphorylation patterns, we used MaxQuant to search our raw spectral data against a mouse database, with phosphorylation as a variable modification, as previ ously described.20 Sequence windows of phosphorylation sites with a localization probability >0.8 were used for further analysis. Phosphorylation patterns were determined using Seq2Logo,21 using the Kullback–Leibler sequence logo type, Hobohm-1 clustering with a threshold of 0.63, and weight on prior set to 200.
qPCR Analysis
Total mRNA was extracted from FACS-sorted cells and isolated glomeruli using the NucleoSpin RNAII kit and NucleoSpin RNA Plus XS (both Macherey-Nagel), according to the manufacturer’s instructions, and was reverse transcribed with a random hexamer primer (Invitrogen) and RevertAid (Thermo Fisher). mRNA expression was quantified with QuantStudio 3 using SYBR green, as recently described.22 The exon-spanning primer pairs for murine cDNA are listed in Supplemental Table 2. 18S was used as an internal control to correct for small variations in RNA quality and cDNA synthesis. Amplicons of random samples for each primer pair were determined by automatic PCR sequencing to demonstrate the specificity of the PCR reaction (data not shown). ΔCT values were calculated using 18S as a housekeeping gene. ΔΔCT values were calculated as the difference between the glomerular and sorted cell ΔCT; relative expression (RE) is 2ΔΔCT. The RE of sorted cells are expressed as a percentage of the glomerular RE, which is calculated as follows: 100%×(cell RE/glomerular RE−1).
Immunoblotting
Immunoblots were performed from isolated glomerular cells or glomeruli from one mouse per lane. Samples were lysed in T-PER (Thermo Scientific) containing 1 mM sodium fluoride, 1 mM sodium vanadate, 1 mM calyculin A, and cOmplete Protease Inhibitor (Roche), and denatured in 5× SDS. Samples were separated on a 4%–12% Mini Protean TGX gel (Bio-Rad, Hercules, CA) in a Tris-glycine migration buffer (0.25 M Tris, 1.92 M glycine, 1% SDS, pH 8.3). Protein transfer was performed in transfer buffer (0.192 M glycine, 25 mM Tris base, 20% ethanol in double-distilled water) in a TransBlot Turbo System (Bio-Rad). After the transfer, all proteins were visualized by Ponceau S staining. Polyvinylidene difluoride membranes (Millipore) were blocked (5% nonfat milk) before incubation with primary antibodies diluted in SuperBlock blocking reagent (Thermo Scientific). We used the following primary antibodies: guinea pig anti-Nephrin (1:2000; Progen), rabbit anti–PDGFR-β (1:1000; Cell Signaling), rat anti–VE-Cadherin (1:1000; BD Biosciences), rabbit anti-THSD7A (1:1000; Atlas), rabbit anti-Synaptopodin (1:1000; Synaptic Systems), guinea pig anti-Neph1 (1:1000, gp2; made by T.B.H.), rabbit anti-Podocin (1:500; Sigma), rabbit anti–α-Actinin 4 (1:1000; Immunoglobe). Binding was detected by incubation with horseradish peroxidase–coupled secondary antibodies (1:10000, 5% nonfat milk). Protein expression was visualized using ECL SuperSignal (Thermo Scientific), according to the manufacturer’s instructions, on an Amersham Imager 600 (GE Healthcare, Little Chalfont, United Kingdom). We analyzed Western blots using software from ImageJ.23
Immunofluorescence
A kidney section (300 µm thick) from an mT/mG mouse was fixed with 4% paraformaldehyde (PFA; EMSciences) for 6 hours, washed with PBS, and optically cleared for 24 hours using SCALEVIEW-A2 (FUJIFILM Wako Chemicals). FACS-sorted glomerular cells were seeded on collagen type IV–coated (Sigma), 35-mm culture dishes (Sarstedt) for 24 hours, and fixed with 4% PFA for 8 minutes at room temperature (RT). For immunofluorescence, nonspecific binding was blocked with 5% normal horse serum (Vector) in PBS with 0.05% Triton X-100 (Sigma) for 30 minutes at RT. Subsequently, cells were stained with Alexa Fluor 488–phalloidin (1:400; Molecular Probes), rhodamine–Wheat germ agglutinin (WGA; 1:400; Vector), and Hoechst (1:1000; Molecular Probes) for 30 minutes at RT and then coverslips were applied using Fluoromount (SouthernBiotech). Paraffin sections (3 µm) were deparaffinized and rehydrated in water. Antigen retrieval was performed by cooking at a constant temperature of 98°C in DAKO (pH 9) or citrate (pH 6.1) buffer for 30 minutes. Frozen sections were dried and fixed with 4% PFA for 8 minutes at RT. Nonspecific binding in frozen and paraffin sections was blocked with 5% normal horse serum in 0.05% Triton X-100 for 30 minutes at RT. The following primary antibodies were incubated overnight in blocking buffer at 4°C: goat anti-THSD7A (1:200; Santa Cruz), Cy3 anti-mouse IgG, rat anti–ubiquitin carboxy-terminal hydrolase L1 (anti–UCH-L1; U104; 1:50),24 guinea pig anti-Nephrin (1:200; Acris), PE-Podoplanin (1:50; BioLegend), Alexa Fluor 647–CD73 (1:50; BioLegend), CD31 (PECAM1, 1:100; BD Pharmingen), guinea pig anti-Neph1 (gp2, 1:100), rabbit anti-Neph1 (1:100; made by T.B.H.), and guinea pig anti-Synaptopodin (1:200; Synaptic Systems). After washing in PBS, fluorochrome-labeled donkey secondary antibodies (all from Jackson ImmunoResearch Laboratories) and Hoechst (Molecular Probes) were applied, where appropriate, for 30 minutes at RT. After washing in PBS, sections were mounted in Fluoromount. Staining was visualized using an LSM800 with Airyscan and the ZenBlue software, or with an ELYRA PS.1 SIM microscope and the ZenBlack software (all Zeiss). To quantify foot process morphology, analysis of filtration slit density was performed, as previously described .25,26 To quantify protein intensity at the slit diaphragm (Nephrin and Neph1), or at the foot processes (Synaptopodin), the amount of white/black pixels was measured in a standardized region of interest at the GFB using FIJI.
Uniform Manifold Approximation and Projection Visualizations
To further visualize the separation of podocytes, mesangial cells, and endothelial cells, we performed Uniform Manifold Approximation and Projection (UMAP), a dimensionality reduction method (https://joss.theoj.org/papers/10.21105/joss.00861). This algorithm can be used to map high-dimensional data into two dimensions. Visualizations were created from cytometry channel data and gates were used as labels for coloring. Only living, single cells were included in analyses.
Statistical Analysis
Results were expressed as means±SEM or SD, and significance was set at P<0.05. The means were compared using the two-tailed, nonparametric Mann–Whitney U test to enable robust conclusions on the effect’s significance in case of departures from normality, which is associated with small sample sizes. We used biologic replicates, measured using different samples derived from distinct mice. More than two groups and points in time were analyzed using the two-way ANOVA with the Sidak multiple comparison.
Results
Establishment of the Glomerular Cell Isolation Method
First, we established and validated fluorescently labeled antibodies directed against extracellular antigens that would prove suitable for labeling of individual glomerular cell types, after an extensive protocol of enzymatic digestion and mechanical disruption (Figure 1A). Immunofluorescence analysis of frozen murine kidney sections (Figure 1B) demonstrated a specific labeling of podocytes with antibodies directed against Podoplanin27; of endothelial cells with antibodies directed against CD3128; and of mesangial cells with antibodies directed against ecto-5′-nucleotidase/CD73, an enzyme responsible for adenosine formation from AMP expressed in mesangial cells.30 Two protocols were used for the initial comparison of glomerular cell types isolated on the basis of cell type reporter expression (Figure 1C) with those isolated from reporter-free mice (Figure 1D). As a reference for reporter-free glomerular live cell isolation, mT/mG mice were used, in which podocytes are already marked by the intrinsic expression of eGFP and all of the other murine cells by the intrinsic expression of tdTomato. To differentiate glomerular endothelial and mesangial cells, the remaining tdTomato-positive glomerular cells were separated into tdTomato+/CD31+/eGFP−/CD73− endothelial cells and into tdTomato+/CD73+/eGFP−/CD31− mesangial cells (Figure 1C). This gating strategy was then modified for the use in wild-type mice, using a combination of fluorophore-conjugated anti-Podoplanin, anti-CD31, and anti-CD73 antibodies, resulting in three distinct glomerular cell populations: Podoplanin+/CD31−/CD73− podocytes, CD73+/Podoplanin−/CD31− mesangial cells, CD31+/CD73−/Podoplanin− endothelial cells, and a population of nonlabeled cells. These nonlabeled cells most likely represented contaminating tubular cells, because they expressed higher levels of the tubular transcripts Slc12a1 (encoding for Nkcc2) and Aqp4 (encoding for Aquaporin 4) relative to isolated glomeruli (Figure 1D, Supplemental Figure 3). UMAP analysis demonstrated a clear separation of the three glomerular cell types in wild-type mice (Supplemental Figure 2A).
Isolated Glomerular Cells Are Pure
To evaluate purity and to assess further usability of the isolated cell populations, we performed several experiments. First, we established the typical cellular yield obtained by this isolation technique (Figure 2A). In total, 11% (mean± SEM, 35,600±1,722) of glomerular cells isolated were podocytes, 16% (55,300±3,600) were mesangial cells, and 73% (245,000±11,000) were endothelial cells. These percentages and absolute cell numbers were stable across species and sex (Supplemental Figure 4, A and B). In old mice (61–69 weeks old), the efficiency of podocyte, mesangial cell, and endothelial cell isolation decreased significantly, when compared with younger (11–14 weeks old) mice (Supplemental Figure 4C). The percentages of isolated cell types were not different between wild-type and mT/mG mice, although mT/mG mice resulted in higher absolute number of podocytes, mesangial cells, and endothelial cells than wild-type mice (Supplemental Figure 5). We then plated the FACS-sorted cells onto collagen type IV–coated culture plates to assess the morphologic characteristics of the different cell populations by visualizing the actin cytoskeleton with F-actin and the glycocalyx by staining with WGA (Figure 2B). FACS-sorted podocytes were the largest cells and exhibited an elaborate phenotype with long arborizations and a cortical actin ring, as expected.1 FACS-sorted mesangial cells were generally smaller than podocytes, with a coarse actin cytoskeleton and smaller membrane arborizations. FACS-sorted endothelial cells were the smallest of all cell types, round in morphology, with a prominent WGA-positive glycocalyx. We then analyzed the RE of cell-specific transcripts in the FACS-sorted cell population relative to the transcript levels present in whole glomeruli from the same mouse (Figure 2C). The expression of the podocyte-specific transcripts Nphs2 (encoding for Podocin) and Pdpn (encoding for Podoplanin) was enriched in podocytes, compared with glomeruli, and significantly lower in mesangial and endothelial cells. The expression of the mesangial cell–specific transcripts Pdgfrb (encoding for PDGFR-β) and Cd73 (encoding for CD73) was enriched in mesangial cells compared with glomeruli, and significantly lower in podocytes and endothelial cells. The expression of the endothelial cell–specific transcripts Cdh5 (encoding for VE-Cadherin) and Pecam1 (encoding for CD31) was enriched in endothelial cells, compared with glomeruli, and significantly lower in podocytes and mesangial cells. To control for parietal epithelial cell and tubular cell contamination of our glomerular cell type preparations, we first ensured that our glomerular isolation resulted in a preferential enrichment of decapsulated glomeruli, without appending tubuli, by phase-contrast microscopy. Second, potential contamination was excluded by qPCR for the parietal cell–specific transcripts Lad1 (encodes for Ladinin) and Scin (encodes for Scinderin),27 and for transcripts specific to tubular cells, Aqp4 (encodes for Aquaporin 4) and Slc12a3 (encodes for the sodium chloride channel NCC) (Supplemental Figure 6A). Additionally, we controlled for the absence of the parietal cell–specific protein Claudin1 in the podocyte cell population by Western blot (Supplemental Figure 6B). We next proceeded to evaluate the expression of cell-specific markers by immunoblot (Figure 2D). Cell number–adapted lysates of FACS-sorted cells from individual mice were separated by SDS-PAGE and blotted for cell-specific markers. Corroborating the qPCR results, only podocytes expressed the slit membrane protein Nephrin, only mesangial cells expressed PDGFR-β, and only endothelial cells expressed VE-Cadherin. Taken together, these analyses demonstrate the successful isolation of podocytes, glomerular endothelial cells, and mesangial cells from individual mice in sufficient amounts to perform protein-biochemical investigations.
Figure 2.

FACS-sorted cells are pure and in sufficient amounts to perform protein-biochemical investigations. (A) Graph depicting the mean cell harvest per mouse in absolute numbers (mean±SEM, n=149 mice, pooled data from 20 independent experiments). Percentages indicate the relative number of each cell population from the total amount of isolated cells. (B) Representative confocal images of FACS-sorted podocytes (PC), mesangial cells (MC), and glomerular endothelial cells (EC) plated on collagen IV. F-actin (green) demarcates the actin cytoskeleton, WGA (red) the glycocalyx; DNA was stained with Hoechst (blue). (C) Real-time qPCR analysis exhibiting the expression of cell-specific transcripts. mRNA was isolated from FACS-sorted podocytes, mesangial cells, and endothelial cells, and from isolated glomeruli derived from the same individual. ΔCT values were calculated using 18S as a housekeeping gene. ΔΔCT values were calculated as the difference between the glomerular and FACS-sorted cell type ΔCT. Displayed is the RE of FACS-sorted cell types in percent of the glomeruli. Note the significant enrichment of cell-specific transcripts in the FACS-sorted cell types compared with the glomerulus. Mean±SEM, n=8 (Nphs2, Pdgfrb, Cdh5), n=4 (Pdpn, Cd73, Pecam1), pooled data from three independent experiments, one-way ANOVA and Bonferroni’s multiple comparisons test. (D) Cell number–adapted lysates of FACS-sorted cells from individual mice were separated by SDS-PAGE and analyzed by immunoblot for the expression of cell-specific markers. Graphs exhibit densitometric quantification, values were normalized to Ponceau S staining of the same membrane, and are expressed as mean±SEM RE levels to podocytes. n>4 pooled data from two to five independent blots, with n=2 mice per blot. *P<0.05, **P<0.01, ***P<0.005, §P<0.0001. Rel., relative.
Proteomic Analyses Unravel Glomerular Cell–Specific Molecular Reference Profiles and Signaling Networks
Using gating strategy 1 (applied to transgenic mice; Figure 1C), we first generated a proteomics profile from mT/mG mice using cell pellets consisting of 1 million cells. The dataset quantified 4753 proteins from these cells out of >6600 proteins, allowing for a three-dimensional view of protein quantification (Figure 3A). Principal component analysis (PCA) and hierarchic clustering revealed a strong separation of the cell types (Figure 3, B and C). Using t-test analyses, we defined lists of podocyte-, endothelial cell–, and mesangial cell–specific proteins that were significantly enriched over the other cell types. These can be found in Supplemental Table 3 for mT/mG mice, and in Supplemental Table 4 for wild-type mice across sex, species, and age. On the basis of statistical enrichment followed by statistical testing with correction for multiple testing, we defined 1150 endothelial cell–, 366 mesangial cell–, and 718 podocyte-specific proteins (FDR<0.01, at least two-fold log2 enrichment, P<0.05). To confirm the purity of the preparation, we mapped these cell type–specific proteins against previously defined cell marker genes obtained by single-cell RNA sequencing.30 The data were largely consistent with the protein expression defined on these clusters; however, some genes were differently expressed (Figure 3C). We mapped known proteinuria genes31 against the enrichment and found the majority of proteinuria genes in podocytes (Figure 3D). We also mapped 365 high-confidence phosphorylation sites in the proteomics data; among these, protein phosphorylation of Kirrel (Neph1) and Synaptopodin were only detected in podocytes. Motif analysis of the phosphorylation sites uniquely localized to cell types revealed higher distinct sequence logos in each cell type. For instance, phosphorylation sites unique to podocytes had more acidic (D/E) amino acid residues on the carboxy-terminal of the phosphorylation site (Figure 3E). This phosphorylation motif is increasingly found in proteins at the filtration barrier, for instance, a phosphorylation site of Neph1 at S584 (sequence window REPLTMHS*DREDDT) that was previously described.32,33 We also used in silico protein-protein interaction analyses and data resources to map potential intercellular protein crosstalk and communication. The analysis revealed contribution of different cell types to the extracellular matrix, and a distinct signaling system. One example here was the ephrin-ephrin receptor system, with Epha2 and Efnb1 expressed in podocytes, and Epha2, Ephb4, and Efnb2 expressed in endothelial cells (Figure 3F). Furthermore, we constructed cell type–enriched signal transduction networks using a protein-protein interaction network and the NetBox algorithm (Supplemental Figure 7).34 Both analyses support the view of podocytes being active in proteostasis.
Figure 3.
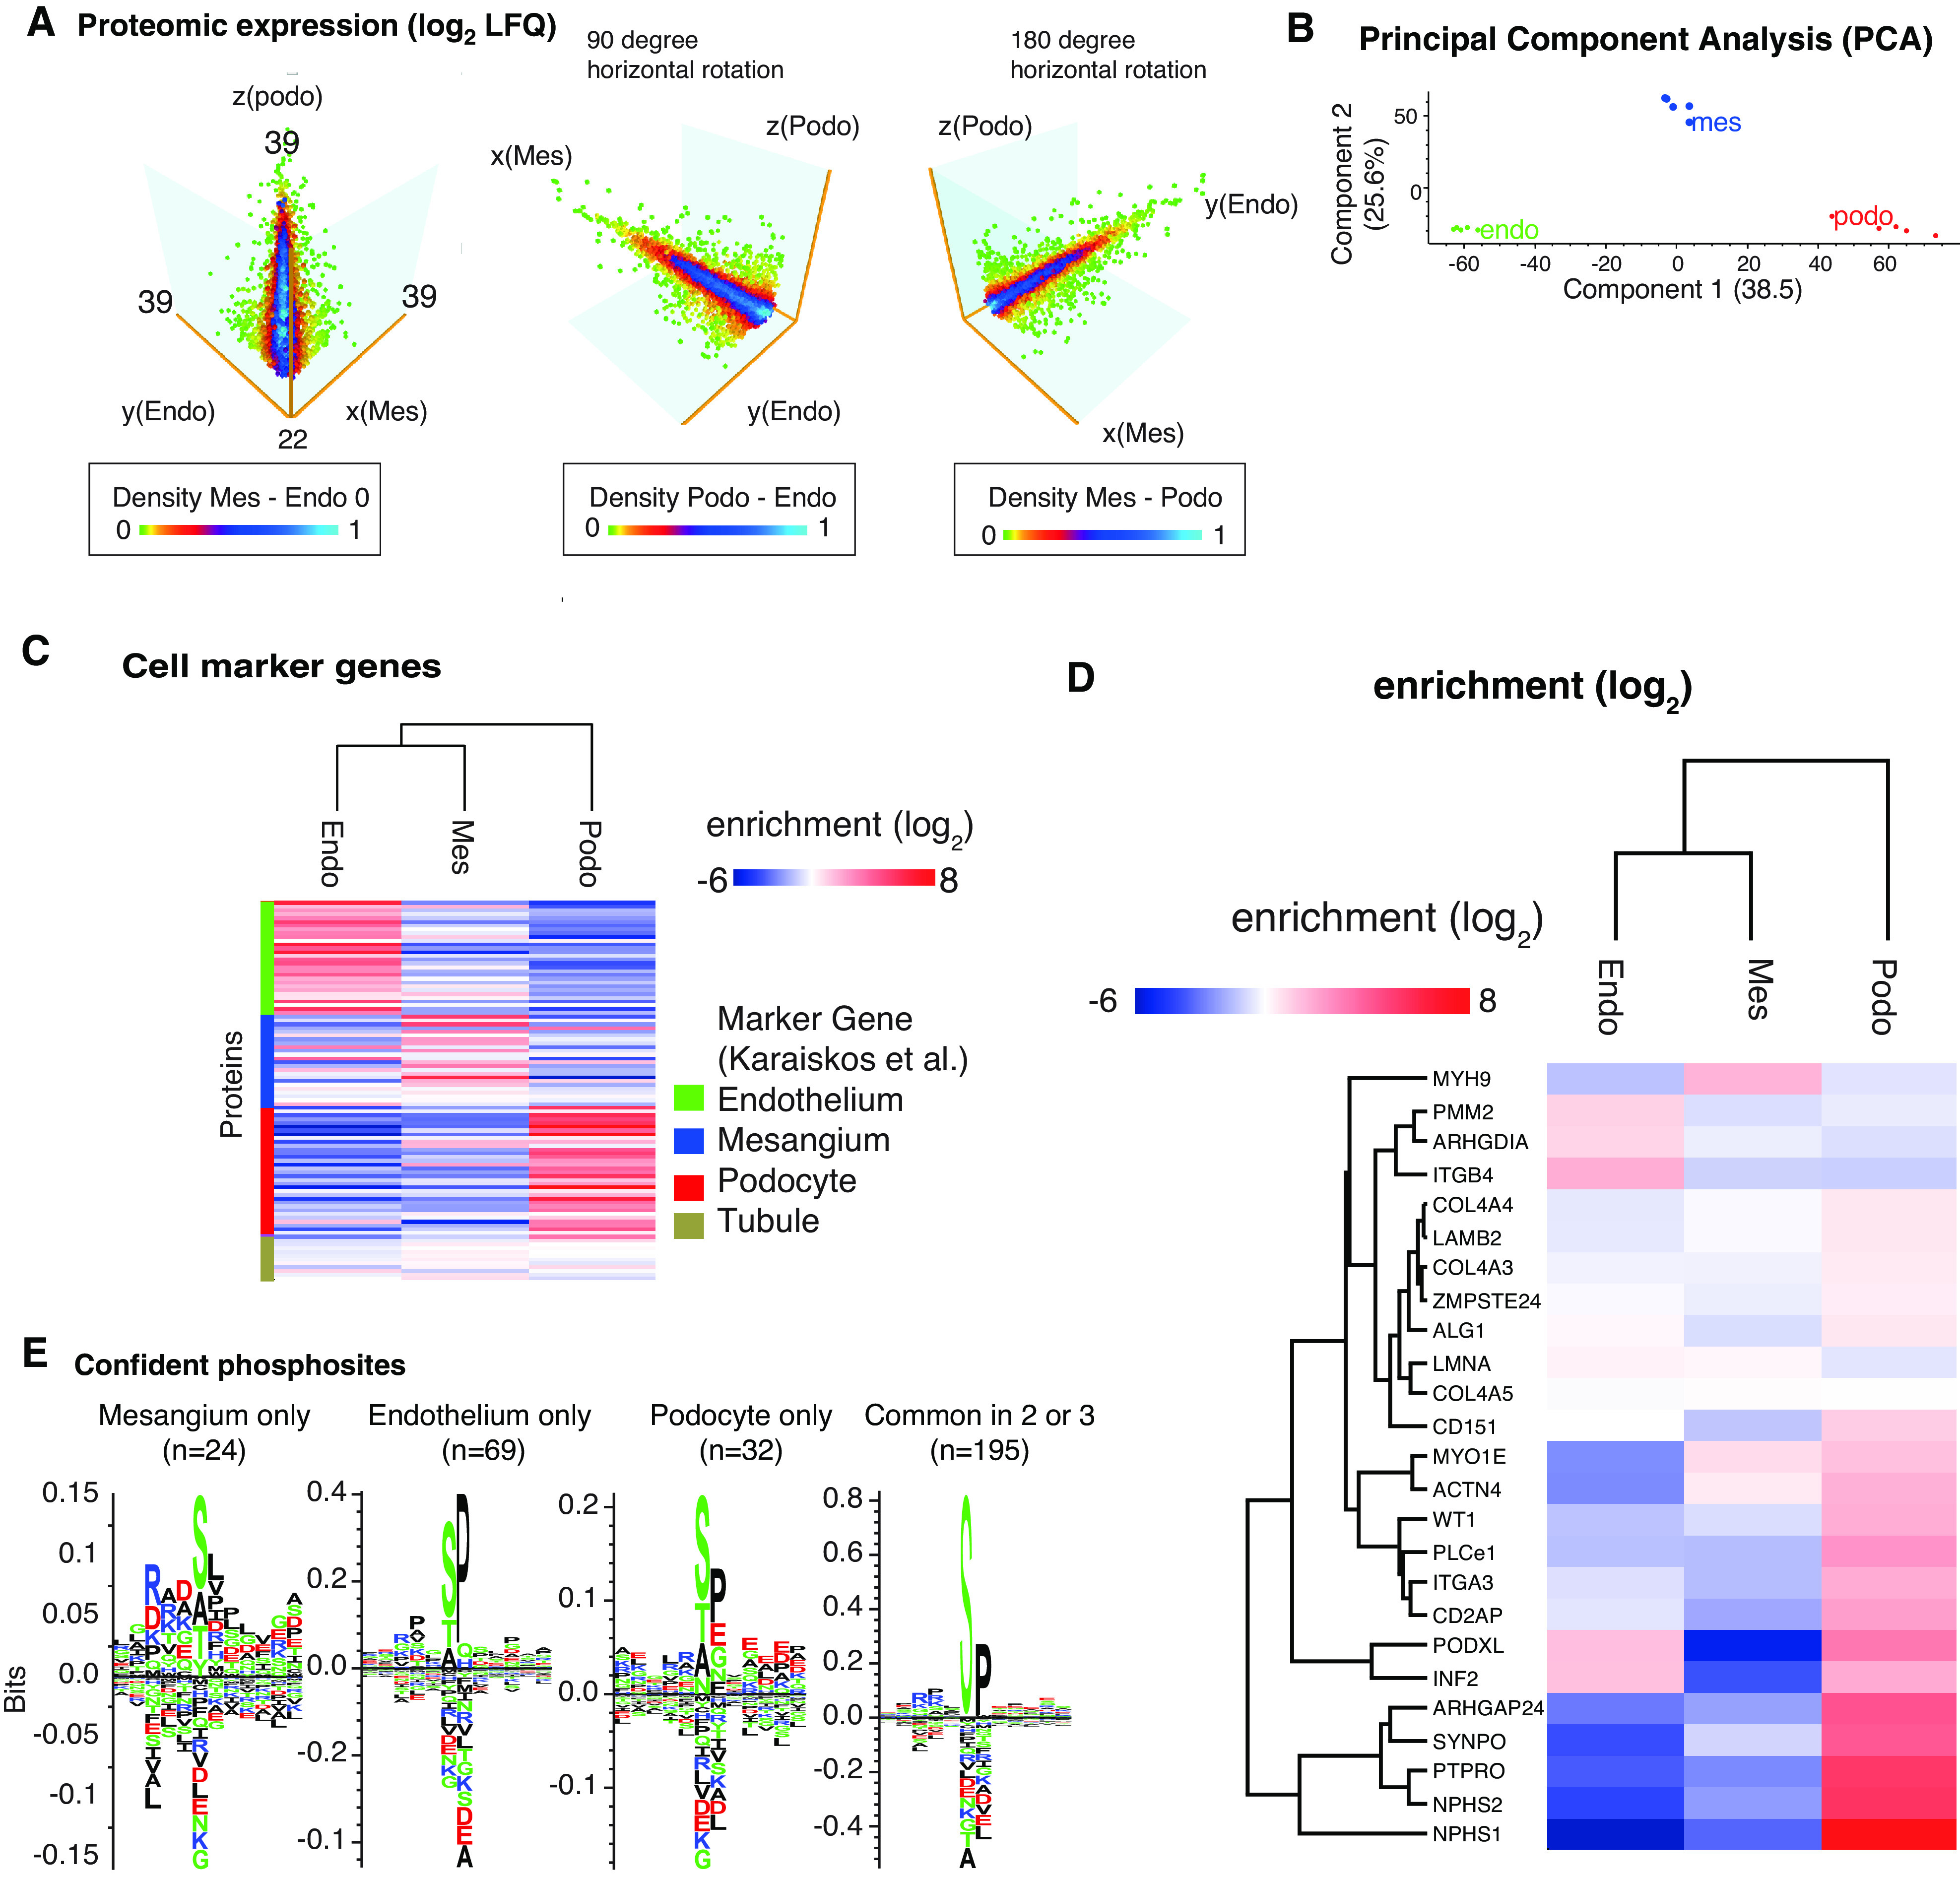
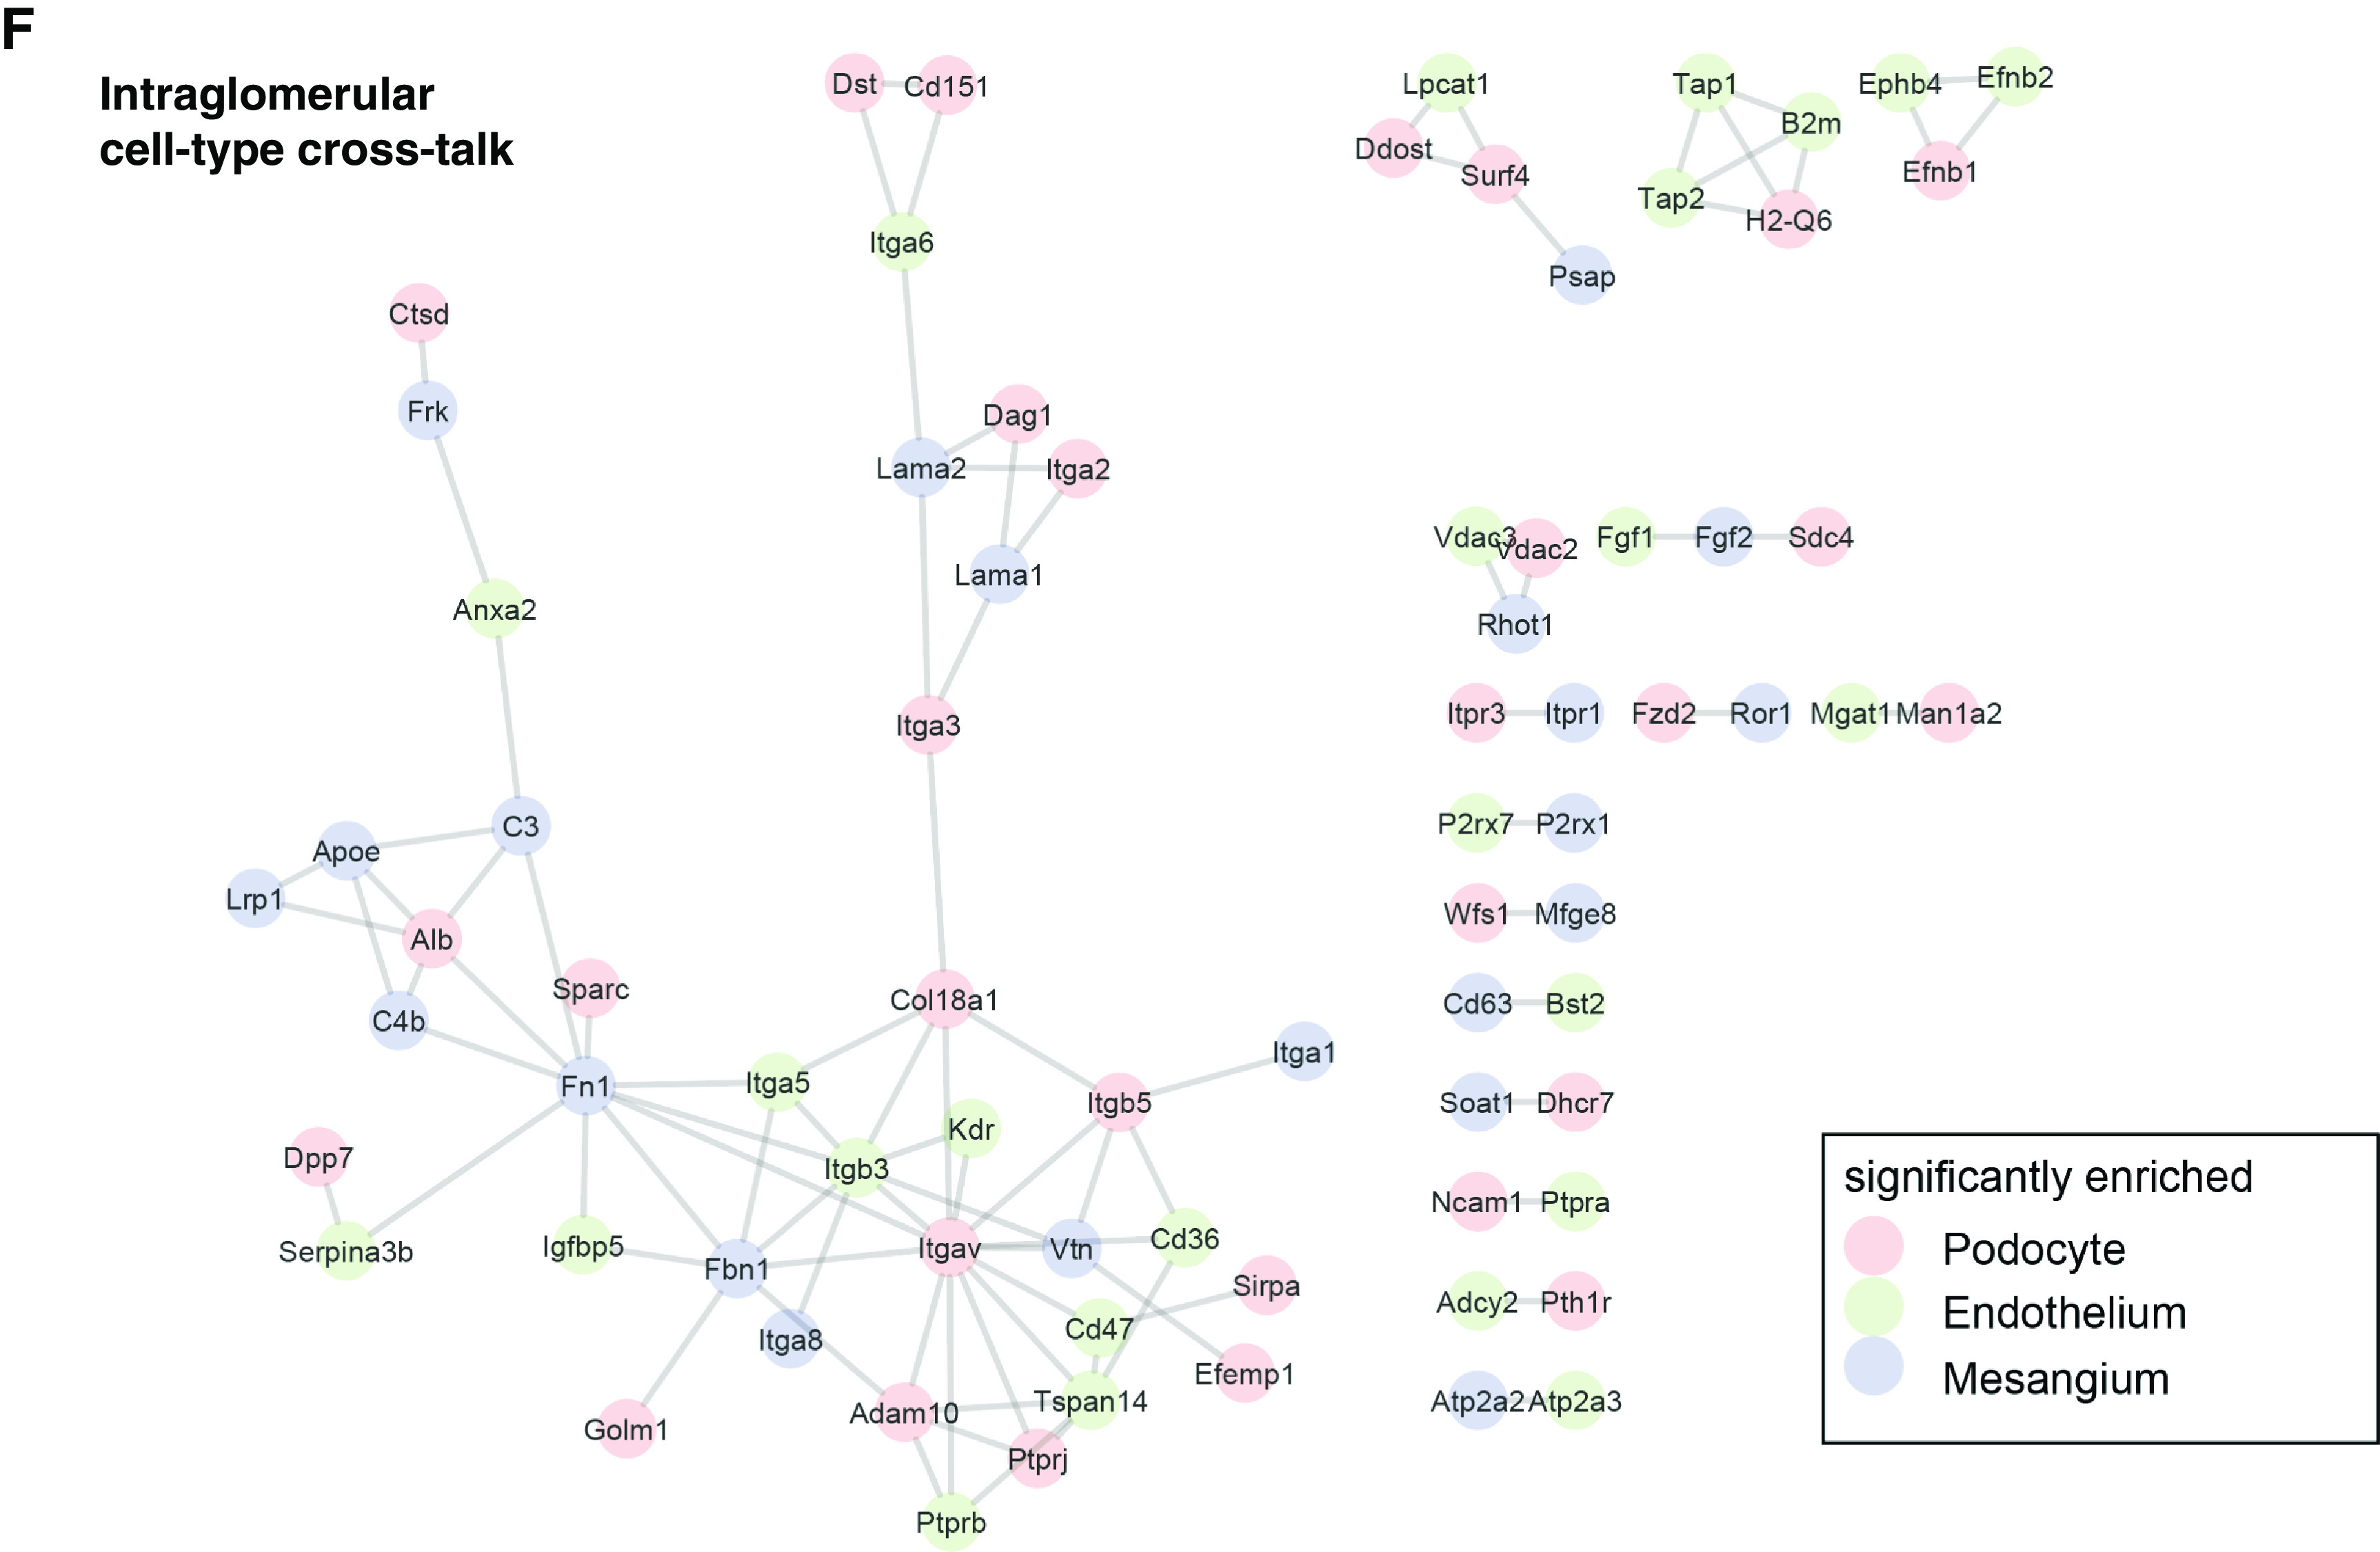
Tripartite cell type isolation and proteomic analysis from mT/mG mice shows cell specific profiles. (A) Three-dimensional view of the tripartite cell proteomes containing 6600 proteins and quantification of 4400 proteins. (B) PCA showing clear separations of endothelial cell (endo), mesangial cell (mes), and podocyte (podo) proteomes. (C) Cell marker gene products derived from Karaiskos et al.,30 and their proteomic expression from mesangial cells, podocytes, and endothelial cells. (D) Expression of annotated proteinuria genes. (E) Position-weighted matrices of phosphorylation motifs in podocytes, mesangial cells, and endothelial cells. Letter height represents frequency around the central (serine) phosphorylation site. (F) Visualization of glomerular cell crosstalk systems. Protein-protein interaction networks were generated in STRING using high-confidence interactions (database and experimental evidence, confidence >0.9).
Proteomic Analyses Unravel New Glomerular Cell–Specific Proteins
We applied the newly generated method to cell populations from a single mouse, comparing male and female mice in a C57BL/6 background, BALB/c females, and—as a control—mT/mG female mice that were subjected to the original protocol. To test the generalizability of the method from FACS-sorted cells, and to test the purity of the preparations, we generated proteomics profiles from three different cell types by single-shot proteomics from the cell fractions from a single mouse. An overview of the dataset revealed very clear separations of three distinct cell types, suggesting the identity of these cells is in fact different (Figure 4A). We again determined which proteins were specifically enriched in the different glomerular cell types, and found novel cell type markers by comparing our results with the Human Protein Atl as (Figure 4B, Supplemental Figures 8–10). To the best of our knowledge, we identified 12 new podocyte-enriched proteins, 16 new mesangial cell–enriched proteins, and 22 new glomerular endothelial cell–specific proteins on the basis of strict criteria (see Methods). In addition, the clear presence of mesangial cells in this protocol is remarkable, because the molecular protein composition of these cells has not yet been described. In confirmation of our proteomic data, qPCR and immunofluorescence validation experiments found that expression of integrin β3 and its ligand, fibronectin, was restricted to glomerular endothelial cells (Supplemental Figure 11). We next analyzed which protein classes had high variance between the four mouse strains (Figure 4C). Podocyte proteins had the largest variance (highest SD) between the proteins among all three cell types, which may be due to the disruptive isolation method used in this protocol. Through the high sensitivity of the assay, we also observed that the mesangial cell populations had minimal contamination by podocytes with the initial gating strategy (Supplemental Figures 1A, 2B and 2C), which we estimated to be around 2%, as compared with the mT/mG-derived mesangial cells. In reaction to this observation, we improved the gating strategy for all other investigations (Figure 1D, Supplemental Figure 1B). The UMAP analysis demonstrates the removal of the contaminating podocytes in the mesangial cell population by using these adjustments (Supplemental Figure 2, B and C).
Figure 4.

TimMEP identifies new podocyte-, mesangial cell–, and glomerular endothelial cell–enriched proteins in reporter-free single mice. (A) Heat map showing Euclidean distance clustering of single-mouse, single-shot proteomics results from male C57BL/6, female C57BL/6, female BALB/c, and female mT/mG mice. Each column represents a cell type proteome from a single mouse. (B) To identify new proteins enriched in podocytes, mesangial cells, and glomerular endothelial cells, glomerular cell type proteome lists of individual mice were compared. For the comparisons, we defined (1) a t-test difference cutoff of greater than two between podocytes and nonpodocytes; (2) a negative search result in PubMed (https://www.ncbi.nlm.nih.gov/pubmed); and (3) a validated podocyte expression pattern in the Human Protein Atlas (https://www.proteinatlas.org/search), from which the histologic micrographs are taken. (C) SD distributions of proteins in each cell type reveal low variance of expression in endothelial cells.
Glomerular Endothelial Cells Exhibit Proteomic Differences between Mouse Strains
We performed deeper proteomic bioinformatic analysis of the population with the highest homogeneity: the glomerular endothelial cells. PCA of the glomerular endothelial cell proteomes derived from four different mouse strains (female C57BL/6, male C57BL/6, BALB/c, and mT/mG mice) was performed. Data revealed a separation by strain, with male and female C57BL/6 mice being similar, and mT/mG mice being the most different from the others (Figure 5A). The proteins with the most significant differences in this dataset were UCH-L1 (a major neuronal deubiquitinase of the degradative ubiquitin proteasome system35) and Gvin1 (GTPase, very large IFN inducible 1, which contributes to the cellular response to both type I and type II IFNs36) (Figure 5B), suggesting that reporter-dependent artifacts in the proteome must be considered when using fluorescent reporter systems. Volcano plot analysis revealed a >16-fold difference of these proteins in the mT/mG endothelial cells as compared with C57BL/6 cells (Figure 5C). In fact, the differences in endothelial expression of UCH-L1 could be confirmed using confocal microscopy of C57BL/6 and mT/mG glomeruli (Figure 5D). We also performed unbiased analysis of differentially expressed proteins within the four strains (Figure 5E), using an ANOVA with FDR<0.01. Clustering analysis revealed there was a significant alteration in stress-response proteins in mT/mG mice, compared with the other strains, and an alteration of immunity and cell adhesion proteins in BALB/c females, compared with C57BL/6 females (Figure 5F).
Figure 5.

TiMEP unravels strain-dependent differences in endothelial proteomes. (A) Analysis of glomerular endothelial proteome from wild-type and mT/mG mice. (B) PCA of proteins. (C) Volcano plot showing differences between proteins highly expressed in mT/mG (right side of the plot) and C57BL/6 (left side of the plot) endothelial cells. (D) Representative confocal images of UCH-L1 (green) expression in a C57BL/6 and in a mT/mG glomerulus. Nephrin (red) was used to demarcate the GFB (DNA, blue). Arrows point toward endothelial UCH-L1 expression. (E) Hierarchic clustering of mean normalized protein expression (log2 LFQ) from four different mouse strains. (F) Clustering combined with Gene Ontology term enrichment reveals stress response proteins in endothelia from mT/mG mice. f, female mice; m, male mice; norm., normalized; pc, podocyte.
Glomerular Cell Types Resolve Specific Reactions in Anti-THSD7A MN
We then determined whether our glomerular cell isolation technique was also suitable for the separation of glomerular cell types in the setting of glomerular damage and inflammation. For this purpose, we induced defined glomerular injury through injection of rabbit antibodies that specifically target the podocyte foot process antigen THSD7A.37 This immunologic model of THSD7A-associated MN9 leads to selective podocyte injury with massive proteinuria within days, and mimics the pathophysiology of human THSD7A-associated MN.38 CD45, as an additional marker, was added to the FACS protocol to remove potential leukocytes adhering to the endothelium of the perfused glomeruli in inflammation (Supplemental Figure 12). A UMAP demonstrated separation of CD45-positive cells from all other cells (Supplemental Figure 2D). No significant infiltration and adherence of leukocytes could be detected in this GN model (Supplemental Figure 13, A and B). Further, the cell-sort marker expression of Podoplanin, CD31, and CD73 was mostly preserved in day 7 glomeruli of highly proteinuric mice (Supplemental Figure 13C), a predisposition for the successful isolation of podocytes, glomerular endothelial cells, and mesangial cells. Glomerular cell types were analyzed for a stress response by qPCR on day 1 after antibody binding, before development of proteinuria, and on day 7, when severe podocyte injury and nephrotic syndrome were established (Figure 6, A and B). The qPCR analyses demonstrated significant changes in podocyte gene transcription as early as day 1 for (1) genes involved in GBM remodeling (Agrin, a major proteoglycan of the GBM,39 laminin chain β1 [Lamb1], laminin chain of the immature/injury remodeled GBM40; Figure 6C); (2) for genes involved in an oxidative stress response (vascular endothelial growth factor a [Vegfa], involved in angiogenesis and maintenance of the glomerular endothelium41, and Sod1, detoxifies reactive oxygen radicals42; Figure 6D); and (3) for genes of key metabolic enzymes (pyruvate kinase [Pkm], key enzyme of glycolysis43; acyl-CoA dehydrogenase, long chain [Acadl], a key enzyme in β-oxidation of fatty acids44; Figure 6E) in mice exposed to rabbit THSD7A antibodies (rbTHSD7A-abs) in comparison with control rabbit IgG (rbIgG). Importantly, these changes in gene transcription were not visible upon analyses of isolated bulk glomeruli on day 1 and day 7, demonstrating the enhanced sensitivity obtained when performing glomerular cell type–based analyses. Mesangial and glomerular endothelial cells showed no major alterations in the evaluated transcription levels on day 1 or 7. Strikingly, the observed gene induction on day 1 was no longer apparent on day 7 in rbTHSD7A-abs–injected mice. On day 7, all analyzed transcript levels were repressed in rbTHSD7A-MN podocytes in comparison to day 1, and were only slightly elevated in comparison to day 7 rbIgG-injected control mice (data not shown), suggesting a specific and acute reaction to rbTHSD7A-abs on day 1.
Figure 6.

Glomerular cell–specific analyses in the experimental model of THSD7A MN unravels acute transcript regulation. Experimental THSD7A MN was induced in male BALB/c mice by injection of podocyte-targeting rbTHSD7A-abs) or nonspecific control rbIgG. Analyses were performed on day 1 (d1) and 7 (d7) after antibody injection. (A) Confocal analyses demonstrating rbIgG (green) deposition in a linear (day 1) and a more granular (day 7) pattern in rbTHSD7A-abs–injected mice. Yellow color exhibits colocalization of the injected rabbit antibodies with the antigen THSD7A (red), as a sign for successful induction of MN (DNA, blue). (B) Urinary albumin-creatinine ratio on days 1 and 7. **P<0.01 to day 7 rbIgG, Mann–Whitney U test. (C–E) qPCR analyses were performed in isolated glomeruli (as the conventional method, graphs with gray bars) and in FACS-sorted (right graphs) podocytes (PC, red bars), glomerular endothelial cells (EC, green bars), and mesangial cells (MC, blue bars) of the same mouse. Graphs exhibit RE in comparison with rbIgG-treated mice (control [Co], striped bar) of the respective time point (day 1 rbIgG to day 1 rbTHSD7A-abs, and day 7 rbIgG to day 7 rbTHSD7A-abs) after normalization to 18S as a housekeeping gene. The control bars exhibit the pooled day 1 and day 7 rbIgG values for simplification. *P<0.05, **P<0.01 to control, §§P<0.01 to day 7 rbIgG, Mann–Whitney U test. Ox, oxidative; Rel., relative.
We then analyzed the proteome of all three cell types at day 7 of the rbTHSD7A-MN model. At this time point, mice were proteinuric and transcriptional differences were minimal between rbIgG and rbTHSD7A-MN podocytes. PCA analyses demonstrated a successful separation of the three glomerular cell types in control and rbTHSD7A-injected mice (Figure 7A). In podocytes, 10.8% of all identified proteins were significantly regulated, with 7.2% in mesangial cells and only 0.6% in glomerular endothelial cells (Figure 7B). Volcano plot analyses also demonstrated regulated proteins in the mesangial cells (Figure 7C), whereas endothelial cells (Figure 7D) did not demonstrate a significant reaction to the podocyte-bound rbTHSD7A-abs. In contrast, podocytes depicted a differential loss of the slit diaphragm proteins Neph1 (Kirrel) and, to a lesser extent, Nephrin, whereas foot process proteins remained unchanged in rbTHSD7A-abs–treated mice (Figure 7E). Western blot validation in isolated glomeruli confirmed the specific and significant loss of THSD7A, Nephrin, and Neph1, whereas the foot process proteins α-Actinin 4 and Synaptopodin remained unchanged in rbTHSD7A-abs–treated mice in comparison with rbIgG control mice. Podocin exhibited a slight, but not significant, reduction in abundance (Figure 7F). Because THSD7A was described to localize beneath Nephrin at foot process subdomains, in close proximity to the slit diaphragm,37 we asked whether THSD7A interacted with Neph1, located basally from Nephrin at the slit diaphragm.45 Super-resolution structured illumination microscopy showed THSD7A was in close proximity to Neph1 and Nephrin at the human, pig, and murine healthy GFB (Figure 7G, Supplemental Figure 14A). However, we were not able to show a direct interaction of the three proteins in unchallenged conditions (Supplemental Figure 14B). In the setting of experimental murine THSD7A-MN, the differential loss of Nephrin and Neph1 protein was not solely attributable to a decrease of slit diaphragm density upon rbTHSD7A-abs binding to THSD7A (Figure 8A). Notably, signal intensity of the slit diaphragm marker was disrupted and decreased in Nephrin and Neph1 immunostainings, whereas the signal for Synaptopodin was preserved, and even enhanced, at the GFB (Figure 8, B–F, Supplemental Figure 15). Together, these findings suggest the decreased Nephrin and Neph1 protein levels in rbTHSD7A-MN originate from a local loss/degradation of both proteins from the slit diaphragm upon rbTHSD7A autoantibody binding, possibly representing one pathogenic mechanism in THSD7A-associated MN (summarized in Figure 8H).
Figure 7.

TimMEP dissects reduced slit diaphragm protein levels in THSD7A-associated MN. Experimental THSD7A-associated MN was induced in male BALB/c mice by injection of podocyte-targeting rbTHSD7A-abs or unspecific control rbIgG. (A) Glomerular cell types were isolated by timMEP on day 7 after antibody injection and bulk proteomics were performed. PCA showing clear separation of endothelial cell, mesangial cell, and podocyte proteomes from control- (filled circles) and THSD7A-MN–derived (open squares) cell types. (B) Percentages of significantly regulated proteins are indicated in timMEP-isolated glomerular cell types. (C–E) Volcano plots showing differences between proteins highly expressed in control (right side of the plot) and MN (left side of the plot) glomerular cell types. Proteins beyond the lines are of significance (FDR<0.05, s0=0.1 [fudge factor]) . (F) Western blot from isolated glomeruli of experimental mice on day 12 for the slit diaphragm (SD) proteins Nephrin and Neph1, for THSD7A, and for the foot process (FP) proteins α-Actinin 4, Synaptopodin, and Podocin. β-Actin of the same membrane was used as a loading control. Graph exhibits relative protein-of-interest (POI) abundance in comparison with rbIgG-treated mice (control [Co], striped line and white bar) of the respective POI (after normalization to β-actin of the same membrane). n≥5, pooled data from two independent experiments. **P<0.01 to control, Mann–Whitney U test. (G) Super-resolution structured illumination microscopy micrographs of triple immunostaining for Neph1 (green), THSD7A (red), and Nephrin (cyan) in a healthy mouse, pig, and human glomerulus. Note the close localization of THSD7A to Neph1 and Nephrin in all species (arrows).
Figure 8.

TimMEP unravels selective loss of slit diaphragm proteins as a pathogenic factor in THSD7A-MN. Experimental THSD7A-associated MN was induced in male BALB/c mice by injection of podocyte-targeting rbTHSD7A-abs or nonspecific control rbIgG. Glomeruli were analyzed on day 7 by super-resolution structured illumination microscopy (SR-SIM). (A) Quantification of filtration slit density (FSD) by podocyte exact morphology measurement procedure demonstrates extensive foot process effacement of rbTHSD7A-abs–injected mice. n≥23 regions of interest. (B–D) Quantification of Nephrin, Neph1, and Synaptopodin abundance at the frontal plane of the GFB using FIJI. n=30 regions of interest. (E–G) SR-SIM high-resolution micrographs of double immunostainings for THSD7A (red) with Nephrin, or Neph1, or Synaptopodin (all green) using guinea pig or goat secondary antibodies to prevent the detection of the bound rbTHSD7A-abs. (H) Scheme of proposed pathogenic process in THSD7A-associated MN: THSD7A-autoantibodies traverse the GBM and bind to THSD7A localized at the slit diaphragm (SD) in close proximity to Neph1 and Nephrin. Binding of autoantibodies induces the selective removal/degradation of the SD proteins Nephrin and Neph1, whereas most foot process (FP) proteins are not lost. ***P<0.001, ****P<0.0001, Mann–Whitney U test. Rel., relative. EC, endothelial cell; MC, mesangial cell; PC, podocyte.
Discussion
The complicated architecture of the kidney hampers the direct access of susceptible cell types in kidney diseases for further functional analysis. Here, we established a generalizable method for generating molecular reference profiles of all kidney glomerular cell types in health and disease. This FACS-based method, which we propose to name timMEP, results in the precise isolation of the three glomerular cell types, as extensively validated by qPCR, proteomic, immunoblot, and immunofluorescence analyses. timMEP does not require the extensive breeding of transgenic reporter mouse models for subsequent isolation of glomerular cell types, which saves time, animals, and animal housing costs. Therefore, timMEP is theoretically amenable to any existing mouse model and will facilitate and sharpen investigations of glomerular cell biology in a cell type–specific, cost-effective, and timely manner. timMEP not only allows the quantification of transcript and protein levels per bulk transcriptomic, proteomic, and Western blot approaches, but also allows for the biologically relevant assessment of enzymatic activities and of post-translational modifications of selected proteins. This enables a glomerular cell type–specific analysis of regulatory events involved in driving glomerular cell injury.
As a proof of principle, we applied timMEP in the experimental model of THSD7A-associated MN and demonstrated the advantage of this method in detecting early cell type–specific changes in mRNA, which were not discernable upon analysis of whole glomeruli. Further, we used timMEP in severely nephrotic THSD7A-MN mice to perform cell type–specific proteomic analyses. These analyses revealed that endothelial cells were not affected in a murine model of MN, whereas mesangial cells exhibited a nonspecific stress reaction to the podocyte-bound autoantibodies, which requires further investigation. Importantly, bulk proteomes from timMEP-isolated podocytes helped discern a specific reaction of podocytes to the bound THSD7A antibody, a reaction encompassing the selective loss/degradation of slit diaphragm proteins, whereas the foot process proteins we analyzed remained mostly unaffected. To this end, a close proximity, but no direct interaction, of THSD7A with Nephrin and Neph1 could be detected in the healthy setting, a situation that could potentially change after autoantibody binding to THSD7A, because this antibody-antigen reaction has been shown to localize at the slit diaphragm in early disease.37 The precise mechanisms underlying the selective loss of the slit diaphragm proteins upon THSD7A autoantibody binding will be studied in future investigations.
Despite multiple advantages, timMEP has limitations. It depends on (1) successful isolation of glomeruli using magnetic beads, (2) successful single-cell suspensions, (3) binding of the fluorescent-labeled antibodies to glomerular proteins, and (4) flow sorting. Most of these experimental factors need to be considered for any kind of single-cell isolation/sample-generating procedure and can be mitigated by adequate controls and experimental design.46 Of particular concern for this method are any potential changes in the binding of the marker antibody. Frequently, glomerular cells change their proteome and, thereby, their cell type marker expression in the setting of stress,6,47 a process often reflecting a dedifferentiation (especially of podocytes) or inflammatory activation (especially within endothelial and mesangial cells) of glomerular cells.48 In addition, proteolysis occurs extracellularly to a large extent.49 Therefore, we carefully selected glomerular cell type markers, which were relatively stably expressed by the glomerular cell types in health and disease. We found that, despite massive proteinuria and inflammation and a decreased signal for Podoplanin in immunofluorescence, sorting was still successful. We currently do not have evidence that the expression of these sorting markers is sex dependent. For instance, CD73 was not different between mesangial cells isolated from male (mean±SD normalized expression, 4.50±0.30) versus female (mean±SEM normalized expression, 4.5338245±0.25) C75BL/6 mice, and we found no observable differences in immunostaining for these markers. Further, the numbers of isolated cell types were not sex dependent using these sorting markers. As a potential alternative strategy, we also provide other cell type markers that could be used for modified FACS analysis (Supplemental Table 5).
As for any detection technique, there are limits to the detection of transcripts and proteins in timMEP-isolated glomerular cell types. The number of isolated podocytes, mesangial cells, and glomerular endothelial cells per mouse using timMEP is sufficient for routine qPCR, transcriptomic, and proteomic analyses. However, protein analyses of less abundant proteins will, in some cases, require pooling of isolated glomerular cell types from two to four mice to reach a sufficient protein concentration for the analyses. The efficiency of timMEP is best in mice aged 6–20 weeks, thereafter, the number of isolated podocytes, mesangial cells, and glomerular endothelial cells decreases. This might partly be due to the fact that the efficiency of glomerular isolation decreases with age, and that the number of glomerular cells (especially of podocytes) decreases with age.4
Using timMEP, the presented dataset provides, for the first time, a reference for the proteomes of the three cell types in the glomerulus. Although we already described the podocyte proteome,14 this dataset now also covers cell types that are not easily amenable to single-cell dissociation, such as mesangial cells. Single-cell transcriptomic data generally have a large under-representation of mesangial cell capture, as compared with what is expected on the basis of morphometry.50 Analysis of several single-cell datasets revealed that mesangial cells are not “easily accessible,” given their common renin lineage (and thus the high chance of misclassification). Our dataset, in contrast, now provides unambiguous mRNA and protein-based markers, several of which are novel markers. These data are also benchmarked against single-cell transcriptomics datasets derived from glomerular populations.30
Further, our analyses unraveled a strain- and transgene-dependent expression of proteins among glomerular cell types, offering insights into protein machineries among strains and, possibly, an explanation for the differential susceptibility of different mouse strains to glomerular disease models.9,10,51 These observations expand descriptions of strain-dependent composition of the GBM.52 Moreover, these findings also support the presence of reporter-associated artifacts in transgenic reporter mice, because the expression of fluorescent reporters, such as eGFP, constitutes up to 6% of the proteome,14 a fact that could affect distinct cellular pathways, such as degradation pathways. In line with this, UCH-L1, a major deubiquitinating enzyme of the neuronal proteasomal degradation system, was one of the most differentially regulated proteins between the endothelia of mT/mG and C57BL/6 mice. Further, one should note that different isolation and analysis techniques might result in differences in mRNA and protein expression patterns between glomerular cell types. For example, we identified integrin β3 and its ligand, fibronectin, to be highly expressed in glomerular endothelial cells by proteomics, data carefully validated by qPCR and immunofluorescence in our mouse strains, whereas other publications suggest an integrin β3 protein expression in cultured podocytes53–56 or in vivo.57–59 Conflicting evidence also exists on single-cell RNA sequencing data. One study identified the highest level of Itgb3 in mesangial cells, and none in epithelial cells of C57BL/6 mice,60 whereas others found it in endothelial cells of C57BL/6 mice,61 consistent with our study. The exact explanation for these conflicting expression data shown for integrin β3 remains to be elucidated, but could be related to strain differences. Also, podocyte-expressed Itgb3 could have escaped proteomic detection.
The added value, however, is the gain of functional information that cannot be gleaned by transcriptomic approaches. Protein levels do not always reflect transcript abundances.62 At a complex barrier system such as the filtration barrier, additional insights can be gained. Here, for instance, we discovered a loss of Nephrin/Neph1 protein in a model of THSD7A-associated MN. In addition, our results offered a glimpse into the phosphoproteome. These data revealed acidophilic phosphorylation motifs in podocytes, with preference for casein kinases, consistent with previously reported phosphoproteomics data at the slit diaphragm. The phosphorylation motif preference, however, was different in the other cells. As a caveat, we acknowledge that phosphatase inhibitors were not included in the initial dissociation steps of the samples. When increasing depth or proteomic profiling, ligand-protein interactions, governing glomerular crosstalk, could be monitored; here, we found heterogeneous expression of the Ephrin receptor system.
In summary, we present a generalizable and effective method to isolate native glomerular cell types, which will enable a widespread and detailed glomerular cell type–resolved transcriptional and protein-biochemical analysis to deepen our future understanding of glomerular cell biology in health and disease.
Disclosures
T.B. Huber reports receiving research funding from Amicus Therapeutics, Fresenius Medical Care; having consultancy agreements with AstraZeneca, Bayer, Boehringer-Ingelheim, DaVita, Deerfield, Fresenius Medical Care, GoldfinchBio, Mantrabio, Novartis, and Retrophin; serving on the editorial board for Kidney International, and the advisory board for Nature Review Nephrology. M. Rinschen reports being a member of the renal editorial board for the American Journal of Physiology, and being an associate editor for JASN. Therefore, he was not involved in the peer-review process for this manuscript; a guest editor oversaw the peer-review and decision-making process for this manuscript. All remaining authors have nothing to disclose.
Funding
This work was supported by the Deutsche Forschungsgemeinschaft grants SFB1192 (Graduiertenkolleg to S. Skuza and C. Kosub), project B3 (to C. Meyer-Schwesinger), project B2 (to N.M. Tomas), project B8 (to T.B. Huber), Ri2811/1, and Ri2811/2 to (M.M. Rinschen); and Else Kröner-Fresenius-Stiftung (Else Kröner-Promotionskolleg Hamburg-Translationale Entzündungsforschung) and iPRIME to U. Wedekind. Work in M.M. Rinschen’s laboratory is supported by the Novo Nordisk Young Investigator Award, grant number NNF19OC0056043.
Supplementary Material
Acknowledgments
We are grateful to the st aff of the FACS Sorting Core Unit for excellent technical assistance. We thank the Advanced Light and Fluorescence Microscopy facility at the Centre for Structural Systems Biology, in particular, Dr. Roland Thünauer fo r support with light microscopy/image recording/image analysis, and Ruth Herzog and the Cologne proteomics facility (head Dr. Jan-Wilm Lackmann) for excellent technical assistance.
F.A. Hatje, U. Wedekind, J. Reichelt, L. Heintz, and S. Skuza developed the glomerular cell isolation technique, performed the experiments, and analyzed the data; D. Loreth performed the super-resolution structured illumination microscopy; C. Kosub performed the coimmunoprecipitations; S. Skuza performed the primary cell culture experiments; M.M. Rinschen and F. Demir performed the proteomic analyses; W. Sachs and M. Sachs performed the immunoblot and qPCR analyses; T.B. Huber provided the mT/mG mice; C. Meyer-Schwesinger developed the glomerular cell isolation technique, performed immunofluorescence and confocal microscopy, and analyzed the data; and F.A. Hatje, U. Wedekind, M.M. Rinschen, and C. Meyer-Schwesinger wrote the manuscript.
Data Sharing Statement
The raw data of the files are available at PRIDE/ProteomeXchange at https://www.ebi.ac.uk/pride/archive/login using the following tokens63,64: dataset, mT/mG dataset; project name, analysis of mouse glomerular cells; project accession, PXD016238; project DOI, not applicable; username, reviewer50821@ebi.ac.uk; password, UHUYumfS; dataset, different strains; project name, FACS-sorted podocytes, mesangial cells; project accession, PXD016237; project DOI, not applicable; username, reviewer27484@ebi.ac.uk; password, kQUh8pjC.
Supplemental Material
This article contains the following supplemental material online at http://jasn.asnjournals.org/lookup/suppl/doi:10.1681/ASN.2020091346/-/DCSupplemental.
Supplemental Appendix 1. Supplemental methods.
Supplemental Table 1. Antibodies and dyes used in the study for FACS sort.
Supplemental Table 2. Primers used in the study.
Supplemental Table 3. Podocyte-specific, endothelia specific and mesangial specific proteins that were significantly enriched over the other cell types in mt/mg mice.
Supplemental Table 4. Podocyte-specific, endothelia specific and mesangial specific proteins that were significantly enriched age, sex, and species in wildtype mice.
Supplemental Table 5. Alternative membrane proteins potentially useful for TimMEP in diseased glomeruli.
Supplemental Figure 1. Comparison of old and new gating strategy.
Supplemental Figure 2. UMAP analysis of FACS sorted glomerular cells.
Supplemental Figure 3. Non-labeled FACS sorted glomerular cells express nephron mRNA.
Supplemental Figure 4. Counts of isolated cells were comparable in between gender, species but not age
Supplemental Figure 5. Comparison of FACS-sort between mt/mg mice and wildtype mice.
Supplemental Figure 6. FACS-sorted glomerular cells are not contaminated with parietal epithelial or tubular cells.
Supplemental Figure 7. Tripartite cell type isolation and proteomic analysis from mt/mg mice.
Supplemental Figure 8. Identification of new podocyte enriched proteins.
Supplemental Figure 9. Identification of new mesangial cell enriched proteins.
Supplemental Figure 10. Identification of new glomerular endothelial cell enriched proteins.
Supplemental Figure 11. Integrin-b3 and its ligand fibronectin 1 are predominantly expressed on glomerular endothelial cells.
Supplemental Figure 12. Gating strategy used for the separation of glomerular cell types in the mouse model of anti-THSD7A membranous nephropathy.
Supplemental Figure 13. Leukocytes are not increased in glomeruli in the setting of experimental THSD7A-associated membranous nephropathy.
Supplemental Figure 14. THSD7A localizes closely to the slit diaphragm proteins Neph1 and nephrin.
Supplemental Figure 15. Differential loss of podocyte proteins in experimental THSD7A-associated membranous nephropathy.
References
- 1.Pavenstädt H, Kriz W, Kretzler M: Cell biology of the glomerular podocyte. Physiol Rev 83: 253–307, 2003 [DOI] [PubMed] [Google Scholar]
- 2.Dimke H, Maezawa Y, Quaggin SE: Crosstalk in glomerular injury and repair. Curr Opin Nephrol Hypertens 24: 231–238, 2015 [DOI] [PMC free article] [PubMed] [Google Scholar]
- 3.Takemoto M, Asker N, Gerhardt H, Lundkvist A, Johansson BR, Saito Y, et al. : A new method for large scale isolation of kidney glomeruli from mice. Am J Pathol 161: 799–805, 2002 [DOI] [PMC free article] [PubMed] [Google Scholar]
- 4.Wanner N, Hartleben B, Herbach N, Goedel M, Stickel N, Zeiser R, et al. : Unraveling the role of podocyte turnover in glomerular aging and injury. J Am Soc Nephrol 25: 707–716, 2014 [DOI] [PMC free article] [PubMed] [Google Scholar]
- 5.Boerries M, Grahammer F, Eiselein S, Buck M, Meyer C, Goedel M, et al. : Molecular fingerprinting of the podocyte reveals novel gene and protein regulatory networks. Kidney Int 83: 1052–1064, 2013 [DOI] [PubMed] [Google Scholar]
- 6.Koehler S, Kuczkowski A, Kuehne L, Jüngst C, Hoehne M, Grahammer F, et al. : Proteome analysis of isolated podocytes reveals stress responses in glomerular sclerosis. J Am Soc Nephrol 31: 544–559, 2020 [DOI] [PMC free article] [PubMed] [Google Scholar]
- 7.Muzumdar MD, Tasic B, Miyamichi K, Li L, Luo L: A global double-fluorescent Cre reporter mouse. Genesis 45: 593–605, 2007 [DOI] [PubMed] [Google Scholar]
- 8.Koehler S, Brähler S, Braun F, Hagmann H, Rinschen MM, Späth MR, et al. : Construction of a viral T2A-peptide based knock-in mouse model for enhanced Cre recombinase activity and fluorescent labeling of podocytes. Kidney Int 91: 1510–1517, 2017 [DOI] [PubMed] [Google Scholar]
- 9.Tomas NM, Meyer-Schwesinger C, von Spiegel H, Kotb AM, Zahner G, Hoxha E, et al. : A heterologous model of thrombospondin type 1 domain-containing 7A-associated membranous nephropathy. J Am Soc Nephrol 28: 3262–3277, 2017 [DOI] [PMC free article] [PubMed] [Google Scholar]
- 10.Meyer TN, Schwesinger C, Wahlefeld J, Dehde S, Kerjaschki D, Becker JU, et al. : A new mouse model of immune-mediated podocyte injury. Kidney Int 72: 841–852, 2007 [DOI] [PubMed] [Google Scholar]
- 11.Höhne M, Frese CK, Grahammer F, Dafinger C, Ciarimboli G, Butt L, et al. : Single-nephron proteomes connect morphology and function in proteinuric kidney disease. Kidney Int 93: 1308–1319, 2018 [DOI] [PubMed] [Google Scholar]
- 12.Rinschen MM: Single glomerular proteomics: A novel tool for translational glomerular cell biology. Methods Cell Biol 154: 1–14, 2019 [DOI] [PubMed] [Google Scholar]
- 13.Hughes CS, Moggridge S, Müller T, Sorensen PH, Morin GB, Krijgsveld J: Single-pot, solid-phase-enhanced sample preparation for proteomics experiments. Nat Protoc 14: 68–85, 2019 [DOI] [PubMed] [Google Scholar]
- 14.Rinschen MM, Gödel M, Grahammer F, Zschiedrich S, Helmstädter M, Kretz O, et al. : A multi-layered quantitative in vivo expression atlas of the podocyte unravels kidney disease candidate genes. Cell Rep 23: 2495–2508, 2018 [DOI] [PMC free article] [PubMed] [Google Scholar]
- 15.Cox J, Mann M: MaxQuant enables high peptide identification rates, individualized p.p.b.-range mass accuracies and proteome-wide protein quantification. Nat Biotechnol 26: 1367–1372, 2008 [DOI] [PubMed] [Google Scholar]
- 16.Cox J, Hein MY, Luber CA, Paron I, Nagaraj N, Mann M: Accurate proteome-wide label-free quantification by delayed normalization and maximal peptide ratio extraction, termed MaxLFQ. Mol Cell Proteomics 13: 2513–2526, 2014 [DOI] [PMC free article] [PubMed] [Google Scholar]
- 17.Tyanova S, Temu T, Sinitcyn P, Carlson A, Hein MY, Geiger T, et al. : The Perseus computational platform for comprehensive analysis of (prote)omics data. Nat Methods 13: 731–740, 2016 [DOI] [PubMed] [Google Scholar]
- 18.Szklarczyk D, Morris JH, Cook H, Kuhn M, Wyder S, Simonovic M, et al. : The STRING database in 2017: quality-controlled protein-protein association networks, made broadly accessible. Nucleic Acids Res 45: D362–D368, 2017 [DOI] [PMC free article] [PubMed] [Google Scholar]
- 19.Shannon P, Markiel A, Ozier O, Baliga NS, Wang JT, Ramage D, et al. : Cytoscape: A software environment for integrated models of biomolecular interaction networks. Genome Res 13: 2498–2504, 2003 [DOI] [PMC free article] [PubMed] [Google Scholar]
- 20.Rinschen MM, Palygin O, Guijas C, Palermo A, Palacio-Escat N, Domingo-Almenara X, et al. : Metabolic rewiring of the hypertensive kidney. Sci Signal 12: eaax9760, 2019 [DOI] [PMC free article] [PubMed] [Google Scholar]
- 21.Thomsen MC, Nielsen M: Seq2Logo: A method for construction and visualization of amino acid binding motifs and sequence profiles including sequence weighting, pseudo counts and two-sided representation of amino acid enrichment and depletion. Nucleic Acids Res 40: W281–W287, 2012 [DOI] [PMC free article] [PubMed] [Google Scholar]
- 22.Panzer U, Steinmetz OM, Reinking RR, Meyer TN, Fehr S, Schneider A, et al. : Compartment-specific expression and function of the chemokine IP-10/CXCL10 in a model of renal endothelial microvascular injury. J Am Soc Nephrol 17: 454–464, 2006 [DOI] [PubMed] [Google Scholar]
- 23.Abramoff MMP, Ram SJ: Image Processing with ImageJ. Biophotonics Int 11: 36–42, 2004 [Google Scholar]
- 24.Sosna J, Voigt S, Mathieu S, Kabelitz D, Trad A, Janssen O, et al. : The proteases HtrA2/Omi and UCH-L1 regulate TNF-induced necroptosis. Cell Commun Signal 11: 76, 2013 [DOI] [PMC free article] [PubMed] [Google Scholar]
- 25.Artelt N, Siegerist F, Ritter AM, Grisk O, Schlüter R, Endlich K, et al. : Comparative Analysis of podocyte foot process morphology in three species by 3D super-resolution microscopy. Front Med (Lausanne) 5: 292, 2018 [DOI] [PMC free article] [PubMed] [Google Scholar]
- 26.Siegerist F, Ribback S, Dombrowski F, Amann K, Zimmermann U, Endlich K, et al. : Structured illumination microscopy and automatized image processing as a rapid diagnostic tool for podocyte effacement. Sci Rep 7: 11473, 2017 [DOI] [PMC free article] [PubMed] [Google Scholar]
- 27.Kabgani N, Grigoleit T, Schulte K, Sechi A, Sauer-Lehnen S, Tag C, et al. : Primary cultures of glomerular parietal epithelial cells or podocytes with proven origin. PLoS One 7: e34907, 2012 [DOI] [PMC free article] [PubMed] [Google Scholar]
- 28.Lertkiatmongkol P, Liao D, Mei H, Hu Y, Newman PJ: Endothelial functions of platelet/endothelial cell adhesion molecule-1 (CD31). Curr Opin Hematol 23: 253–259, 2016 [DOI] [PMC free article] [PubMed] [Google Scholar]
- 29.Castrop H, Huang Y, Hashimoto S, Mizel D, Hansen P, Theilig F, et al. : Impairment of tubuloglomerular feedback regulation of GFR in ecto-5′-nucleotidase/CD73-deficient mice. J Clin Invest 114: 634–642, 2004 [DOI] [PMC free article] [PubMed] [Google Scholar]
- 30.Karaiskos N, Rahmatollahi M, Boltengagen A, Liu H, Hoehne M, Rinschen M, et al. : A single-cell transcriptome atlas of the mouse glomerulus. J Am Soc Nephrol 29: 2060–2068, 2018 [DOI] [PMC free article] [PubMed] [Google Scholar]
- 31.Bierzynska A, Soderquest K, Koziell A: Genes and podocytes - new insights into mechanisms of podocytopathy. Front Endocrinol (Lausanne) 5: 226, 2015 [DOI] [PMC free article] [PubMed] [Google Scholar]
- 32.Rinschen MM, Wu X, König T, Pisitkun T, Hagmann H, Pahmeyer C, et al. : Phosphoproteomic analysis reveals regulatory mechanisms at the kidney filtration barrier. J Am Soc Nephrol 25: 1509–1522, 2014 [DOI] [PMC free article] [PubMed] [Google Scholar]
- 33.Rinschen MM, Pahmeyer C, Pisitkun T, Schnell N, Wu X, Maaß M, et al. : Comparative phosphoproteomic analysis of mammalian glomeruli reveals conserved podocin C-terminal phosphorylation as a determinant of slit diaphragm complex architecture. Proteomics 15: 1326–1331, 2015 [DOI] [PMC free article] [PubMed] [Google Scholar]
- 34.Cerami E, Demir E, Schultz N, Taylor BS, Sander C: Automated network analysis identifies core pathways in glioblastoma. PLoS One 5: e8918, 2010 [DOI] [PMC free article] [PubMed] [Google Scholar]
- 35.Bishop P, Rubin P, Thomson AR, Rocca D, Henley JM: The ubiquitin C-terminal hydrolase L1 (UCH-L1) C terminus plays a key role in protein stability, but its farnesylation is not required for membrane association in primary neurons. J Biol Chem 289: 36140–36149, 2014 [DOI] [PMC free article] [PubMed] [Google Scholar]
- 36.Klamp T, Boehm U, Schenk D, Pfeffer K, Howard JC: A giant GTPase, very large inducible GTPase-1, is inducible by IFNs. J Immunol 171: 1255–1265, 2003 [DOI] [PubMed] [Google Scholar]
- 37.Herwig J, Skuza S, Sachs W, Sachs M, Failla AV, Rune G, et al. : Thrombospondin type 1 domain-containing 7A localizes to the slit diaphragm and stabilizes membrane dynamics of fully differentiated podocytes. J Am Soc Nephrol 30: 824–839, 2019 [DOI] [PMC free article] [PubMed] [Google Scholar]
- 38.Tomas NM, Beck LH Jr, Meyer-Schwesinger C, Seitz-Polski B, Ma H, Zahner G, et al. : Thrombospondin type-1 domain-containing 7A in idiopathic membranous nephropathy. N Engl J Med 371: 2277–2287, 2014 [DOI] [PMC free article] [PubMed] [Google Scholar]
- 39.Groffen AJ, Ruegg MA, Dijkman H, van de Velden TJ, Buskens CA, van den Born J, et al. : Agrin is a major heparan sulfate proteoglycan in the human glomerular basement membrane. J Histochem Cytochem 46: 19–27, 1998 [DOI] [PubMed] [Google Scholar]
- 40.Abrahamson DR, Prettyman AC, Robert B, St John PL: Laminin-1 reexpression in Alport mouse glomerular basement membranes. Kidney Int 63: 826–834, 2003 [DOI] [PubMed] [Google Scholar]
- 41.Eremina V, Baelde HJ, Quaggin SE: Role of the VEGF--a signaling pathway in the glomerulus: evidence for crosstalk between components of the glomerular filtration barrier. Nephron, Physiol 106: 32–37, 2007 [DOI] [PubMed] [Google Scholar]
- 42.Sea K, Sohn SH, Durazo A, Sheng Y, Shaw BF, Cao X, et al. : Insights into the role of the unusual disulfide bond in copper-zinc superoxide dismutase. J Biol Chem 290: 2405–2418, 2015 [DOI] [PMC free article] [PubMed] [Google Scholar]
- 43.Gupta V, Bamezai RN: Human pyruvate kinase M2: A multifunctional protein. Protein Sci 19: 2031–2044, 2010 [DOI] [PMC free article] [PubMed] [Google Scholar]
- 44.Chegary M, Brinke H, Ruiter JP, Wijburg FA, Stoll MS, Minkler PE, et al. : Mitochondrial long chain fatty acid beta-oxidation in man and mouse. Biochim Biophys Acta 1791: 806–815, 2009 [DOI] [PMC free article] [PubMed] [Google Scholar]
- 45.Grahammer F, Wigge C, Schell C, Kretz O, Patrakka J, Schneider S, et al. : A flexible, multilayered protein scaffold maintains the slit in between glomerular podocytes. JCI Insight 1: e86177, 2016 [DOI] [PMC free article] [PubMed] [Google Scholar]
- 46.Kuppe C, Perales-Patón J, Saez-Rodriguez J, Kramann R: Experimental and computational technologies to dissect the kidney at the single-cell level [published online ahead of print December 17, 2020]. Nephrol Dial Transplant [DOI] [PubMed] [Google Scholar]
- 47.Meyer-Schwesinger C, Meyer TN, Münster S, Klug P, Saleem M, Helmchen U, et al. : A new role for the neuronal ubiquitin C-terminal hydrolase-L1 (UCH-L1) in podocyte process formation and podocyte injury in human glomerulopathies. J Pathol 217: 452–464, 2009 [DOI] [PubMed] [Google Scholar]
- 48.Guhr SS, Sachs M, Wegner A, Becker JU, Meyer TN, Kietzmann L, et al. : The expression of podocyte-specific proteins in parietal epithelial cells is regulated by protein degradation. Kidney Int 84: 532–544, 2013 [DOI] [PubMed] [Google Scholar]
- 49.Rinschen MM, Huesgen PF, Koch RE: The podocyte protease web: Uncovering the gatekeepers of glomerular disease. Am J Physiol Renal Physiol 315: F1812–F1816, 2018 [DOI] [PubMed] [Google Scholar]
- 50.Clark JZ, Chen L, Chou CL, Jung HJ, Lee JW, Knepper MA: Representation and relative abundance of cell-type selective markers in whole-kidney RNA-Seq data. Kidney Int 95: 787–796, 2019 [DOI] [PMC free article] [PubMed] [Google Scholar]
- 51.Meyer-Schwesinger C, Dehde S, Klug P, Becker JU, Mathey S, Arefi K, et al. : Nephrotic syndrome and subepithelial deposits in a mouse model of immune-mediated anti-podocyte glomerulonephritis. J Immunol 187: 3218–3229, 2011 [DOI] [PubMed] [Google Scholar]
- 52.Randles MJ, Woolf AS, Huang JL, Byron A, Humphries JD, Price KL, et al. : Genetic background is a key determinant of glomerular extracellular matrix composition and organization. J Am Soc Nephrol 26: 3021–3034, 2015 [DOI] [PMC free article] [PubMed] [Google Scholar]
- 53.Raval N, Jogi H, Gondaliya P, Kalia K, Tekade RK: Cyclo-RGD truncated polymeric nanoconstruct with dendrimeric templates for targeted HDAC4 gene silencing in a diabetic nephropathy mouse model. Mol Pharm 18: 641–666, 2021 [DOI] [PubMed] [Google Scholar]
- 54.Wu J, Zheng C, Wang X, Yun S, Zhao Y, Liu L, et al. : MicroRNA-30 family members regulate calcium/calcineurin signaling in podocytes. J Clin Invest 125: 4091–4106, 2015 [DOI] [PMC free article] [PubMed] [Google Scholar]
- 55.Rinschen MM, Schroeter CB, Koehler S, Ising C, Schermer B, Kann M, et al. : Quantitative deep mapping of the cultured podocyte proteome uncovers shifts in proteostatic mechanisms during differentiation. Am J Physiol Cell Physiol 311: C404–C417, 2016 [DOI] [PubMed] [Google Scholar]
- 56.Schroeter CB, Koehler S, Kann M, Schermer B, Benzing T, Brinkkoetter PT, et al. : Protein half-life determines expression of proteostatic networks in podocyte differentiation. FASEB J 32: 4696–4713, 2018 [DOI] [PubMed] [Google Scholar]
- 57.Kliewe F, Kaling S, Lötzsch H, Artelt N, Schindler M, Rogge H, et al. : Fibronectin is up-regulated in podocytes by mechanical stress. FASEB J 33: 14450–14460, 2019 [DOI] [PubMed] [Google Scholar]
- 58.Wei C, El Hindi S, Li J, Fornoni A, Goes N, Sageshima J, et al. : Circulating urokinase receptor as a cause of focal segmental glomerulosclerosis. Nat Med 17: 952–960, 2011 [DOI] [PMC free article] [PubMed] [Google Scholar]
- 59.Wei C, Möller CC, Altintas MM, Li J, Schwarz K, Zacchigna S, et al. : Modification of kidney barrier function by the urokinase receptor. Nat Med 14: 55–63, 2008 [DOI] [PubMed] [Google Scholar]
- 60.Wu H, Kirita Y, Donnelly EL, Humphreys BD: Advantages of single-nucleus over single-cell RNA sequencing of adult kidney: Rare cell types and novel cell states revealed in fibrosis. J Am Soc Nephrol 30: 23–32, 2019 [DOI] [PMC free article] [PubMed] [Google Scholar]
- 61.Park J, Shrestha R, Qiu C, Kondo A, Huang S, Werth M, et al. : Single-cell transcriptomics of the mouse kidney reveals potential cellular targets of kidney disease. Science 360: 758–763, 2018 [DOI] [PMC free article] [PubMed] [Google Scholar]
- 62.Rinschen MM, Saez-Rodriguez J: The tissue proteome in the multi-omic landscape of kidney disease. Nat Rev Nephrol 17: 205–219, 2021 [DOI] [PubMed] [Google Scholar]
- 63.Perez-Riverol Y, Csordas A, Bai J, Bernal-Llinares M, Hewapathirana S, Kundu DJ, et al. : The PRIDE database and related tools and resources in 2019: Improving support for quantification data. Nucleic Acids Res 47: D442–D450, 2019 [DOI] [PMC free article] [PubMed] [Google Scholar]
- 64.Vizcaíno JA, Csordas A, Del-Toro N, Dianes JA, Griss J, Lavidas I, et al. : 2016 update of the PRIDE database and its related tools [published correction appears in Nucleic Acid Res 44: 11033, 2016 10.1093/nar/gkw880]. Nucleic Acids Res 44: D447–D456, 2016. 26527722 [Google Scholar]
Associated Data
This section collects any data citations, data availability statements, or supplementary materials included in this article.