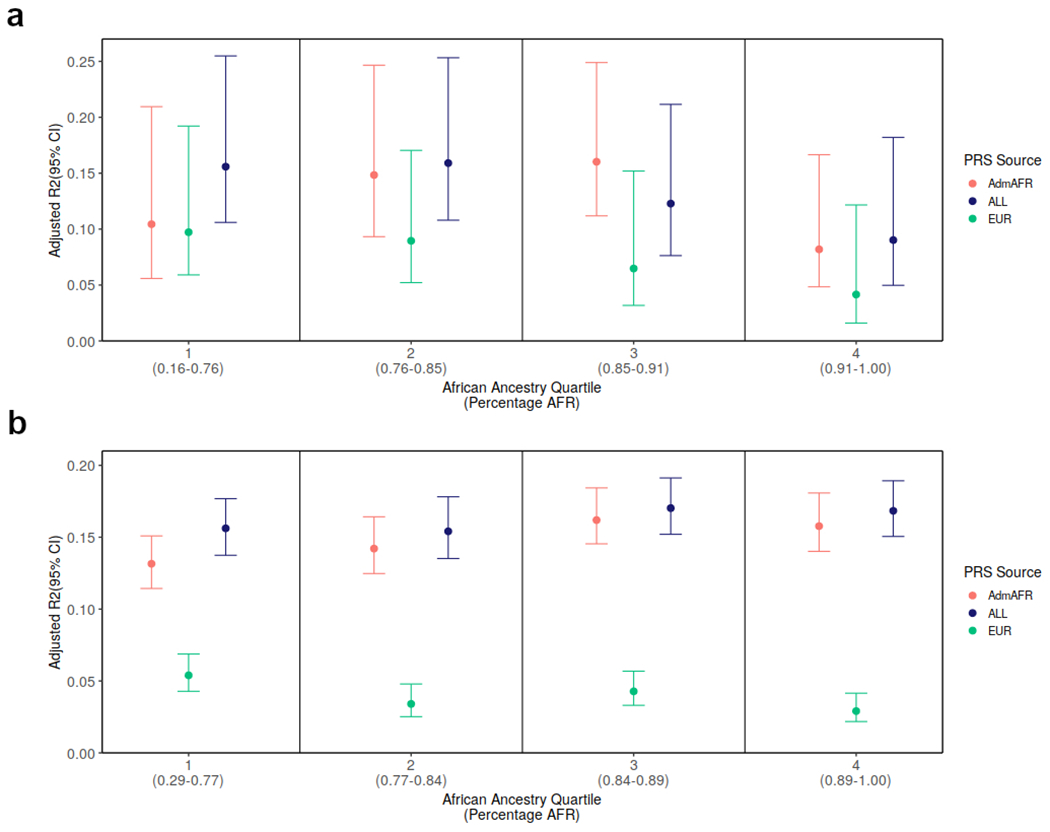
Extended Data Figure 8: Improvement in PRS performance in African Americans when starting with ancestry-mismatched European ancestry scores by updating weights, updating variant lists, or updating both variants and weights to be ancestry-matched.

By comparison to the gold-standard performance of the trans-ancestry-derived PRS in African Americans (adjusted R2 = 0.12), a European ancestry derived score capture only 47% of the variance explained by the trans-ancestry PRS. When LD and association information from the target population is used to optimize the list of variants for inclusion in the PRS, but with ancestry-mismatched weights from European ancestry GWAS, the variance explained reaches 71% of the gold standard. If the PRS variant list selected in European ancestry individuals were genotyped in the target population, and PRS weights were updated using a GWAS from the target population, the variance explained reached 87% of the gold standard. Finally, deriving both the marker list and weights from the target population (single-ancestry GWAS) explained 94% of the variance relative to the gold-standard trans-ancestry PRS.
