Abstract
Detection and diagnosis of congenital disorders is the principal aim of newborn screening (NBS) programs worldwide. Mass spectrometry (MS) has become the preferred primary testing method for high-throughput NBS sampling because of its speed and selectivity. However, the ever-increasing list of NBS biomarkers included in expanding panels creates unique analytical challenges for multiplexed MS assays due to isobaric/isomeric overlap and chimeric fragmentation spectra. Since isobaric and isomeric systems limit the diagnostic power of current methods and require costly follow-up exams due to many false-positive results, here, we explore the utility of ion mobility spectrometry (IMS) to enhance the accuracy of MS assays for primary (tier 1) screening. Our results suggest that ~400 IMS resolving power would be required to confidently assess most NBS biomarkers of interest in dried blood spots (DBSs) that currently require follow-up testing. While this level of selectivity is unobtainable with most commercially available platforms, the separations detailed here for a commercially available drift tube IMS (Agilent 6560 with high-resolution demultiplexing, HRdm) illustrate the unique capabilities of IMS to separate many diagnostic NBS biomarkers from interferences. Furthermore, to address the need for increased speed of NBS analyses, we utilized an automated solid-phase extraction (SPE) system for ~10 s sampling of simulated NBS samples prior to IMS-MS. This proof-of-concept work demonstrates the unique capabilities of SPE-IMS-MS for high-throughput sample introduction and enhanced separation capacity conducive for increasing speed and accuracy for NBS.
Graphical Abstract
Newborn screening (NBS) is an essential public health effort conducted on a global scale to detect, diagnose, and mitigate the effects of congenital disorders. Mandatory screening is performed on ~3.8 million newborns yearly in the United States, although the exact number and specificity of conditions assessed in each panel vary based on individual state guidelines.1,2 The Recommended Uniform Screening Panel (RUSP) currently suggests screening for a minimum of 60 disorders, though new candidate disorders are continually added due to novel analytical methods and improved treatment options. Adoption of new conditions by the RUSP requires: (1) the technical ability to screen for the disorder (appropriate analytical methods), (2) the condition must have an available effective treatment, and (3) a potential net-benefit must be possible for the child if diagnosed. Rapid detection and diagnosis of these diseases is therefore critical to lessen progression and mitigate detrimental effects, and as such, the development of novel analytical assays to improve both the selectivity and throughput of NBS methods is a continually developing process.
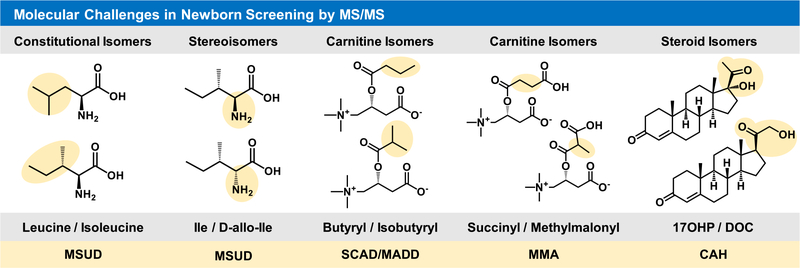
NBS methodology has greatly expanded since Robert Guthrie’s design of the bacteria inhibition assay for diagnosis of phenylketonuria (PKU) in the 1960s, and to date, techniques include enzyme assays, immunoassays, electrophoresis, PCR, and tandem mass spectrometry (MS/MS).3–5 Potential congenital disorders are initially assessed using a preliminary high-throughput screening method (tier 1), and samples which produce an out-of-range result maybe be further analyzed using more specific lower throughput methods (tier 2) prior to final diagnosis by the primary care physician and appropriate specialists. Thus, primary MS screens utilize flow-injection analysis (FIA-MS/MS) for the high-throughput sampling of NBS biomarkers and typically possess a duty cycle of ~2 min/sample. FIA-MS/MS screens for metabolic disorders, fatty acid oxidation disorders, and amino acid disorders by assessing the relative abundance of some 70 amino acids, acylcarnitines, and other small molecules in a multiplexed fashion where one analytical method is employed for the assessment of multiple disease states (list provided by the National Library of Medicine’s Newborn Screening Coding and Terminology Guide (https://lhncbc.nlm.nih.gov/newbornscreeningcodes/ and ES1)).6 While FIA-MS/MS methods have been transformative for NBS, they are susceptible to several experimental limitations including ion suppression, matrix effects, and isobaric/isomeric overlap, which complicate spectral interpretation of the MS/MS data and diagnosis of disease (see Figure 1).7 Furthermore, chromatographic separations are also used to address many shortcomings inherent to FIA and significantly reduce the number of false-positive tests; however, their increased analysis time is not conducive for screening all samples and hence is only utilized in confirmatory analysis (tier 2).7
Figure 1.
Molecular challenges in current newborn screening efforts by FIA-MS/MS. Chemical structures are illustrated in correlation with the associated NBS condition below each structural constraint. Abbreviated disorders are: maple syrup urine disease, MSUD; short chain acyl-CoA dehydrogenase deficiency, SCAD; multiple acyl-CoA dehydrogenase deficiency, MADD; methylmalonic acidemia, MMA; and congenital adrenal hyperplasia, CAH.
Ion mobility spectrometry (IMS) is a gas phase separation technique, which distinguishes molecules based on their size, shape, and charge.8,9 In IMS, ions are propagated through an inert gas under the influence of an electric field where each ion’s flight path and travel time are proportional to molecular size and surface area (an ion descriptor known as the collision cross-section, or CCS). IMS separations are extremely rapid (typically between 20 ms, 100 ms, and 1 s based on the platform used), and hence, IMS is readily nested into existing FIA screening methods and chromatographic approaches with MS detection (IMS-MS). Several IMS platforms have been developed, which vary in terms of electrode geometry and application of the electric field [e.g., drift tube (DTIMS), traveling wave (TWIMS), and trapped ion mobility spectrometry (TIMS)], and many reviews have characterized these differences in detail.10–13 Although there are many applications of IMS for macromolecular characterization such as protein folding and assessment of the tertiary structure,14,15 small molecule analysis IMS also provides several unique functions including complementary separation for isobars and isomers, drift time-aligned MS/MS spectra, and an additional structural molecular characteristic obtained with each feature for investigating unknown molecules.16 Here, we evaluate the inclusion of IMS to improve analytical selectivity of key isomeric and isobaric NBS targets in tier 1 screens as FIA methods require additional confirmatory testing from slower tier 2 methods. While IMS could certainly be utilized in both FIA and LC–MS-based workflows for enhanced separation of isobars/isomers, the advantages of IMS may be most prominent in flow-injection/high-throughput settings, and here, we focus on IMS as a separation mechanism distinct from chromatography in this assessment. The key objectives of this work are thus to obtain high confidence CCS values for as many NBS biomarkers as feasible for use in future NBS studies, assess IMS separation of isobars/isomers, which currently challenge NBS diagnostics, and perform a preliminary characterization of automated high-throughput sampling coupled with IMS-MS for potential screening capabilities.
EXPERIMENTAL SECTION
NBS Target Compounds.
Current MS/MS methods in newborn screening utilize a targeted list of disease biomarkers to rapidly detect individuals with potential congenital disorders. To assess the utility of IMS for NBS applications, we prioritized analytes currently screened by MS and potential isobaric/isomeric contributors that may interfere with MS detection. A concise listing of NBS analytes and measurements is detailed in the National Library of Medicine’s Newborn Screening Coding and Terminology Guide (https://lhncbc.nlm.nih.gov/newbornscreeningcodes/), which provides standardized nomenclature and abbreviations for translation across laboratories.6 NBS biomarkers encompass several molecular classes, and the NBS Coding and Terminology Guide denotes 30 amino acid and amino acid-like molecules and 41 acylcarnitines for characterization of amino acid disorders, fatty acid oxidation disorders, fatty acid oxidation-organic acid disorders, and organic acid disorders screened by MS/MS. Though endocrine disorders are currently evaluated with alternative methods such as immunoassay, their current low positive predictive value has generated interest in utilizing MS/MS to study six steroids denoted as biomarkers of interest.17,18 Noting the utility of these diagnostic biomarkers, we also performed a literature search for their previous IMS characterization and potential isobaric/isomeric contributors. The standard for the NBS biomarkers was then procured from MilliporeSigma (Burlington, MA) or Cayman Chemical (Ann Arbor, MI) if CCS values were not available within the McLean Lab CCS Compendium from Vanderbilt University.16,19,20 Internal standards (IS) of several isotopically labeled acylcarnitines (d3 variants) were also purchased to evaluate reproducibility and ion suppression. For an extensive list of all NBS biomarkers assessed in this work, see the Supporting Information Excel sheet ES1.
Ion Mobility Spectrometry–Mass Spectrometry (IMS-MS).
The DTIMS platform utilized in this work (Agilent 6560, Santa Clara, CA) has been extensively characterized in previous studies.21–23 Briefly, the instrument consists of an electrospray ionization source (Agilent Jet Stream), which ionizes the effluent from several introduction methods; here, we utilized either FIA (Agilent 1290) or an Agilent RapidFire 365. Positive mode ions were desolvated in a heated capillary and brought under rough vacuum via two ion funnels prior to mobility separation in a drift tube (78 cm). Ion packets are sequentially gated into the drift region filled with high purity nitrogen buffer gas (~4 Torr), which the ions traverse under the influence of a weak electric field (10–15 V/cm). Following mobility separation, ions are refocused by RF confinement in the rear funnel (~22 cm) prior to fragmentation in a CID cell (if activated) and a time-of-flight (TOF) mass analyzer, which operates at ~18,000 mass resolving power (m/Δm) for low m/z values in sensitivity mode. Extended IMS-MS settings are provided in the Supporting Information, Table S1.
RapidFire Automated SPE.
The Agilent RapidFire 365 platform is an automated solid-phase extraction (SPE) system, which performs rapid sample cleanup and injection. It can also be coupled with a MS platform for ~10 s sample-to-analyses, which have been utilized in various high-throughput bioanalytical applications.24–26 Specifically, the SPE system consists of three quaternary pumps, which sequentially load each sample onto the SPE cartridge, wash away chemical interferents, and elute the analytes of interest, respectively. SPE optimization of NBS targets examined seven unique cartridges (C18, C8, C4, cyano, phenyl, HILIC, and hypercarb), and the resulting parameters were utilized for subsequent simulated NBS sampling. Extended RapidFire settings are provided in the Supporting Information, Table S1.
CCS Values.
CCS values for NBS biomarkers were cataloged from the reference literature when available, and for analytes with no CCS values, standards were purchased and analyzed using the previously documented single-field method established in the interlaboratory study pioneered by Stow et al.27 Briefly, a series of calibrant ions with known CCS (Agilent tune mix) were analyzed prior to standards and simulated NBS samples. A calibration curve was generated for each day of experiments, which relates the measured drift time for each tune mix ion to the reference CCS value. For each standard, evaluated the drift time and other experimental information is input into the calibration curve and a corresponding CCS value is calculated. Standards not previously assessed were analyzed in triplicate, and the calculated CCS values possessed little deviation (typically <0.2% RSD). All CCS values are available for reference in the Supporting Information (Excel sheet ES1).
Data Processing.
All spectra were acquired using a pseudorandom 4-bit multiplexing sequence (“multiplexed mode”), which has been described in detail previously.28–30 Briefly, ion packets are sequentially gated into the drift tube at predetermined intervals and traverse the region as normal (e.g., eight packets are injected during one scan interval). The overlapping spectra are deconvoluted and combined postacquisition based on the pseudorandom gate timing using the PNNL PreProcessor software package (v.2021.04.21) developed at Pacific Northwest National Lab (PNNL, omics.pnl.gov).31 Extended settings for data deconvolution are provided in the Supporting Information (Figure S1) and are similar to those published previously.28,29
High-Resolution Demultiplexing (HRdm).
The IMS resolving power (Rp) of the Agilent 6560 operating either in the normal “single pulse” mode or multiplexed mode is ~60 Rp (CCS/ΔCCS) and has been rigorously characterized.22,23,32 Current efforts to improve IMS resolving power (equivalently, selectivity) of the current instrumentation are focused on postacquisition enhancement of raw data, a process termed “high-resolution demultiplexing” (HRdm), which has also been evaluated previously.29 The process utilizes a Hadamard transform to enhance the IMS spectra and is only available for use when data are collected in multiplexed mode.33 For this work we utilized a beta version of the HRdm software (v. 2.0_B45E) for enhancing IMS separation of isobars/isomers, and the detailed settings are provided in the Supporting Information (Figure S2). Our results indicate that the HRdm process improves the resolving power from ~60 to between 100 and 200, depending on the ion drift time and signal saturation.
Simulated NBS Samples.
Simulated NBS dried blood spots (DBSs) were created using sheep and bovine blood purchased from Hardy Diagnostics (Santa Maria, CA) via VWR International (Radnor, PA). Animal blood was preferred for this work due to the large volume of reproducible material, which could be obtained (50–100 mL), also enabling flexibility in experimental design and method development. Both blood samples were purchased as citrated to minimize variance in sample preparation. Seventy microliters of blood was pipetted onto Whatman 903 protein saver cards and allowed to dry for at least 3 h following previous guidance in the NBS literature.5,7 A 1/8″ (~3.2 mm) hole punch was taken from the center of each DBS and placed into a 1.5 mL Eppendorf tube and extracted with 120 μL of methanol spiked with isotopically labeled carnitine standards (deuterated d3 variants). Vials were sonicated for 30 min at ambient temperature, centrifuged, and the collected supernatant was transferred to 96-well plates for sampling by SPE-IMS-MS.
Skyline MS.
Skyline MS software (MacCoss Lab, Washington University) was utilized to comb the nontarget IMS-MS data for NBS analytes of interest (MS1 only).34,35 Skyline software provides intuitive drift time filtering of IMS-MS data for compounds with a characterized CCS value, effectively reducing chemical noise from near-mass neighbors and increasing confidence of peak integration (Supporting Information, Figure S3). A curated Excel spreadsheet containing all NBS target names, formulas, and CCS values is formatted for upload to Skyline MS as a target list and is provided in the Supporting Information (ES1).
RESULTS AND DISCUSSION
IMS Analyses of NBS Biomarkers.
Although there are increasing efforts to incorporate nontarget MS methods for characterizing congenital disorders36–38 and the number of conditions included in the RUSP is continually increasing, targeted screens are readily transferrable across laboratories, enhancing standardization and uniform assessment. While CCS values have been extensively characterized for amino acids and metabolites, steroids, and acylcarnitines are less established.16 To address this need, a comprehensive list of NBS biomarkers was created using the Newborn Screening Coding and Terminology Guide and several publications featuring novel MS methods for assessment of candidate NBS disorders.3,6,39–42 Each biomarker of interest was assessed for previous CCS values requiring us to experimentally evaluate 16 acylcarnitines and 5 steroids. These were then appended to biomarkers of interest noted in the Compendium, with our final compiled list including CCS values for 34 acylcarnitines, 8 steroids, 24 amino acids, and other metabolites, all of which are provided in the Excel sheet ES1.3,16,19,20,39,40 Resulting CCS values collected from each carnitine “subclass” (e.g., dicarboxylic acids, iso-carnitines, linear carnitines, trans-2 derivatives, and hydroxylated forms) possess their own respective trendlines when CCS values are plotted in comparison to m/z for each group, and these results are illustrated in Supporting Information Figure S4. For example, all carboxylated carnitines possess smaller CCS values for a given mass in comparison to linear or hydroxylated carnitines. Also, both iso-carnitines (C4 and C5) possess smaller CCS values than their linear counterparts, suggesting the branched form of each isomer is more compact than the linear extended form. This result is consistent with similar analyses of PFAS and leucine/isoleucine in previous studies.23,43 Similar CCS vs m/z trendlines have been highlighted previously for other biomolecular categories (e.g., carbohydrates, lipids, and peptides),21,44–46 and for subclasses of exogenous chemicals (e.g., per-and polyfluoroalkyl substances, PFAS).43 These trendlines however are extremely useful in assigning potential classes to unknown features.
Separation of Isobars/Isomers.
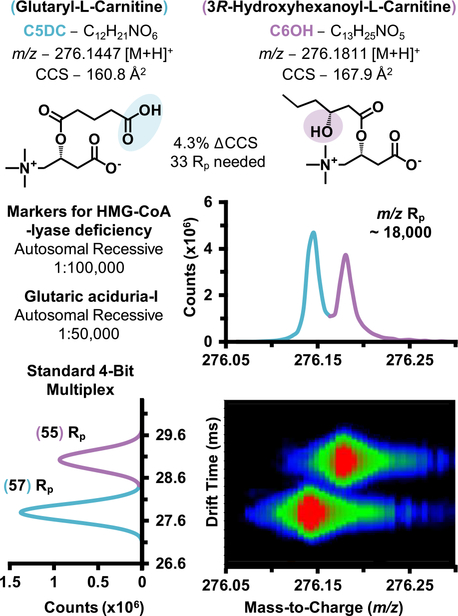
The increasing adoption of high-resolution accurate mass (HRAM) instrumentation has recently facilitated innovative approaches to fingerprint disease phenotypes with nontargeted data acquisition, particularly for biomarker discovery efforts.36,39,47 Pertaining to newborn screening, several recent publications have highlighted their increasing utility for separation of isobaric species (same nominal mass, different chemical formula, and corresponding exact mass), which are challenging to distinguish utilizing lower mass resolving power techniques (e.g., triple quadrupole platforms).48 For example, Pickens et al. recently demonstrated that the high-resolution analysis of Orbitrap data could base line resolve several carnitine isobars, including glutaryl carnitine (C5DC) and hydroxy hexanoyl carnitine (C6OH), solely by MS1.39 C5DC and C6OH are biomarkers for glutaric aciduria-I and 3-hydroxy-3-methylglutaric aciduria (HMG)-CoA lyase deficiency, both autosomal recessive disorders.5,41 IMS-MS analysis of these two isobars on the 6560 platform illustrate less mass resolving power (~18,000 m/(Δm), FWHM) compared to the Orbitrap analysis; however, the two isobars are well separated by IMS drift time due to the substantial difference in CCS (ΔCCS 4.3%, Figure 2). The IMS spectra described in Figure 2 utilize the standard demultiplexing algorithm (no HRdm enhancement) and are well separated at ~60 IMS resolving power.
Figure 2.
Experimental separation of isobars glutaryl-L-carnitine and 3R-hydroxyhexanoyl-L-carnitine by IMS-MS.
Utility of HRdm.
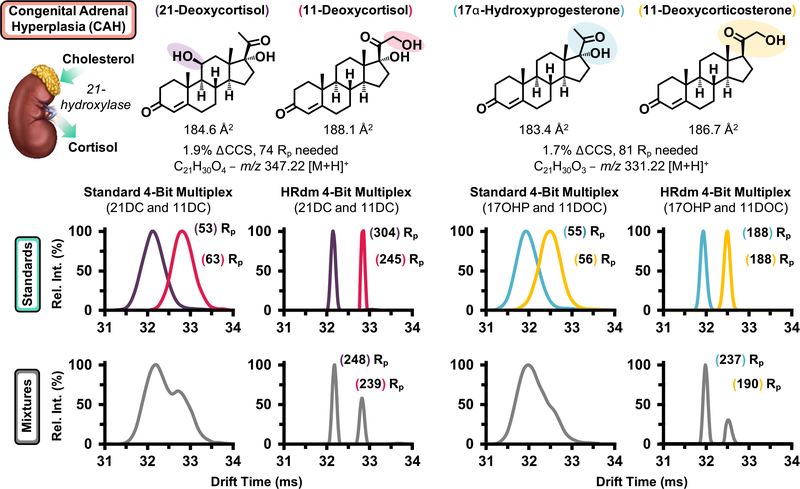
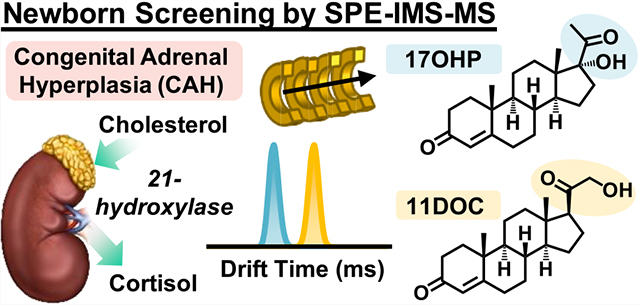
While the carnitine isobars highlighted in Figure 2 are baseline resolved with the 6560’s standard resolving power (~60), several isomer pairs surveyed in the NBS panel possess CCS differences below 2.0% and were indistinguishable in mixtures. Figure 3 highlights two pairs of steroid isomers, which are mechanistically associated with CAH, a collection of enzymatic disorders, which result in dysregulated hormone synthesis.49 CAH progression manifests in a variety of adverse outcomes including ambiguous physical development in females resulting from dysregulated androgen production and both sexes may exhibit life-threatening salt wasting through altered mineralocorticoid synthesis.50 Hence, while many CAH cases can be detected visually for females, routine testing for all newborns remains imperative. The rate of CAH in the United States is approximately 1:20,000, with variation across ethnic groups.50 The predominate form of CAH is characterized by a shortage of 21-hydroxylase, which converts 17α-hydroxyprogesterone (17OHP) to 11-deoxycortisol (11DOC) and progesterone to deoxycorticosterone.49 17OHP is the primary biomarker for CAH assessed by existing immunoassays; however, nonspecific binding of structurally similar steroids significantly decreases the predictive power of these methods for detecting disease with false-positive rates of CAH detection above 90%.17,18,49 Research endeavors utilizing LC–MS/MS have shown that monitoring several steroids concurrently such as 17OHP and 21-deoxycortisol (21DC) significantly improves the predictive power in CAH screening. While these LC–MS/MS methods are selective for the isomeric pairs described in Figure 3, their duty cycle approaches 6 min per sample and is not conducive to high-throughput screening. Since 21- and 11-deoxycortisol are constitutional isomers with differing sites of hydroxylation, they possess a ΔCCS of 1.9%. Standard 4-bit demultiplexing analysis for a mixture of the two isomers suggests the presence of two isomers at ~60 Rp (Figure 3, bottom left gray trace); however, utilization of the HRdm postprocessing algorithm improves the resolving power for each standard to >200 and baseline resolution of each compound is observed for the mixture. Corticosterone (an isomer of 11 and 21DC) was then added into the mixture with 21- and 11-deoxycortisol; however, corticosterone was inseparable from 11-deoxycortisol as these compounds possess a CCS difference of 0.5%, where ~300 Rp would be needed to resolve each compound at half-height (spectra provided in Figure S5). Similar results were noted for 17OHP and 11-deoxycorticosterone (ΔCCS 1.7%, Figure 3, right), where the standard IMS mode is unable to resolve a mixture of the two individual components, yet HRdm processing of the same data set provides unambiguous assessment of each isomeric contribution. Next, cortisone and aldosterone were analyzed by HRdm. The two isomers are separable to some degree but their relative quantitation is challenged by the presence of potentially two conformers for aldosterone (Figure S6).
Figure 3.
Steroid isomers related to the diagnosis of CAH. All structures are shown on top with flow injection of both the individual standards (middle) and mixtures (bottom gray traces) shown below. Drift spectra for both normal deconvolution (standard 4-bit multiplex) and high resolution (HRdm) are provided for comparing the two modes.
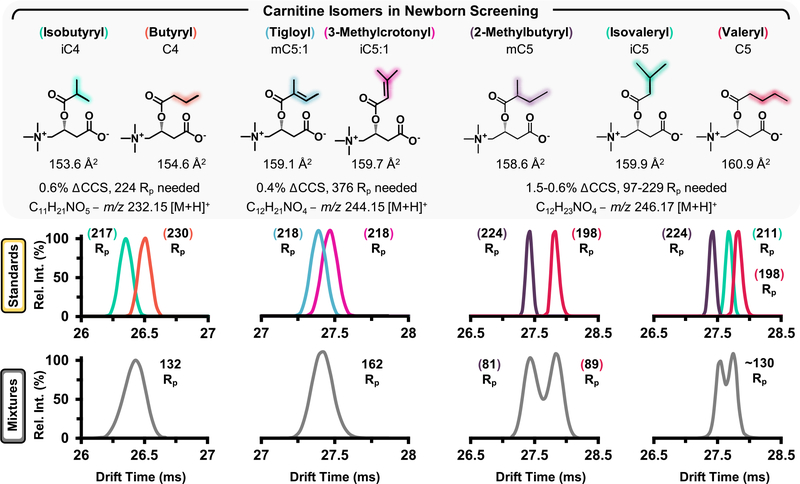
Noting the selectivity of HRdm for the steroid isomers, this process was further applied to characterize carnitine isomers, which were unresolvable in standard acquisition mode and the resulting HRdm spectra are highlighted in Figure 4. HRdm enhancement for the individual carnitine standards in each panel generates a uniform distribution for each analyte at ~200 Rp; however, the increased structural similarity of these compounds presents a significant analytical challenge. Isobutyryl and butyryl carnitine (iC4 and C4) possess a ΔCCS of 0.6% and require ~224 Rp to achieve half-height separation in a mixture (Figure 4, left). Although the HRdm process can approach this level of selectivity for individual components, the resulting mixture remains unresolvable and suggests the presence of multiple isomeric contributors (132 Rp, or a significantly broad peak compared to the individual standards). Tigloyl and 3-methylcrotonyl carnitine (mC5:1 and iC5:1, Figure 4, middle) are even more challenging to separate given their ΔCCS of 0.4%, which would require ~400 Rp to separate by IMS. While the methyl group rearrangement between 2-methylbutyryl and valeryl carnitine (mC5 and C5, respectively) provides sufficient structural difference to separate each isomer (Figure 4, right panel), HRdm is unable to resolve the 3-component mixture when isovaleryl carnitine is included in the assessment.
Figure 4.
Carnitine isomers and corresponding separation efficiencies as observed by IMS utilizing HRdm postprocessing. Individual standards were analyzed (colored traces, middle panes) prior to mixtures (gray traces).
Current Challenges for HRdm.
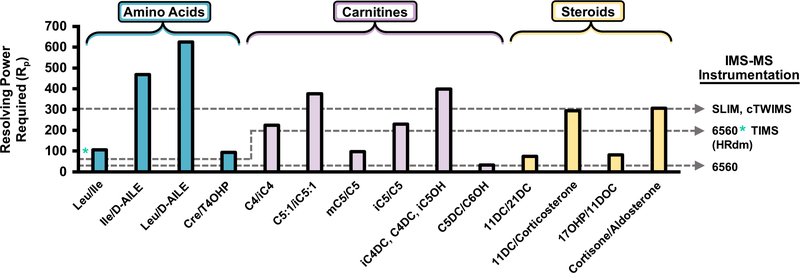
We emphasize that the spectra illustrated in this work were obtained using a beta version of the HRdm software, which is undergoing continual revisions and there are several technological limitations of the current method, which need to be addressed for future NBS applications. For example, smaller ions (typically <150 Da) suffer from decreased resolution enhancement compared to larger analytes (e.g., leucine and isoleucine ~80 Rp with HRdm opposed to ~200 Rp for larger carnitines and steroids as shown in Figure S7 and asterisk in Figure 5). This observation is a consequence of reduced data points for short drift times and has been previously described in detail by May et al.29 The number of data points sampled in the drift dimension of this work has also been increased 3× using the drift bin interpolation feature included in PNNL PreProcessor as noted in the Supporting Information, Figure S1. Lowering the drift tube entrance voltage (1174 V was utilized in this work) may also be advantageous as NBS analytes possess short drift times and enable longer temporal separation with HRdm; however, resolving power also decreases when the electric field is too low. In addition, minor data artifacts have been noted for saturated IMS signals or isomer separations with small differences in CCS values, as noted in Supporting Information Figure S5. The instrument function (IF) setting in the HRdm software may also be able to address this behavior and is currently being evaluated. At present, the HRdm software is continually being refined and these observations may be addressed in time as our current version (v.2.0_B45E) is substantiality improved over previous software iterations.29 In addition, the spectra generated via HRdm processing were acquired in neat solutions utilizing spiked isomer standards, and hence, endogenous compounds with similar mass/CCS to the analytes described may also challenge the data deconvolution and require further characterization in subsequent studies.
Figure 5.
Resolving power required to separate each isomer system in the NBS panel by IMS. IMS-MS instrumentation is provided for reference along with the corresponding level of resolving power. An asterisk denotes lower resolving power observed for small molecules in HRdm currently. The Rp required for separating the CCS value for aldosterone from cortisone is calculated using the average of two conformers as shown in Figure S6.
Need for Increased IMS Resolving Power and Other Challenges.
While the HRdm postprocessing illustrated in Figures 3 and 4 significantly improves IMS resolving power of the current DTIMS platform from ~60 to ~200, many NBS biomarkers possess potential isomeric interferences, which remain unresolvable in multicomponent mixtures despite the increased selectivity. The resolving power required to separate each NBS isobaric/isomeric system at half-heigh resolution is detailed in Figure 5. Separation of all NBS by IMS-MS alone would require >600 Rp, and commercially available systems are well below this threshold. However, several new IMS platforms are able to operate at ~200 Rp such as the TIMS instrument by Bruker Daltonics51,52 and several are performing well beyond 300 Rp including the structures for the Lossless Ion Manipulation (SLIM) platform from MOBILion53,54 and cyclic TWIMS for Waters Corporation.55 However, each IMS-MS platform possesses experimental tradeoffs (either time and/or sensitivity) to obtain increased resolving power, and several publications have described each of these devices extensively.10,13,32,52 We note that while the current cost of these research platforms typically approach 1 million USD, as new IMS instruments utilize more cost-effective components (e.g., printed circuit boards for voltage control and mobility regions), we expect these prices to decrease in the coming years.
RapidFire-IMS-MS of Simulated NBS.
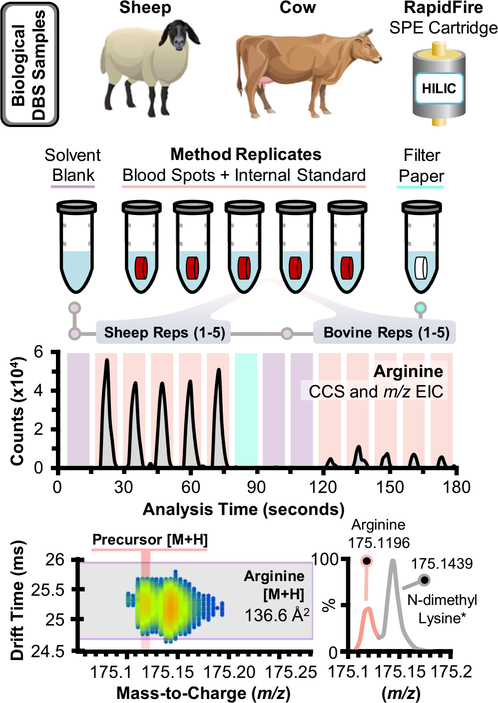
To illustrate the potential application of IMS-MS for newborn screening assays, the RapidFire automated SPE platform was interfaced with IMS-MS for ~10 s sample-to-sample analysis. Mixtures of amino acids and acylcarnitines were sequentially injected on each SPE cartridge to determine the cartridges of choice for each analyte (Figure S8). Analogous to chromatographic approaches, small polar metabolites (e.g., arginine and carnitine) preferred the HILIC SPE cartridge, while nonpolar analytes had optimal performance on nonpolar packing material (C8 and C18) and the “hypercarb” SPE cartridge. Hypercarb is described by Agilent as a porous graphitic carbon packing material, which interestingly provided the highest peak intensities for nonpolar analytes (e.g., phenylalanine and octanoyl carnitine) as assessed during method development. Noting these results, the HILIC and hypercarb cartridges were utilized for subsequent analysis of simulated NBS samples to assess NBS targets across a wide range of polarities. Although duplicate sampling via HILIC and hypercarb SPE cartridges was required for each sample, the 20 s cycle still represents a sixfold increase in sample throughput compared to current FIA-MS/MS methods (~2 min/sample). Bovine and sheep blood spiked with 11 isotopically labeled acylcarnitines at 10 ng/mL were then extracted as described in the Experimental Section, analyzed via SPE-IMS-MS, and the subsequent data were imported into Skyline using the target list provided in the Supporting Information (ES1). Sequential extraction replicates for bovine blood spots provided signal reproducibility ~20% RSD; however, normalization with isotopically labeled standards reduced variation to ≤10% RSD (Figure S9). The relative abundance of each NBS biomarker was also assessed in the simulated NBS samples and an illustrative example of SPE-IMS-MS data is provided in Figure 6 for arginine. Arginine, an NBS biomarker for arginase deficiency (relative occurrence estimated at 1:1,000,000), was observed in both bovine and sheep samples and the corresponding drift time filtered EICs are shown in Figure 6. Peak width per each injection is ~8 s wide, though this value can be modulated in the RapidFire’s elution timing and flow rate (here, 6000 ms and 0.6 mL/min, Table S1).25,26 The relative abundance of arginine is notably increased in the sheep samples compared to bovine blood despite similar levels of choline and heme for each (Supporting Information, Figure S10). A near-mass interferent was also noted in the DBS samples, which possessed a similar CCS to arginine; however, the difference of ~0.024 m/z between each signal was resolvable in the TOF. The measured m/z of this potential interferent is a 4 ppm match to C8H18N2O2 [M + H], which HMDB annotates as potentially N-dimethyl lysine, an α-amino acid. While the IMS-MS spectra of these signals possess some overlap, the mass and drift time filtering of Skyline ensures that only the signal from arginine is integrated for each sample (light red trace, bottom panel of Figure 6). Steroids were not observed in the simulated NBS samples, and this result is likely a byproduct of differing extraction solvents needed for their profiling (e.g., diethyl ether and acetone/acetonitrile)17,18,49 in comparison to profiling of fatty acid oxidation disorders and amino acid disorders that utilize water/methanol.5 We emphasize that the SPE-IMS-MS data illustrated here for the simulated NBS samples is a proof of concept for integrating IMS separations and rapid SPE sampling toward NBS testing. Further method validation criteria will be characterized in future studies using human NBS samples on a significantly larger scale to evaluate positive predictive values in comparison to current techniques.
Figure 6.
Processing and data analysis of simulated NBS samples assayed with SPE-IMS-MS. Dried blood spots collected from bovine and sheep blood were extracted in conjunction with solvent blanks and a clean filter punch after each set of DBS replicates. An example drift time filtered EIC is shown for protonated arginine, which was mass-separated from a near-mass interferent, tentatively annotated as N-dimethyl lysine (asterisk)*.
CONCLUSIONS
Overall, preliminary results from this study suggest that enhancing NBS methods via IMS-MS would require ~400 IMS resolving power and ~40,000 mass resolving power for separation of isobaric and isomeric NBS targets. The high-resolution demultiplexing algorithm increased IMS resolving power from ~60 to near 200 depending on the analyte and was able to separate several NBS isobars/isomers, which currently limit the predictive power of NBS assays. In addition, emerging IMS technology from several manufacturers (e.g., SLIM, cTWIMS, and TIMS) is rapidly approaching the needed level of selectivity for routine isobar/isomer separations, and these results present an exciting opportunity to incorporate IMS separations into future NBS testing and better diagnose additional conditions.
Supplementary Material
ACKNOWLEDGMENTS
This work was funded, in part, by grants from the National Institutes of Health (P30 ES025128, P42 ES027704, and P42 ES031009) and a cooperative agreement with the United States Environmental Protection Agency (STAR RD 84003201). The IMS-MS measurements were carried out in the Molecular Education, Technology and Research Innovation Center (METRIC) at North Carolina State University.
Footnotes
The authors declare no competing financial interest.
ASSOCIATED CONTENT
Supporting Information
The Supporting Information is available free of charge at https://pubs.acs.org/doi/10.1021/acs.analchem.1c04267.
IMS-MS settings, PNNL PreProcessor settings, HRdm settings and Skyline IMS illustration, carnitine subclass trendlines, steroid isomers (11 and 21-deoxycortisol and corticosterone, cortisone, and aldosterone), Leu/Ile/trans 4-OHP and CRE separations, SPE cartridge selectivity for the Agilent RapidFire, RapidFire reproducibility and normalization, RapidFire reproducibility for analytes noted in simulated NBS samples, and SPE-IMS-MS characterization (PDF)
Skyline MS upload and list, NBS target lists, and CCS values (ES1) (XLSX)
Contributor Information
James N. Dodds, Department of Chemistry, North Carolina State University, Raleigh, North Carolina 27695, United States.
Erin S. Baker, Department of Chemistry, North Carolina State University, Raleigh, North Carolina 27695, United States.
REFERENCES
- (1).Sweetman L; Millington DS; Therrell BL; Hannon WH; Popovich B; Watson MS; Mann MY; Lloyd-Puryear MA; van Dyck PC Pediatrics 2006, 117, S308. [DOI] [PubMed] [Google Scholar]
- (2).Kemper AR; Green NS; Calonge N; Lam WKK; Comeau AM; Goldenberg AJ; Ojodu J; Prosser LA; Tanksley S; Bocchini JA Jr. Genet. Med. 2014, 16, 183–187. [DOI] [PubMed] [Google Scholar]
- (3).Sahai I; Marsden D Crit. Rev. Clin. Lab. Sci. 2009, 46, 55–82. [DOI] [PubMed] [Google Scholar]
- (4).Levy HL Int. J. Neonat. Screen. 2021, 7, 1–5. [DOI] [PMC free article] [PubMed] [Google Scholar]
- (5).la Marca G J. Pharm. Biomed. Anal. 2014, 101, 174–182. [DOI] [PubMed] [Google Scholar]
- (6).Downs SM; van Dyck PC; Rinaldo P; McDonald C; Howell RR; Zuckerman A; Downing G J. Am. Med. Inform. Assoc. 2010, 17, 13–18. [DOI] [PMC free article] [PubMed] [Google Scholar]
- (7).la Marca G; Malvagia S; Pasquini E; Innocenti M; Donati MA; Zammarchi E Clin. Chem. 2007, 53, 1364–1369. [DOI] [PubMed] [Google Scholar]
- (8).Gabelica V; Afonso C; Barran PE; Benesch JLP; Bleiholder C; Bowers MT; Bilbao A; Bush MF; Campbell JL; D. G. Campuzano I; Causon TJ; Clowers BH; Creaser C; De Pauw E; Far J; Fernandez-Lima F; Fjeldsted JC; Giles K; Groessl M; Hogan CJ Jr.; Hann S; Kim HI; Kurulugama RT; May JC; McLean JA; Pagel K; Richardson K; Ridgeway ME; Rosu F; Sobott F; Shvartsburg AA; Thalassinos K; Valentine SJ; Wyttenbach T Mass Spectrom. Rev. 2019, 38, 291–320. [DOI] [PMC free article] [PubMed] [Google Scholar]
- (9).Kanu AB; Dwivedi P; Tam M; Matz L; Hill HH J. Mass Spectrom. 2008, 43, 1–22. [DOI] [PubMed] [Google Scholar]
- (10).Dodds JN; Baker ES J. Am. Soc. Mass Spectrom. 2019, 30, 2185–2195. [DOI] [PMC free article] [PubMed] [Google Scholar]
- (11).Cumeras R; Figueras E; Davis CE; Baumbach JI; Gràcia I Analyst 2015, 140, 1376–1390. [DOI] [PMC free article] [PubMed] [Google Scholar]
- (12).Cumeras R; Figueras E; Davis CE; Baumbach JI; Gràcia I Analyst 2015, 140, 1391–1410. [DOI] [PMC free article] [PubMed] [Google Scholar]
- (13).May JC; McLean JA Anal. Chem. 2015, 87, 1422–1436. [DOI] [PMC free article] [PubMed] [Google Scholar]
- (14).Jurneczko E; Barran PE Analyst 2011, 136, 20–28. [DOI] [PubMed] [Google Scholar]
- (15).May JC; Jurneczko E; Stow SM; Kratochvil I; Kalkhof S; McLean JA Int. J. Mass Spectrom. 2018, 427, 79–90. [DOI] [PMC free article] [PubMed] [Google Scholar]
- (16).Nichols CM; Dodds JN; Rose BS; Picache JA; Morris CB; Codreanu SG; May JC; Sherrod SD; McLean JA Anal. Chem. 2018, 90, 14484–14492. [DOI] [PMC free article] [PubMed] [Google Scholar]
- (17).Janzen N; Peter M; Sander S; Steuerwald U; Terhardt M; Holtkamp U; Sander J J. Clin. Endocrinol. Metab. 2007, 92, 2581–2589. [DOI] [PubMed] [Google Scholar]
- (18).Janzen N; Sander S; Terhardt M; Steuerwald U; Peter M; Das AM; Sander J Steroids 2011, 76, 1437–1442. [DOI] [PubMed] [Google Scholar]
- (19).Picache JA; Rose BS; Balinski A; Leaptrot KL; Sherrod SD; May JC; McLean JA Chem. Sci. 2019, 10, 983–993. [DOI] [PMC free article] [PubMed] [Google Scholar]
- (20).Picache JA; May JC; McLean JA ACS Omega 2020, 5, 980–985. [DOI] [PMC free article] [PubMed] [Google Scholar]
- (21).May JC; Goodwin CR; Lareau NM; Leaptrot KL; Morris CB; Kurulugama RT; Mordehai A; Klein C; Barry W; Darland E; Overney G; Imatani K; Stafford GC; Fjeldsted JC; McLean JA Anal. Chem. 2014, 86, 2107–2116. [DOI] [PMC free article] [PubMed] [Google Scholar]
- (22).May JC; Dodds JN; Kurulugama RT; Stafford GC; Fjeldsted JC; McLean JA Analyst 2015, 140, 6824–6833. [DOI] [PMC free article] [PubMed] [Google Scholar]
- (23).Dodds JN; May JC; McLean JA Anal. Chem. 2017, 89, 952–959. [DOI] [PMC free article] [PubMed] [Google Scholar]
- (24).Zhang X; Romm M; Zheng X; Zink EM; Kim Y-M; Burnum-Johnson KE; Orton DJ; Apffel A; Ibrahim YM; Monroe ME; Moore RJ; Smith JN; Ma J; Renslow RS; Thomas DG; Blackwell AE; Swinford G; Sausen J; Kurulugama RT; Eno N; Darland E; Stafford G; Fjeldsted J; Metz TO; Teeguarden JG; Smith RD; Baker ES Clin. Mass Spectrom. 2016, 2, 1–10. [DOI] [PMC free article] [PubMed] [Google Scholar]
- (25).Leveridge M; Buxton R; Argyrou A; Francis P; Leavens B; West A; Rees M; Hardwicke P; Bridges A; Ratcliffe S; Chung C-W J. Biomol. Screen. 2013, 19, 278–286. [DOI] [PubMed] [Google Scholar]
- (26).Gordon LJ; Allen M; Artursson P; Hann MM; Leavens BJ; Mateus A; Readshaw S; Valko K; Wayne GJ; West A J. Biomol. Screen. 2015, 21, 156–164. [DOI] [PubMed] [Google Scholar]
- (27).Stow SM; Causon TJ; Zheng X; Kurulugama RT; Mairinger T; May JC; Rennie EE; Baker ES; Smith RD; McLean JA; Hann S; Fjeldsted JC Anal. Chem. 2017, 89, 9048–9055. [DOI] [PMC free article] [PubMed] [Google Scholar]
- (28).Causon TJ; Si-Hung L; Newton K; Kurulugama RT; Fjeldsted J; Hann S Anal. Bioanal. Chem. 2019, 411, 6265–6274. [DOI] [PubMed] [Google Scholar]
- (29).May JC; Knochenmuss R; Fjeldsted JC; McLean JA Anal. Chem. 2020, 92, 9482–9492. [DOI] [PubMed] [Google Scholar]
- (30).Reisdorph R; Michel C; Quinn K; Doenges K; Reisdorph N. In Ion Mobility-Mass Spectrometry: Methods and Protocols; Paglia G; Astarita G, Eds.; Springer US: New York, NY, 2020, pp. 55–78. [DOI] [PubMed] [Google Scholar]
- (31).Bilbao A; Gibbons BC; Stow SM; Kyle JE; Bloodsworth KJ; Payne SH; Smith RD; Ibrahim YM; Baker ES; Fjeldsted JC J. Proteome Res. 2021, DOI: 10.1021/acs.jproteome.1c00425. [DOI] [PMC free article] [PubMed] [Google Scholar]
- (32).Dodds JN; May JC; McLean JA Anal. Chem. 2017, 89, 12176–12184. [DOI] [PMC free article] [PubMed] [Google Scholar]
- (33).Groessl M; Graf S; Knochenmuss R Analyst 2015, 140, 6904–6911. [DOI] [PubMed] [Google Scholar]
- (34).MacLean B; Tomazela DM; Shulman N; Chambers M; Finney GL; Frewen B; Kern R; Tabb DL; Liebler DC; MacCoss MJ Bioinformatics 2010, 26, 966–968. [DOI] [PMC free article] [PubMed] [Google Scholar]
- (35).MacLean BX; Pratt BS; Egertson JD; MacCoss MJ; Smith RD; Baker ES J. Am. Soc. Mass Spectrom. 2018, 29, 2182–2188. [DOI] [PMC free article] [PubMed] [Google Scholar]
- (36).Courraud J; Ernst M; Svane Laursen S; Hougaard DM; Cohen AS J. Mol. Neurosci. 2021, 71, 1378–1393. [DOI] [PMC free article] [PubMed] [Google Scholar]
- (37).Knottnerus SJG; Pras-Raves ML; van der Ham M; Ferdinandusse S; Houtkooper RH; Schielen PCJI; Visser G; Wijburg FA; de Sain-van der Velden MGM Biochim. Biophys. Acta 2020, 1866, No. 165725. [DOI] [PubMed] [Google Scholar]
- (38).Liu N; Xiao J; Gijavanekar C; Pappan KL; Glinton KE; Shayota BJ; Kennedy AD; Sun Q; Sutton VR; Elsea SH JAMA Netw. Open 2021, 4, e2114155–e2114155. [DOI] [PMC free article] [PubMed] [Google Scholar]
- (39).Pickens CA; Petritis K Anal. Chim. Acta 2020, 1120, 85–96. [DOI] [PMC free article] [PubMed] [Google Scholar]
- (40).Miller MJ; Kennedy AD; Eckhart AD; Burrage LC; Wulff JE; Miller LAD; Milburn MV; Ryals JA; Beaudet AL; Sun Q; Sutton VR; Elsea SH J. Inherit. Metab. Dis. 2015, 38, 1029–1039. [DOI] [PMC free article] [PubMed] [Google Scholar]
- (41).Ozben T Clin. Chem. Lab. Med. 2013, 51, 157–176. [DOI] [PubMed] [Google Scholar]
- (42).Hubbard WC; Moser AB; Liu AC; Jones RO; Steinberg SJ; Lorey F; Panny SR; Vogt RF; Macaya D; Turgeon CT; Tortorelli S; Raymond GV Mol. Genet. Metab. 2009, 97, 212–220. [DOI] [PubMed] [Google Scholar]
- (43).Dodds JN; Hopkins ZR; Knappe DRU; Baker ES Anal. Chem. 2020, 92, 4427–4435. [DOI] [PMC free article] [PubMed] [Google Scholar]
- (44).Leaptrot KL; May JC; Dodds JN; McLean JA Nat. Commun. 2019, 10, 985. [DOI] [PMC free article] [PubMed] [Google Scholar]
- (45).Paglia G; Angel P; Williams JP; Richardson K; Olivos HJ; Thompson JW; Menikarachchi L; Lai S; Walsh C; Moseley A; Plumb RS; Grant DF; Palsson BO; Langridge J; Geromanos S; Astarita G Anal. Chem. 2015, 87, 1137–1144. [DOI] [PMC free article] [PubMed] [Google Scholar]
- (46).Hines KM; May JC; McLean JA; Xu L Anal. Chem. 2016, 88, 7329–7336. [DOI] [PMC free article] [PubMed] [Google Scholar]
- (47).Petrick L; Edmands W; Schiffman C; Grigoryan H; Perttula K; Yano Y; Dudoit S; Whitehead T; Metayer C; Rappaport S Metabolomics 2017, 13, 27. [DOI] [PMC free article] [PubMed] [Google Scholar]
- (48).Marshall AG; Hendrickson CL; Shi SD-H Anal. Chem. 2002, 74, 252A–259A. [DOI] [PubMed] [Google Scholar]
- (49).de Hora MR; Heather NL; Patel T; Bresnahan LG; Webster D; Hofman PL Clin. Endocrinol. 2021, 94, 904–912. [DOI] [PubMed] [Google Scholar]
- (50).Pass KA; Neto EC Endocrinol. Metab. Clin. North Am. 2009, 38, 827–837. [DOI] [PubMed] [Google Scholar]
- (51).Liu FC; Ridgeway ME; Park MA; Bleiholder C Analyst 2018, 143, 2249–2258. [DOI] [PubMed] [Google Scholar]
- (52).Ridgeway ME; Lubeck M; Jordens J; Mann M; Park MA Int. J. Mass Spectrom. 2018, 425, 22–35. [Google Scholar]
- (53).Deng L; Ibrahim YM; Baker ES; Aly NA; Hamid AM; Zhang X; Zheng X; Garimella SVB; Webb IK; Prost SA; Sandoval JA; Norheim RV; Anderson GA; Tolmachev AV; Smith RD ChemistrySelect 2016, 1, 2396–2399. [DOI] [PMC free article] [PubMed] [Google Scholar]
- (54).Wojcik R; Nagy G; Attah IK; Webb IK; Garimella SVB; Weitz KK; Hollerbach A; Monroe ME; Ligare MR; Nielson FF; Norheim RV; Renslow RS; Metz TO; Ibrahim YM; Smith RD Anal. Chem. 2019, 91, 11952–11962. [DOI] [PMC free article] [PubMed] [Google Scholar]
- (55).Giles K; Ujma J; Wildgoose J; Pringle S; Richardson K; Langridge D; Green M Anal. Chem. 2019, 91, 8564–8573. [DOI] [PubMed] [Google Scholar]
Associated Data
This section collects any data citations, data availability statements, or supplementary materials included in this article.


