Abstract
Cells from multicellular organisms are dependent upon exogenous signals for survival, growth, and proliferation. The relationship among these three processes was examined using an interleukin-3 (IL-3)-dependent cell line. No fixed dose of IL-3 determined the threshold below which cells underwent apoptosis. Instead, increasing growth factor concentrations resulted in progressive shortening of the G1 phase of the cell cycle and more rapid proliferative expansion. Increased growth factor concentrations also resulted in proportional increases in glycolytic rates. Paradoxically, cells growing in high concentrations of growth factor had an increased susceptibility to cell death upon growth factor withdrawal. This susceptibility correlated with the magnitude of the change in the glycolytic rate following growth factor withdrawal. To investigate whether changes in the availability of glycolytic products influence mitochondrion-initiated apoptosis, we artificially limited glycolysis by manipulating the glucose levels in the medium. Like growth factor withdrawal, glucose limitation resulted in Bax translocation, a decrease in mitochondrial membrane potential, and cytochrome c redistribution to the cytosol. In contrast, increasing cell autonomous glucose uptake by overexpression of Glut1 significantly delayed apoptosis following growth factor withdrawal. These data suggest that a primary function of growth factors is to regulate glucose uptake and metabolism and thus maintain mitochondrial homeostasis and enable anabolic pathways required for cell growth. Consistent with this hypothesis, expression of the three genes involved in glucose uptake and glycolytic commitment, those for Glut1, hexokinase 2, and phosphofructokinase 1, was found to rapidly decline to nearly undetectable levels following growth factor withdrawal.
Tissue homeostasis in multicellular organisms is attained by a balance between the rate of cell proliferation and that of cell death. The competition for limiting amounts of exogenous factors has been shown to regulate cell proliferation, growth, and survival, and this competition has been proposed as a mechanism to determine tissue size (5, 16). The extracellular environment of most cells within a multicellular organism contains an ample supply of nutrients. Under physiological conditions, cell growth and proliferation are not limited by the extracellular availability of resources. It has been proposed that bioenergetics are not directly coupled to most cellular processes but are instead regulated homeostatically to maintain a steady-state ATP/ADP ratio. However, several papers documenting declines in cellular ATP/ADP ratios and in mitochondrial potential suggest that cells fail to maintain either ATP production or electron transport in the absence of growth factors (17, 22, 26).
Most evidence points to the mitochondria as the site of apoptosis initiation in response to growth factor withdrawal. Loss of integrity in the outer mitochondrial membrane leads to redistribution of cytochrome c into the cytosol, where it forms a caspase 9-activating complex in association with Apaf-1 and dATP (13). The molecular mechanisms by which outer mitochondrial membrane integrity is compromised remain controversial. Antiapoptotic Bcl-2 proteins, such as Bcl-xL, facilitate continued metabolite exchange across the outer mitochondrial membrane, prevent cytochrome c release, and promote cell survival despite the declines in ATP/ADP ratios and in mitochondrial potential that accompany growth factor withdrawal (22). In contrast, proapoptotic Bcl-2 proteins, such as Bax, have been reported to translocate to the mitochondria, impairing mitochondrial function and promoting cytochrome c release.
Control of cell survival by growth factors may be achieved either through the inhibition of apoptosis or through the active promotion of cell survival. Extensive work has documented that growth factors inhibit the activation of proapoptotic factors. However, the molecular mechanisms by which growth factors can promote cell survival are less well understood. Here, we report that growth factors require sustained glucose metabolism to promote cell survival. Reductions in growth factor availability result in coordinate decreases in cell size and glycolysis and increases in cell cycle time. Surprisingly, cells growing in low concentrations of growth factors are less sensitive to cell death induced by growth factor withdrawal. The ability of cytokines to rescue cells from death upon interleukin-3 (IL-3) withdrawal correlates with the ability to sustain glycolysis. Limiting glucose availability restricts the ability of growth factors to maintain cellular viability and results in cell death. Cell death caused by reduced availability of glucose is initiated by mitochondrial changes that result in cytochrome c release, events that resemble the commitment to cell death following growth factor withdrawal. The expression of Bcl-xL promotes cell survival through its ability to promote continued mitochondrial function, despite an otherwise lethal decrease in glycolysis. The overexpression of Glut1 can significantly delay the onset of apoptosis in response to growth factor withdrawal, indicating that intracellular glucose availability is an important determinant in the commitment to programmed cell death. Furthermore, we find that the failure of cells to maintain an effective mitochondrial potential in response to growth factor withdrawal results from a decline in the availability of electron transport substrates and coincides with a decline in the expression of the genes that control glucose uptake and glycolytic commitment. Thus, in the absence of growth factors, it appears that IL-3-dependent cells are unable to take up sufficient nutrients to maintain bioenergetic homeostasis.
MATERIALS AND METHODS
Cell culture and induction of apoptosis.
The murine (pro-B-cell) FL5.12 cell line was cultured in RPMI 1640 (Gibco)–10% fetal bovine serum–10 mM HEPES–50 μM 2-mercaptoethanol–50 U of penicillin/ml–50 μg of streptomycin/ml supplemented with Wehi-3B cell supernatant or recombinant murine IL-3 (R&D Systems) at various concentrations. Wehi-3B cell supernatant was obtained as described previously, and the amount of IL-3 was quantitated by an enzyme-linked immunosorbent assay (Pharmingen). When needed, previously described neomycin (control)- and Bcl-xL-transfected cells were used (3). The caspase inhibitor zVAD-fmk was used at 100 μM (Enzyme Systems Products). FL5.12 cells expressing the murine erythropoietin (Epo) receptor (EpoR) and human platelet-derived growth factor (PDGF) receptor (PDGF-R) β were generated by retroviral transduction by standard protocols using pLXSN-derived constructs. Rat Glut1 cDNA (a gift from Morris Birnbaum, University of Pennsylvania) was cloned into pSFFV and transfected into FL5.12 cells. Vector control cells were generated at the same time, and representative clones expressing the appropriate receptor were identified by flow cytometry.
For Glut1 staining, cells were fixed in 1% paraformaldehyde, permeabilized in 0.3% saponin, and stained with rabbit anti-Glut1 polyclonal antibody (Research Diagnostics) followed by goat anti-rabbit immunoglobulin conjugated to fluorescein. Unless indicated otherwise, cells were cultured for a minimum of 1 week with various concentrations of IL-3 prior to use in experiments. When needed, recombinant Epo (Pharmingen) was used at a concentration of 0.8 ng/ml, and recombinant human PDGF-BB (R&D Systems) was used at a concentration of 20 ng/ml.
For glucose withdrawal studies, media were prepared as described above using glucose-free RPMI 1640 and dialyzed fetal bovine serum (Gibco) and supplemented with glucose and recombinant IL-3 to achieve the desired concentrations. For growth factor withdrawal, cells were washed three times in RPMI 1640 prior to resuspension in appropriate media. For glucose withdrawal, cells were washed twice in glucose-free media prior to resuspension in media with glucose at various concentrations. Cell viability was determined by propidium iodide exclusion using flow cytometry as described previously (3).
Cell size and cell cycle analysis.
Cell count and cell size data were obtained using a Coulter Z2 particle analyzer. Cell cycle profiles of ethanol-fixed cells were obtained by resuspending cell pellets in 3.8 mM sodium citrate–0.125 mg of RNase A/ml–0.01 mg of propidium iodide/ml and analyzing the samples with a FACSCalibur flow cytometer (Becton Dickinson). Cell cycle statistics were determined using the Flowjo DNA analysis platform (Tree Star). To measure the rate of bromodeoxyuridine (BrdU) incorporation, cells were cultured in medium supplemented with 10 μM BrdU (Sigma). At various times, cells were fixed in ice-cold 75% ethanol. Cells were stained with mouse anti-BrdU and goat anti-mouse immunoglobulin G antibodies (Pharmingen) according to the manufacturer's protocol. The samples were washed and resuspended in phosphate-buffered saline (PBS) containing 10 μg of propidium iodide/ml and analyzed by flow cytometry. To measure cell size in the distinct phases of the cell cycle, cells were pelleted and resuspended in PBS containing 10 μg of Hoechst 33342 (Molecular Probes)/ml. Following a 30-min incubation at 37°C, cells were analyzed with an LSR flow cytometer (Becton Dickinson). G1, S, and G2 gates were drawn, and mean forward scatter within each gate was determined three times.
Measurement of oxygen consumption.
Cellular oxygen consumption rates were measured with a respirometer consisting of a water-jacketed (37°C) anaerobic chamber (2-ml volume) fitted with a polarographic oxygen electrode as described previously (20). The electrode was calibrated with a humidified gas mixture containing known oxygen tensions immediately prior to use. A magnetic stirrer within the respirometer kept the cells in suspension. The respirometer was functionally airtight, so that the oxygen tension of the mixture decreased linearly with time as the cells consumed dissolved oxygen. When needed, carbonyl cyanide p-(trifluoromethoxy)phenylhydrazone (FCCP) (Sigma) was added directly to cells in the respirometer at a concentration of 5 μM.
Measurement of NADH.
FL5.12 cells were cultured in the presence or absence of IL-3 for 12 h, washed in Krebs buffer (115 mM NaCl, 2 mM KCl, 25 mM NaHCO3, 1 mM MgCl2, 2 mM CaCl2, 0.25% bovine serum albumin [pH 7.4]; equilibrated with 5% CO2), and resuspended in Krebs buffer–10 mM glucose. NADH fluorescence was measured with a Fluoromax 2 spectrofluorometer (Jobin Yvon-Spex) set to an excitation wavelength of 340 ± 2.5 nm and a detection wavelength of 461 ± 2.5 nm. Fluorescence was measured for 400 s before and after the addition of 5 μM FCCP to the cuvette. The ability of FCCP to decrease mitochondrial NADH was confirmed by the ability of rotenone treatment to reverse the FCCP-mediated decline in NADH.
Measurement of glycolysis.
Glycolysis was measured by monitoring the conversion of 5-3H-glucose to 3H2O, as described previously (14). Briefly, 106 cells were washed once in PBS prior to resuspension in 1 ml of Krebs buffer and incubation for 30 min at 37°C. Cells were then pelleted, resuspended in 0.5 ml of Krebs buffer containing glucose (10 mM, if not specified), and spiked with 10 μCi of 5-3H-glucose. Following incubation for 1 h at 37°C, triplicate 50-μl aliquots were transferred to uncapped PCR tubes containing 50 μl of 0.2 N HCl, and a tube was transferred to a scintillation vial containing 0.5 ml of H2O such that the water in the vial and the contents of the PCR tube were not allowed to mix. The vials were sealed, and diffusion was allowed to occur for a minimum of 24 h. The amounts of diffused and undiffused 3H were determined by scintillation counting. Appropriate 3H-glucose-only and 3H2O-only controls were included, enabling the calculation of 3H2O in each sample and thus the rate of glycolysis, as described previously (1).
Mitochondrial membrane potential.
Cells were cultured for 6 h in complete medium containing 0.02 mM glucose or lacking IL-3. Tetramethylrhodamine ethyl ester (TMRE) was added to the cells at a final concentration of 200 nM, and cells were incubated for an additional 30 min at 37°C. TMRE fluorescence was measured by flow cytometry.
Cytochrome c redistribution and Bax activation.
Subcellular fractionation and Western blotting were performed using anti-cytochrome c monoclonal antibody 7H8.2C12 (Pharmingen) and anti-cytochrome oxidase subunit IV monoclonal antibody 20E8-C12 (Molecular Probes, Eugene, Oreg.) as described previously (23). Bax conformation was assessed by adding 2% 3-[(3-cholamidopropyl)-dimethylammonio]-1-propanesulfonate (CHAPS) to purified mitochondria and immunoprecipitating Bax from the resulting lysates with conformation-sensitive antibody N20 (Santa Cruz), followed by N20 immunoblotting (10).
Northern blot analysis.
Total RNA was prepared by purification over cesium chloride, and its integrity was assessed on 1% agarose gels. Five micrograms of each RNA sample was separated on 1.5% agarose gels containing 1% formaldehyde (J. T. Baker) and transferred to nylon ZetaProbe GT membranes (Bio-Rad) using 10× SSC (1× SSC is 0.15 M NaCl plus 0.015 M sodium citrate). Glut1 and hexokinase 2 probes were derived from plasmids provided by Morris Birnbaum (University of Pennsylvania) and Daryl Granner (Vanderbilt University), respectively. A phosphofructokinase 1 (PFK-1) probe was prepared from Image Clone 533677 (Research Genetics). β-Actin and α-tubulin probes were prepared by PCR. All probes were radiolabeled by nick translation.
RESULTS
Cellular proliferation, growth, and metabolism are responsive to growth factor availability.
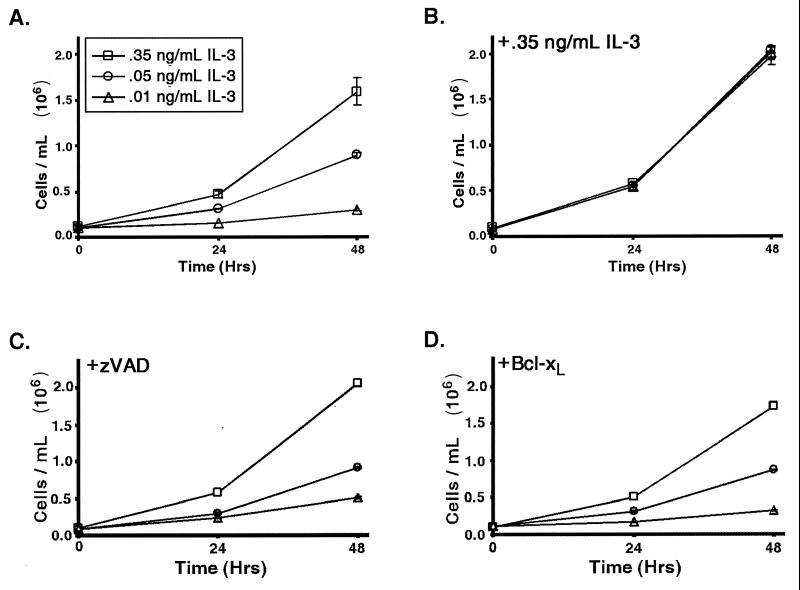
FL5.12 cells are nontransformed murine hematopoietic cells that are dependent on IL-3 for their survival and proliferation. When FL5.12 cells are withdrawn from IL-3, they die by apoptosis. However, a wide range of IL-3 concentrations are capable of sustaining cell survival. To determine the ability of cells to survive and/or grow at different levels of growth factor, the rate of cell accumulation in cultures adapted to growth in the presence of different amounts of IL-3 was measured. The rate of cell accumulation was proportional to the amount of growth factor in the culture (Fig. 1A). To confirm that this response was not the result of genetic variants selected for by continuous culturing with different amounts of growth factor, cells grown with different levels of growth factor were cultured with the highest level of growth factor for 1 day, and the rate of accumulation of cells was measured. When the cells were switched to culturing with the same high level of growth factor, the rates of cell accumulation observed were indistinguishable (Fig. 1B).
FIG. 1.
Cell proliferation is responsive to the availability of growth factor. (A) Cells were cultured in medium containing the indicated amounts of IL-3. After gradual adaptation of at least 1 week to defined levels of IL-3, cells were plated at equivalent densities; the numbers of cells in the culture were measured at the indicated times. A graph of the mean cell number (and one standard error of the mean [SEM]) over time is shown. (B) Cells cultured as described for panel A were switched to medium containing 0.35 ng of IL-3/ml for 1 day, and the numbers of cells were determined at the indicated times. The mean cell number (and SEM) over time is shown. (C) Cells were cultured with different amounts of IL-3 as described for panel A but with the addition of the caspase inhibitor zVAD-fmk. The mean cell numbers (and SEM) at the indicated times are shown. (D) Cells expressing increased levels of Bcl-xL were cultured in different amounts of IL-3 as described for panel A. The mean cell numbers (and SEM) at the indicated times are shown.
In addition to effects on cell proliferation and growth, growth factors also prevent cell death. Therefore, it was possible that cells accumulated more slowly in cultures with lower growth factor concentrations because of increased susceptibility of the cells to apoptosis. However, FL5.12 cells maintained a viability of greater than 90% in cultures at all three growth factor concentrations shown in Fig. 1. To confirm that apoptosis does not contribute to differences in proliferation and growth, the responses of cells expressing the antiapoptotic protein Bcl-xL and cells treated with the caspase inhibitor zVAD-fmk to different concentrations of growth factor were assessed. Like control cells, cells protected by either Bcl-xL or the caspase inhibitor responded to lower concentrations of growth factor with a decreased rate of proliferation (Fig. 1C and D). This result suggests that cell death is not responsible for the reduced cell accumulation observed in cells upon growth factor limitation.
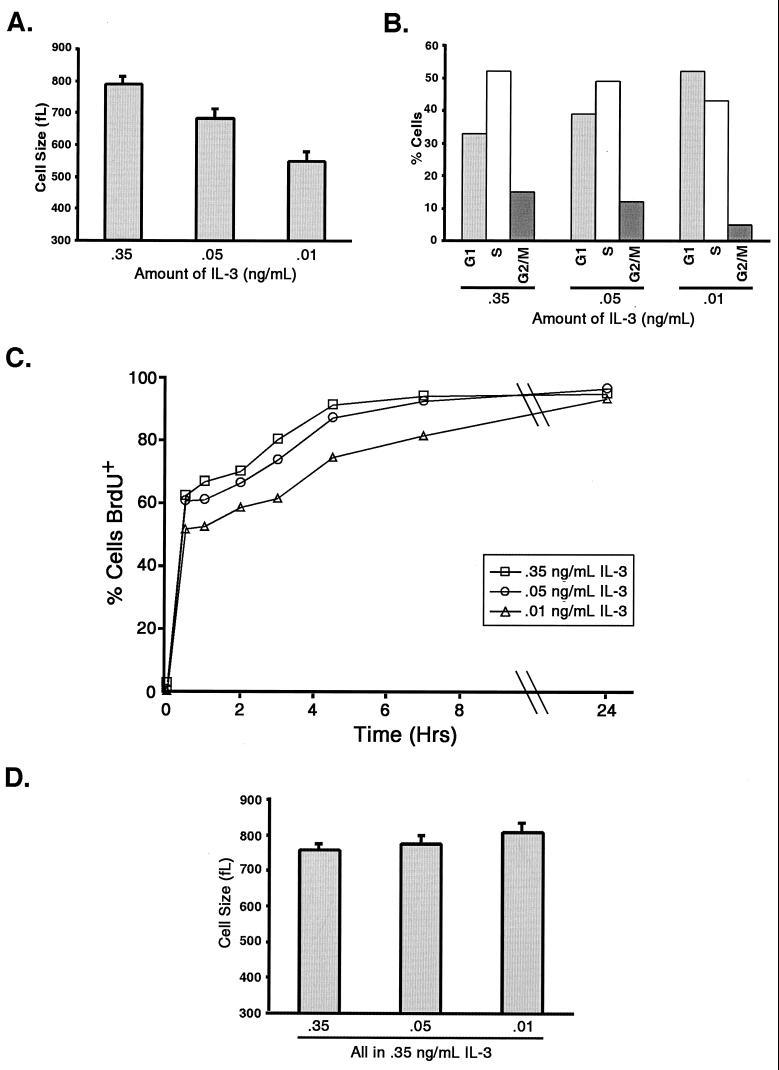
To assess the effects of IL-3 on individual cell growth, the sizes of cells cultured continuously with different amounts of growth factor were assessed. Like the proliferation rate, cell size was also decreased in proportion to the amount of growth factor present (Fig. 2A). Decreases in cell size could be explained by a reduction in the number of cells progressing through the cell cycle. To explore this possibility, cell cycle analysis was performed using propidium iodide and BrdU incorporation. S-phase and G2/M-phase cells were detected at all concentrations of growth factor, although the percentage of non-G0/G1-phase cells decreased with decreasing concentrations of growth factor (Fig. 2B). While it took cells growing with smaller amounts of growth factor a longer time to incorporate BrdU, greater than 90% of the cells incorporated BrdU within 24 h (Fig. 2C). This result suggests that essentially all of the cells cultured with even the smallest amount of growth factor are cycling, although the cells grown with less growth factor require more time to complete each cell cycle. Further analysis of the cell cycle in live cells stained with Hoechst 33342 indicates that the differences in cell size are reflected in all stages of the cell cycle (Table 1). Switching cells cultured with low concentrations of growth factor to high concentrations of growth factor for 1 day resulted in their growth to the same sizes, indicating that the cells retain the ability to grow in response to increased IL-3 (Fig. 2D).
FIG. 2.
Cell growth and cell cycle progression are decreased as growth factor becomes limiting. (A) The volumes of cells cultured in medium containing the indicated amounts of IL-3 were measured using a Coulter Z2 particle analyzer. The mean cell volume (and standard error of the mean [SEM]) is shown. (B) The cell cycle characteristics of cells growing in medium containing the indicated amounts of IL-3 were determined by propidium iodide staining and flow cytometry. The number of cells in each phase of the cell cycle is shown. (C) Cells growing with the indicated amounts of IL-3 were cultured in the presence of BrdU. Cells were fixed at the indicated times, and the percentages of cells incorporating BrdU in immunostained samples were determined by flow cytometry. The percentages of BrdU-positive (BrdU+) cells in the culture over time are shown. (D) Cells cultured in medium containing different amounts of IL-3 were switched to medium containing 0.35 ng of IL-3/ml. The mean cell volume (and SEM) after 1 day in culture with the increased IL-3 concentration is shown.
TABLE 1.
Mean forward scatter for cells growing with decreasing concentrations of growth factor
| Phase | Mean ± SD forward scatter at the indicated IL-3 concn (ng/ml)a
|
||
|---|---|---|---|
| 0.35 | 0.05 | 0.01 | |
| G1 | 597 ± 2.8 | 489 ± 4.2 | 477 ± 4.9 |
| S | 680 ± 4.0 | 592 ± 4.6 | 584 ± 4.1 |
| G2/M | 752 ± 1.5 | 683 ± 1.6 | 669 ± 1.6 |
Data are from three determinations. Values for forward scatter are in arbitrary units.
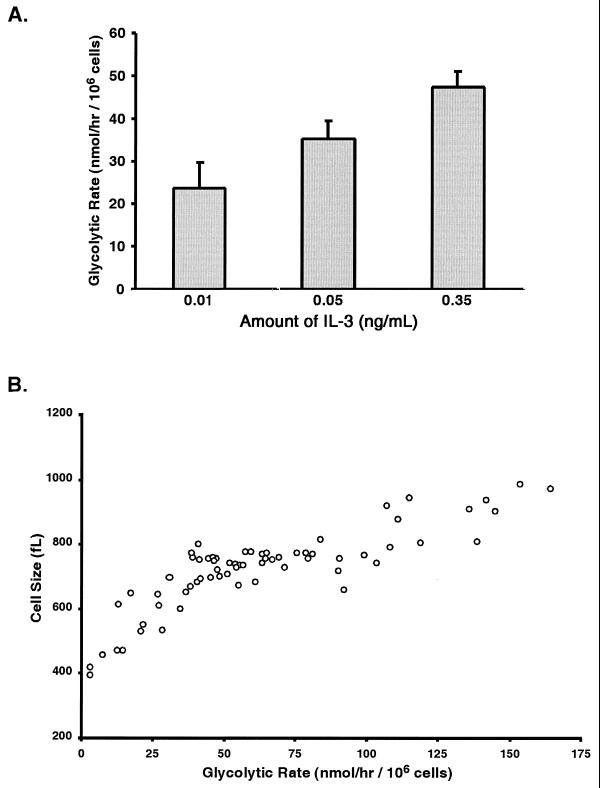
The ability of IL-3 to induce a concentration-dependent increase in cell size correlates with the ability of IL-3 to stimulate glycolysis in a dose-dependent fashion (Fig. 3A). Further analysis of glycolytic rates and cellular size was performed using data acquired in over 50 separate measurements of glycolysis and cell size (Fig. 3B). The cell size was found to increase in proportion to the glycolytic rate of the cells.
FIG. 3.
The rate of glycolysis correlates with both the amount of growth factor present and cell size. (A) The rates of glycolysis in cells growing with the indicated amounts of IL-3 were determined by measuring the conversion of 5-3H-glucose to 3H-H2O. The mean glycolytic rate (and standard error of the mean) is shown. (B) The glycolytic rates and cell volumes from multiple independent determinations are shown. A positive correlation between cell size and the rate of glycolysis was identified (P < 0.01).
Cells growing with higher concentrations of growth factor are more susceptible to death following growth factor withdrawal.
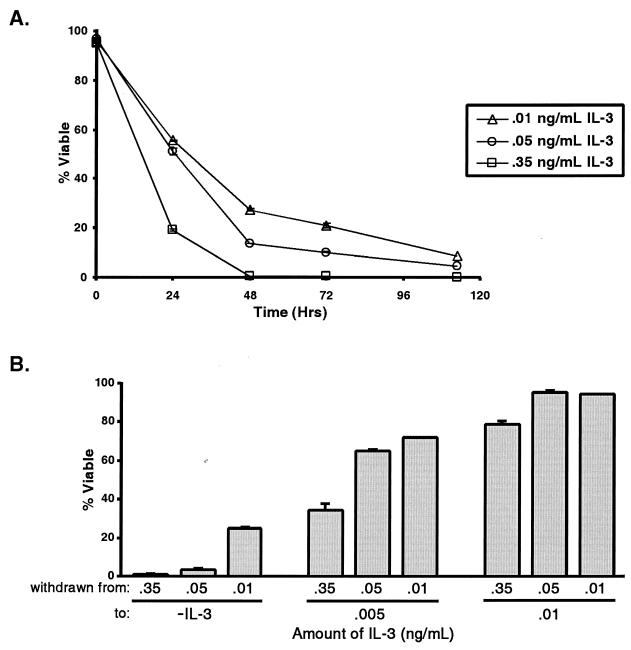
It has been proposed that growth factors promote cell survival by inhibiting an innate cell death program (16). This notion suggests that the apoptotic program in cells cultured with lower levels of growth factor should be less inhibited, rendering the cells more sensitive to growth factor withdrawal. However, cells cultured continuously with lower levels of growth factor are less sensitive to death following growth factor withdrawal than cells grown with higher levels of growth factor (Fig. 4A). In addition, acute changes in the concentration of growth factor result in cell death, even when the remaining growth factor is sufficient to sustain cell growth and survival when growth factor concentrations are lowered gradually (Fig. 4B). This result suggests that cells are sensitive to abrupt changes in the amount of growth factor present and not simply to the absolute concentration of available growth factor.
FIG. 4.
Cells cultured with larger amounts of growth factor are more susceptible to cell death following growth factor withdrawal. (A) Cells cultured with the indicated amounts of IL-3 were withdrawn from growth factor, and cell viability was measured by propidium iodide exclusion using flow cytometry. The mean viability (and standard error of the mean [SEM]) following growth factor withdrawal over time is shown. (B) Cells growing in medium supplemented with the indicated amounts of IL-3 (withdrawn from:) were washed and switched directly to medium containing the indicated amounts of IL-3 (to:) (−IL-3 indicates no IL-3). The mean cell viability (and SEM) after 48 h of growth factor limitation is shown.
It has been reported that growth factor signaling regulates cell growth and survival in the G0/G1 phase of the cell cycle and that, once past the G1 phase, cells are committed to a round of division and are no longer dependent on the presence of growth factors for their survival until they reenter G0/G1 (8, 15). These notions suggest that the rate of cell death following growth factor withdrawal may appear lower in cells exposed to less growth factor because they are cycling more slowly. However, even in the culture with the lowest concentration of growth factor, essentially all of the cells completed a cycle within 24 h (Fig. 2C). Additionally, the cultures growing with the lowest concentration of growth factor had the greatest proportion of cells in G0/G1, indicating that cell cycle position alone does not determine susceptibility to cell death (Fig. 2B). Cell cycle analysis of cells after 24 h of growth factor withdrawal indicated that >95% of cells had arrested in G0/G1, regardless of the starting growth factor concentration in the deprived culture (data not shown). Despite this finding, significant percentages of the cells grown at lower concentrations of IL-3 were still alive at 48 h and later, while cells grown at high concentrations of IL-3 were dead. Therefore, differences in cell cycle position between cells cultured in different concentrations of growth factor are not sufficient to explain their different susceptibilities to death following growth factor withdrawal.
Mitochondria are affected by the decreased rate of glycolysis that occurs following growth factor withdrawal.
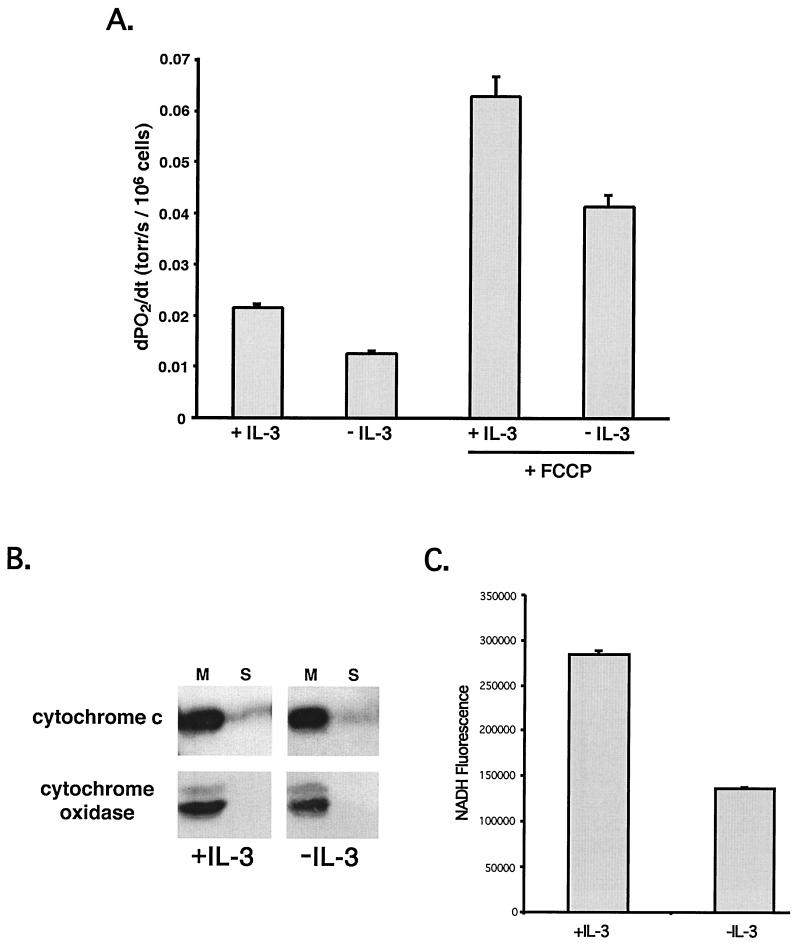
Alterations in mitochondrial physiology have been suggested to be critical events for the commitment to death following growth factor withdrawal. Measurement of oxygen consumption following 12 h of growth factor withdrawal revealed that oxygen consumption was decreased, indicating a reduction in electron transport (Fig. 5A). To determine if electron transport was limited by substrates, the rates of oxygen consumption in the presence and absence of growth factor were measured in the presence of the protonophore FCCP. FCCP acts to uncouple electron transport from ATP synthesis such that the rate of electron transport is limited by substrate availability. Oxygen consumption in the presence of FCCP was reduced following growth factor withdrawal, suggesting that mitochondria functionally experience a limitation in substrates following growth factor withdrawal. The reduced rate of oxygen consumption was not due to a redistribution of cytochrome c, which was still retained within mitochondria at this time (Fig. 5B).
FIG. 5.
Mitochondria experience a limitation in substrate availability following growth factor withdrawal. (A) Oxygen consumption in cells cultured for 12 h in the presence (+IL-3) or absence (−IL-3) of IL-3 was measured, and the measurement of oxygen consumption was performed before and after (+FCCP) the addition of the protonophore FCCP. FCCP collapses the proton gradient present across the mitochondrial inner membrane, enabling the consumption of oxygen to be limited only by substrate availability. The mean rate of oxygen consumption (and standard error of the mean [SEM]) under each of the above conditions is shown. dPO2/dt, change in oxygen tension divided by change in time. (B) Cells cultured in the presence of absence of IL-3 for 12 h were fractionated into mitochondrial (M) and cytosolic (S) fractions. Fractions were probed for cytochrome c or cytochrome oxidase IV as a control for cellular fractionation. (C) Fluorometric measurement of NADH was performed using intact cells before and after the addition of FCCP. The difference between the mean steady-state fluorescence values (and SEM) before and after FCCP addition is plotted.
Consistent with a reduction in mitochondrial substrates following IL-3 withdrawal, measurement of total cellular NADH levels in cells withdrawn from IL-3 for12 h revealed a reduction to 68% normal levels (data not shown). To measure the amount of NADH available to mitochondrial NADH oxidase (complex I), cellular NADH levels were measured before and after the addition of FCCP. The addition of FCCP depolarizes mitochondria and allows complex I to oxidize available NADH stores. Following 12 h of growth factor withdrawal, FL5.12 cells contained half the NADH available to complex I in cells growing with IL-3 (Fig. 5C). Taken together, these data indicate that following growth factor withdrawal, mitochondria experience a limitation in substrates required for mitochondrial respiration.
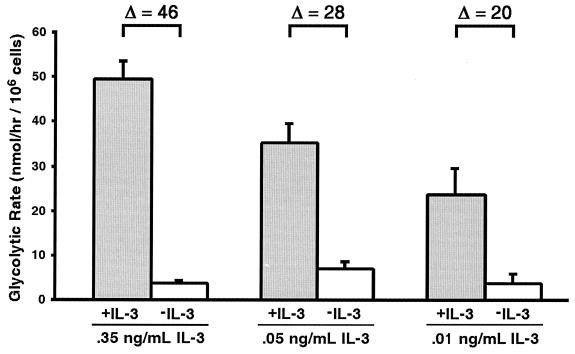
The end products of glycolysis provide substrates necessary for respiration, allowing mitochondria to sustain electron transport and maintain homeostasis. Since decreasing growth factor availability results in differences in glycolysis and in cell death kinetics (Fig. 3A and 4A), the glycolytic rates of cells cultured with decreasing concentrations of IL-3 were determined before and after IL-3 withdrawal. To avoid errors in interpretation due to the presence of dead cells, glycolysis was measured after 12 h of growth factor withdrawal, a time when the cells exhibit a cloning efficiency similar to that of the parental population, even when withdrawn from high concentrations of IL-3 (22). In the presence of IL-3, glycolytic rates declined as the availability of IL-3 declined (Fig. 3A and 6). Following IL-3 withdrawal, the glycolytic rates dropped to similar levels despite the differences in the initial glycolytic rates observed prior to the deprivation of IL-3. Thus, upon growth factor withdrawal, the absolute change in glycolysis was smaller in cells cultured with lower concentrations of IL-3. These differences in the changes in glycolysis rates are reminiscent of the differences in the rates of cell death observed when cells adapted to various levels of IL-3 were withdrawn from growth factor (compare Fig. 6 and Fig. 4). In addition, these data suggest that growth factor receptors may prevent activation of the cell death machinery by maintaining a sufficient rate of glycolysis to prevent alterations in mitochondrial homeostasis.
FIG. 6.
Magnitude of change in rate of glycolysis correlates with rate of cell death. Cells adapted to growth in medium containing the indicated amounts of IL-3 were cultured for 12 h in the presence (+IL-3) or absence (−IL-3) of IL-3. The mean glycolytic rate (and standard error of the mean) for each condition is shown. The change in glycolysis (Δ) upon IL-3 withdrawal is also shown.
The ability of different growth factors to promote cell survival correlates with their ability to promote glucose utilization.
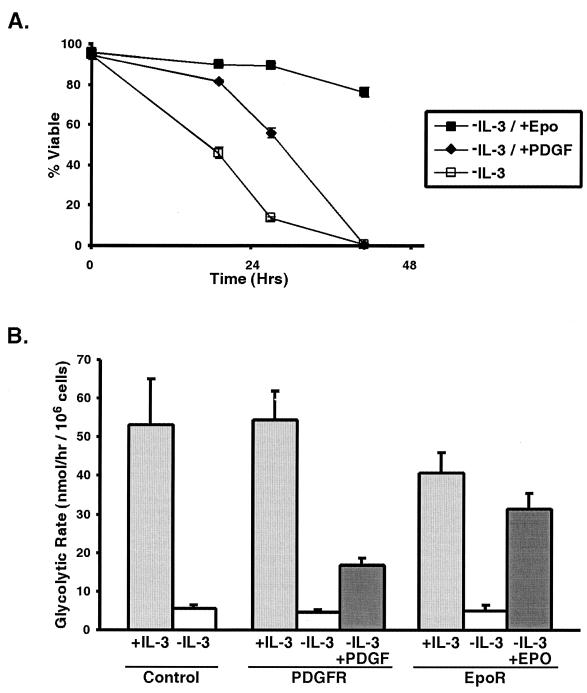
To determine if the ability to promote glycolysis is a general feature of growth factor-dependent survival, the function of other factors with well-described prosurvival properties was examined with FL5.12 cells. As with IL-3-dependent signaling, EpoR is an example of a hematopoietic growth factor whose signaling pathway involves Jak kinase-mediated activation of Stat proteins (21, 27). PDGF-R is an example of a receptor tyrosine kinase that transmits prosurvival signals through the phosphatidylinositol 3′-kinase/Akt pathway (2, 19). Neither Epo nor PDGF is sufficient to support survival in wild-type FL5.12 cells, as these cells do not express sufficient levels of EpoR or PDGF-R (data not shown). However, when FL5.12 cells are transfected with the appropriate receptor and withdrawn from IL-3, both Epo and PDGF have the ability to promote survival in these cells (Fig. 7A).
FIG. 7.
The ability of exogenous growth factor receptors to maintain cell viability correlates with their ability to sustain glycolysis. (A) FL5.12 cells transfected with EpoR (closed squares), PDGF-R (closed diamonds), or nothing (control) (open squares) were withdrawn from IL-3 and placed in medium containing Epo (−IL-3/+Epo), PDGF (−IL-3/+PDGF), or no exogenous growth factors (−IL-3). The mean cell viability (and standard error of the mean [SEM]) for each condition over time is shown. (B) Cells transfected with EpoR, PDGF-R, or nothing (Control) were cultured in the presence of IL-3 or withdrawn from IL-3 and placed in medium containing Epo (−IL-3/+Epo), PDGF (−IL-3/+PDGF), or no exogenous growth factors (−IL-3) for 12 h. The mean rate of glycolysis (and SEM) measured in each population of cells is shown.
To determine if Epo and PDGF act to promote glucose utilization, the rates of glycolysis in cells cultured with IL-3 were compared to those in cells withdrawn completely from growth factor or switched to culturing with only PDGF or Epo for 12 h. In the absence of growth factor, cells exhibited a sharp reduction in glycolytic rates, compared to cells growing with IL-3. Both PDGF and Epo promoted continued glucose utilization when IL-3 was withdrawn (Fig. 7B). PDGF was a relatively poor inhibitor of cell death following IL-3 withdrawal and supported glycolysis at a much lower rate than either IL-3 or Epo. In contrast, Epo supported glycolysis at levels only slightly lower than those supported by IL-3 and acted in a manner similar to that of IL-3 in terms of the ability to promote both cell survival and proliferation. As with IL-3 withdrawal, the observed changes in glycolysis reflected the rates of cell death. These data suggest that an important determinant in the ability of a growth factor to promote cell survival is its ability to facilitate glucose utilization in a particular cell type.
Limitation of glycolysis by either glucose or growth factor withdrawal results in cell death.
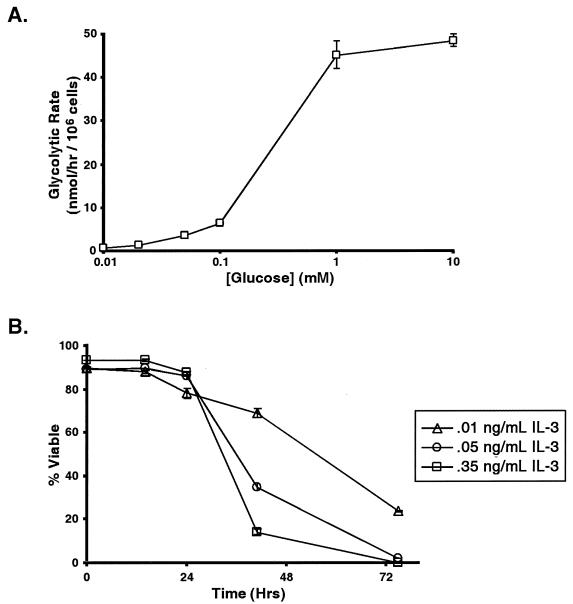
If the ability of growth factors to promote cell survival is related to their ability to promote glycolysis, then limiting glucose utilization in the presence of growth factors should mimic growth factor withdrawal. One way to limit glucose utilization is to limit the amount of glucose available in the media. As the concentration of glucose in the media falls below 0.1 mM, glycolysis becomes substrate limited (Fig. 8A). Limiting the glycolytic rate of FL5.12 cells growing with high levels of IL-3 by glucose deprivation results in cell death within 3 days (Fig. 8B). The higher the concentration of IL-3 with which the cells are grown, the faster the cells die in response to glucose restriction. This result indicates that under nutrient-limiting conditions, high levels of growth factor may trigger cell death. In addition, when cells cultured continuously in the same concentration of IL-3 are withdrawn to different amounts of glucose, the cells withdrawn to the lowest concentration of glucose die at a higher rate than the cells withdrawn to higher concentrations of glucose (data not shown). These data suggest that growth factors cannot promote cell survival in the absence of adequate external glucose and support the hypothesis that the rate of cell death is proportional to the change in glycolysis that occurs as a result of either growth factor or nutrient withdrawal.
FIG. 8.
Cells growing with more growth factor are more susceptible to death following nutrient limitation. (A) Equal numbers of cells growing with 0.35 ng of IL-3/ml and 11 mM glucose were washed and resuspended in buffer containing different amounts of glucose. The mean glycolytic rate (and standard error of the mean [SEM]) at the indicated concentrations of glucose was determined and is shown. (B) Cells adapted to culturing with the indicated concentrations of IL-3 were washed and resuspended in medium containing the same amounts of IL-3 but containing only 0.05 mM glucose. Cell viability was determined at the indicated times following glucose withdrawal by propidium iodide exclusion and flow cytometry. The mean cell viability (and SEM) for each condition over time is shown.
Reduced glycolysis results in cell death by apoptosis.
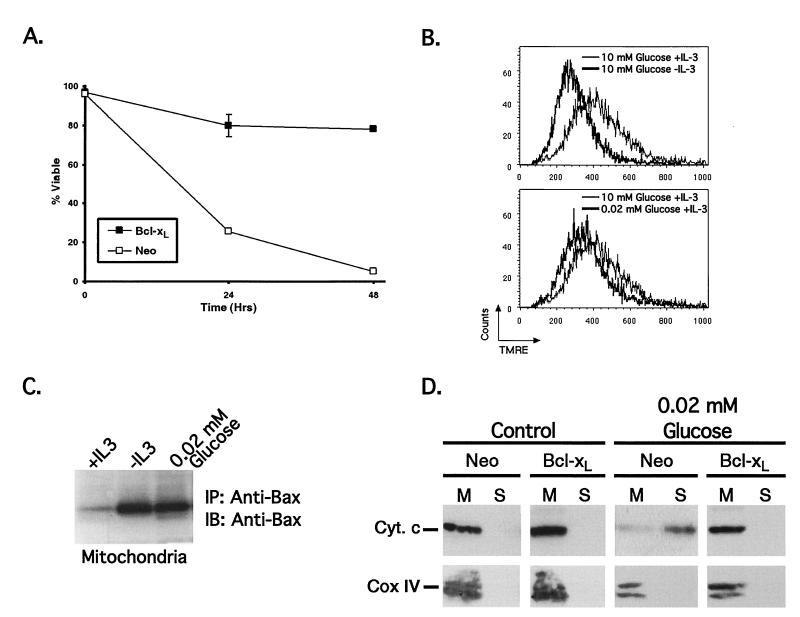
It remains possible that glucose deprivation results in death by a starvation mechanism that is independent of the events which lead to death following growth factor withdrawal. To explore this possibility, the ability of the antiapoptotic protein Bcl-xL to inhibit cell death following glucose deprivation was examined. Even under conditions of severe glucose deprivation in the presence of high concentrations of growth factor, Bcl-xL expression provided protection from the induction of cell death (Fig. 9A). Furthermore, cells expressing Bcl-xL were resistant to programmed cell death following either glucose or growth factor deprivation, despite exhibiting the same decreases in both glycolytic rate and cell size as control-transfected cells (data not shown). These results demonstrate that even at 0.02 mM glucose, adequate nutrients are available to support cell viability.
FIG. 9.
Cell death following glucose limitation mimics cell death induced by growth factor withdrawal. (A) Control (Neo) and Bcl-xL-expressing cells cultured with 0.35 ng of IL-3/ml were washed and resuspended in medium containing the same amount of IL-3 but only 0.02 mM glucose. The mean cell viability (and standard error of the mean [SEM]) following glucose limitation over time is shown. (B) Mitochondrial potential was assessed using the potentiometric dye TMRE with cells growing for 6 h in the presence or absence of IL-3 (upper panel) or with high or low concentrations of glucose (10 or 0.02 mM, respectively) (lower panel). Note that the same histogram is used for the 10 mM glucose plus IL-3 condition in both panels. (C) Bax conformation was detected in mitochondrial fractions from cells growing for 15 h in the presence (+IL-3) or absence (−IL-3) of IL-3 or with 0.02 mM glucose. Mitochondrial lysates were prepared, immunoprecipitated (IP) using a conformation-specific anti-Bax antibody, and immunoblotted (IB) for Bax. (D) Control (Neo) and Bcl-xL-expressing cells were cultured with 0.35 ng of IL-3/ml in the presence of 11 mM glucose (Control) or 0.02 mM glucose (glucose withdrawal) for 18 h prior to subcellular fractionation. The amounts of cytochrome c (Cyt. c) and cytochrome oxidase subunit IV (Cox IV) present in the mitochondrial (M) and cytosolic (S) fractions were determined by Western blotting. Cox IV, an integral membrane protein located in the inner mitochondrial membrane, served as a control to demonstrate the absence of mitochondria in the cytosolic fraction.
Mitochondrial events are thought to be important in the initiation of apoptosis following growth factor withdrawal, and Bcl-xL expression has been reported to promote cell survival through effects on mitochondria (7). To further examine the mechanism of death and Bcl-xL protection following glucose deprivation, mitochondrial homeostasis was assessed. Staining of cells with the potentiometric dye TMRE showed that mitochondrial membrane potential was decreased upon either IL-3 withdrawal or glucose withdrawal, indicating that mitochondria undergo similar changes in response to both treatments (Fig. 9B). In addition, the proapoptotic Bcl-2 family protein Bax translocates to mitochondria and adopts an active configuration upon both IL-3 withdrawal and glucose limitation (Fig. 9C) (9, 12). Thus, growth factor withdrawal and glucose limitation induce similar changes in mitochondria.
Mitochondrial dysfunction results in apoptosis through the release of cytochrome c and other mediators. To determine if glucose limitation results in the release of cytochrome c, subcellular fractions were prepared from cells cultured in medium containing 10 or 0.02 mM glucose. Cytochrome c but not the mitochondrial inner membrane protein cytochrome oxidase subunit IV is redistributed from the mitochondrial fraction to the S-100 (cytosolic) fraction upon glucose reduction (Fig. 9D). As has been observed for cells withdrawn from growth factor, the redistribution of cytochrome c following glucose deprivation was prevented by Bcl-xL expression.
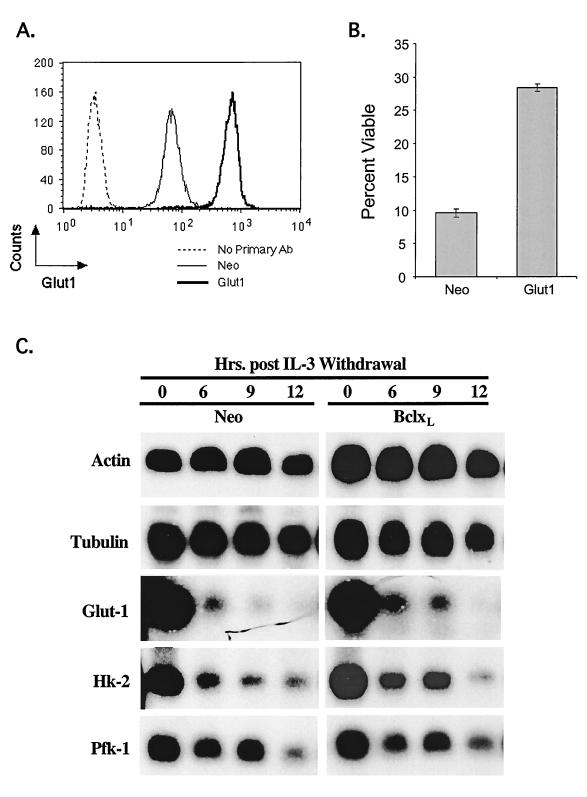
The data suggest that growth factors may contribute to cell survival by maintaining cellular metabolism. One way to maintain cellular viability following growth factor withdrawal may be to express genes that promote glucose uptake. To test this hypothesis, FL5.12 cells were stably transfected with Glut1 (Fig. 10A). FL5.12 cells that constitutively expressed Glut1 displayed significant resistance to growth factor withdrawal-induced apoptosis compared with control cells (Fig. 10B). However, Glut1-expressing clones eventually all died in response to growth factor withdrawal, albeit with delayed kinetics. Therefore, we analyzed the expression of other genes whose products are critical for glucose metabolism. Glut1, hexokinase 2, and PFK-1 mRNAs were found to undergo a rapid decline in expression following IL-3 withdrawal in both vector control and Bcl-xL-expressing cells. Thus, ultimately, not only does glucose uptake become limiting following growth factor withdrawal but also glucose phosphorylation and commitment to glycolysis become progressively compromised.
FIG. 10.
Expression of Glut1 improves viability following IL-3 withdrawal. (A) Cells were transfected with control vector or with Glut1 expression vector. Transfected cells were permeabilized and stained in a two-step reaction with a Glut1-specific antibody and analyzed by flow cytometry. Cells stained in the absence of the primary antibody (Ab) are included as a control. The data are representative of the results for three independent clones. (B) Cells transfected with control vector (Neo) or with Glut1 expression vector were withdrawn from IL-3 for 1 day, and viability was determined by propidium iodide staining with a flow cytometer. Error bars show the standard deviation of triplicate samples. (C) RNA was prepared from control vector (Neo)- and Bcl-xL-expressing cells withdrawn from IL-3 at the indicated times. A Northern blot was serially hybridized with probes specific for actin, tubulin, Glut1, hexokinase 2 (Hk-2), and PFK-1 (Pfk-1).
DISCUSSION
The data suggest that IL-3 is required for FL5.12 cells to take up and utilize glucose. Cells adapt to gradual reductions in growth factor by adjusting their glycolytic rates, sizes, and cycle times. Abrupt decreases in the concentration of available growth factor, however, result in apoptosis. The magnitude of the decline in glycolysis appears to predict the extent of cell death. Apoptosis can be initiated even when there is significant growth factor remaining in the medium, suggesting that growth factors do not maintain cellular viability solely by repressing the intrinsic cellular apoptotic machinery. In this way, cells become addicted to a constant supply of growth factor in their environment.
The data argue against a simple model in which growth factors prevent cell death by inducing the expression or posttranslational modification of proteins that regulate apoptosis. If this were the case, then cells growing with the highest concentrations of IL-3 would be the most resistant or would take the longest time to undergo apoptosis upon withdrawal of either IL-3 or glucose. Instead, we have observed the opposite. Cells growing with the highest concentrations of IL-3 are most susceptible to death upon either growth factor or nutrient limitation.
The correlation identified among growth factor availability, glycolytic rate, and cell size suggests a potential causal relationship among these phenomena. It is not clear whether larger cells require more glycolysis because they have more cytoplasm or whether an increased glycolytic rate drives cells to grow to a larger size. It is clear, however, that cell size is responsive to growth factor concentrations. Recent studies have demonstrated that when small, growth factor-deprived cells are returned to growth factor, the time required for growth back to sufficient cell size for proliferation determines the time to cell cycle reentry (17).
Since growth factors stimulate macromolecular synthesis, it is usually assumed that increases in glycolysis result from bioenergetic compensation for the increased use of ATP for synthesis. It is difficult to reconcile this model of glycolytic control with the data showing that mitochondria become depleted of electron transport substrates following growth factor withdrawal. In the absence of growth factor, the basal rate of glycolysis of FL5.12 cells is not sufficient to support mitochondrial homeostasis. Growth factor signal transduction may have an impact on glucose utilization in several ways, and different survival signals may affect glucose utilization differently. In many cell types, including lymphocytes, glucose transport into the cell is determined by the level of the glucose transporter, Glut1, present on the cell surface (4). The expression of Glut1 has been shown to be controlled by both cytokine- and T-cell-receptor-mediated survival signals in lymphocytes (17). In nonhematopoietic cells, the translocation of the Glut4 glucose transporter to the cell surface is downstream of signals from cell surface receptors (18).
In addition to effects on glucose transport, growth factors may also have an impact on the regulation of glycolysis itself. This could occur through effects on the expression of glycolytic enzymes in combination with the posttranslational regulation of their activity. For instance, the rate-limiting step that exerts the most control over glycolytic rates in mammals is the conversion of fructose-6-phosphate to fructose-1,6-bisphosphate by PFK-1. The complex allosteric regulation of PFK-1 activity involves cellular adenine nucleotide concentrations in addition to the levels of another metabolite, fructose-2,6-bisphosphate (11, 25). Fructose-2,6-bisphosphate levels are regulated by enzyme phosphorylation, indicating a possible target of growth factor signal transduction (6). We find that both Glut1 and PFK-1 decline rapidly following IL-3 withdrawal. This appears to be a direct response rather than a result of homeostatic changes, since expression is lost at a time when both cellular ATP and NADH levels as well as mitochondrial membrane potential is declining. Loss of mitochondrial substrates appears to play at least a partial role in regulating growth factor withdrawal-induced apoptosis, since Glut1 overexpression significantly retards the rate and extent of apoptosis of growth factor-deprived cells.
Bcl-2 proteins, such as Bcl-xL, prevent cytochrome c redistribution and promote cell survival in a manner that correlates with their ability to protect mitochondrial function (24). Because mitochondria are allowed to adapt to changes in cellular metabolism, the disruption of mitochondrial homeostasis that results in apoptosis is prevented. However, the ability of Bcl-2 proteins to maintain mitochondrial homeostasis does not reverse the dependence of cell growth on glucose-derived substrates for macromolecular synthesis. When withdrawn from either growth factor or glucose, Bcl-xL-protected cells undergo progressive atrophy (17).
Together, these data suggest that the disruption in mitochondrial function that contributes to the initiation of apoptosis may occur as a direct consequence of the metabolic changes which result following growth factor withdrawal. This may explain why cell survival is dependent not upon the absolute quantity of growth factor present but rather upon a relatively constant amount of survival signal and hence rate of glucose utilization. Cells become addicted to the rate of glycolysis set by the availability of growth factor in their environment because glycolysis establishes cell size, thus establishing a minimum rate of metabolism necessary for continued survival. Cells die when the acute limitation in glucose utilization following growth factor withdrawal is sufficiently large that the decline in mitochondrial substrates makes the cells incapable of sustaining mitochondrial homeostasis in the presence of the increased ATP consumption associated with a larger cell size.
In prokaryotes and unicellular eukaryotes, the number of cells in a culture is determined by nutrient availability. However, unlike unicellular organisms, nontransformed metazoan cells do not continue to grow and divide until nutrients are limiting. Instead, cell number within a tissue or organism is controlled by the availability of growth and survival signals. Our data suggest that one important function of growth factors may be to regulate the expression and function of genes involved in glucose metabolism. Increased glycolysis in turn enhances the levels of metabolites available for mitochondrial synthesis and provides substrates for mitochondrial electron transport.
ACKNOWLEDGMENTS
M.G.V.H. and D.R.P. are co-first authors of this work.
We thank Franz Matschinsky for invaluable discussions, Habiba Najafi for technical assistance with the measurement of glycolysis, and Martin Carroll for providing growth factor receptor constructs. We also thank members of the Thompson Laboratory for helpful discussions and critical reading of the manuscript.
M.G.V.H. was supported in part by the University of Chicago Medical Scientist Training Program and Cancer Research Fund Women's Board. D.R.P. and J.C.R. were supported by fellowships from the Irvington Institute for Immunological Research.
REFERENCES
- 1.Ashcroft S J, Weerasinghe L C, Bassett J M, Randle P J. The pentose cycle and insulin release in mouse pancreatic islets. Biochem J. 1972;126:525–532. doi: 10.1042/bj1260525. [DOI] [PMC free article] [PubMed] [Google Scholar]
- 2.Auger K R, Serunian L A, Soltoff S P, Libby P, Cantley L C. PDGF-dependent tyrosine phosphorylation stimulates production of novel polyphosphoinositides in intact cells. Cell. 1989;57:167–175. doi: 10.1016/0092-8674(89)90182-7. [DOI] [PubMed] [Google Scholar]
- 3.Boise L H, Gonzalez-Garcia M, Postema C E, Ding L, Lindsten T, Turka L A, Mao X, Nunez G, Thompson C B. bcl-x, a bcl-2-related gene that functions as a dominant regulator of apoptotic cell death. Cell. 1993;74:597–608. doi: 10.1016/0092-8674(93)90508-n. [DOI] [PubMed] [Google Scholar]
- 4.Chakrabarti R, Jung C Y, Lee T P, Liu H, Mookerjee B K. Changes in glucose transport and transporter isoforms during the activation of human peripheral blood lymphocytes by phytohemagglutinin. J Immunol. 1994;152:2660–2668. [PubMed] [Google Scholar]
- 5.Conlon I, Raff M. Size control in animal development. Cell. 1999;96:235–244. doi: 10.1016/s0092-8674(00)80563-2. [DOI] [PubMed] [Google Scholar]
- 6.Deprez J, Bertrand L, Alessi D R, Krause U, Hue L, Rider M H. Partial purification and characterization of a wortmannin-sensitive and insulin-stimulated protein kinase that activates heart 6-phosphofructo-2-kinase. Biochem J. 2000;347:305–312. [PMC free article] [PubMed] [Google Scholar]
- 7.Desagher S, Martinou J C. Mitochondria as the central control point of apoptosis. Trends Cell Biol. 2000;10:369–377. doi: 10.1016/s0962-8924(00)01803-1. [DOI] [PubMed] [Google Scholar]
- 8.Dobrowolski S, Harter M, Stacey D W. Cellular ras activity is required for passage through multiple points of the G0/G1 phase in BALB/c 3T3 cells. Mol Cell Biol. 1994;14:5441–5449. doi: 10.1128/mcb.14.8.5441. [DOI] [PMC free article] [PubMed] [Google Scholar]
- 9.Gross A, Jockel J, Wei M C, Korsmeyer S J. Enforced dimerization of BAX results in its translocation, mitochondrial dysfunction and apoptosis. EMBO J. 1998;17:3878–3885. doi: 10.1093/emboj/17.14.3878. [DOI] [PMC free article] [PubMed] [Google Scholar]
- 10.Hsu Y T, Youle R J. Bax in murine thymus is a soluble monomeric protein that displays differential detergent-induced conformations. J Biol Chem. 1998;273:10777–10783. doi: 10.1074/jbc.273.17.10777. [DOI] [PubMed] [Google Scholar]
- 11.Hue L, Rider M H. Role of fructose 2,6-bisphosphate in the control of glycolysis in mammalian tissues. Biochem J. 1987;245:313–324. doi: 10.1042/bj2450313. [DOI] [PMC free article] [PubMed] [Google Scholar]
- 12.Khaled A R, Kim K, Hofmeister R, Muegge K, Durum S K. Withdrawal of IL-7 induces Bax translocation from cytosol to mitochondria through a rise in intracellular pH. Proc Natl Acad Sci USA. 1999;96:14476–14481. doi: 10.1073/pnas.96.25.14476. [DOI] [PMC free article] [PubMed] [Google Scholar]
- 13.Li P, Nijhawan D, Budihardjo I, Srinivasula S M, Ahmad M, Alnemri E S, Wang X. Cytochrome c and dATP-dependent formation of Apaf-1/caspase-9 complex initiates an apoptotic protease cascade. Cell. 1997;91:479–489. doi: 10.1016/s0092-8674(00)80434-1. [DOI] [PubMed] [Google Scholar]
- 14.Liang Y, Buettger C, Berner D K, Matschinsky F M. Chronic effect of fatty acids on insulin release is not through the alteration of glucose metabolism in a pancreatic beta-cell line (beta HC9) Diabetologia. 1997;40:1018–1027. doi: 10.1007/s001250050783. [DOI] [PubMed] [Google Scholar]
- 15.Marshall C. How do small GTPase signal transduction pathways regulate cell cycle entry? Curr Opin Cell Biol. 1999;11:732–736. doi: 10.1016/s0955-0674(99)00044-7. [DOI] [PubMed] [Google Scholar]
- 16.Raff M C. Social controls on cell survival and cell death. Nature. 1992;356:397–400. doi: 10.1038/356397a0. [DOI] [PubMed] [Google Scholar]
- 17.Rathmell J C, Vander Heiden M G, Harris M H, Frauwirth K A, Thompson C B. In the absence of extrinsic signals, nutrient utilization by lymphocytes is insufficient to maintain either cell size or viability. Mol Cell. 2000;6:683–692. doi: 10.1016/s1097-2765(00)00066-6. [DOI] [PubMed] [Google Scholar]
- 18.Rea S, James D E. Moving GLUT4: the biogenesis and trafficking of GLUT4 storage vesicles. Diabetes. 1997;46:1667–1677. doi: 10.2337/diab.46.11.1667. [DOI] [PubMed] [Google Scholar]
- 19.Romashkova J A, Makarov S S. NF-kappaB is a target of AKT in anti-apoptotic PDGF signalling. Nature. 1999;401:86–90. doi: 10.1038/43474. [DOI] [PubMed] [Google Scholar]
- 20.Schumacker P T, Chandel N, Agusti A G. Oxygen conformance of cellular respiration in hepatocytes. Am J Physiol. 1993;265:L395–L402. doi: 10.1152/ajplung.1993.265.4.L395. [DOI] [PubMed] [Google Scholar]
- 21.Smithgall T E, Briggs S D, Schreiner S, Lerner E C, Cheng H, Wilson M B. Control of myeloid differentiation and survival by Stats. Oncogene. 2000;19:2612–2618. doi: 10.1038/sj.onc.1203477. [DOI] [PubMed] [Google Scholar]
- 22.Vander Heiden M G, Chandel N S, Schumacker P T, Thompson C B. Bcl-xL prevents cell death following growth factor withdrawal by facilitating mitochondrial ATP/ADP exchange. Mol Cell. 1999;3:159–167. doi: 10.1016/s1097-2765(00)80307-x. [DOI] [PubMed] [Google Scholar]
- 23.Vander Heiden M G, Chandel N S, Williamson E K, Schumacker P T, Thompson C B. Bcl-xL regulates the membrane potential and volume homeostasis of mitochondria. Cell. 1997;91:627–637. doi: 10.1016/s0092-8674(00)80450-x. [DOI] [PubMed] [Google Scholar]
- 24.Vander Heiden M G, Thompson C B. Bcl-2 proteins: regulators of apoptosis or of mitochondrial homeostasis? Nat Cell Biol. 1999;1:E209–E216. doi: 10.1038/70237. [DOI] [PubMed] [Google Scholar]
- 25.Van Schaftingen E, Jett M F, Hue L, Hers H G. Control of liver 6-phosphofructokinase by fructose 2,6-bisphosphate and other effectors. Proc Natl Acad Sci USA. 1981;78:3483–3486. doi: 10.1073/pnas.78.6.3483. [DOI] [PMC free article] [PubMed] [Google Scholar]
- 26.Whetton A D, Dexter T M. Effect of haematopoietic cell growth factor on intracellular ATP levels. Nature. 1983;303:629–631. doi: 10.1038/303629a0. [DOI] [PubMed] [Google Scholar]
- 27.Witthuhn B A, Quelle F W, Silvennoinen O, Yi T, Tang B, Miura O, Ihle J N. JAK2 associates with the erythropoietin receptor and is tyrosine phosphorylated and activated following stimulation with erythropoietin. Cell. 1993;74:227–236. doi: 10.1016/0092-8674(93)90414-l. [DOI] [PubMed] [Google Scholar]


