Abstract
Human skin functions as a physical barrier to foreign pathogen invasion and houses numerous commensals. Shifts in the human skin microbiome have been associated with conditions ranging from acne to atopic dermatitis. Previous metagenomic investigations into the role of the skin microbiome in health or disease have found that much of the sequenced data does not match reference genomes, making it difficult to interpret metagenomic datasets. We combined bacterial cultivation and metagenomic sequencing to assemble the Skin Microbial Genome Collection (SMGC) which comprises 622 prokaryotic species derived from 7,535 metagenome-assembled genomes (MAGs) and 251 isolate genomes. Metagenomic datasets that we generated were combined with publicly available skin metagenomic datasets to identify members and functions of the human skin microbiome. The SMGC collection includes 174 newly-identified bacterial species and 12 newly-identified bacterial genera, including the abundant genus Candidatus Pellibacterium which has been newly-associated with the skin. The SMGC increases the characterized set of known skin bacteria by 26%. We validated SMGC MAGs by comparing them to sequenced isolates obtained from the same samples. We also recovered 12 eukaryotic species and assembled thousands of viral sequences including newly-identified clades of jumbo phages. The SMGC enables classification of a median of 85% of skin metagenomic sequences and provides a comprehensive view of skin microbiome diversity, derived primarily from samples obtained in North America.
INTRODUCTION
Human skin is colonized by a diverse community of bacteria, viruses, and eukaryotes1. Shifts in population dynamics of members of the human skin microbiota are associated with skin conditions including acne and atopic dermatitis2. Previous surveys of the skin microbiota have compared skin metagenomic reads to genomes in reference genomic databases. This work has found that roughly half of the metagenomic reads did not match genomes of reference microbes1,3. One way to catalog this unmapped diversity is to further expand cultivation efforts from the skin. Culture-based investigations of the skin4–6 can produce high-quality genomes but are often biased towards representing those species that can be most easily cultivated in the laboratory. To compile a more comprehensive genome catalogue of the skin microbial community, de novo assembly and binning of shotgun metagenomic reads into metagenome-assembled genomes (MAGs) can be used. Such methods have previously been applied to identify thousands of microorganisms in a variety of different environments7,8.
Here, we combined cultivation approaches with metagenomic analyses to create the Skin Microbial Genome Collection (SMGC). This multi-kingdom catalogue comprises 622 prokaryotic species that were identified from 7,535 MAGs, and 251 cultured bacterial genomes, 12 eukaryotic genomes and thousands of non-redundant viral sequences. The SMGC includes a wide range of bacterial, eukaryotic, and viral taxa not previously reported, including 174 bacterial species (17 of 174 were cultured in this study), 12 bacterial genera, 4 eukaryotic species, and 20 jumbo phages. Using the SMGC we characterize the diversity and patterning of microbes from human skin samples at an unparalleled resolution.
A human skin bacteria culture collection
To improve our understanding of the diversity and functions of the skin microbiome, we first cultured 153 bacterial isolates that were derived from skin swabs of 15 body sites of 7 healthy adult volunteers using different selective media and varying lipid and oxygen levels (please consult Supplementary Table 1). An additional set of 98 bacterial isolates from 27 healthy subjects and patients with diagnosed skin disorders were included to make 251 isolates altogether. Demographic information (age range, biological sex, skin health status) for the subjects is provided in Supplementary Table 2. For each isolate, whole genome sequences (WGS) were generated (accessions provided in Supplementary Table 2). Together, these 251 sequenced isolates from 15 body sites and 34 individuals constitute the Skin Bacteria Culture Collection (SBCC) (Supplementary Table 2).
Taxonomic classification of the SBCC, based on the Genome Taxonomy Database (GTDB)9, revealed that most isolates belonged to the Firmicutes (n=176), Actinobacteriota (n=58), and Proteobacteria (n=12) phyla (Supplementary Table 2). The 251 isolates represent 79 distinct species (defined using the established criterion of >95%10 nucleotide identity with ≥60% aligned fraction11) belonging to 35 genera, with the preponderance of distinct species in the SBCC belonging to the genus Corynebacterium (n=24).
Skin metagenomics
To develop a more complete catalog of the microbes present on human skin, particularly those less amenable to culturing, we used de novo assembly and binning on roughly 750 Gbp of shotgun metagenomic data from 594 skin samples (2,479 sequencing runs) derived from longitudinal sampling at three time points of 19 bodysites of 12 healthy volunteers (seven of whom had been sampled for the SBCC)3. We supplemented this existing dataset with 70 Gbp of new data derived from 50 samples of the antecubital fossa, volar forearm, retroauricular crease, and nares of 5 of these 12 healthy volunteers at a fourth time point (Fig. 1a). We chose these sites as previous work has shown that these sites have high bacterial and viral diversity not present in reference databases and should be prioritized in future metagenomic investigations1,3.
Fig. 1. Metagenome assembly strategies for the recovery of skin microbial genomes.
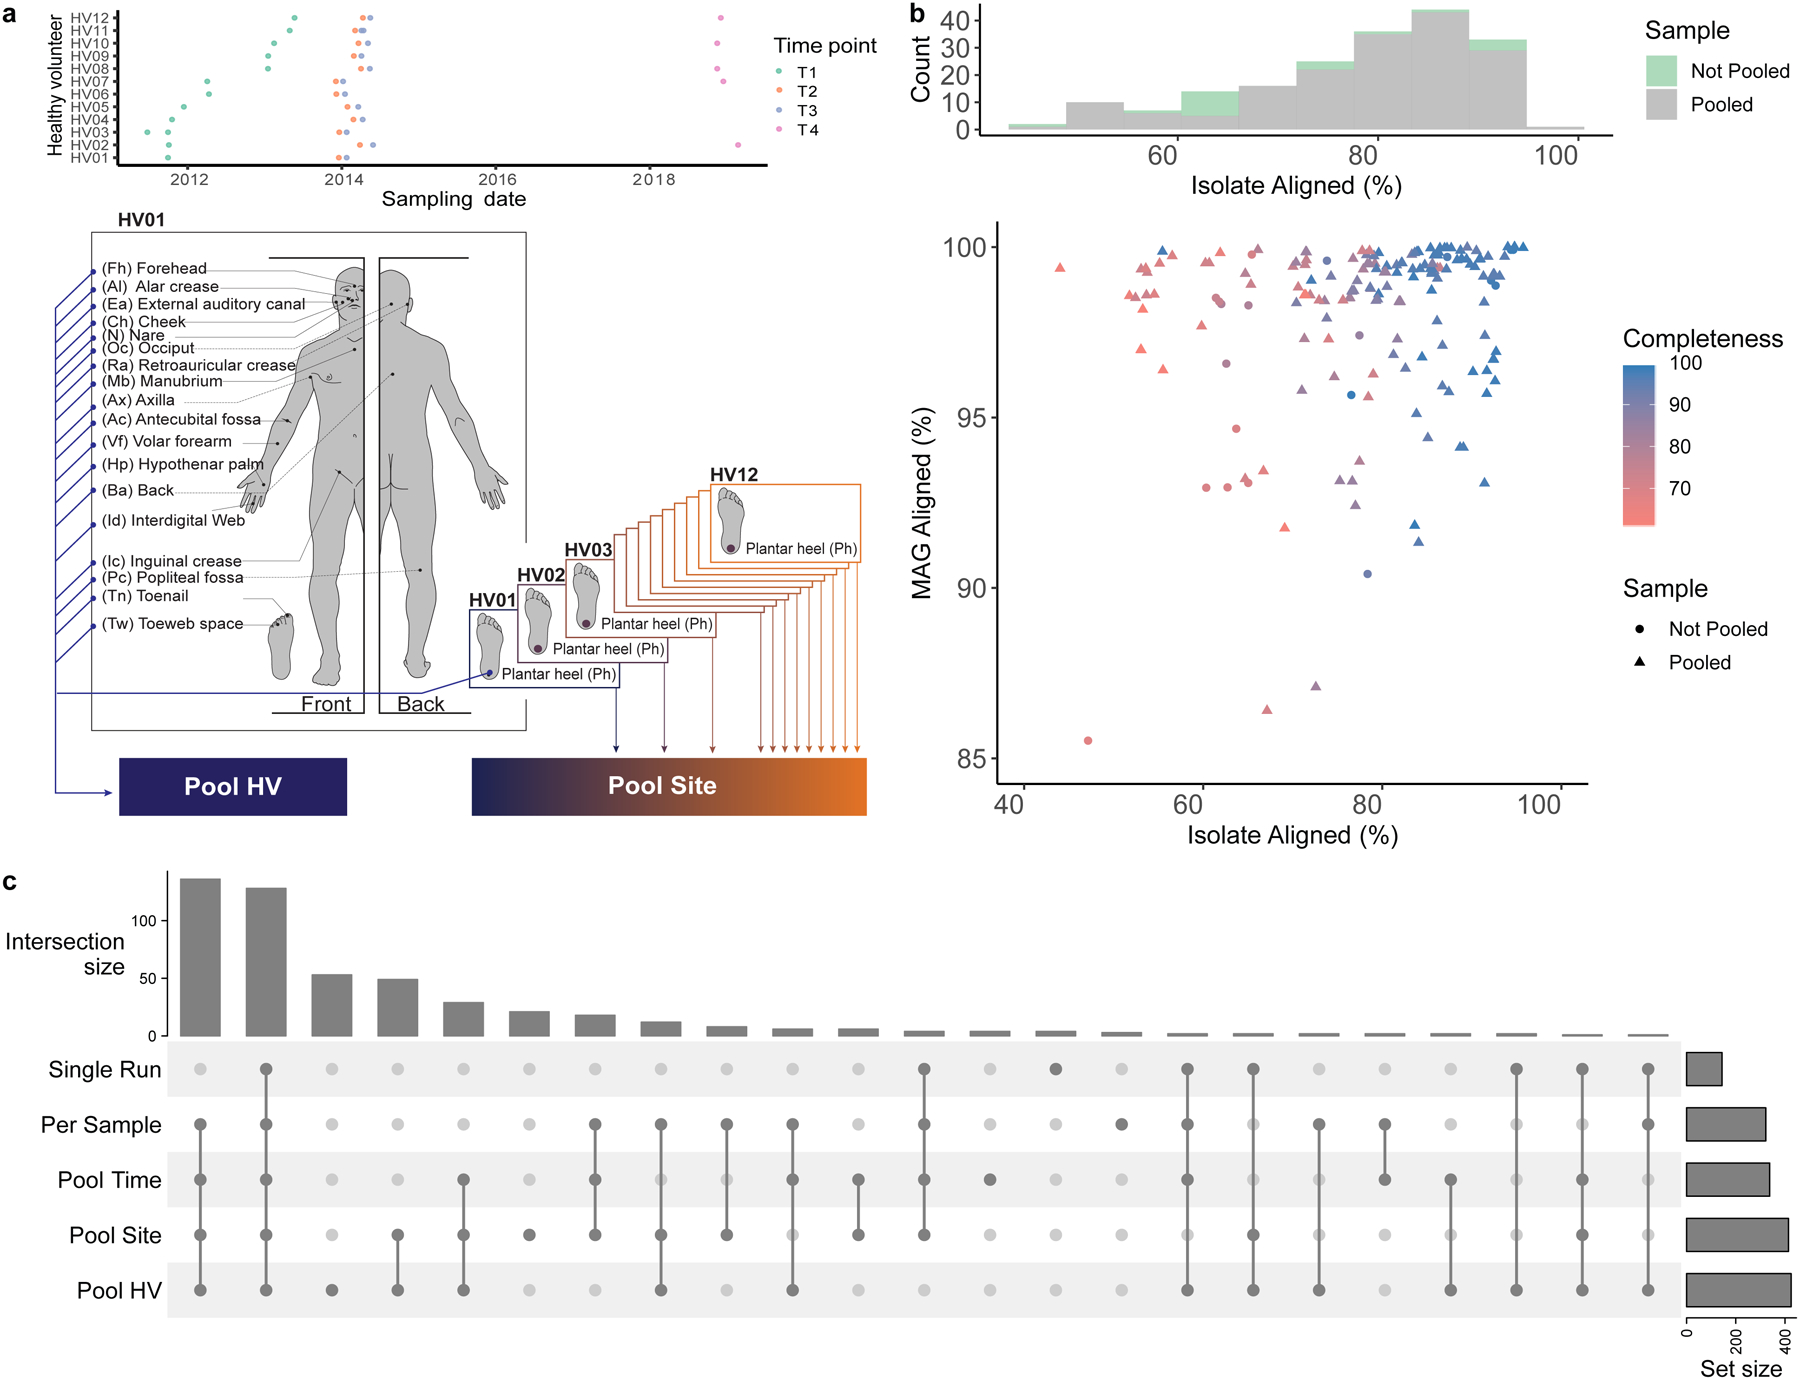
a, Samples obtained from 19 body sites of 12 healthy volunteers over 4 time points were collected and sequenced. Metagenomic datasets were concatenated per healthy volunteer (Pool HV), and per body site (Pool Site). For a description of all pooling strategies, including Pool Time, see Methods. b, Assessment of the quality of the MAG aligning best to each SBCC isolate. Histogram shows the number of MAGs from Single Run and Per Sample or Pooled (Pool Time, Pool HV, Pool Site) strategies that best align to an SBCC isolate. Graph depicts the percent aligned for each SBCC isolate and its corresponding MAG. c, UpSet plot showing the number of species recovered using the different assembly approaches.
In addition to using metagenomic assembly methods on reads from individual sequencing libraries (runs) or samples, we also adopted a sample pooling approach (co-assembly) to increase sequence depth and recover less abundant organisms. Co-assembly has been successfully applied to investigate metagenomes from a variety of biomes12–14 and is advocated for by tools such as Anvi’o15 and DESMAN16. We aggregated reads per healthy volunteer (Pool HV), per body site (Pool Site) (Fig. 1a) and across time points (Pool Time). Samples derived from these different combinations of the 12 individuals, 19 body sites, and 4 time points were assembled and binned into 9,088 MAGs.
We further complemented our genome collection with MAGs generated from publicly available skin metagenomes (n=2,273 runs), spanning different geographies, age groups, and skin disorders (Supplementary Table 3). These resulted in 1,315 MAGs, which together with the 9,088 MAGs generated from our samples yielded 10,403 genomes (7,892 non-redundant genomes) (Extended Data Fig. 1). Individual contigs that together constitute MAGs had a median N50 of 9 Kbp (interquartile range, IQR = 5–25 Kbp) and a mean of 24 Kbp, which is expected for MAGs generated from short-read metagenomic datasets (Extended Data Fig. 1c). We compared the taxonomic classification of each MAG to that of its individual contigs and found that only a small fraction (0.6%) of the contigs were taxonomically mismatched (Extended Data Fig. 1d). As misassembly or misbinning of contigs can lead to chimeric MAGs, we used additional methods to control for MAG contamination. Using a recently developed entropy-based approach17 we found that 95% of the MAGs (n=7,535) had no chimericity, supporting the overall quality of our catalog. We excluded the 357 MAGs deemed potentially chimeric, 196 of which were from single run/per sample and 161 from pooled samples. This resulted in 7,535 non-redundant, quality-filtered MAGs from the skin microbiome: according to the MIMAG criterion18, 5,373 were ‘medium quality’ (≥50% completeness, <10% contamination), 569 were ‘high quality’ (>90% completeness, <5% contamination, presence of 5S, 16S and 23S rRNAs, and at least 18 tRNAs), and 1,593 were ‘near complete’ (conform to the high quality standard except for the presence of the rRNAs).
Quality of skin microbiome MAGs
An advantage of our genomics-culturomics study design is the ability to assess the quality of the MAGs using cultured isolates from the same samples. We aligned each MAG to the WGS of isolates and compared MAG-isolate pairs (n=1,478) where there was a species-level match7. Amongst these pairs, a median of 94% (IQR = 91–97%) of each MAG aligned against its isolate while 75% (IQR = 61–85%) of each isolate aligned to the MAG. A high percentage of each MAG aligning to its closest isolate from the same species suggests low contamination from other microbial genomes. Differences between the isolates and MAGs could be partly explained by strain variation in gene content and the fact that MAGs are ‘population genomes19,20. We additionally compared the 580 MAGs aligning with 83 isolates with high (≥99%) identity to identify potential issues with the assembly process, which revealed that only 5% of each MAG was potentially misassembled (IQR: 1.6–12%). Importantly, in some cases pooling actually led to comparable or better MAGs (lower misassembled fraction) compared to per sample approaches (Extended Data Fig. 2a,b). To evaluate potential SNP errors associated with co-assembly, we also quantified the mismatches per 100 kbp for each MAG compared to its matching isolate, which showed comparable results across all strategies. Binning associated contamination was also low as median alignment of the MAG was 96% (IQR = 93–99%), while the fraction of the isolate genome aligned to the MAG was 80% (IQR = 66–87%) reflecting a good correspondence between the MAG and the isolate genome (Extended Data Fig. 2c, d). The MAGs that best aligned to isolates were predominantly from pooled samples (Fig. 1b). CheckM completeness estimates for each MAG increased with the isolate aligned fraction, with a median CheckM completeness/% isolate aligned of 1.10 (IQR = 1.05–1.14), suggesting that CheckM slightly overestimates MAG completeness (Extended Data Fig. 2c). Overall, comparisons of the MAGs with the isolates demonstrated the benefits of pooling samples. For example, one Corynebacterium MAG recovered exclusively by Pool HV aligned 99.9% of its each genome against an isolate, cultured from the same HV, with 99.9% ANI (Extended Data Fig. 2d).
Species diversity in the SMGC
To investigate the species diversity in our genome collection, we clustered the MAGs with the 251 isolates from the SBCC at the species level. We selected the best quality (based on their completeness, contamination and N50) genome per species (prioritizing isolates over MAGs, see methods for further details) and identified 622 distinct prokaryotic species as part of the Skin Microbial Genome Collection (SMGC, Fig. 2a) (Supplementary Table 4). Genomes clustered at the species level had a median completeness of 95% (IQR = 82–99%), contamination of 0.69% (IQR = 0.05–1.57%) and an N50 of 23 Kbp (IQR = 7 – 74 Kbp). While a large fraction (351; 59%) of species were recovered as MAGs by multiple sampling strategies, the combination of different pooling strategies enabled the recovery of more diversity than any single approach (Extended Data Fig. 3, Fig 1c). Furthermore, 15% of species recovered solely by pooling approaches were recovered using Per Sample investigations of other studies, showing that both are effective approaches to uncover skin microbial diversity.
Fig. 2. A comprehensive collection of skin microbial genomes uncovers abundant and prevalent bacterial diversity.
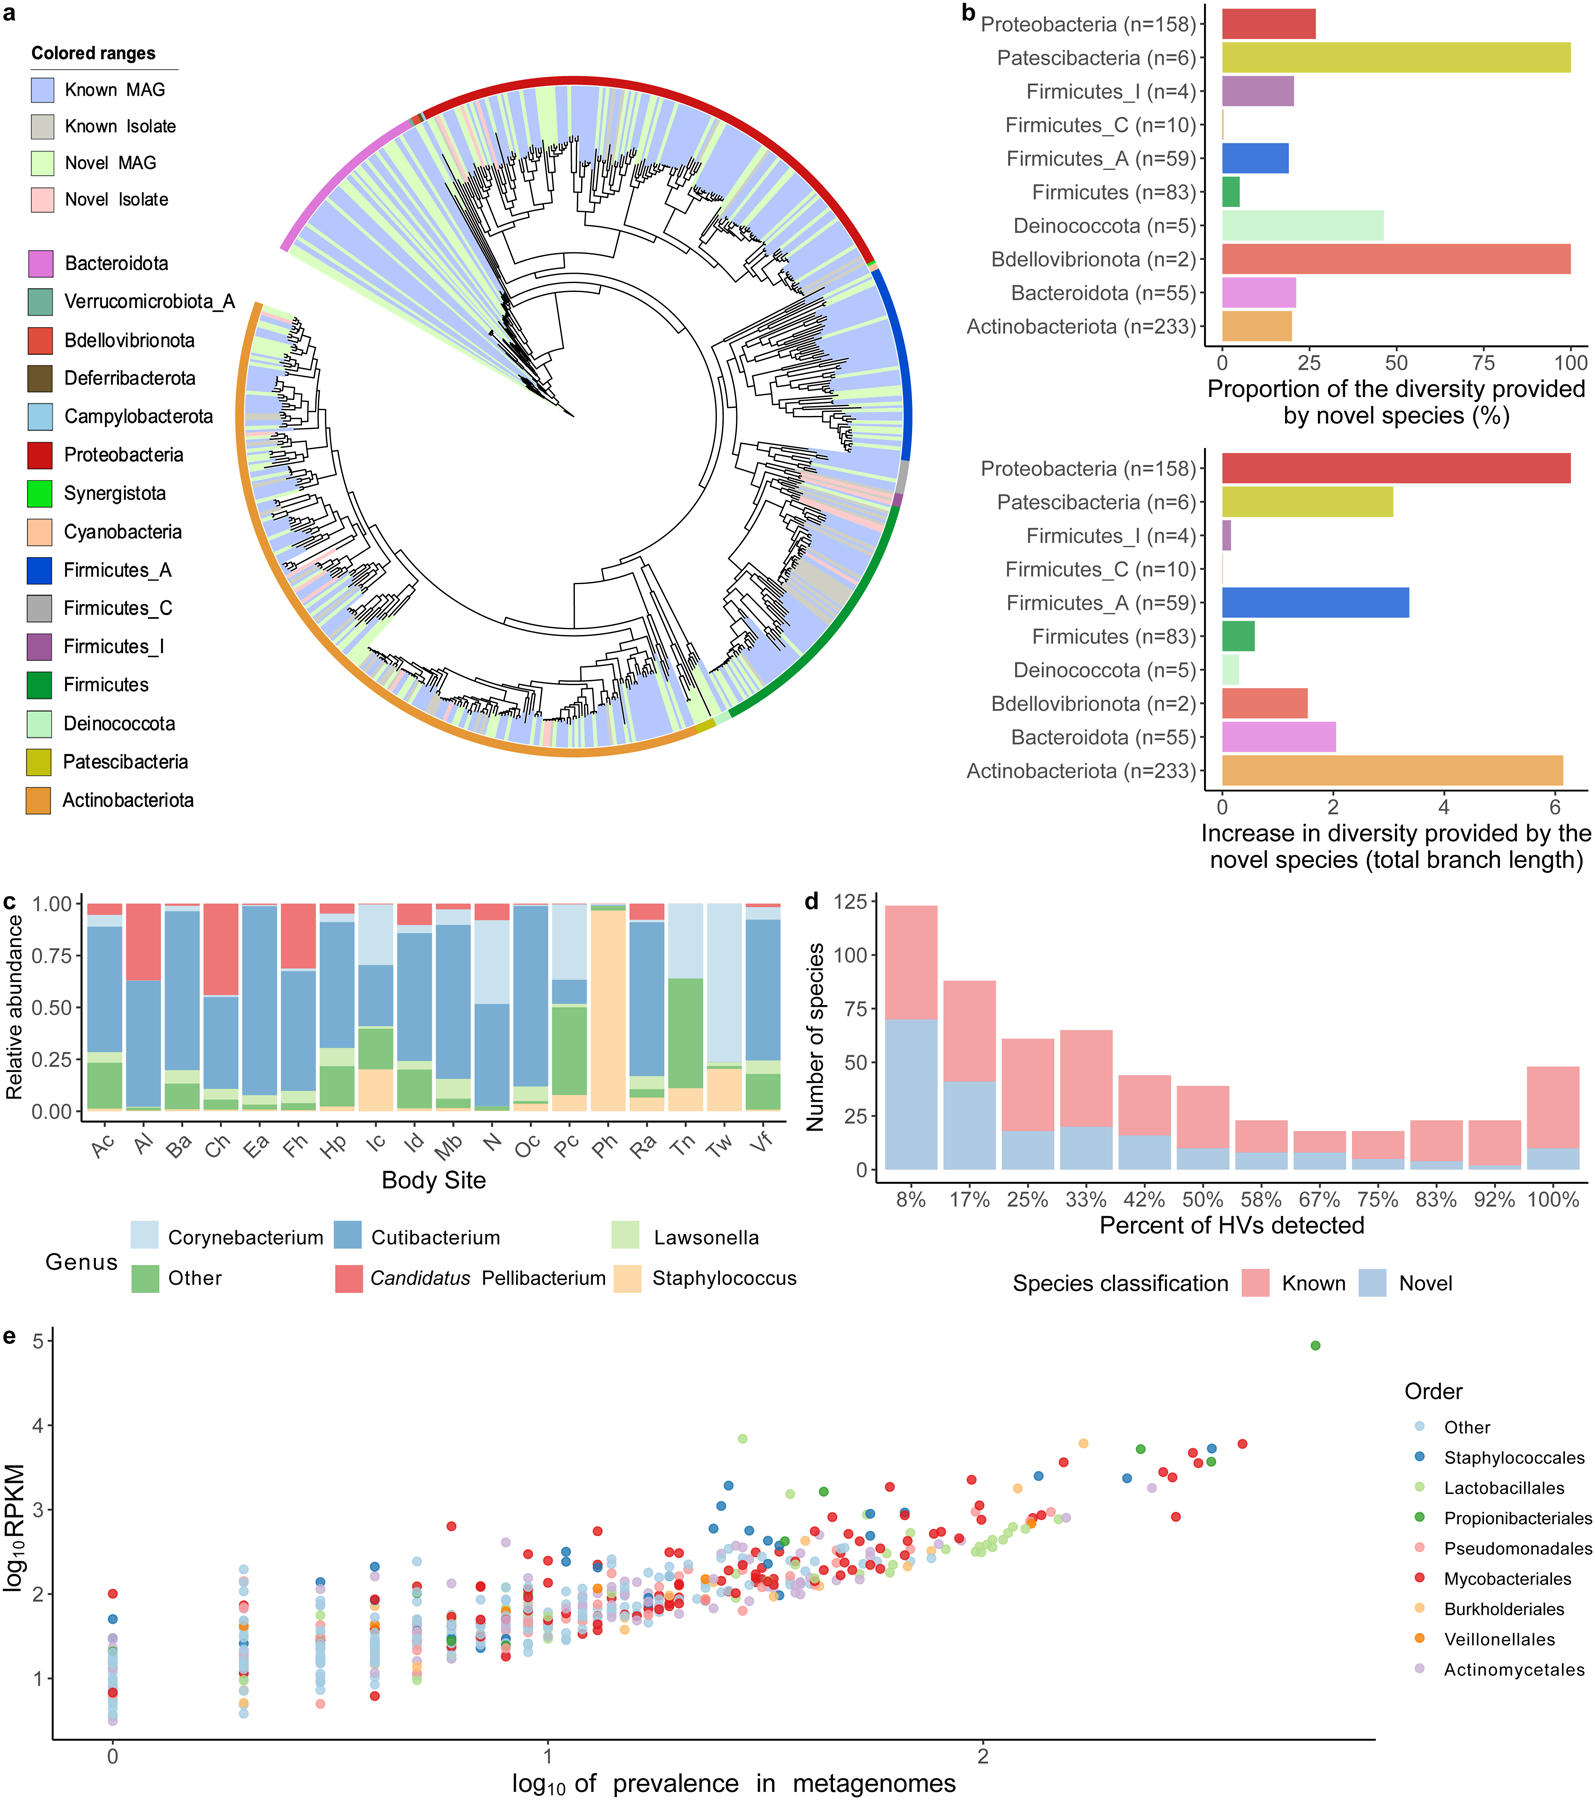
a, Phylogenetic tree of the 621 bacterial MAGs and cultured isolates colored by phyla and whether these are novel or known species. b, Level of phylogenetic diversity provided by the novel species relative to the complete diversity per phylum (top) and represented as absolute total branch lengths (bottom). The number of species from each phylum is depicted in brackets. c, Relative abundance of the most abundant genera found on the skin using the second time point of healthy volunteer HV03 as a representative. Body sites defined in Fig. 1a. d, The number of species shared between the 12 healthy volunteers, colored by their novelty. Presence was defined as having at least 30% of the bacterial genome covered in a sample from any time point or body site for a healthy volunteer. e, The prevalence and abundance (log10RPKM) of the SMGC colored by their taxonomic classification.
To evaluate the extent of novelty in the SMGC, we compared the species we recovered to the former largest MAG collection from the skin (Pasolli, et al.21) and to the GTDB. Of the bacterial species in the SMGC, 174 (28%) were newly-identified (absent from GTDB and the Pasolli skin catalog). Specifically, the SMGC contained 401 species absent from the Pasolli set (35 MAGs were exclusive to that catalog). In addition, of the 220 species shared between the SMGC and the Pasolli catalog, 19 were cultured as part of the SBCC, with an additional 166 (77%) of the species represented by a higher quality score (QS, calculated as completeness − 5 × contamination) MAG in the SMGC. For these MAGs shared by the two catalogues, median QS of the Pasolli et. al MAGs was 84 (IQR= 68–94) while that of the corresponding SMGC MAGs was 96 (IQR= 91–99).
From species to functions of the skin microbiome
According to the composition of the SMGC, Actinobacteriota is the most highly represented phylum on the skin (comprising 38% of the species in our collection). Notably, species newly detected provided an overall 26% increase in phylogenetic diversity of the skin microbiome, with two phyla (Bdellovibrionota, and Patescibacteria) exclusively represented by previously unknown species (Fig. 2). The genus Corynebacterium of the order Mycobacteriales contained the greatest number of newly-identified skin species (n=26). In addition, we report 4 members of the uncultured genus QFNR01 (in the Neisseriaceae family), which was one of the most abundant genera in our dataset (Fig. 2c). In order to aid the identification of this abundant genus in future skin studies, we used a scheme by Pallen et. al22 to name the most abundant member of this genus as Candidatus Pellibacterium faciei (Etymology: L. fem. n. pellis, a skin or hide; N.L. neut. n. bacterium, a bacterium; Pellibacterium: a bacterium associated with the skin, faciei: face).
When assessing species prevalence, we found that 48 species were shared by all twelve healthy volunteers (Fig. 2d). Prevalence was found to correlate with abundance, with Cutibacterium acnes (order Propionibacteriales) and Lawsonella clevelandensis A (order Mycobacteriales) being the most abundant and prevalent (Fig. 2e).
We next explored the metabolic potential of the uncultured species found in the SMGC to understand why some of these abundant and prevalent species have not yet been cultured. Searching for the presence of different KEGG pathways in our genomes (see Methods for more details), we found that uncultured skin bacteria are depleted in metabolic pathways involved in aerobic respiration (e.g., encoding cytochrome oxidases) compared with isolates from the SBCC (Extended Data Fig. 4). These results suggest that one possible reason for the large fraction of uncultured skin microbiota could be that some of these species may be strict anaerobes with very low oxygen tolerance. These anaerobes may also reside in the deeper layers of the skin and may not be captured by the skin swabs typically used for culturing.
Bacterial diversity in the SMGC
To characterize the genomic diversity of common skin inhabitants, we analyzed the pan-genomes of the top six species with the highest number of near-complete genomes, which included species from the abundant Cutibacterium, Corynebacterium, Lawsonella and Staphylococcus genera. As previously reported for other taxa23,24, the gene frequency distribution was bimodal, with most of the genes being classified as core (present in ≥90% of the genomes) or rare (present in <10% of the conspecific genomes) (Extended Data Fig. 5a). Based on the pan-genome accumulation curves, Corynebacterium and Staphylococcus species had the highest rate of gene gain per strain (Extended Data Fig. 5b), suggesting that not only are these species prevalent, but they also exhibit a high level of intra-species diversity. By investigating their functional capacity, we found 20 and 31 KEGG pathways unique to Staphylococcus and Corynebacterium species, respectively (Extended Data Fig. 5c). Several pathways involved in multidrug resistance were found in staphylococci but absent from Corynebacterium. In contrast, Corynebacterium genomes have unique pathways for the synthesis of various amino acids and vitamins, as well as the capacity to use glycogen as a polysaccharide reserve and to produce trehalose through glycogen degradation. Trehalose is a disaccharide that has utility as a reserve carbohydrate but has also been reported to be a stress protectant against desiccation and osmotic stress, conditions typical of human skin25.
Fungal diversity in the SMGC
To expand our analysis of the skin microbiome to other kingdoms, we recovered eukaryotic species from 127,522 genome bins. We identified 499 eukaryotic genomes with >50% completeness and <5% contamination. For eukaryotic MAGs, completeness increased with sample pooling strategies, while contamination and N50 were comparable between all approaches (Extended Data Fig. 6). These 499 eukaryotic MAGs represented 13 species, with genome sizes ranging from 7 Mbp to 21 Mbp (Supplementary Table 5). We did not detect protists in our datasets. Whole genome alignment of the MAGs against publicly available fungal genomes revealed the presence of Malassezia species commonly reported for skin, such as Malassezia restricta, Malassezia globosa, and Malassezia sympodialis. We also recovered three novel Malassezia species, and named them Malassezia auris, Malassezia palmae and Malassezia rara (Fig 3a), which increases the known phylogenetic diversity reported for Malassezia by 15%. M. palmae and M. rara aligned with 84% ANI against their closest GenBank representative, while M. auris matched its closest GenBank representative (Malassezia sp.) with 94% ANI. These novel genomes were distributed throughout the Malassezia phylogenetic tree with M. palmae and M. auris placed in Malassezia clade B, and M. rara in clade C (Fig. 3a).
Fig. 3. Expanded fungal diversity associated with human skin.
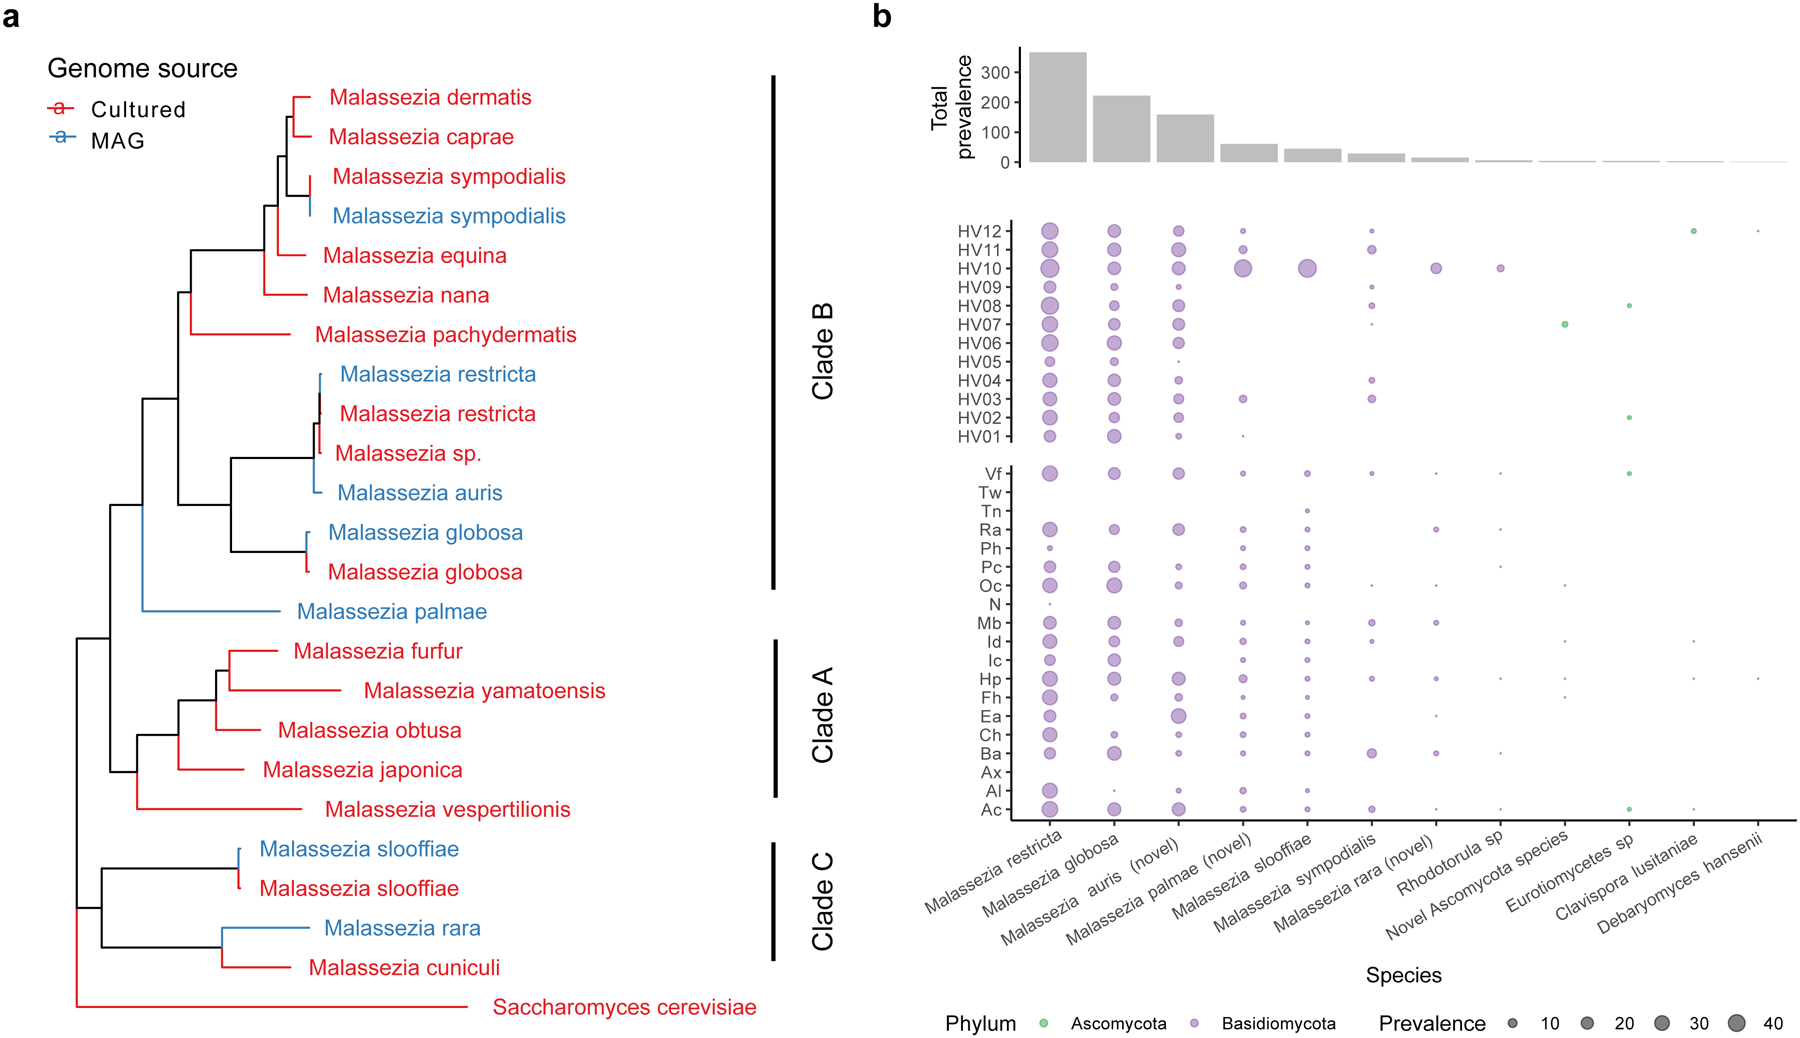
a, A phylogenetic tree of the 7 Malassezia MAGs and 16 reference genomes built using 452 BUSCOs with Saccharomyces cerevisiae as the outgroup. All clades had a bootstrap support of 100% using 1000 replicates. b, Prevalence of the fungal species in all clinical samples, across different healthy volunteers and body sites using 30% aligned fraction of the genome to assign presence. Body sites are defined in Figure 1a.
Malassezia species are associated with healthy human skin and specific cutaneous disorders26. We detected M. globosa and M. restricta in all healthy volunteers (Fig 3b). Likewise, M. auris was widely distributed across 13 body sites and all healthy volunteers. By contrast, M. palmae and M. rara were detected in five and one individual, respectively, but present at multiple time points, suggesting that they were stable residents of these select individuals. Similarly, Rhodotorula sp. was detected in only one individual but present over multiple time points in that individual.
Viruses in the SMGC
We used the VIRify pipeline (https://github.com/EBI-Metagenomics/emg-viral-pipeline v0.2.0) to search for DNA viral sequences in our skin metagenomes and identified a total of 15,951 eukaryotic virus and phage sequences which yielded 6,935 viral sequences in total after quality-filtering (Extended Data Fig. 6d) of which 1,503 were high-quality27 or complete genomes (Extended Data Fig. 7a) (Supplementary Table 6). Of the 6,935 quality-filtered viral sequences, 386 were predicted to be prophages. We performed a high-level taxonomic classification and clustering of the quality-filtered viral sequences together with additional prokaryotic viruses available in NCBI RefSeq based on their shared protein content (Fig. 4a). A total of 3,156 viral sequences did not cluster (i.e. were singletons). Viruses that did not cluster with RefSeq viruses included eukaryotic viruses typically found on the human skin, such as Papilomaviridae. Even by comparing our viral sequences to the more comprehensive IMG/VR database28 and the Gut Phage Database29, 5,808 (83%) and 6,191 sequences (89%), respectively, did not have a positive match (Extended Data Fig. 7a). Most viral sequences in the SMGC were taxonomically classified to the order Caudovirales, including the families Siphoviridae and Myoviridae.
Fig. 4. Jumbo phages found on the human skin are shared between individuals and body sites.
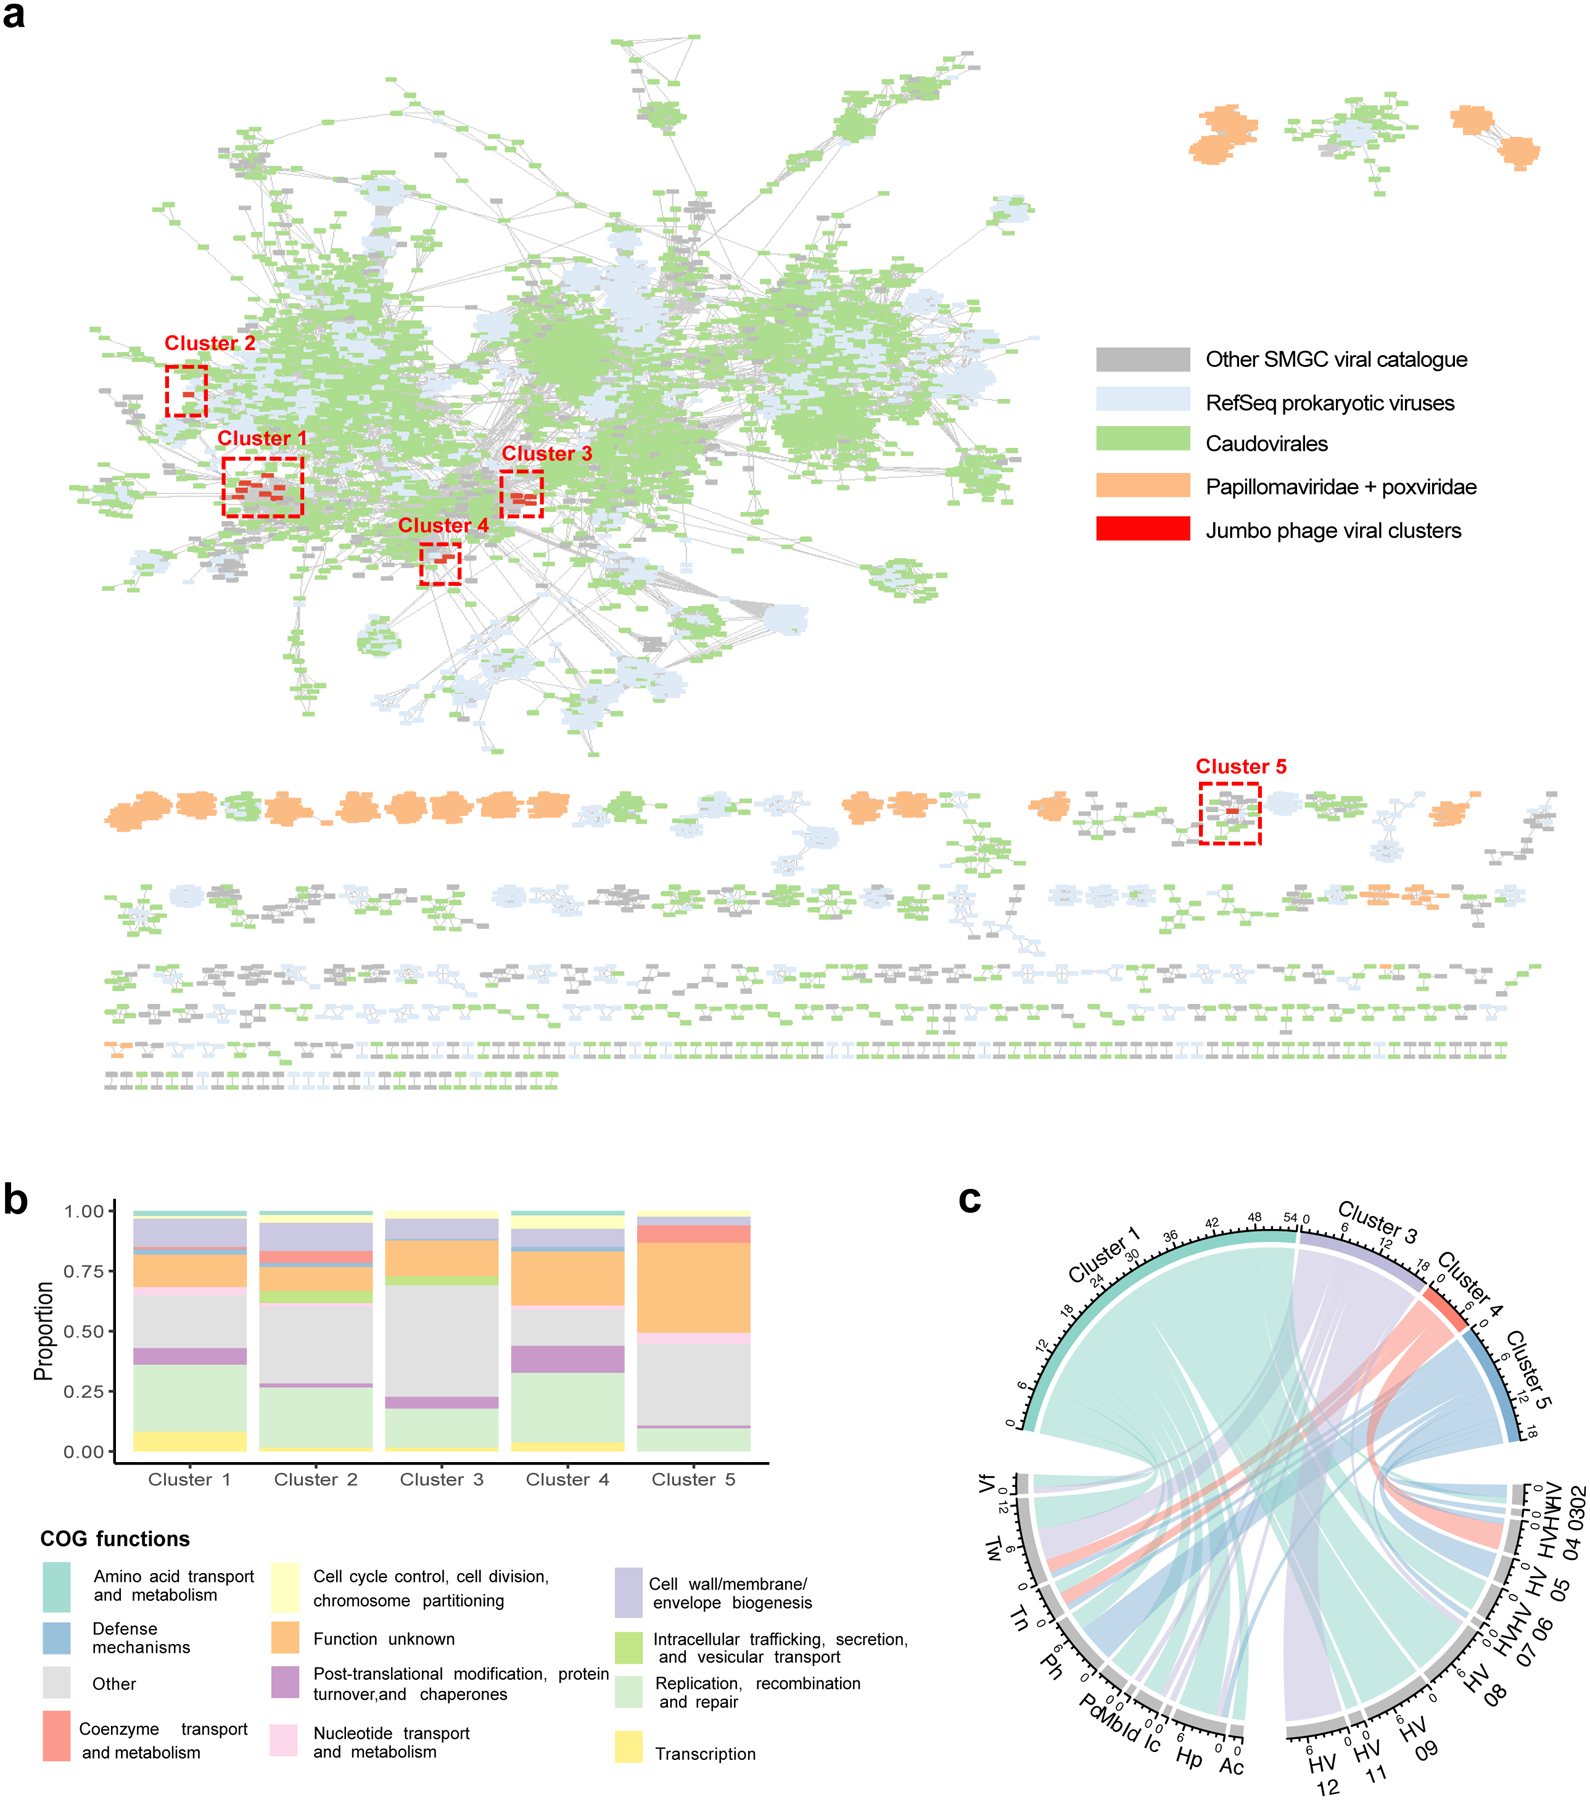
a, Clustering of viral genomes from the SMGC and RefSeq based on shared protein content. Each node in the network represents a genome and each edge indicates similarity between the corresponding genomes. Clusters with fewer than five members were excluded. Clusters of jumbo phages are boxed in red. b, Functional annotation of the viral genome clusters summarized via COG functional categories. c, Chord diagram depicting the number of samples where we detected each viral cluster across our 12 healthy volunteers and body sites with presence defined as at least 75% of the genome being covered. Body sites are defined in Figure 1a.
In order to link phage sequences to their corresponding bacterial hosts, we determined the CRISPR spacer sequences found in the SMGC bacteria and compared them to our viral catalog. We identified hosts for 740 of the 6,935 viral contigs, with the greatest diversity of CRISPR spacers per bacterial genome associated with the genus Cutibacterium (Extended Data Fig. 7b). We also explored the stability of the skin virome over time and found that the virome diversity of sebaceous sites is more stable than non-sebaceous sites for the 12 individuals considered in this work (Extended Data Fig. 7c). These results may reflect the stability of the prokaryotic and eukaryotic hosts of the viruses detected herein.
Jumbo phages are of interest for various applications, such as the design of phage-based therapies. We searched for the presence of viral sequences with length >200 kb and identified 20 distinct jumbo phages of up to 380 kb in size, 16 of which aggregated into 5 major clusters (Fig. 4a). One member of cluster 1 was identified as a prophage based on the detection of a ~10 kb flanking region mapping to the Corynebacterium genus. CRISPR host association predicted that four members of this cluster are able to infect the genera Lawsonella and Corynebacterium. For viral cluster 4, the most likely hosts were predicted to be the genera Rothia, Corynebacterium, and Lawsonella.
Functional characterization of the viral clusters predicted that most proteins are involved in replication, recombination, and repair, but a notable portion (16%) were uncharacterized (Fig. 4b). Our viral cluster 5 jumbo phage, with genome size of 259,892 bp, was in the same cluster as the Acinetobacter jumbo phage vB_AbaM_ME3, previously isolated from wastewater effluent and reportedly able to lyse the nosocomial pathogen A. baumanni30. The phage was present in 18 samples, including the plantar heel (Fig. 4c). Accordingly, we recovered the bacterium A. baumanni as a MAG in 32 samples, with 11 of those samples coming from plantar heel. In agreement with a previous investigation, we found that this jumbo phage has the ability to synthesize its own DNA replication machinery and has genes encoding cell wall degrading enzymes such as lysozymes and hydrolases, and genes involved in Ter-stress responses30 (Extended Data Fig. 8). We also found genes encoding dUTPase, 2OG-Fe(II) oxygenase superfamily, and also methyltransferases (which can be used by phages to modify their DNA and evade restriction attacks)31. Collectively, these results uncover the existence of distinct groups of jumbo phages predominantly on foot sites such as the toenail and toe web (Fig. 4c) — where Corynebacterium is abundant (Fig. 2c) — and on multiple individuals.
Using metagenomic read mapping, we compared the performance of the SMGC with the Kraken2 standard database (RefSeq) and the previous skin database compiled in Pasolli et al.21. The SMGC assigned a median of 85% of reads (IQR = 64–94%), while the Kraken2 standard database assigned 69% (IQR = 51–86%) and the Pasolli skin database 65% (IQR = 40–84%). Body sites with the greatest improvement over the Pasolli et al. catalog or RefSeq database were the ear canal, foot sites such as the toenail and toe web, and the nares (Extended Data Fig 9a). Species previously undetectable in these sites predominantly belonged to the orders Mycobacteriales (e.g. 13 new species from the genus Corynebacterium) and Lactobacillales (11 new species belonging to Streptococcus, Extended Data Fig. 9b).
Using our skin microbiome compendium we characterized the patterning of microbes across different body sites. Here, we found that Lawsonella clevelandensis A and a species from the Candidatus Pellibacterium genus are notable members of sebaceous sites (Extended Data Fig. 10a). Furthermore, we found Alloiococcus otitis and Malassezia auris as abundant and prevalent colonizers of the external auditory canal (Extended Data Fig. 10b). In addition, in the nares, major constituents included a novel Candidatus Pellibacterium species and a novel Corynebacterium species (here named Corynebacterium naris (of the nostril)) that was recovered as a MAG and an isolate. Furthermore, our work suggests that the toe web is a site that is abundant in viruses (Extended Data Fig. 10a). Understanding the role of viruses, such as the aforementioned jumbo phages, in the microbial ecology of this site should be the target of future work.
DISCUSSION
We report here a collection of skin microbial genomes derived using cultivation and whole genome sequencing and using de novo assembly and binning of metagenomes, with the majority of samples being obtained from individuals resident in North America. Evaluating how representative the SMGC is of the skin microbial diversity compared to other available datasets, we found that the SMGC assigned a median of 85% of reads, while the Kraken2 standard database assigned 69% and the Pasolli skin database 65%. Sebaceous sites, such as the back, alar crease, and occiput were the most well-characterized by the SMGC. Body sites with notable unclassified reads remaining include the interdigital web, hypothenar palm, and plantar heel, which are frequently exposed to the environment and likely host low abundance organisms and transients (Extended Data Fig. 7c) with insufficient coverage to generate high-quality MAGs, even with the various pooling strategies employed in this work.
In summary, the SMGC provides a genome-centric view of the microbial populations found on the skin. By extensive culturing, deep metagenomic sequencing, adopting different pooling strategies for the samples, and expanding our investigation to publicly available skin metagenomes, we uncovered novel diversity, some of which we were able to cultivate. Our skin microbiome study primarily focused on individuals from the US due to sample availability (Supplementary Table 3), but future work should aim to expand the SMGC with isolates from different populations. Our work provides a genomic blueprint for skin microbes that we hope will support future investigations into improving our understanding of the skin microbiota in health and designing therapies to combat skin diseases with a microbial basis.
ONLINE METHODS
Metagenomic sequencing and bacterial culturing
594 metagenomic shotgun skin samples from our previous investigation of the skin3 were downloaded from the NCBI SRA archive under the study accession SRP002480 using parallel-fastq-dump v0.6.6 (https://github.com/rvalieris/parallel-fastq-dump) with options --skip-technical --split-3 --sra-id. This metagenomic dataset includes 12 healthy volunteers and 19 body sites that were longitudinally sampled up to three times over several years (Fig. 1a), with the first and second time points roughly separated by 1 year and the second and third time points by a month. We deeply sequenced 50 samples from the antecubital fossa, retroauricular crease, nare, and volar forearm of five of these healthy volunteers roughly 4 years after the third time point as part of the study approved by the Institutional Review Board of the National Human Genome Research Institute (http://www.clinicaltrials.gov/ct2/show/NCT00605878)1,3. This study complies with all ethical regulations. Written informed consent was obtained from subjects. Compensation was provided to acknowledge the time and inconvenience of the subjects. The data for this fourth time point has been uploaded to the SRA under the same study accession. We additionally sequenced negative controls from the water and air to account for potential contaminants.
To create a more comprehensive dataset, we queried the European Nucleotide Archive for additional skin metagenomic datasets using the search terms “human skin microbiome” and “skin microbiome” with “WGS” as the “library strategy”. Two studies were excluded because they involved the application of products to the skin, making it difficult to distinguish contamination from members of the healthy skin microbiome. These additional datasets represented 8 countries and more than 200 subjects. The total set of metagenomes analyzed in this work spanned 1,918 samples from 15 studies (Supplementary Table 3).
To establish the Skin Bacterial Culture Collection (SBCC), we cultured isolates from 12 healthy volunteers, supplemented with stored isolates from 27 additional individuals (5 healthy and 22 with skin disorders). We cultured from 13 body sites for which we had metagenomic data (antecubital fossa (Ac), external auditory canal (Ea), forehead (Fh), hypothenar palm (Hp), inguinal crease (Ic), manubrium (Mb), nare (N), occiput (Oc), popliteal fossa (Pc), plantar heel (Ph), retroauricular crease (Ra), toeweb space (Tw), volar forearm (Vf), Fig. 1a) in addition to two other body sites: the umbilicus (Um) and gluteal crease (Gc) (Supplementary Table 2). Skin samples were collected for culturing using three different methods. For the primary method, by which most isolates were obtained, skin samples were collected with eSwabs (COPAN e480C) in liquid Amies medium, immediately diluted and then plated on various culture media and grown for up to 7 days under various conditions (Supplementary Table 1). When constrained for time, culture swabs were taken with pre-moistened Puritan foam swabs and placed into 2 ml Fastidious broth with 20% glycerol and stored at −80°C. Samples were thawed, diluted, and plated on standard media (Supplementary Table 1). Lastly, to select for Gram-negative bacteria, additional samples taken with Puritan foam swabs in R2A Broth containing Vancomycin and Amphotericin B were incubated at 32°C for 72 hours with shaking4. Culture medium was diluted and plated on R2A or Chocolate agar and incubated until colonies formed or up to 7 days. Colonies from all samples were collected in 96 well plates with 20% glycerol and fastidious broth. Colonies were taxonomically classified by amplifying the full length 16S rRNA gene with the primers 8F (5’-AGA GTT TGA TCC TGG CTC AG-3’) and 1391R (5’-GAC GGG CGG TGW GTR CA-3’), followed by Sanger sequencing with the 8F primer to classify the isolate against the Ribosomal Database Project (RDP)32. Colonies of interest were grown on the appropriate culture plates and genomic DNA was extracted and processed for sequencing. For more information regarding the isolates please refer to the Supplementary Table 2.
Pre-processing and assembly of metagenomic data
Sequence quality control and trimming of adapters were performed using KneadData v0.7.433 with Bowtie2 v2.3.5.1 and Trimmommatic-0.3934 with the options ‘--trimmomatic-options “SLIDINGWINDOW:4:20 MINLEN:50”‘ and ‘--bowtie2-options “--very-sensitive --dovetail”‘. After preprocessing, the input for each pooled sample was generated by concatenating the relevant forward reads and reverse reads. As depicted in Fig. 1a, the Pool Site input datasets were generated by concatenating all the runs pertaining to a single body site and time point. The Pool HV input datasets were generated by concatenating all the runs pertaining to a single healthy volunteer and time point. The Pool Time datasets were generated by concatenating all the runs for a single healthy volunteer and body site, across different time points. To account for potential lane-specific biases, the data was also analyzed at a sub-sample level as many of the sequencing libraries derived from clinical samples were split onto multiple runs for sequencing. There were 644 Per Sample, 215 Pool Time, 56 Pool HV, 46 Pool Site, and 2,336 Single Run samples. For further detail regarding the skin datasets analyzed in this work refer to Supplementary Table 3.
Metagenome binning and quality assessment
Assembly of metagenomic reads per sample or run was performed with SPAdes35 v.3.13.0 with the option ‘--meta’. The pooled samples were assembled with SPAdes v.3.13.0 with the options ‘--meta’ and also with ‘--only-assembler’, which skips read error correction to reduce assembly time. After assembly, metaWRAP36 v1.2.1 was used to bin the assemblies using the binning module with the options ‘--maxbin2 --metabat2 --concoct’. For the pooled samples, the forward and reverse reads that were used in the pooling were provided to metaWRAP individually.
The ‘lineage_wf’ workflow of CheckM v1.1.237 was used to calculate the completeness and contamination of each genome. Quality score (QS) was calculated as completeness - 5 x contamination. Bin refinement was also performed with metaWRAP, using the ‘bin_refinement’ module with the options ‘-c 50 -x 10’, which set the quality thresholds at ≥50% completeness ≤10% contamination. The detection of rRNAs in each genome was performed with the ‘cmsearch’ function of INFERNAL v1.1.238 (options ‘-Z 1000 --hmmonly --cut_ga --noali --tblout’) against the Rfam39 covariance models for the 5S, 16S and 23S rRNAs. tRNAs of the standard 20 amino acids were identified with tRNAScan-SE v2.040 with options ‘-B -Q’ for species belonging to bacterial lineages. Based on the MIMAG criteria18, MAGs with >90% completeness, <5% contamination, presence of 5S, 16S, 23S rRNA genes and at least 18 tRNAs were reported as high-quality draft genomes. MAGs with ≥50% completeness and <10% contamination were reported as medium quality. The N50 of these MAGs — the minimum contig length that contains 50% of the total genome length — was also calculated using the ‘stats.sh’ script from BBMap v.37.6241.
We used GUNC v1.0.1 to assess the chimericity of the MAGs. MAGs with contamination greater than 0.05, clade separation greater than 0.45, and reference representation score greater than 0.5 were considered chimeric and excluded from the SMGC. To further evaluate MAG quality, we classified each MAG and also every contig within each MAG using the contig annotation tool (CAT) v5.2.1 and the 2020-11-23_CAT database42 using default settings. We determined the percent of the genomic content of each MAG that was mismatched by comparing the taxonomic classification of the contig to that of its corresponding MAG.
The quality of the medium- and high-quality MAGs was also assessed by comparing them to the WGS of isolates cultured from the skin. The function ‘mash sketch’ from Mash v2.0 was used to create a MinHash sketch of the dereplicated isolates using a k-mer size of 21 and sketch size of 1,000. Next, the Mash distance between each MAG and each isolate genome was calculated using ‘mash dist’. The MAG and the top ten closest genomes (lowest Mash distances) were compared by aligning the genomes with ‘dnadiff’ from MUMmer v3.23. The MAG greatest aligning per isolate was selected for further analysis. A species-level match between the MAG and the isolate genome was supported with an aligned fraction of ≥30% and an ANI of ≥95%. We also compared the MAGs and isolate genomes using an aligned fraction of ≥30% and an ANI of ≥99%. The misassembled fraction and mismatches for each MAG in relation to the best matching isolate were estimated via QUAST (v5.0.2) using default settings. A genome dot plot between the MAG and the matching isolate was generated using ‘mummerplot’ with the options --layout and --filter.
Taxonomic assignment
To determine the number of non-redundant MAGs, the MAGs were dereplicated based upon with ‘dRep dereplicate’ with the options ‘-pa 0.999’, ‘-nc 0.30’, and the options ‘--SkipSecondary -cm larger -comp 90 -con 5’. The MAGs from metaWRAP bin refinement were dereplicated at a species level using dRep43 v2.3.2 with ‘dRep dereplicate’ and the options ‘-pa 0.9’ (primary cluster at 90%), ‘-sa 0.95’ (secondary cluster at 95%), ‘-nc 0.30’ (coverage threshold of 30%), ‘-cm larger’ (coverage method: larger), ‘-comp 50’ (completeness threshold of 50%), and ‘-con 5’ (contamination threshold of 5%). Representative genomes were selected based on the dRep scores derived from genome completeness, contamination, and assembly N50. If a MAG and an isolate were in the same secondary dRep cluster, the isolate genome was preferentially selected as its representative over the MAG. If more than one isolate genome was in a secondary dRep cluster, the isolate genome with the highest dRep score was chosen as the cluster representative for the species in the genome catalog. The upset plot to investigate species overlap across assembly strategies was generated using the ComplexHeatmap package44.
Taxonomic classification of each MAG and isolate was performed using the GTDB-Tk v1.0.245 classify workflow with ‘gtdbtk classify_wf’ using the GTDB database release 8946, which spans 145,904 genomes grouped into 24,706 species clusters. We built maximum-likelihood trees de novo using the protein sequence alignments generated by GTDB-Tk. To build the phylogenetic tree, we used IQ-TREE v2.1.2 with default options, where the best fit model was automatically selected by ‘ModelFinder’ on the basis of the Bayesian information criterion (BIC) score. The phylogenetic trees were visualized using iTOL47. A newly-identified taxon was determined by comparison with the GTDB database and the Pasolli et al. MAG catalog21. The number of novel genera was determined by clustering genomes without a genus assignment by GTDB using a Mash distance threshold of 0.2. Phylogenetic diversity (PD) was calculated as the sum of total branch lengths. The increase in diversity provided by the novel genomes was calculated as (PDtotal - PDknown) / PDknown × 100.
To exclude potential reagent/sample processing contaminants from our catalogue, we mapped the pooled reads of the negative controls to the SMGC. Three skin commensals (Cutibacterium acnes, Cutibacterium granulosum, Cutibacterium humerusii) had a genome coverage >30%. These skin commensals could have been introduced during the sample preparation. Alternatively, the reason for their presence is that negative controls are subject to sequencing technique imperfections, such as cross-contamination or index bleed-through, all of which can cause genuine signals to appear in the negative controls. For this reason, no member of the SMGC was excluded as a potential contaminant.
Functional characterization
MAGs were first annotated using Prokka v.1.13.3 to predict protein-coding sequences (CDS). For the pan-genome analyses, we first dereplicated the near-complete MAGs with ‘dRep dereplicate’ with the options ‘-pa 0.999’, ‘-nc 0.30’, and the options ‘--SkipSecondary -cm larger -comp 90 -con 5’. Conspecific genomes (i.e, strains) were then analyzed using Panaroo v1.2.448 using the options ‘--clean-mode strict’ and ‘--merge_paralogs’ and the parameters ‘-c 0.90’ for a minimum amino acid identity of 90% for a positive match, ‘--core_threshold 0.90’ and a family threshold (-f) of 50%. Gene accumulation curves were calculated using the ‘post-plot-runner.py’ script.
To better understand the metabolisms of the species within the SMGC, we used DRAM v1.2.049 to annotate and distill annotations of the genomes using all available databases except for the KEGG database. For characterization of the KEGG pathways, HMMER v3.1b2 (hmmscan) was used against the KOfam models50 to annotate the predicted CDS using the gathering thresholds predefined for each model. Next, the completeness of each KEGG pathway per genome was estimated as the percentage of the total KOs required to encode each pathway. Bacterial pathways that had greater than 80% completeness were kept for downstream analyses.
Recovery and taxonomic characterization of eukaryotic MAGs
The original contigs assembled with SPAdes were clustered based on sequence composition and coverage across samples with CONCOCT51, a binning algorithm that is independent of prokaryotic genome characteristics. Before proceeding with more extensive analysis, the 127,522 bins produced by CONCOCT were filtered with EukRep v0.6.7 to only retain those with significant amounts of eukaryotic DNA. More specifically, the ‘filter_euk_bins.py’ script was used to select bins with >1 Mbp of eukaryotic bases. Next, EukCC v0.252 was used to estimate bin completeness and contamination of the 1,246 filtered CONCOCT bins. Of the filtered bins, 499 passed the criterion of at least 50% completeness and less than 5% contamination. The N50 of the MAGs was calculated using the ‘stats.sh’ script from BBMap v.37.6241. To dereplicate the fungal MAGs, we used dRep dereplicate and the options ‘-pa 0.9’ (primary cluster at 90%), ‘-sa 0.95’ (secondary cluster at 95%), ‘-nc 0.30’ (coverage threshold of 30%), ‘-cm larger’ (coverage method: larger), ‘-comp 50’ (completeness threshold of 50%), and ‘-con 5’ (contamination threshold of 5%). Next, we used anvi’o v6.153 to examine the differential coverage and GC content of the eukaryotic MAGs and we excluded one MAG that appeared to have evidence of chimericity in its coverage profile.
All the fungal genomes present in GenBank were downloaded using ncbi-genome-download v0.2.12 (https://github.com/kblin/ncbi-genome-download) with the options ‘fungi’, ‘--genus Malassezia’ and ‘--section genbank’. The MAGs were compared to all the genbank fungi genomes first using Mash and then through whole genome alignment via MUMmer of the best Mash hit. A species-level match was defined as more than 30% of the MAG genome aligning with at least 95% ANI. We built a phylogenetic tree of the 7 Malassezia MAGs, 16 Malassezia reference genomes and Saccharomyces cerevisiae using 452 single copy marker genes identified via BUSCO v5.0.0 using the option --auto-lineage-euk. To construct the phylogenetic tree, we aligned each BUSCO family with MUSCLE v3.8.1551 and trimmed alignments using default settings with trimAl v1.4. We concatenated alignments and generated a ML species phylogeny using IQ-TREE v2.1.2 with model selection from ModelFinder, 1000 ultrafast bootstrap approximations and 1000 SH-aLRTs. To determine the increase in phylogenetic diversity through the incorporation of our Malassezia MAGs, we calculated the sum of total branch lengths with and without our novel Malassezia MAGs.
Detection and characterization of viral sequences
The VIRify pipeline (https://github.com/EBI-Metagenomics/emg-viral-pipeline v0.2.0) was run on the unbinned metagenome assemblies with the parameter ‘--length 5.0’ to detect putative viral sequences of at least 5 kb. Viral sequences predicted in both categories were subsequently clustered with CD-HIT54 v4.8.1 using cd-hit-est with options ‘-c 0.9’, local alignment ‘-G 0 -aS 0.75’. To assess the quality of these viral sequences we used the CheckV v0.7.027 ‘end_to_end’ pipeline. For quality-filtering, viral sequences were kept if they were classified as “high confidence” via the VIRify pipeline, were of medium-quality or higher according to CheckV, or had more viral genes than host genes according to CheckV. Jumbo phages were identified as bacteriophages with a genome length above 200 kb. To assess the novelty of our viral sequences, we compared them to the IMG/VR database and the Gut Phage Database via BLASTn v2.10.1 using an E-value cut off of 10−10 and an alignment length of at least 80%. To taxonomically classify the viral contigs, we used DemoVir (https://github.com/feargalr/Demovir). We clustered the viral proteins obtained through Prodigal using vContTACT v255 using ‘--rel-mode Diamond’, comparing with the RefSeq prokaryotic viral database using options ‘--db ProkaryoticViralRefSeq94-Merged --pcs-mode MCL --vcs-mode ClusterONE’. The resulting network was loaded into Cytoscape for visualization. We used eggNOG v2.0.156 to functionally characterize the jumbo phages using the option ‘-m diamond’. The CRISPR spacers were identified from the prokaryotic MAGs using CRISPRCasFinder.pl v2.0.2 with the options --meta. CRISPR spacers were compared to our viral catalog using BLASTn optimized for short alignments using ‘-evalue 1 -gapopen 10 -gapextend 2 -reward 1 -penalty -1 -word_size 5’. We kept viral sequence matches with an E-value of less than 10−7 and a mismatch of 0.
Read mapping to quantify species presence and abundance
Species prevalence and abundance were determined using BWA-MEM v0.7.16 to map individual reads to the genome catalog of isolates, bacterial and eukaryotic MAGs and viruses, with species presence inferred by assessing the level of genome breadth of coverage. The threshold to assign genome presence for each bacterial or fungal species was a minimum coverage of at least 30%. The relative abundance of each species was determined by taking the primary alignments using samtools v1.5 (option -F 256) and subsetting the primary alignments where at least 60% of the read aligned with at least 90% identity. We then calculated the proportion of uniquely mapped and correctly paired reads by filtering the total read count using ‘samtools view’ with the options ‘-q 1 -f 2’. Abundance was calculated by normalizing the read counts by both genome size and sequencing depth using the Reads Per Kilobase Million (RPKM) formula. For the viral read mapping, we used a previously established criterion of 75% of the viral contigs mapping with ≥90% identity57. To compare the reads assigned using the SMGC compared to the standard Kraken 2 database (downloaded on 2019/12/14) and the Pasolli et al. catalog, we used Kraken 2 (v2.0.8) with option ‘--confidence 0.1’.
Extended Data
Extended Data Fig. 1. Genome statistics of the prokaryotic skin MAGs.
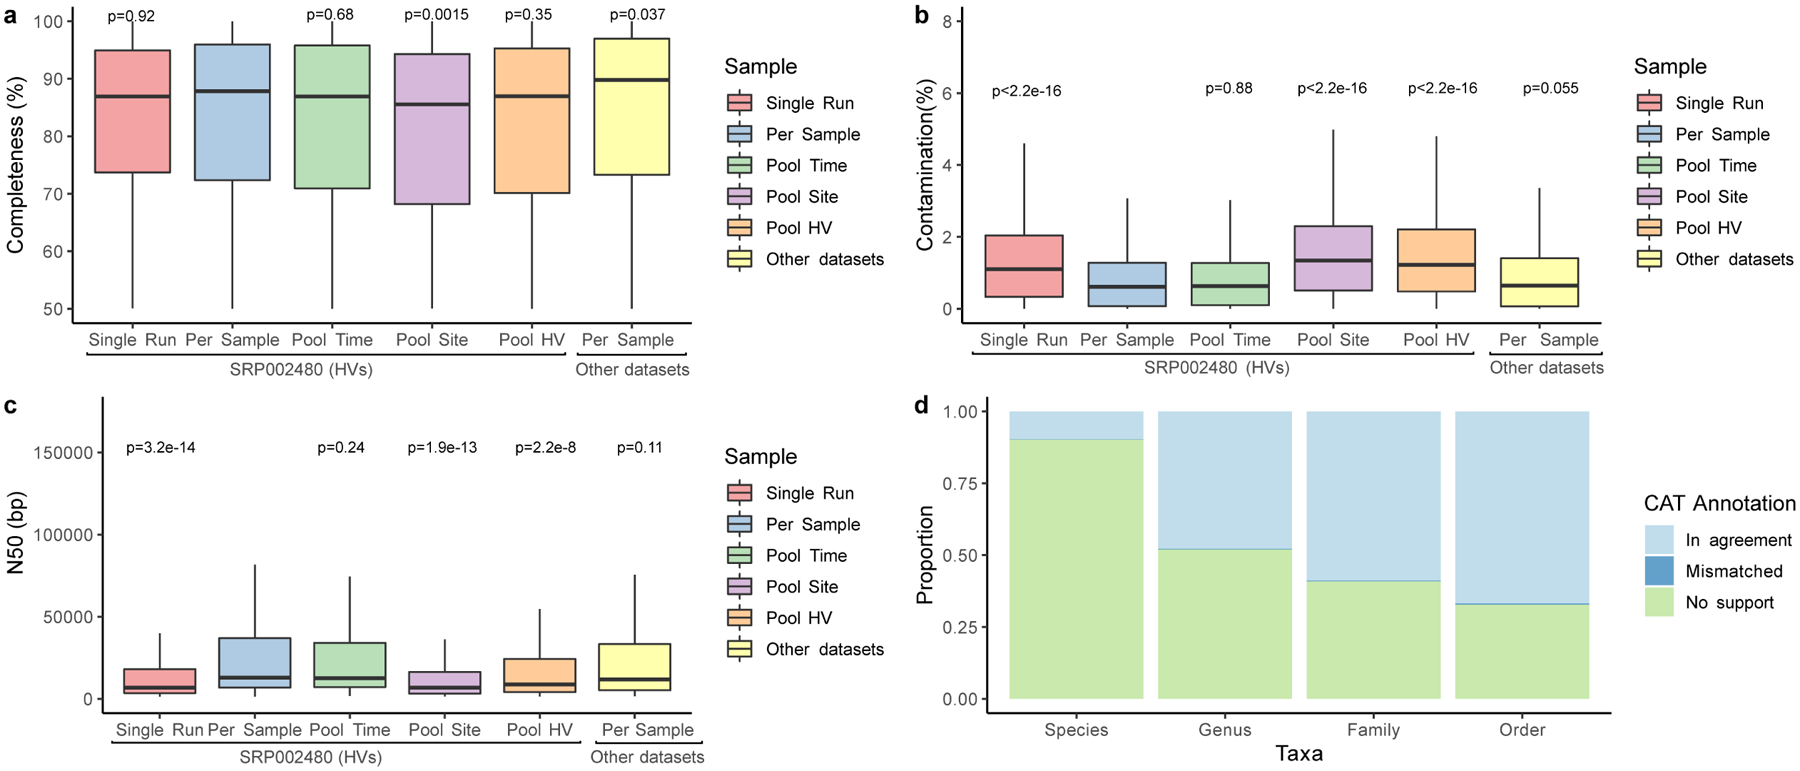
a, The completeness and b, contamination estimates for genomes (Single Run, n=2,389; Per Sample, n=1,206; Pool Time, n=973; Pool Site, n=1,171; Pool HV, n=1,054, Other datasets, n=1,099) recovered from different metagenomic samples as determined by CheckM. ‘Other datasets’ refers to skin metagenomes excluding the healthy volunteer dataset SRP002480. c, N50 of these MAGs as determined through BBMap. Significance for a-c was determined using the two tailed t-test relative to Per Sample, with ns representing not significant. d, The mean proportion of these genomes classified as taxonomically mismatched by comparing the annotation of the bin to the annotation of each contig via the contig annotation tool (CAT). ‘No support’ indicates that no taxonomic annotation was available at the respective rank. In panels a, b and c, box lengths represent the IQR of the data, with whiskers depicting the lowest and highest values within 1.5 times the IQR of the first and third quartiles, respectively.
Extended Data Fig. 2. Comparison of MAG and SBCC isolate genomes.
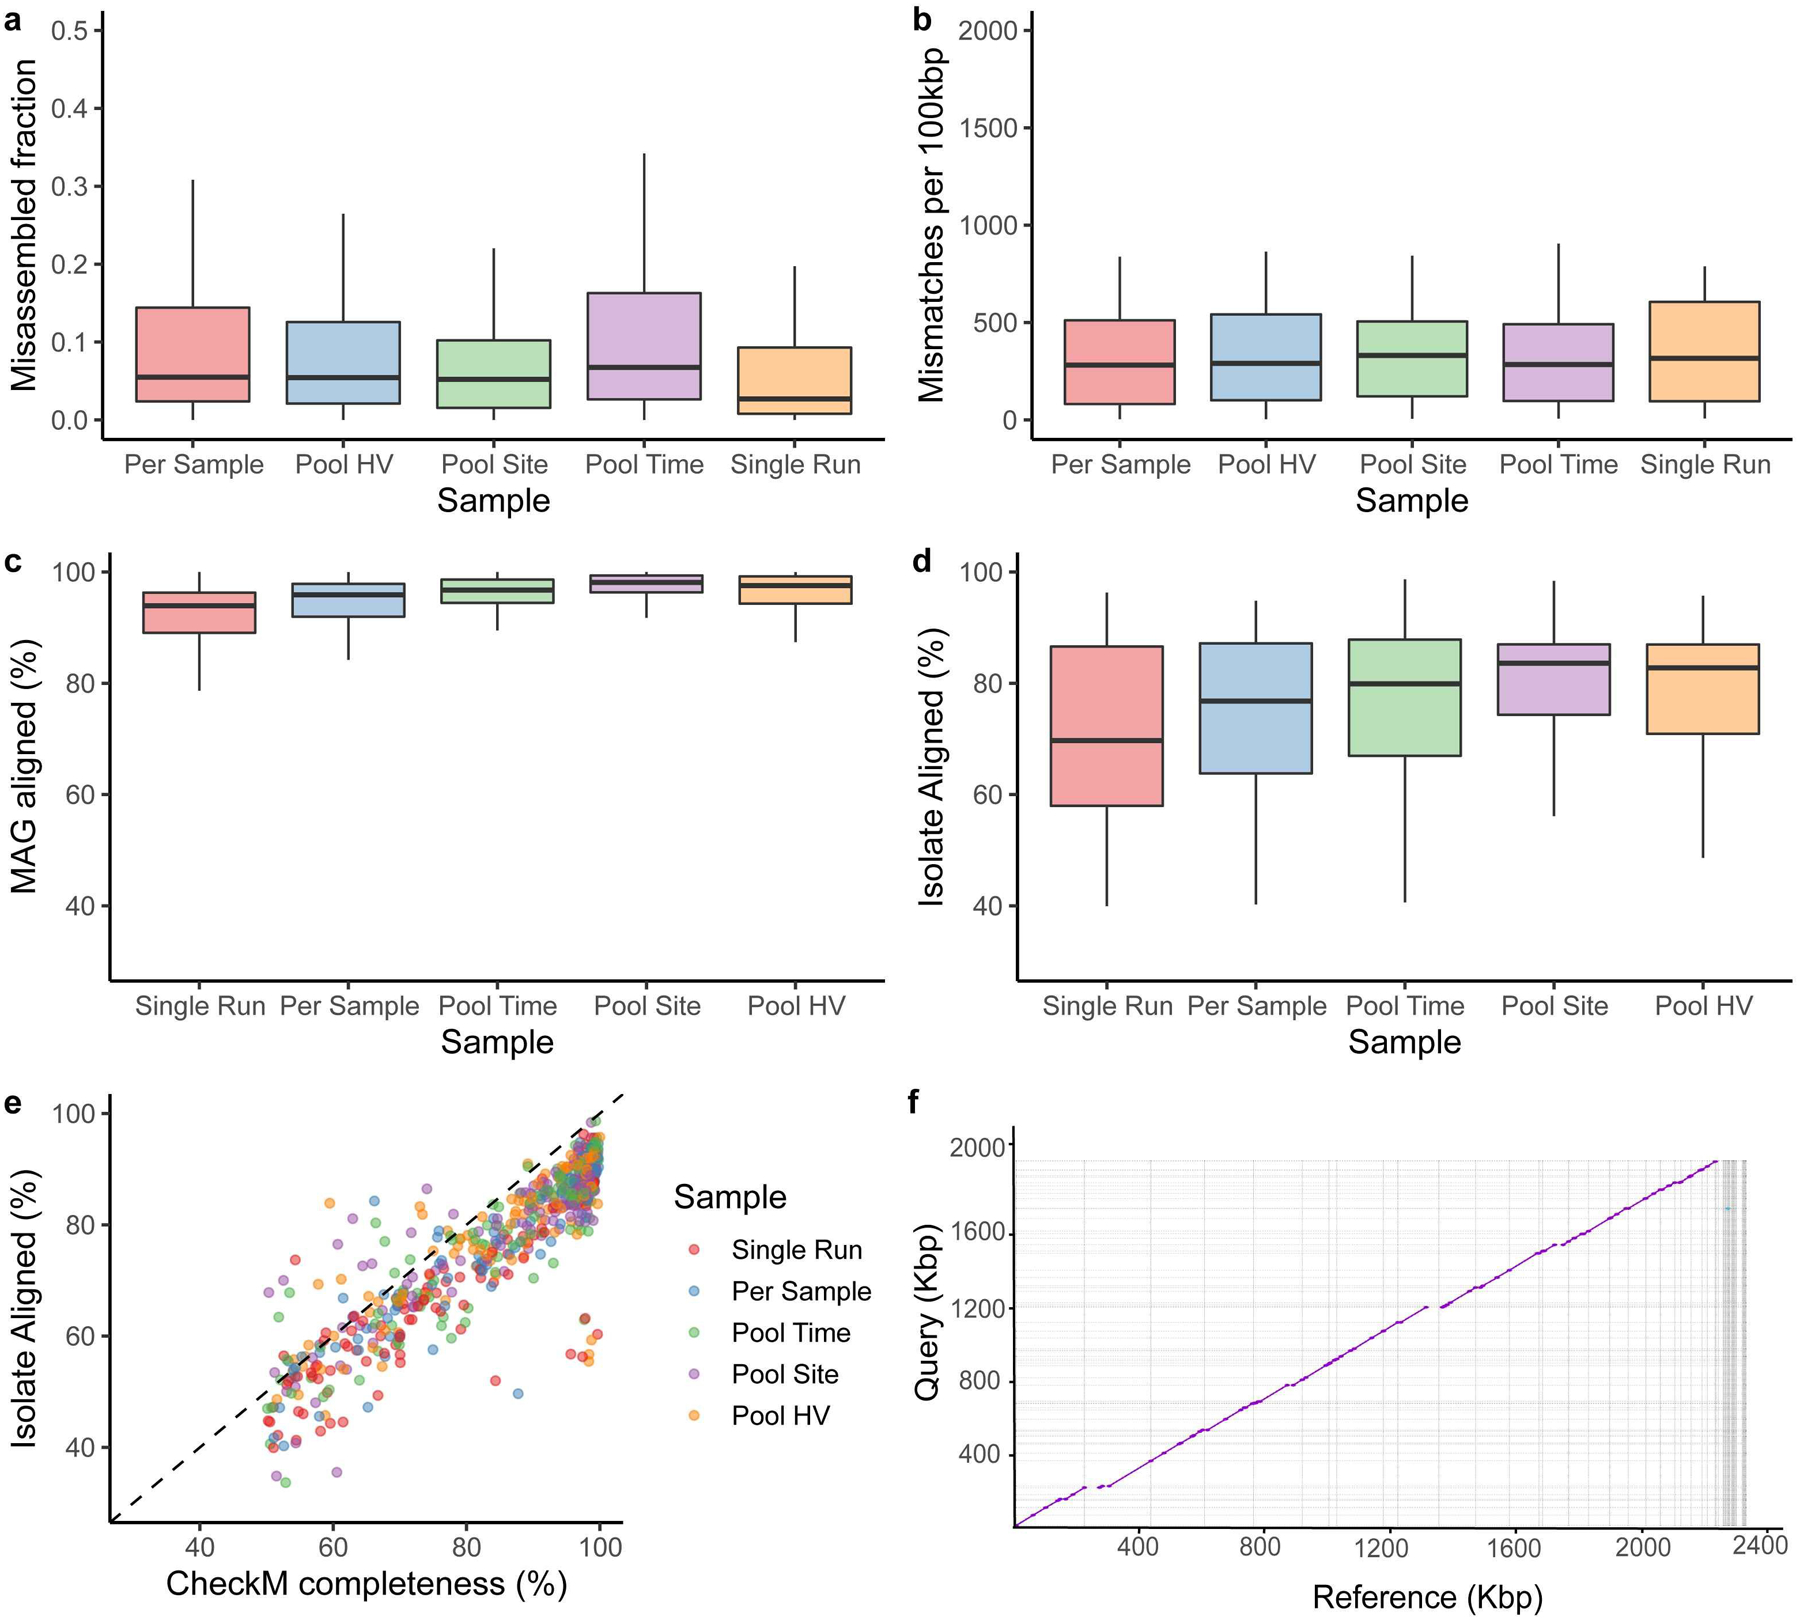
a, Misassembled fraction as a proportion of the total genome length, estimated by QUAST. b, Single-nucleotide mismatches between MAGs and isolates per 100 kbp. c, percent MAG aligned, and d, percent isolate aligned for all pairwise MAG-isolate matches sharing >=99% average nucleotide identity across different pooling strategies (Single Run, n=124; Per Sample, n=91; Pool Time, n=116; Pool Site, n=134; Pool HV, n=115). e, CheckM completeness relative to percent isolate aligned for these MAGs, colored by pooling strategies. The majority of the points fall below the dashed identity line, indicating that CheckM frequently overestimates genome completeness f, Dot plot of a novel Corynebacterium MAG obtained through Pool HV and the matching isolate, cultured from the same healthy volunteer. In panels a, b, c and d, box lengths represent the IQR of the data, with whiskers depicting the lowest and highest values within 1.5 times the IQR of the first and third quartiles, respectively.
Extended Data Fig. 3. Comparison of the number of species recovered by each sampling strategy.
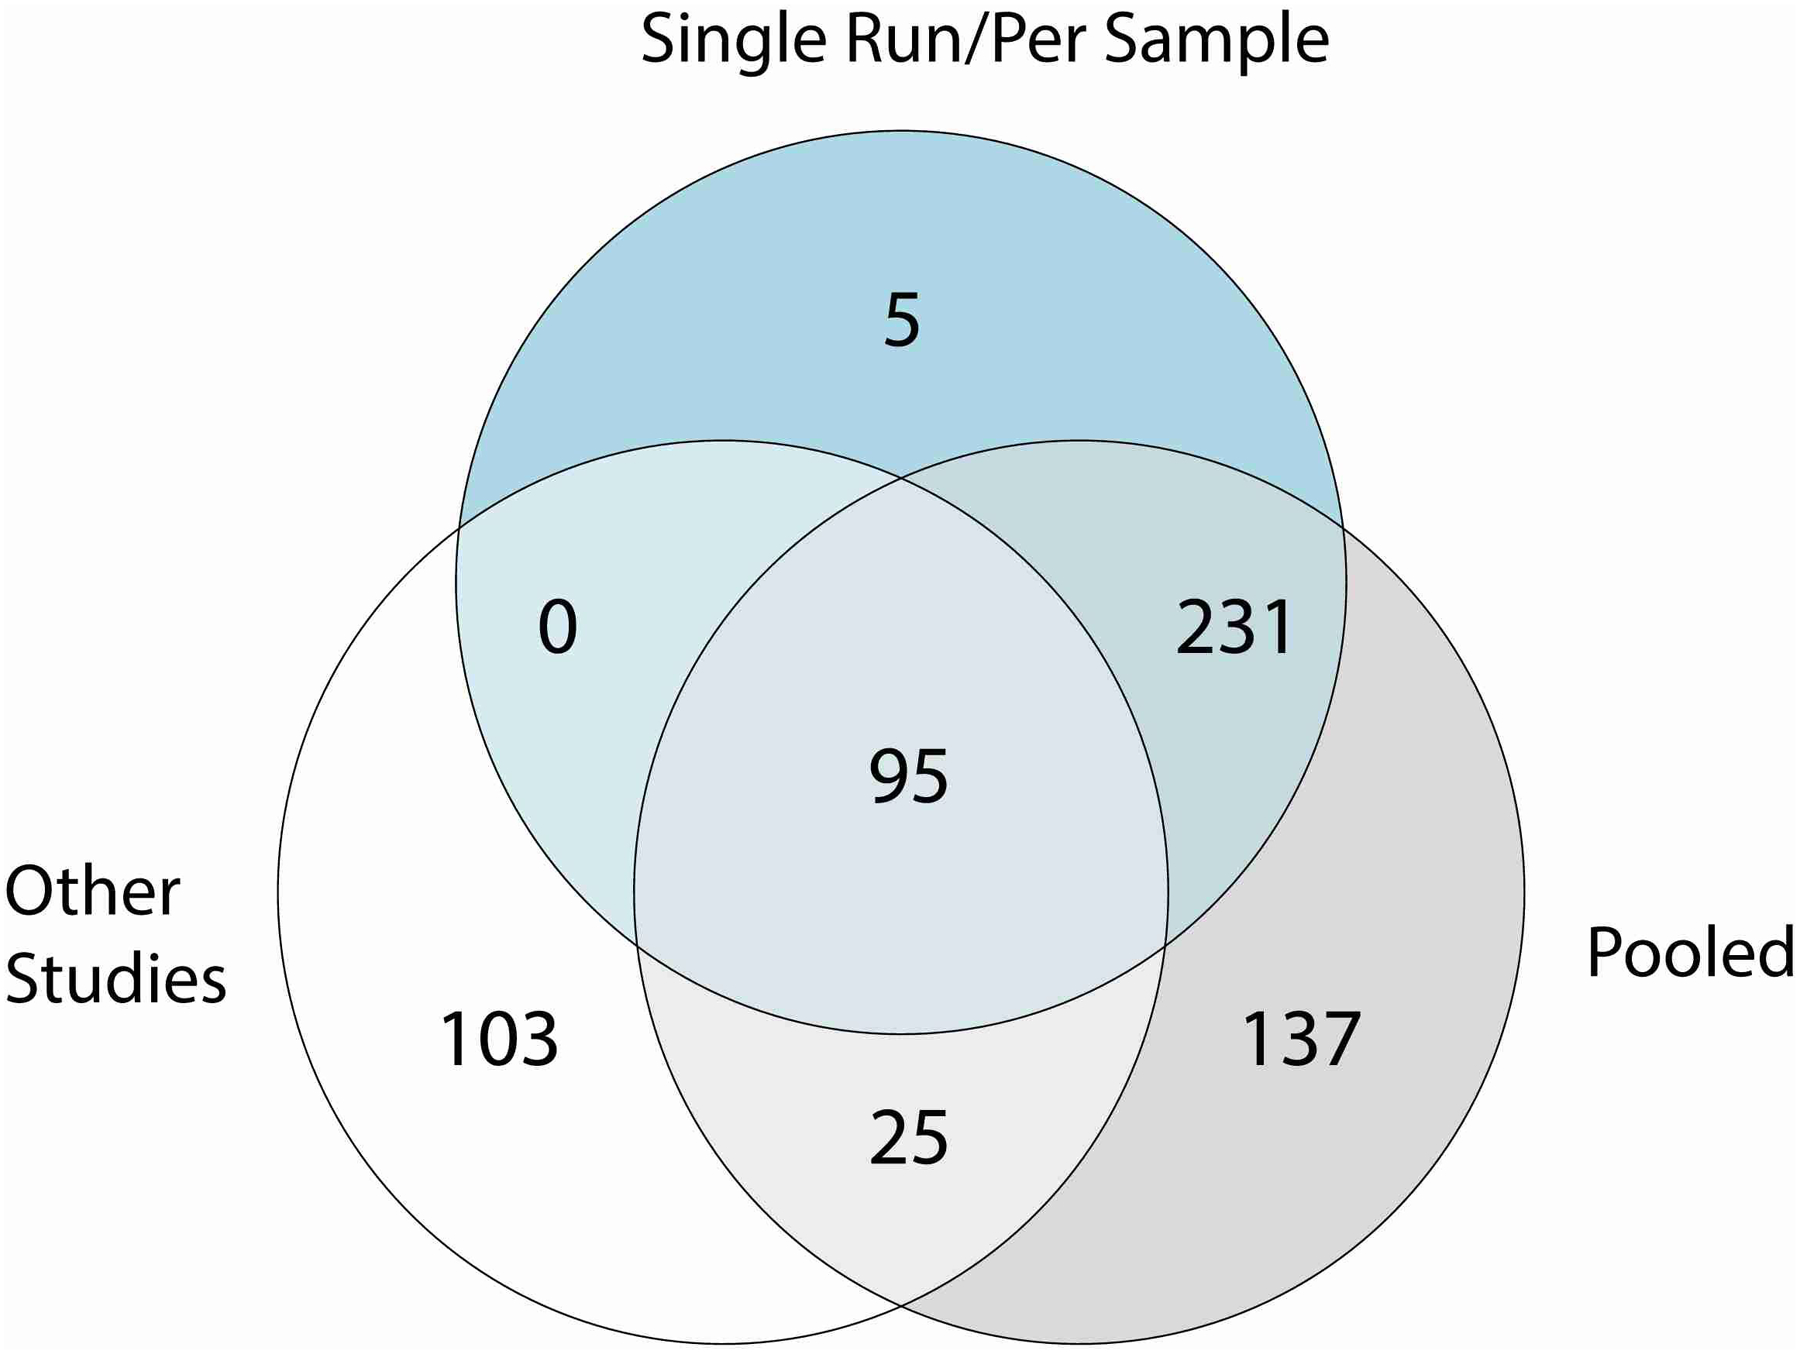
Venn diagram of the number of species recovered by single run/per sample and pooled approaches (Pool Time, Pool HV, Pool Site) as part of the study accession SRP002480 or by a per sample investigation of other publicly available metagenomic datasets (other studies).
Extended Data Fig. 4. The metabolisms of the prokaryotic SMGC MAGs and isolates.
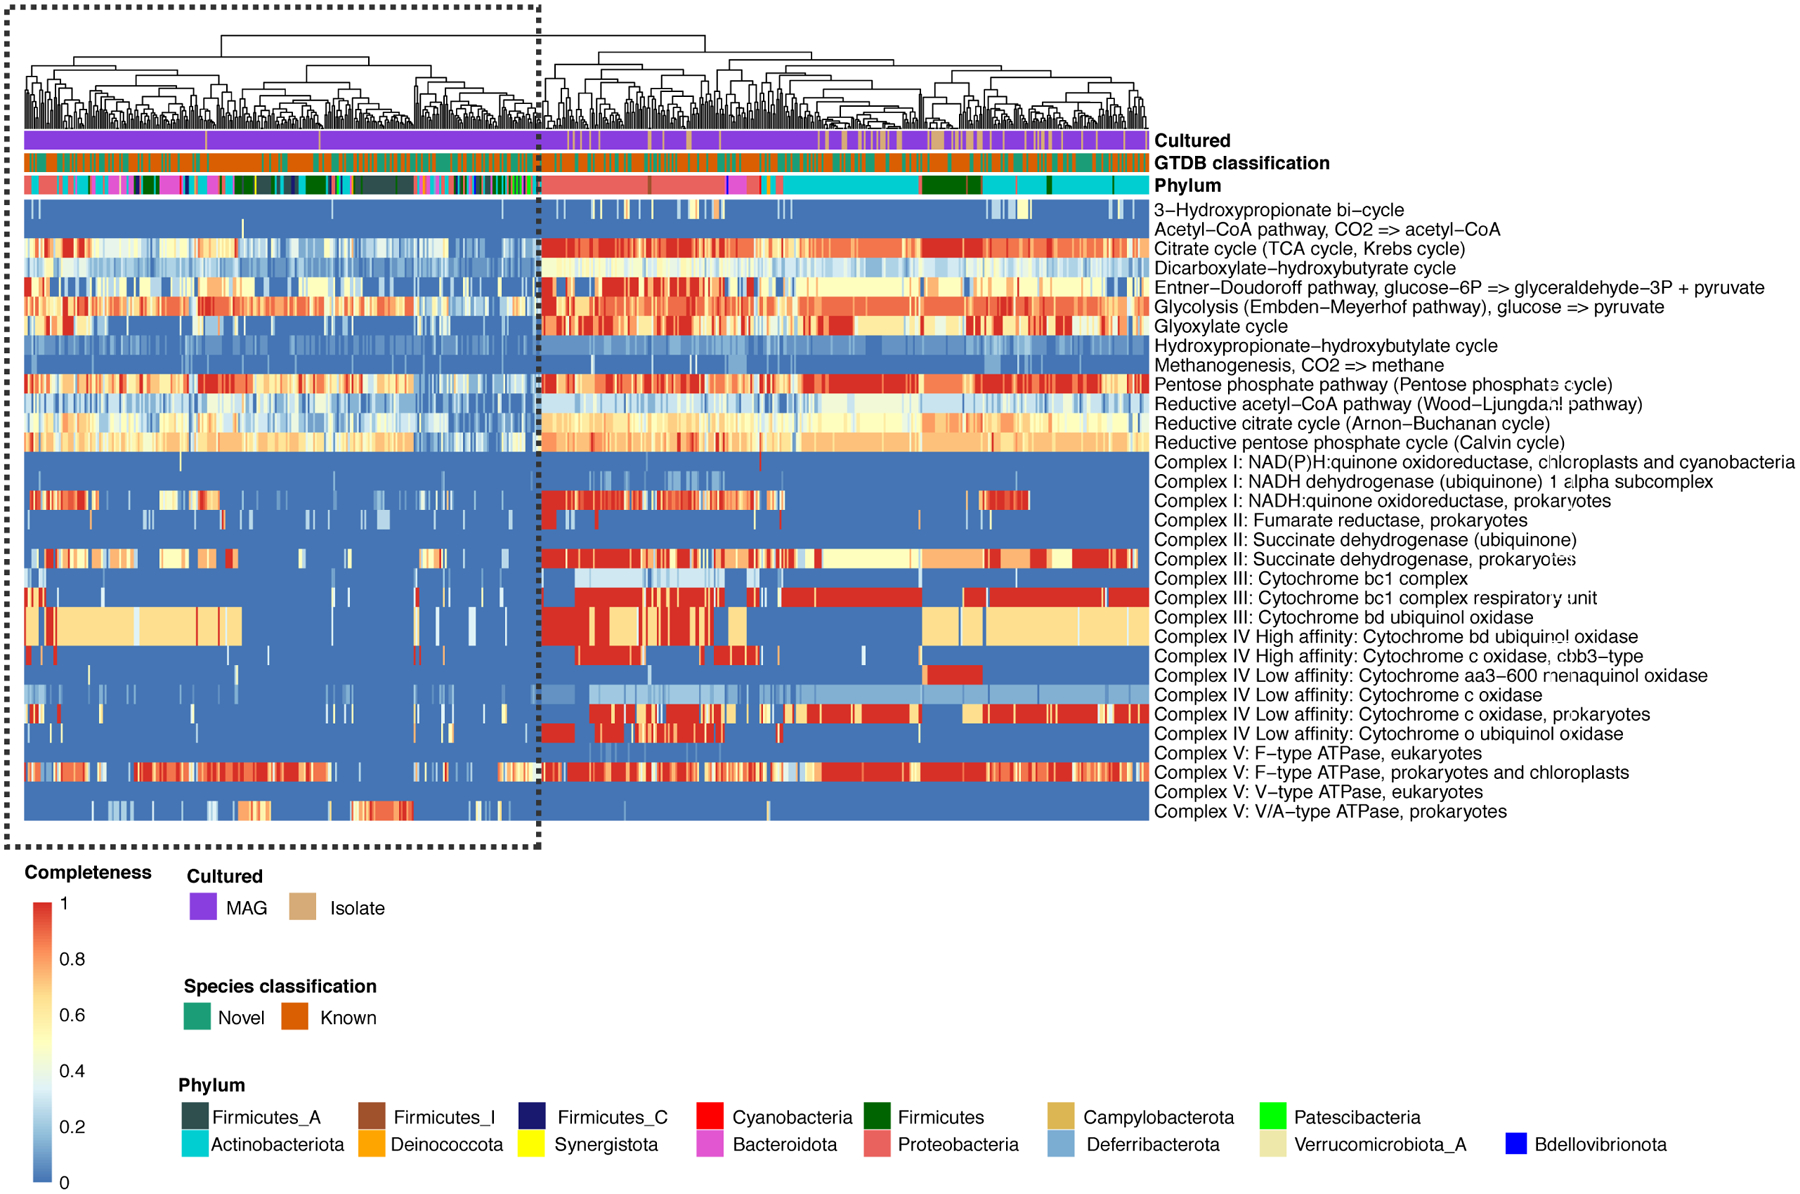
Annotation of the prokaryotic SMGC using DRAM shows that clades largely represented by uncultured species (outlined in black) are depleted in pathways involved in aerobic respiration, suggesting that the standard skin culture conditions are not able to capture the full diversity of microbes found on human skin.
Extended Data Fig. 5. Gene frequency and metabolic pathway distribution of species from abundant skin genera.
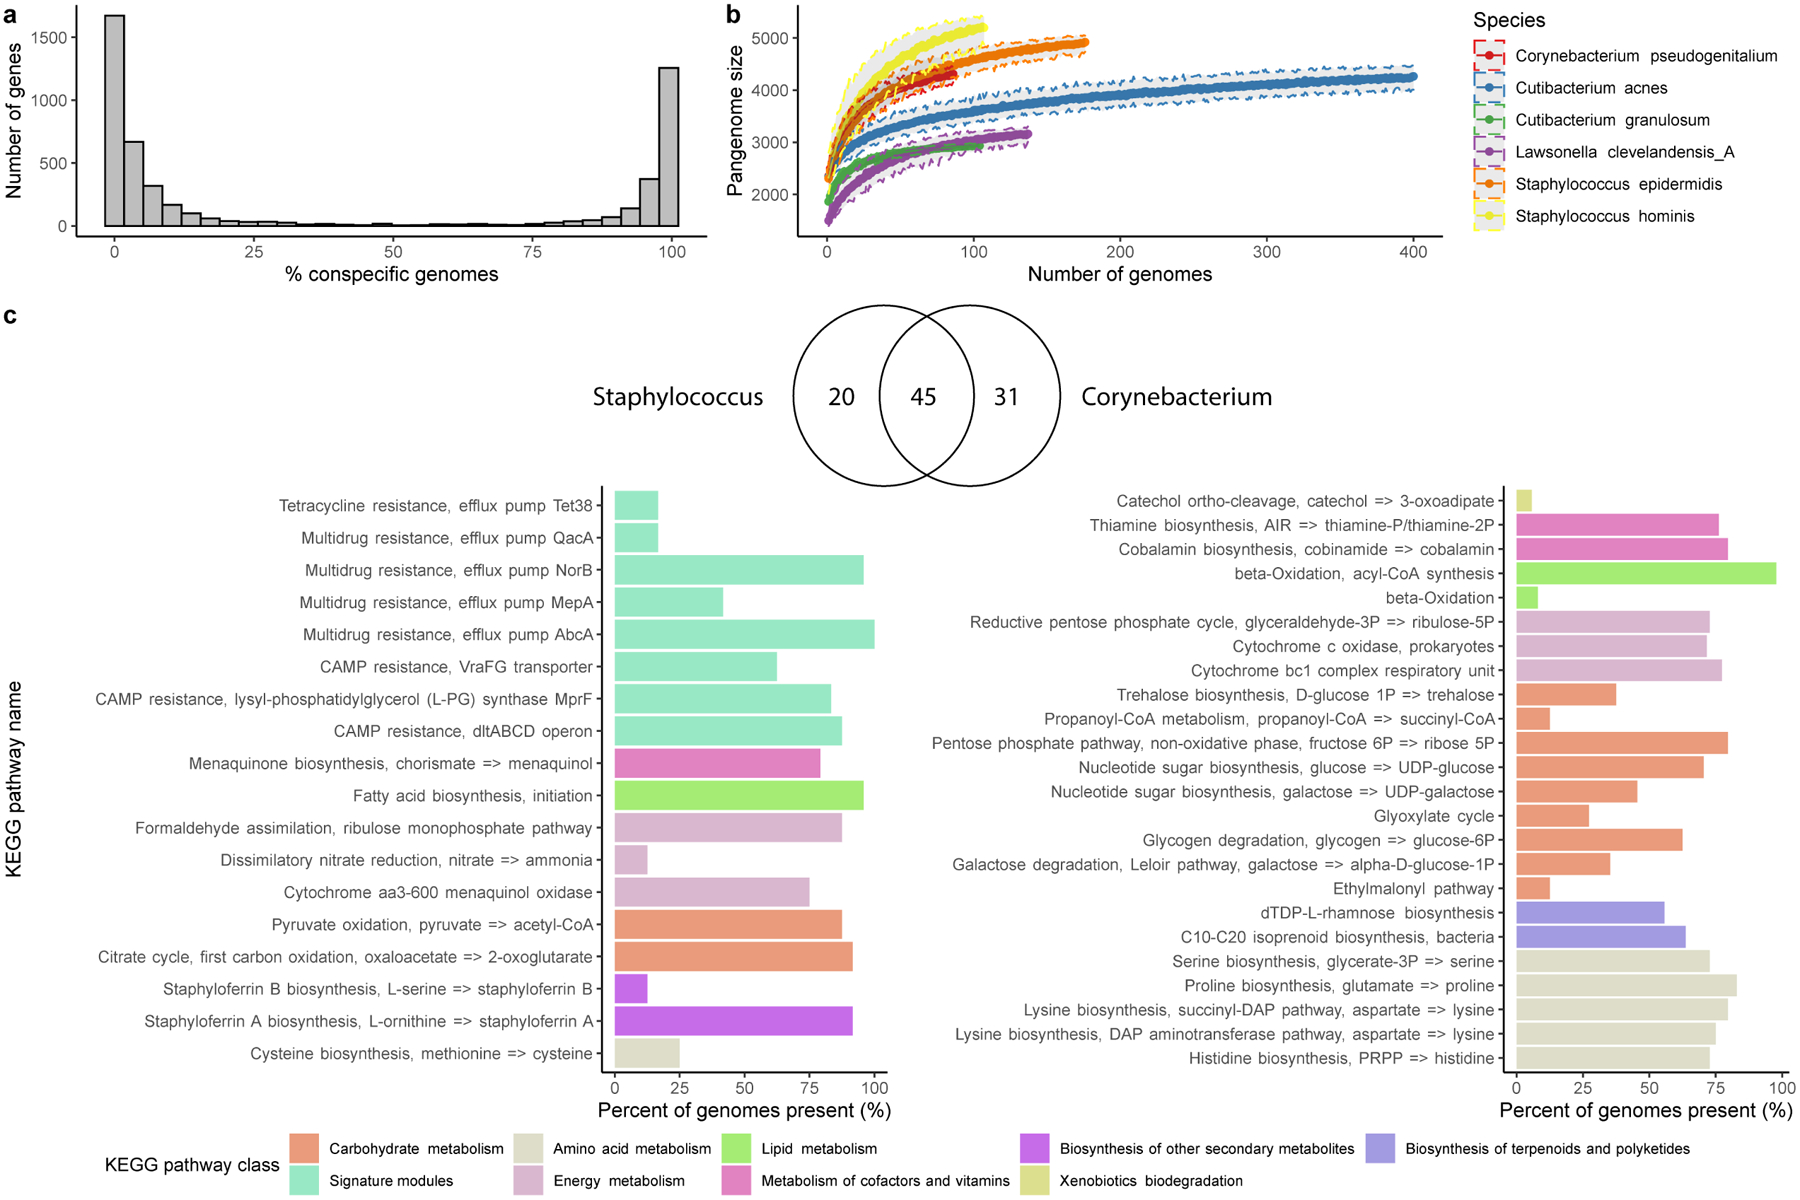
a, Number of genes in relation to the number of near-complete (≥90% completeness) conspecific genomes recovered for Staphylococcus epidermidis. Other species showcased in b, showed similar distributions. b, Genome accumulation curves of the number of genes detected as a function of the number of non-redundant genomes analyzed. c, Venn diagram of the number of KEGG pathways shared by the two genera Staphylococcus and Corynebacterium. Barplot comparing the predominant KEGG pathways unique to the Staphylococcus or the Corynebacterium skin genomes only showing pathways present in at least 5% of the genomes.
Extended Data Fig. 6. Quality and taxonomic classification of fungal and viral genomes.
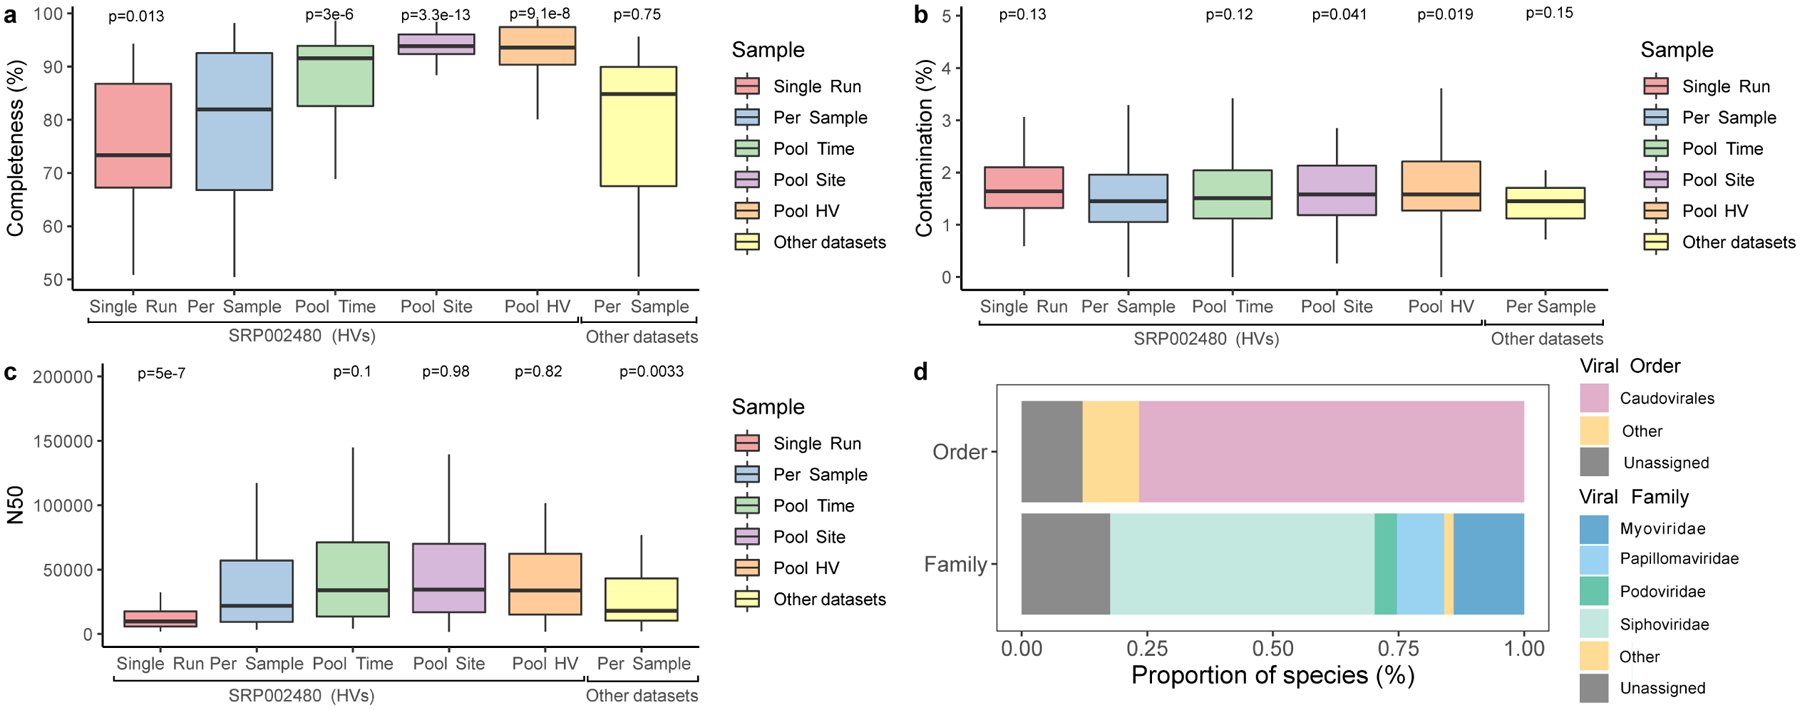
a, Genome completeness and b contamination of the 499 eukaryotic MAGs estimated by EukCC. c N50 for these MAGs determined via BBMap. The number of bins were 81 for Single Run, 123 for Per Sample, 112 for Pool Time, 87 for Pool Site, 65 for Pool HV, and 31 for Other datasets. Significance was determined using the two tailed t-test relative to Per Sample, with ns representing not significant. ‘Other datasets’ refers to skin metagenomes excluding the healthy volunteer dataset, which is a part of the study SRP002480. d, Taxonomic classification of the viral genomes according to DemoVir. In panels a, b and c, box lengths represent the IQR of the data, with whiskers depicting the lowest and highest values within 1.5 times the IQR of the first and third quartiles, respectively.
Extended Data Fig. 7. The human skin harbors vast viral diversity, of which the sebaceous sites remain stable over time.
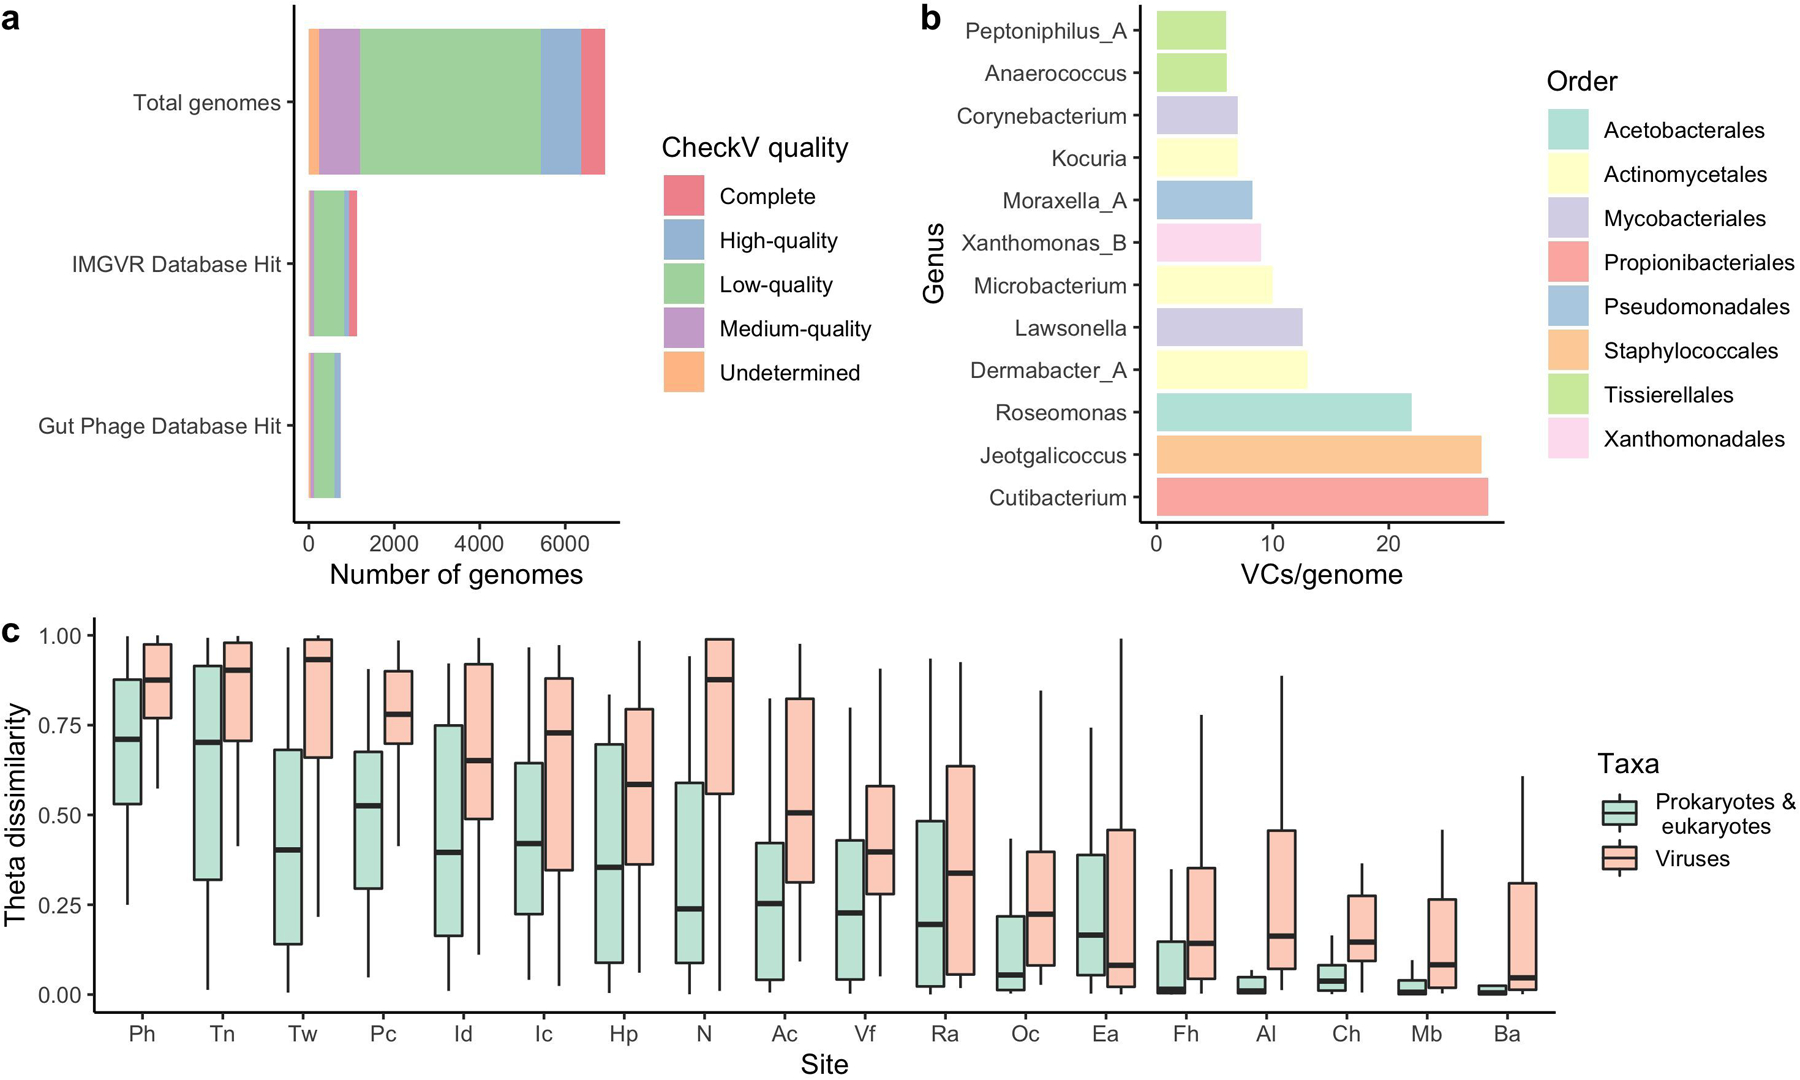
a, The number of viral genomes in the SMGC colored by their assigned CheckV quality. Comparison of the putative viral genomes to IMG/VR and the Gut Phage Database reveals that only a small fraction of the virome has been previously identified. b, The number of viral sequences detected for each SMGC bacterial genus using CRISPR host analysis. c, The stability of the SMGC over time for different body sites as estimated by the theta dissimilarity metric, with a theta dissimilarity of zero indicating high similarity. When calculating the theta dissimilarity, comparisons were made between the same body site of the same healthy volunteer over time. Body sites (Ac, n=39; Al, n=36; Ba, n=33; Ch, n=35; Ea, n=35; Fh, n=34; Hp, n=35; Ic, n=34; Id, n=32; Mb, n=35; N, n=42; Oc, n=36; Pc, n=35; Ph, n=36; Ra, n=41; Tn, n=32; Tw, n=35; Vf, n=38) are defined in Figure 1a. The Ax was excluded due to limited sampling. Box lengths represent the IQR of the data, with whiskers depicting the lowest and highest values within 1.5 times the IQR of the first and third quartiles, respectively.
Extended Data Fig. 8. Quality assessment of the cluster 5 jumbo phage genome.
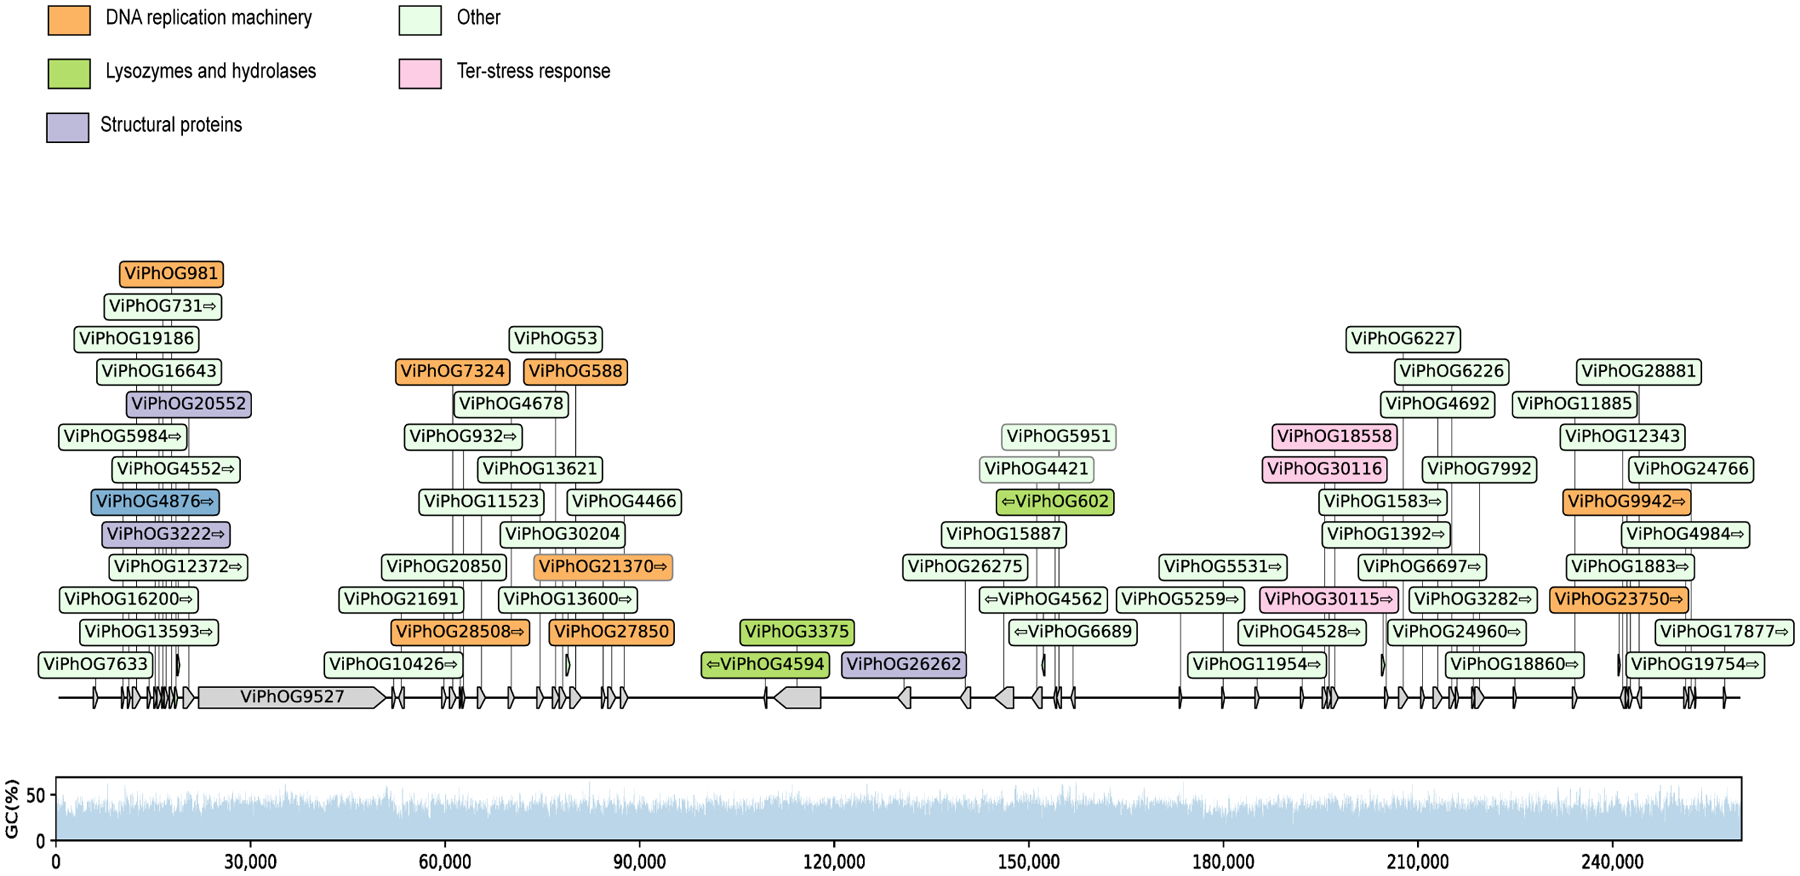
Distribution of viral protein families (ViPhOGs) and the GC (%) content along the cluster 5 jumbo phage genome reveals that viral proteins are evenly distributed and GC (%) content is consistent.
Extended Data Fig. 9. The SMGC improves classification of the skin microbiome.
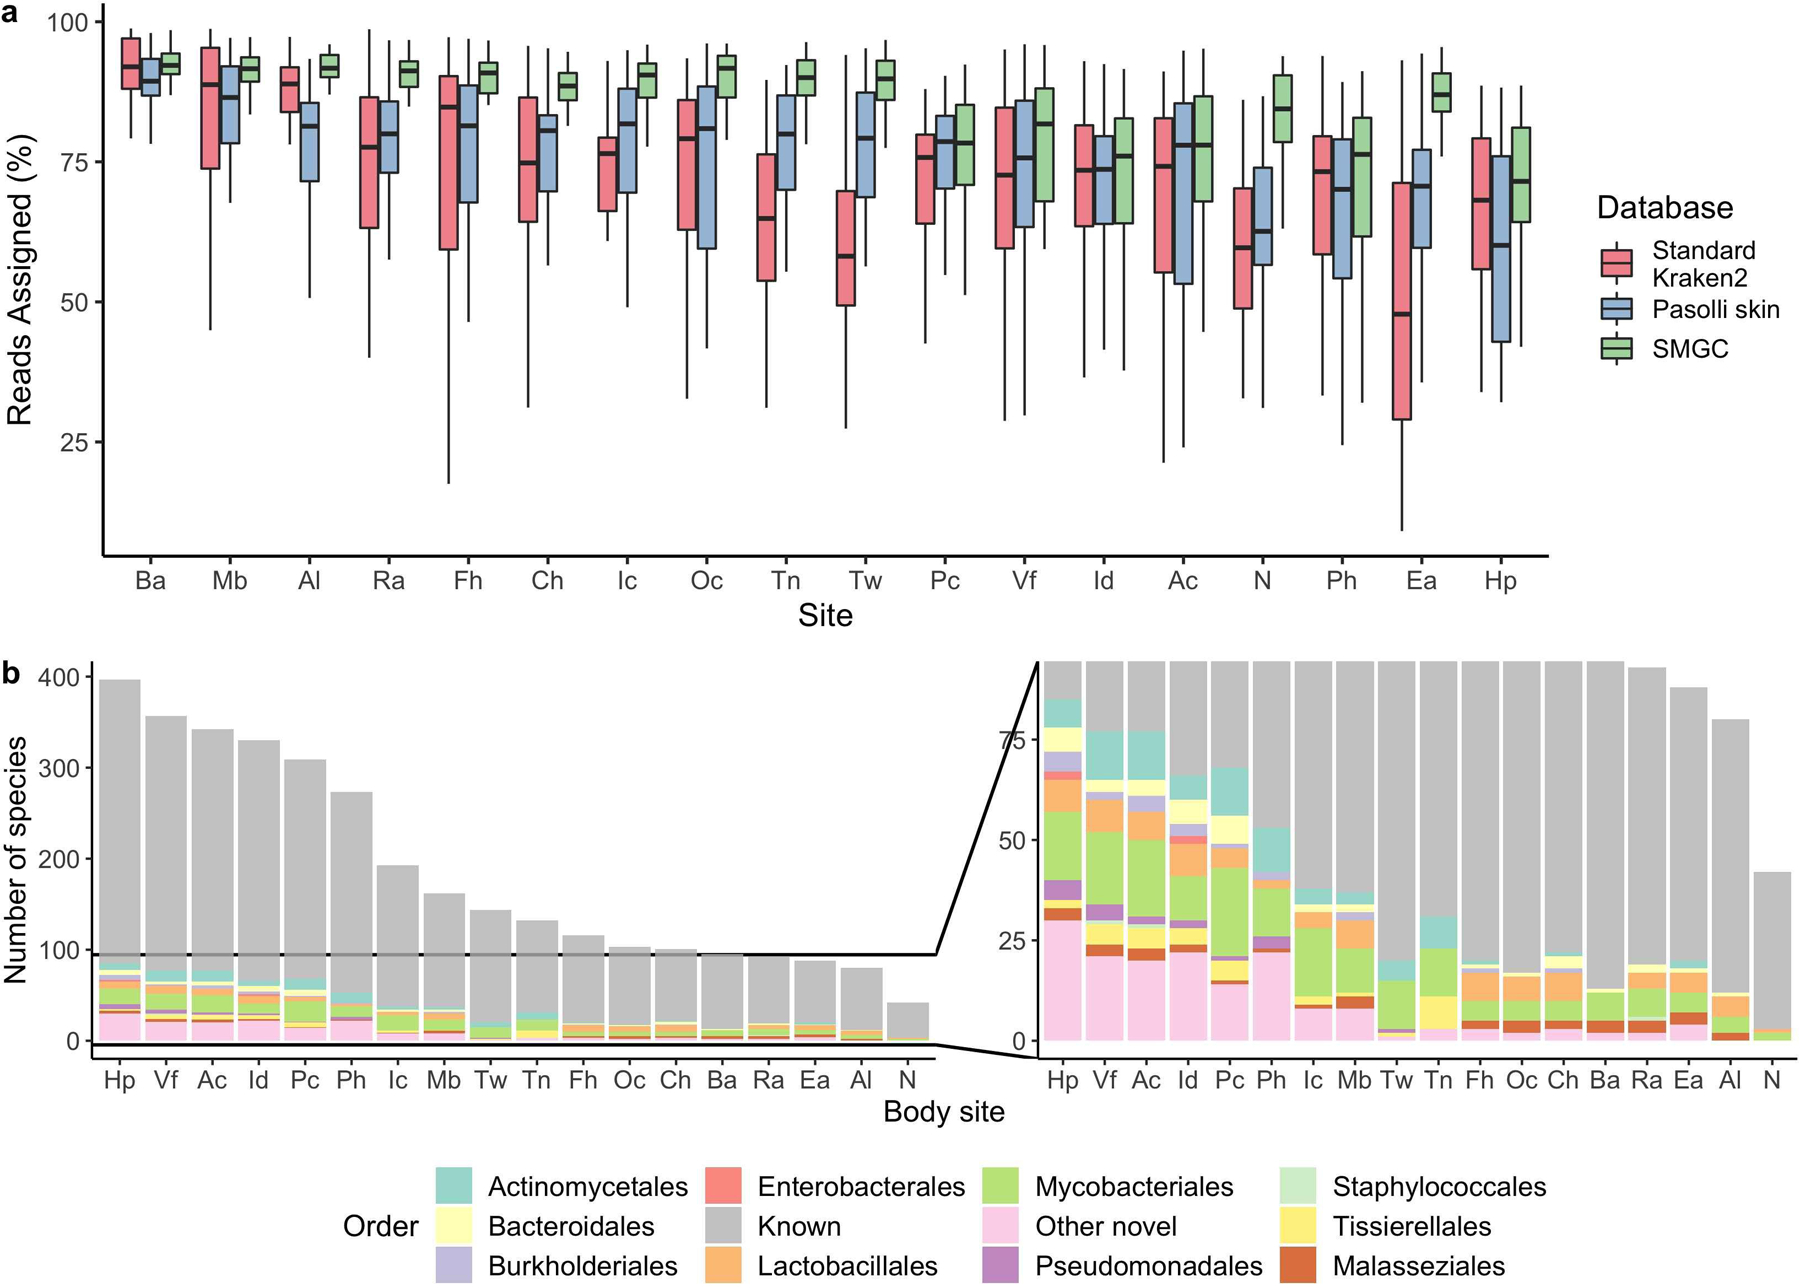
a, Percentage of sequencing reads from different body sites classified by the SMGC as compared to the standard Kraken 2 database and the Pasolli et al skin prokaryotic MAGs. Box lengths represent the IQR of the data, with whiskers depicting the lowest and highest values within 1.5 times the IQR of the first and third quartiles, respectively. b, The species in the SMGC present at different body sites. Novelty was determined by comparison to both the GTDB database and the Pasolli et al catalogue. Body sites (Ac, n=39; Al, n=36; Ba, n=33; Ch, n=35; Ea, n=35; Fh, n=34; Hp, n=35; Ic, n=34; Id, n=32; Mb, n=35; N, n=42; Oc, n=36; Pc, n=35; Ph, n=36; Ra, n=41; Tn, n=32; Tw, n=35; Vf, n=38) are defined in Figure 1a. The Ax was excluded due to limited sampling.
Extended Data Fig. 10. A new multi-kingdom view of the healthy human skin microbiome.
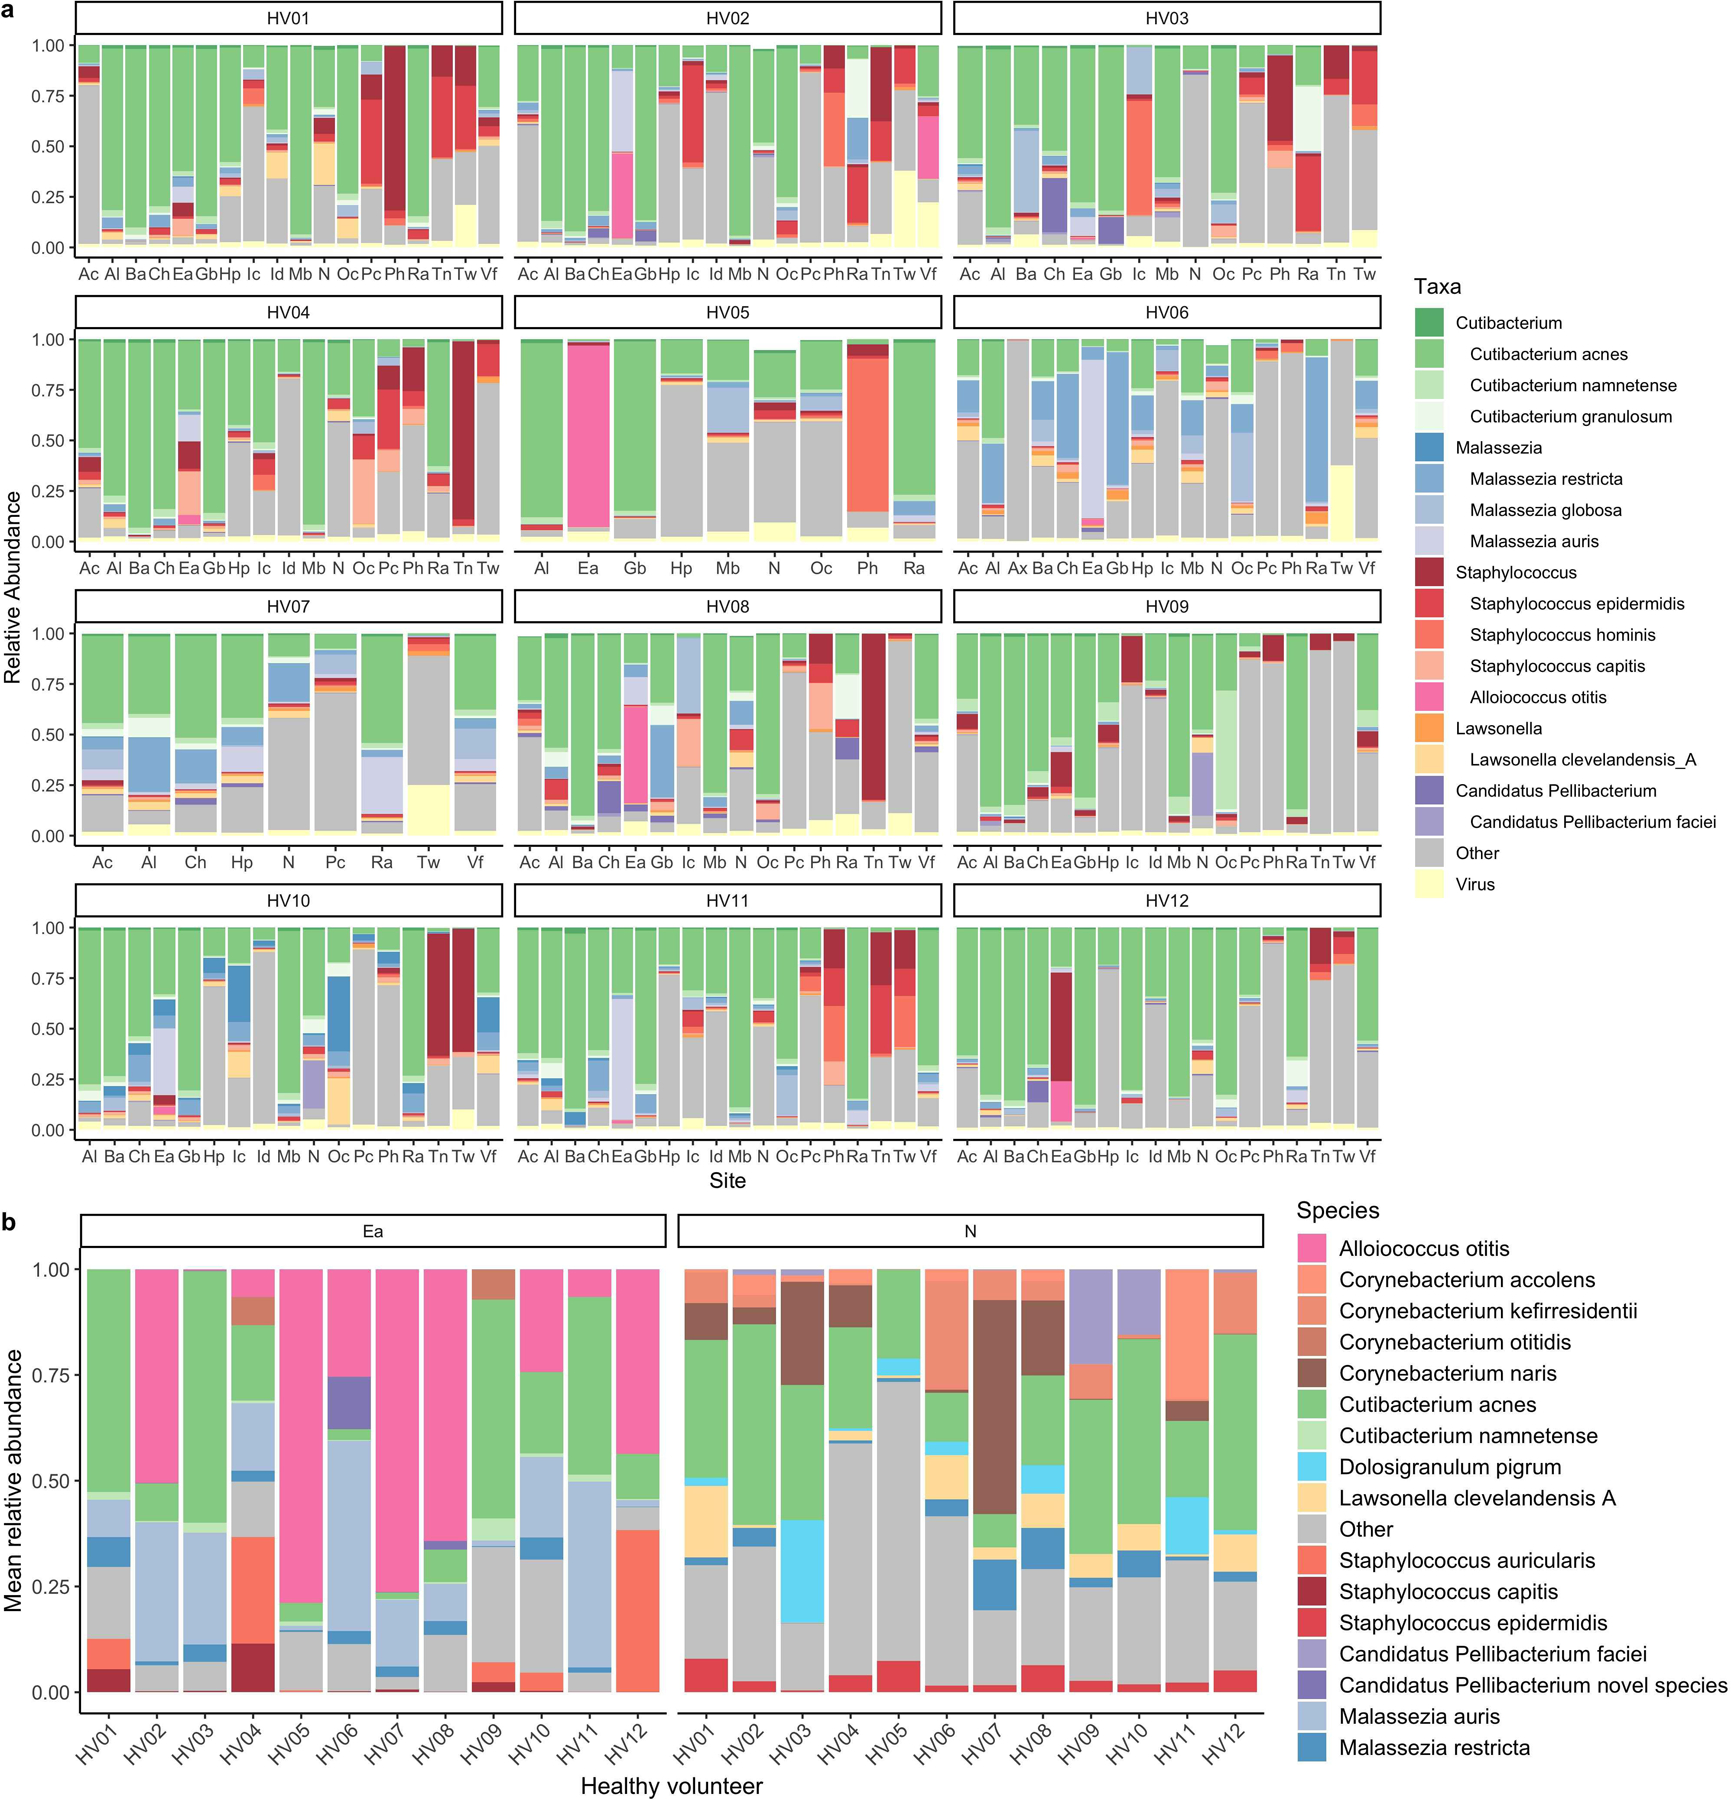
a, Relative abundance of viruses and members from the top 6 most abundant skin genera across the healthy volunteers for the first time point. Body sites are defined in Figure 1a. b, Mean relative abundance across time of the most abundant species found in the external auditory ear canal and the nares for each healthy volunteer.
Supplementary Material
Acknowledgements
We would like to thank Sergey Nurk and Sean Conlan for their invaluable feedback regarding this work. S.S.K. is a graduate student supported by the NIH-Oxford-Cambridge Scholars Program. A.A. and R.D.F. are funded by EMBL core funds. This study utilized the computational resources of the NIH HPC Biowulf Cluster (http://hpc.nih.gov). Supported by the Intramural Research Programs of the National Institutes of Health (NIH) National Institute of Arthritis and Musculoskeletal and Skin Diseases and National Human Genome Research Institute.
Footnotes
Code availability
MAGs generated in this work are produced by a pipeline adapted from (https://github.com/Finn-Lab/MAG_Snakemake_wf).
Competing Interests
The authors declare no competing interests.
Data availability
Metagenome sequence data is publicly available in SRA (study accession SRP002480). Primary metagenomes, isolate and metagenome-assembled genomes from the SMGC, and genome annotations are available in: http://ftp.ebi.ac.uk/pub/databases/metagenomics/genome_sets/skin_microbiome. Source data has been provided for Figs. 1–4 and Extended Data Fig. 110.
References
- 1.Oh J, Byrd AL, Deming C, Conlan S, NISC Comparative Sequencing Program, Kong HH et al. Biogeography and individuality shape function in the human skin metagenome. Nature 2014; 514: 59–64. [DOI] [PMC free article] [PubMed] [Google Scholar]
- 2.Byrd AL, Belkaid Y, Segre JA. The human skin microbiome. Nat Rev Microbiol 2018; 16: 143–155. [DOI] [PubMed] [Google Scholar]
- 3.Oh J, Byrd AL, Park M, NISC Comparative Sequencing Program, Kong HH, Segre JA. Temporal Stability of the Human Skin Microbiome. Cell 2016; 165: 854–866. [DOI] [PMC free article] [PubMed] [Google Scholar]
- 4.Myles IA, Reckhow JD, Williams KW, Sastalla I, Frank KM, Datta SK. A method for culturing Gram-negative skin microbiota. BMC Microbiol 2016; 16: 60. [DOI] [PMC free article] [PubMed] [Google Scholar]
- 5.Timm CM, Loomis K, Stone W, Mehoke T, Brensinger B, Pellicore M et al. Isolation and characterization of diverse microbial representatives from the human skin microbiome. Microbiome 2020; 8: 58. [DOI] [PMC free article] [PubMed] [Google Scholar]
- 6.Jagielski T, Rup E, Ziółkowska A, Roeske K, Macura AB, Bielecki J. Distribution of Malassezia species on the skin of patients with atopic dermatitis, psoriasis, and healthy volunteers assessed by conventional and molecular identification methods. BMC Dermatol 2014; 14: 3. [DOI] [PMC free article] [PubMed] [Google Scholar]
- 7.Almeida A, Mitchell AL, Boland M, Forster SC, Gloor GB, Tarkowska A et al. A new genomic blueprint of the human gut microbiota. Nature 2019; 568: 499–504. [DOI] [PMC free article] [PubMed] [Google Scholar]
- 8.Parks DH, Rinke C, Chuvochina M, Chaumeil P-A, Woodcroft BJ, Evans PN et al. Recovery of nearly 8,000 metagenome-assembled genomes substantially expands the tree of life. Nat Microbiol 2017; 2: 1533–1542. [DOI] [PubMed] [Google Scholar]
- 9.Parks DH, Chuvochina M, Waite DW, Rinke C, Skarshewski A, Chaumeil P-A et al. A standardized bacterial taxonomy based on genome phylogeny substantially revises the tree of life. Nat Biotechnol 2018; 36: 996–1004. [DOI] [PubMed] [Google Scholar]
- 10.Jain C, Rodriguez-R LM, Phillippy AM, Konstantinidis KT, Aluru S. High throughput ANI analysis of 90K prokaryotic genomes reveals clear species boundaries. Nat Commun 2018; 9: 5114. [DOI] [PMC free article] [PubMed] [Google Scholar]
- 11.Varghese NJ, Mukherjee S, Ivanova N, Konstantinidis KT, Mavrommatis K, Kyrpides NC et al. Microbial species delineation using whole genome sequences. Nucleic Acids Res 2015; 43: 6761–6771. [DOI] [PMC free article] [PubMed] [Google Scholar]
- 12.Jégousse C, Vannier P, Groben R, Glöckner FO, Marteinsson V. A total of 219 metagenome-assembled genomes of microorganisms from Icelandic marine waters. PeerJ 2021; 9: e11112. [DOI] [PMC free article] [PubMed] [Google Scholar]
- 13.Stewart RD, Auffret MD, Warr A, Walker AW, Roehe R, Watson M. Compendium of 4,941 rumen metagenome-assembled genomes for rumen microbiome biology and enzyme discovery. Nat Biotechnol 2019; 37: 953–961. [DOI] [PMC free article] [PubMed] [Google Scholar]
- 14.Delmont TO, Quince C, Shaiber A, Esen ÖC, Lee ST, Rappé MS et al. Nitrogen-fixing populations of Planctomycetes and Proteobacteria are abundant in surface ocean metagenomes. Nat Microbiol 2018; 3: 804–813. [DOI] [PMC free article] [PubMed] [Google Scholar]
- 15.Eren AM, Esen ÖC, Quince C, Vineis JH, Morrison HG, Sogin ML et al. Anvi’o: an advanced analysis and visualization platform for ‘omics data. PeerJ 2015; 3: e1319. [DOI] [PMC free article] [PubMed] [Google Scholar]
- 16.Quince C, Delmont TO, Raguideau S, Alneberg J, Darling AE, Collins G et al. DESMAN: a new tool for de novo extraction of strains from metagenomes. Genome Biol 2017; 18: 181. [DOI] [PMC free article] [PubMed] [Google Scholar]
- 17.Orakov A, Fullam A, Coelho LP, Khedkar S, Szklarczyk D, Mende DR et al. GUNC: Detection of Chimerism and Contamination in Prokaryotic Genomes. doi: 10.1101/2020.12.16.422776. [DOI] [PMC free article] [PubMed] [Google Scholar]
- 18.Bowers RM, The Genome Standards Consortium, Kyrpides NC, Stepanauskas R, Harmon-Smith M, Doud D et al. Minimum information about a single amplified genome (MISAG) and a metagenome-assembled genome (MIMAG) of bacteria and archaea. Nature Biotechnology. 2017; 35: 725–731. [DOI] [PMC free article] [PubMed] [Google Scholar]
- 19.Sangwan N, Xia F, Gilbert JA. Recovering complete and draft population genomes from metagenome datasets. Microbiome 2016; 4: 8. [DOI] [PMC free article] [PubMed] [Google Scholar]
- 20.Saheb Kashaf S, Almeida A, Segre JA, Finn RD. Recovering prokaryotic genomes from host-associated, short-read shotgun metagenomic sequencing data. Nat Protoc 2021; 16: 2520–2541. [DOI] [PubMed] [Google Scholar]
- 21.Pasolli E, Asnicar F, Manara S, Zolfo M, Karcher N, Armanini F et al. Extensive Unexplored Human Microbiome Diversity Revealed by Over 150,000 Genomes from Metagenomes Spanning Age, Geography, and Lifestyle. Cell 2019; 176: 649–662.e20. [DOI] [PMC free article] [PubMed] [Google Scholar]
- 22.Pallen MJ, Telatin A, Oren A. The Next Million Names for Archaea and Bacteria. Trends Microbiol 2021; 29: 289–298. [DOI] [PubMed] [Google Scholar]
- 23.Colquhoun RM, Hall MB, Lima L, Roberts LW. Nucleotide-resolution bacterial pan-genomics with reference graphs. bioRxiv 2020.https://www.biorxiv.org/content/10.1101/2020.11.12.380378v2.abstract. [DOI] [PMC free article] [PubMed]
- 24.Almeida A, Nayfach S, Boland M, Strozzi F, Beracochea M, Shi ZJ et al. A unified catalog of 204,938 reference genomes from the human gut microbiome. Nature Biotechnology. 2021; 39: 105–114. [DOI] [PMC free article] [PubMed] [Google Scholar]
- 25.Tournu H, Fiori A, Van Dijck P. Relevance of trehalose in pathogenicity: some general rules, yet many exceptions. PLoS Pathog 2013; 9: e1003447. [DOI] [PMC free article] [PubMed] [Google Scholar]
- 26.Jo J-H, Kennedy EA, Kong HH. Topographical and physiological differences of the skin mycobiome in health and disease. Virulence 2017; 8: 324–333. [DOI] [PMC free article] [PubMed] [Google Scholar]
- 27.Nayfach S, Camargo AP, Schulz F, Eloe-Fadrosh E, Roux S, Kyrpides NC. CheckV assesses the quality and completeness of metagenome-assembled viral genomes. Nat Biotechnol 2020. doi: 10.1038/s41587-020-00774-7. [DOI] [PMC free article] [PubMed] [Google Scholar]
- 28.Paez-Espino D, Chen I-MA, Palaniappan K, Ratner A, Chu K, Szeto E et al. IMG/VR: a database of cultured and uncultured DNA Viruses and retroviruses. Nucleic Acids Res 2017; 45: D457–D465. [DOI] [PMC free article] [PubMed] [Google Scholar]
- 29.Camarillo-Guerrero LF, Almeida A, Rangel-Pineros G. Massive expansion of human gut bacteriophage diversity. bioRxiv 2020.https://www.biorxiv.org/content/10.1101/2020.09.03.280214v1.abstract. [DOI] [PMC free article] [PubMed]
- 30.Buttimer C, O’Sullivan L, Elbreki M, Neve H, McAuliffe O, Ross RP et al. Genome Sequence of Jumbo Phage vB_AbaM_ME3 of Acinetobacter baumanni. Genome Announc 2016; 4. doi: 10.1128/genomeA.00431-16. [DOI] [PMC free article] [PubMed] [Google Scholar]
- 31.Paddison P, Abedon ST, Dressman HK, Gailbreath K, Tracy J, Mosser E et al. The roles of the bacteriophage T4 r genes in lysis inhibition and fine-structure genetics: a new perspective. Genetics 1998; 148: 1539–1550. [DOI] [PMC free article] [PubMed] [Google Scholar]
- 32.Cole JR, Chai B, Farris RJ, Wang Q, Kulam-Syed-Mohideen AS, McGarrell DM et al. The ribosomal database project (RDP-II): introducing myRDP space and quality controlled public data. Nucleic Acids Res 2007; 35: D169–72. [DOI] [PMC free article] [PubMed] [Google Scholar]
- 33.McIver LJ, Abu-Ali G, Franzosa EA, Schwager R, Morgan XC, Waldron L et al. bioBakery: a meta’omic analysis environment. Bioinformatics. 2018; 34: 1235–1237. [DOI] [PMC free article] [PubMed] [Google Scholar]
- 34.Bolger AM, Lohse M, Usadel B. Trimmomatic: a flexible trimmer for Illumina sequence data. Bioinformatics 2014; 30: 2114–2120. [DOI] [PMC free article] [PubMed] [Google Scholar]
- 35.Bankevich A, Nurk S, Antipov D, Gurevich AA, Dvorkin M, Kulikov AS et al. SPAdes: a new genome assembly algorithm and its applications to single-cell sequencing. J Comput Biol 2012; 19: 455–477. [DOI] [PMC free article] [PubMed] [Google Scholar]
- 36.Uritskiy GV, DiRuggiero J, Taylor J. MetaWRAP—a flexible pipeline for genome-resolved metagenomic data analysis. Microbiome. 2018; 6. doi: 10.1186/s40168-018-0541-1. [DOI] [PMC free article] [PubMed] [Google Scholar]
- 37.Parks DH, Imelfort M, Skennerton CT, Hugenholtz P, Tyson GW. CheckM: assessing the quality of microbial genomes recovered from isolates, single cells, and metagenomes. Genome Res 2015; 25: 1043–1055. [DOI] [PMC free article] [PubMed] [Google Scholar]
- 38.Nawrocki EP, Kolbe DL, Eddy SR. Infernal 1.0: inference of RNA alignments. Bioinformatics 2009; 25: 1335–1337. [DOI] [PMC free article] [PubMed] [Google Scholar]
- 39.Kalvari I, Argasinska J, Quinones-Olvera N, Nawrocki EP, Rivas E, Eddy SR et al. Rfam 13.0: shifting to a genome-centric resource for non-coding RNA families. Nucleic Acids Res 2018; 46: D335–D342. [DOI] [PMC free article] [PubMed] [Google Scholar]
- 40.Lowe TM, Eddy SR. tRNAscan-SE: a program for improved detection of transfer RNA genes in genomic sequence. Nucleic Acids Res 1997; 25: 955–964. [DOI] [PMC free article] [PubMed] [Google Scholar]
- 41.Bushnell B BBMap--sourceforge. net/projects/bbmap/. 2014.
- 42.von Meijenfeldt FAB, Arkhipova K, Cambuy DD, Coutinho FH, Dutilh BE. Robust taxonomic classification of uncharted microbial sequences and bins with CAT and BAT. Genome Biol 2019; 20: 217. [DOI] [PMC free article] [PubMed] [Google Scholar]
- 43.Olm MR, Brown CT, Brooks B, Banfield JF. dRep: a tool for fast and accurate genomic comparisons that enables improved genome recovery from metagenomes through de-replication. ISME J 2017; 11: 2864–2868. [DOI] [PMC free article] [PubMed] [Google Scholar]
- 44.Gu Z Complexheatmap: Making complex heatmaps. R package version 2015; 1. [Google Scholar]
- 45.Chaumeil P-A, Mussig AJ, Hugenholtz P, Parks DH. GTDB-Tk: a toolkit to classify genomes with the Genome Taxonomy Database. Bioinformatics 2019. doi: 10.1093/bioinformatics/btz848. [DOI] [PMC free article] [PubMed] [Google Scholar]
- 46.Parks DH, Chuvochina M, Chaumeil P-A, Rinke C, Mussig AJ, Hugenholtz P. Selection of representative genomes for 24,706 bacterial and archaeal species clusters provide a complete genome-based taxonomy. bioRxiv. 2019; : 771964. [Google Scholar]
- 47.Letunic I, Bork P. Interactive tree of life (iTOL) v3: an online tool for the display and annotation of phylogenetic and other trees. Nucleic Acids Res 2016; 44: W242–5. [DOI] [PMC free article] [PubMed] [Google Scholar]
- 48.Tonkin-Hill G, MacAlasdair N, Ruis C, Weimann A, Horesh G, Lees JA et al. Producing polished prokaryotic pangenomes with the Panaroo pipeline. Genome Biol 2020; 21: 180. [DOI] [PMC free article] [PubMed] [Google Scholar]
- 49.Shaffer M, Borton MA, McGivern BB, Zayed AA, La Rosa SL, Solden LM et al. DRAM for distilling microbial metabolism to automate the curation of microbiome function. Nucleic Acids Res 2020; 48: 8883–8900. [DOI] [PMC free article] [PubMed] [Google Scholar]
- 50.Aramaki T, Blanc-Mathieu R, Endo H, Ohkubo K, Kanehisa M, Goto S et al. KofamKOALA: KEGG Ortholog assignment based on profile HMM and adaptive score threshold. Bioinformatics 2020; 36: 2251–2252. [DOI] [PMC free article] [PubMed] [Google Scholar]
- 51.Alneberg J, Bjarnason BS, de Bruijn I, Schirmer M, Quick J, Ijaz UZ et al. Binning metagenomic contigs by coverage and composition. Nat Methods 2014; 11: 1144–1146. [DOI] [PubMed] [Google Scholar]
- 52.Saary P, Mitchell AL, Finn RD. Estimating the quality of eukaryotic genomes recovered from metagenomic analysis with EukCC. Genome Biol 2020; 21: 244. [DOI] [PMC free article] [PubMed] [Google Scholar]
- 53.Eren AM, Kiefl E, Shaiber A, Veseli I, Miller SE, Schechter MS et al. Community-led, integrated, reproducible multi-omics with anvi’o. Nat Microbiol 2021; 6: 3–6. [DOI] [PMC free article] [PubMed] [Google Scholar]
- 54.Fu L, Niu B, Zhu Z, Wu S, Li W. CD-HIT: accelerated for clustering the next-generation sequencing data. Bioinformatics 2012; 28: 3150–3152. [DOI] [PMC free article] [PubMed] [Google Scholar]
- 55.Jang HB, Bolduc B, Zablocki O, Kuhn JH, Roux S, Adriaenssens EM et al. Taxonomic assignment of uncultivated prokaryotic virus genomes is enabled by gene-sharing networks. Nat Biotechnol 2019; 37: 632–639. [DOI] [PubMed] [Google Scholar]
- 56.Muller J, Szklarczyk D, Julien P, Letunic I, Roth A, Kuhn M et al. eggNOG v2.0: extending the evolutionary genealogy of genes with enhanced non-supervised orthologous groups, species and functional annotations. Nucleic Acids Res 2010; 38: D190–5. [DOI] [PMC free article] [PubMed] [Google Scholar]
- 57.Roux S, Emerson JB, Eloe-Fadrosh EA, Sullivan MB. Benchmarking viromics: an in silico evaluation of metagenome-enabled estimates of viral community composition and diversity. PeerJ. 2017; 5: e3817. [DOI] [PMC free article] [PubMed] [Google Scholar]
Associated Data
This section collects any data citations, data availability statements, or supplementary materials included in this article.
Supplementary Materials
Data Availability Statement
Metagenome sequence data is publicly available in SRA (study accession SRP002480). Primary metagenomes, isolate and metagenome-assembled genomes from the SMGC, and genome annotations are available in: http://ftp.ebi.ac.uk/pub/databases/metagenomics/genome_sets/skin_microbiome. Source data has been provided for Figs. 1–4 and Extended Data Fig. 110.


