Abstract
The heightened cardiovascular disease (CVD) risk observed with omnivores is thought to be linked, in part, to gut microbiota-dependent generation trimethylamine-N-oxide (TMAO) from L-carnitine, a nutrient abundant in red meat. Gut microbial transformation of L-carnitine into trimethylamine (TMA), the precursor of TMAO, occurs via the intermediate γ-butyrobetaine (γBB). However, the relationship between γBB, red meat ingestion and CVD risks, as well as the gut microbial genes responsible for the transformation of γBB to TMA, are unclear. Here we show plasma γBB levels in individuals from a clinical cohort (n=2,918) are strongly associated with incident CVD event risks. Culture of human fecal samples and microbial transplantation studies in gnotobiotic mice with defined synthetic communities showed that the introduction of Emergencia timonensis, a human gut microbe that can metabolize γBB into TMA, is sufficient to complete the carnitine→γBB→TMA transformation, elevate TMAO levels, and enhance thrombosis potential in recipients following arterial injury. RNAseq analyses of E. timonensis identified a 6 gene cluster, herein named gamma-butyrobetaine utilization gene cluster (gbu), which is upregulated in response to γBB. Combinatorial cloning and functional studies identified 4 genes (gbuA, gbuB, gbuC, and gbuE) that are necessary and sufficient to recapitulate the conversion of γBB to TMA when co-expressed in E. coli. Finally, reanalysis of samples (n=113) from a clinical randomized diet intervention study showed that the abundance of fecal gbuA correlates with plasma TMAO and a red meat-rich diet. Our findings reveal a microbial gene cluster that is critical to dietary carnitine→γBB→TMA→TMAO transformation in hosts and contributes to CVD risk.
INTRODUCTION
A diet rich in red meat correlates with increased cardiovascular disease (CVD) risk.1–5 Blood levels of L-carnitine, a nutrient abundant in red meat, are associated with CVD risks in subjects, and dietary L-carnitine enhances atherosclerosis in animal models.6 Dietary L-carnitine is converted by gut microbes into trimethylamine (TMA), which following absorption is converted into TMAO by liver flavin-containing monooxygenases (FMOs), especially FMO3.7 Interestingly, dietary patterns greatly influence the capacity of gut microbes to convert L-carnitine→TMA. Compared to omnivores, vegetarians/vegans show a markedly reduced capacity to generate TMA from dietary carnitine;6 chronic dietary exposure to L-carnitine substantially increases the capacity of gut microbes to produce TMA in both omnivores and vegans.8 Suppression of gut microbiota with poorly-absorbed oral antibiotics has been shown both to eliminate the production of TMA and TMAO from dietary L-carnitine or γBB (humans and mice),6,8,9 and to suppress their pro-atherosclerotic effects (mice).6,9 One pathway for microbial transformation of dietary L-carnitine→TMA involves CntAB, comprised of an oxygenase Rieske-type catalytic polypeptide (CntA) and a reductase component (CntB).10 The reaction catalyzed by CntAB requires oxygen, and is not active under anaerobic conditions. Studies using different segments of intestines show heightened potential for carnitine→TMA transformation both within the more distal intestines and under anaerobic conditions,8 indicating the presence of an alternative pathway for carnitine→TMA generation by gut microbiota.
Recently, another gut microbiota-driven pathway for carnitine→TMA transformation was reported involving at least two sequential metabolic transformations: carnitine is converted into γ−butyrobetaine (γBB), which is then converted into TMA.8,9 Multiple microbes can convert dietary L-carnitine→γBB, but relatively few can transform γBB→TMA.8,9 Further, clinical investigations revealed that differences in the ability of omnivores versus vegetarians/vegans to convert carnitine into TMA is linked to this second gut microbial conversion (γBB→TMA).8
We recently reported the isolation of Emergencia timonensis, a low-abundance human gut commensal capable of converting γBB→TMA.8 Here we examine the relationship between γBB and prospective CVD event risk in a large clinical cohort. We also identify a microbial gene cluster required for the generation of TMA(O) from γBB as substrate, and elucidate the ability of microbes that harbor this γBB-utilizing (gbu) gene cluster to form TMA(O), and to impact in vivo thrombosis potential. Finally, we examine the impact of dietary practices, including red meat ingestion, on fecal microbial abundance of gbu gene cluster and E. timonensis, and on TMAO levels in humans.
RESULTS
Plasma γBB levels are associated with CVD risks independent of traditional risk factors.
We previously reported that the gut microbial conversion of γBB→TMA is regulated by diet, and itself regulates the overall conversion of dietary L-carnitine→TMAO in humans, with omnivores having significantly greater capacity to promote this transformation than vegetarians/vegans.8,9 To better understand the relationship between γBB and CVD in vivo, we first investigated the association between fasting plasma levels of γBB and CVD risk (n=2,918; see Supplemental Table 1 for subject characteristics). Increasing plasma γBB levels were dose-dependently associated with prevalence of CVD, coronary artery disease (CAD), and peripheral artery disease (PAD), even after adjustment for traditional risk factors, C-reactive protein (CRP), body-mass index (BMI) and kidney function (creatinine) (Fig. 1a, Supplemental Table 2). Figures 1b,c explore the relationship between plasma levels of γBB and incident (3-year) risk for major adverse cardiovascular events (MACE: death, non-fatal myocardial infarction (MI), or stroke). Kaplan-Meier survival analysis revealed poorer survival with increasing γBB levels (Fig. 1b). Moreover, Cox regression analyses demonstrated higher levels of γBB are significantly associated with incident MACE risk, including following adjustments for CVD risk factors and comorbidities (Fig. 1c). In further analyses, we found that subjects with high (>median) levels of both γBB and TMAO had the lowest survival and highest risk for experiencing an incident MACE during follow up (3 year), including following adjustments for traditional risk factors (p<0.01; Fig. 1d). High γBB levels only predicted adverse outcomes among subjects with concurrently high TMAO levels. In fact, individuals with high γBB and low TMAO levels showed reduced overall risk (Fig. 1d). These data are consistent with the hypothesis that gut microbiota-dependent γBB→TMAO metabolism drives the association observed between γBB and MACE risk.
Figure 1. Elevated levels of γBB are associated with increased incident of major adverse cardiac events (MACE = MI, stroke or death) risk in human subjects and increased in vivo thrombosis potential in animal models via production of TMAO.
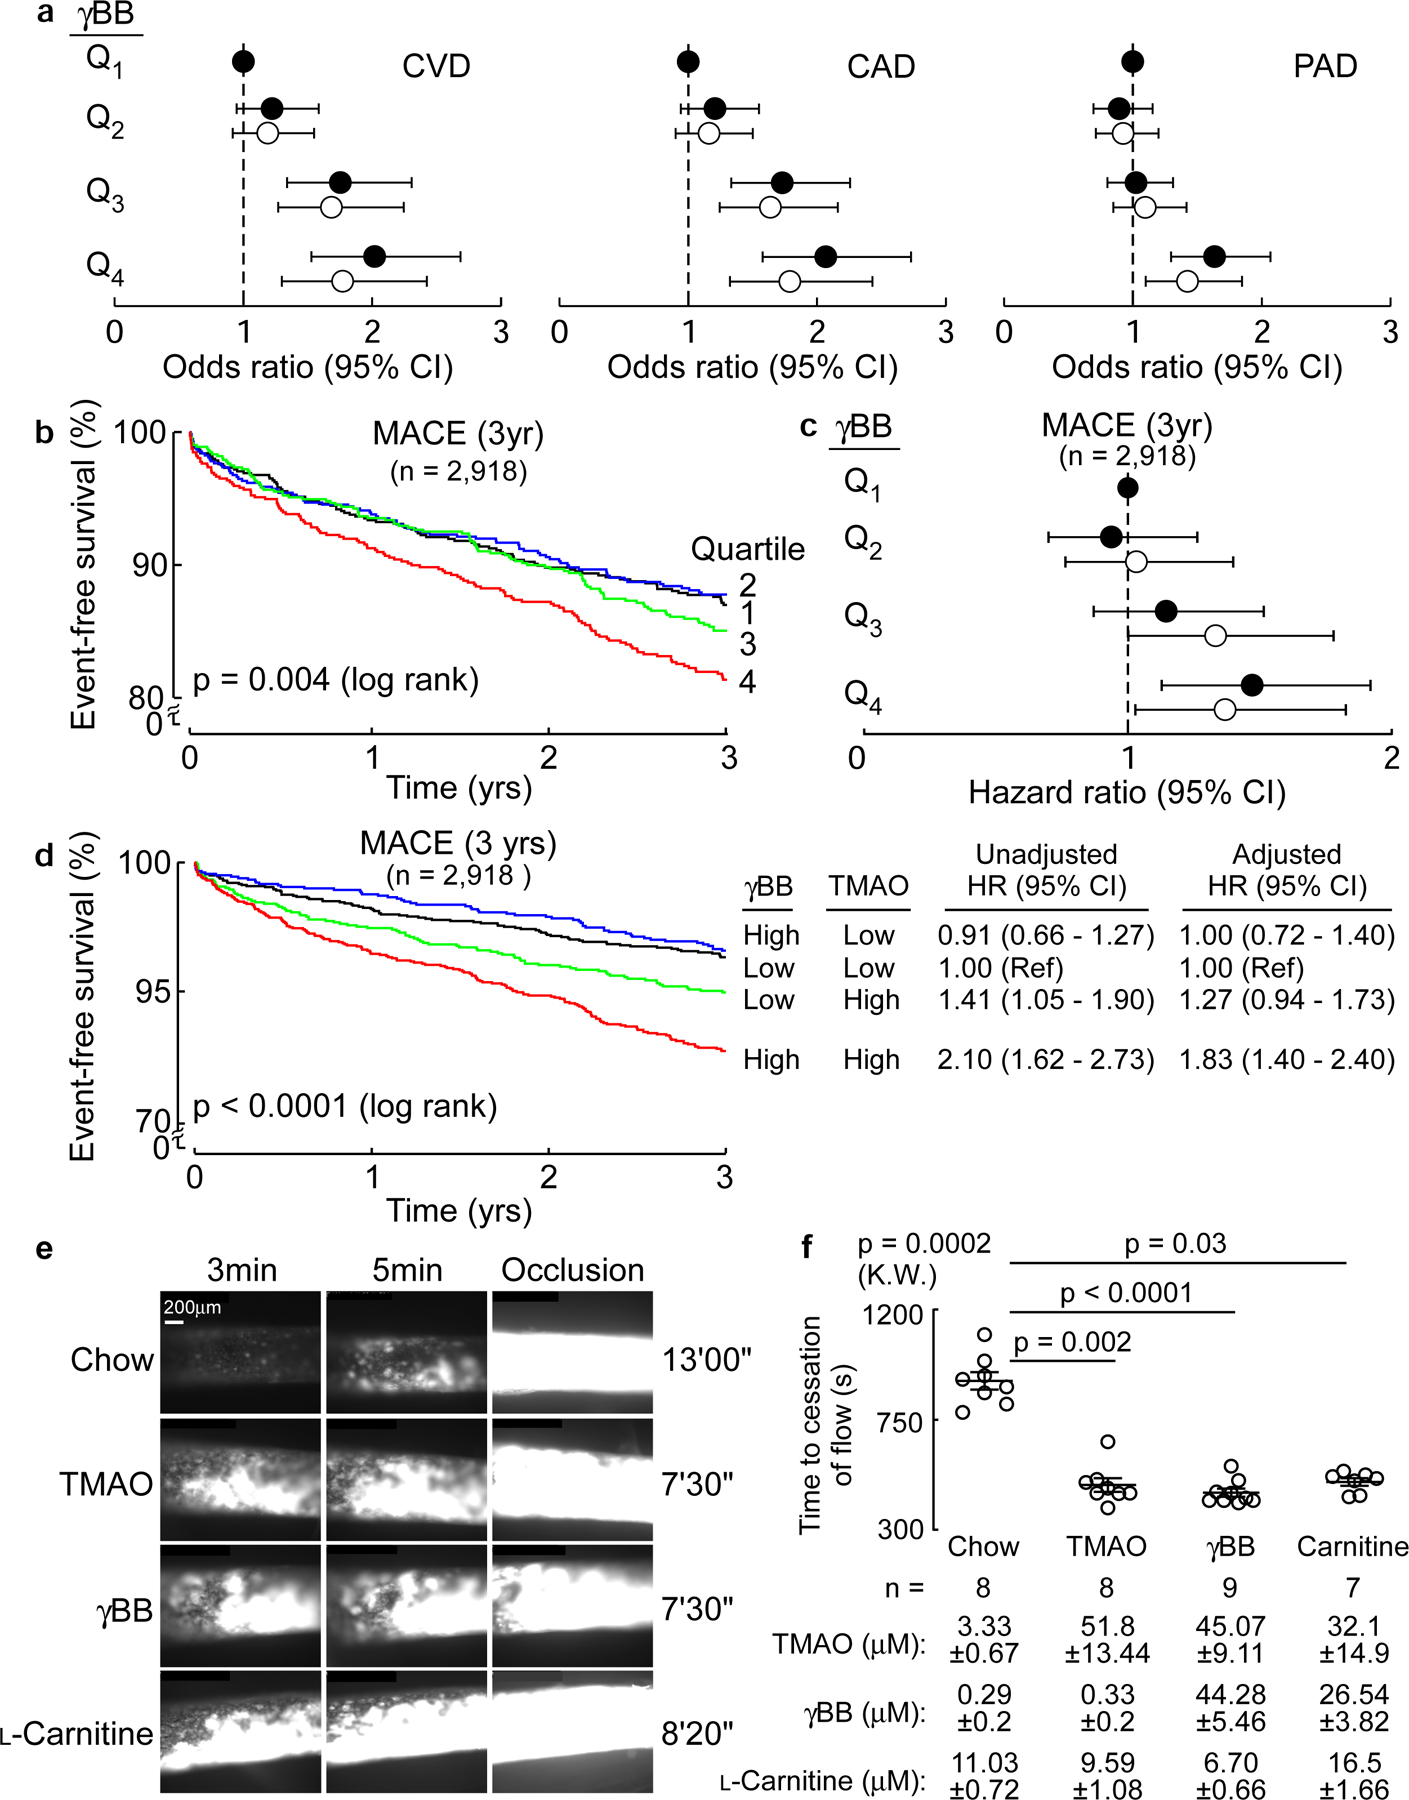
(a) Forest plots of odds ratios of CAD, PAD, and CVD tertiles of plasma levels of γBB in human subjects (n=2,918) before (closed circles) and after (open circles) logistic regression adjustments for traditional cardiovascular risk factors (age, sex, LDL cholesterol, HDL cholesterol, blood pressure, hypertension treatment, diabetes, and smoking), high-sensitivity C-reactive protein (CRP), kidney function (creatinine) and body mass index (BMI). Results are presented as odds ratio ± 95% confidence intervals. Dotted line at 1 represents no change in odds relative to the referent quartile (Q1).
(b) Kaplan-Meier estimates and the risk of incident 3 year MACE risk by quartiles of plasma γBB levels. Black = Q1, blue = Q2, green = Q3, red = Q4.
(c) Forest plot indicating incident (3 year) major adverse cardiovascular event (MACE) risk stratified by quartiles of plasma γBB. Hazard ratios shown are unadjusted (closed circles) and adjusting for traditional cardiovascular risk factors, CRP, creatinine and BMI (open circles). Results are presented as hazard ratio ± 95% confidence intervals. Dotted line at 1 represents no change in odds relative to the referent quartile (Q1).
(d) Kaplan Meier plot of MACE (3 year) stratified by low versus high (above versus below median) γBB and TMAO levels. Also shown are hazard ratios with 95% confidence intervals for unadjusted model, or following adjustments for traditional risk factors, CRP, creatinine and BMI. Median levels of γBB (0.84 µM) and TMAO (4.6 µM) within the cohort. Black = low γbb/low TMAO, blue = high γbb/low TMAO, green = low γbb/high TMAO, red = high γbb/high TMAO.
(e) In vivo thrombosis potential was measured in mice using the FeCl3-induced carotid artery injury model after dietary supplementation with either TMAO, γBB, or L-carnitine in comparison with control diet (no-supplementation; n=8) as described under Methods. Shown are representative vital microscopy images of fluorescent platelets during carotid artery thrombus formation at the indicated time points following arterial injury. Representative images were chosen based on proximity to the means shown in (f), from groups of n=8 each (Chow and TMAO), n=9 (γBB), and n=7 (Carnitine).
(f) Time to cessation of blood flow following arterial injury in mice from the indicated groups is shown. Each data point represents a distinct mouse. Also shown are mean (central line) ± SEM. Significance was determine by nonparametric Kruskal Wallis test for non-pairwise comparison and with post hoc analysis using Dunn’s for multiple comparisons. Plasma levels of L-carnitine, γBB and TMAO are reported mean ± SEM.
Dietary γBB supplementation increases thrombotic potential in vivo.
We next investigated the impact of dietary γBB (versus TMAO or L-carnitine) supplementation on clot formation in vivo using the FeCl3-induced carotid artery injury model. Compared to mice fed a normal diet (chow), those supplemented with γBB showed significantly higher plasma levels of TMAO and reduced time to cessation of blood flow following arterial injury (Fig. 1e,f). Similar elevation of plasma TMAO was observed in animals on either L-carnitine or TMAO-supplemented diets, with concomitant accelerated thrombus generation and shorter time to cessation of flow (Fig. 1e,f).
Gut microbial conversion of γBB→TMA is predominantly an anaerobic process.
To characterize gut microbial γBB→TMA conversion in humans, we used fecal samples (n=50) and monitored d9-γBB→d9-TMA transformation under both aerobic and anaerobic conditions (Fig. 2a). Similar to gut microbial production of TMA from choline, which primarily occurs under anaerobic conditions,11–15 human fecal communities showed negligible ability to metabolize γBB aerobically, and robust production of TMA under anaerobic conditions (Fig. 2a). When the same fecal microbial communities were screened for ability to transform d9-L-carnitine into d9-TMA, qualitatively similar results were observed. Specifically, only modest d9-L-carnitine consumption was observed under aerobic conditions, while complete consumption of L-carnitine was seen under anaerobic conditions (Fig. 2b). Similarly, although d9-TMA was detected in some aerobically-grown cultures, a more robust and consistent accumulation of d9-TMA was seen under anaerobic conditions (Fig. 2b). Based on the present results and those of prior studies,8,9 a schematic of the pathways and known microbial enzymes in the aerobic vs. anaerobic conversion of L-carnitine into TMA is shown in Fig. 2c. In the proximal intestines where both oxygen tension and carnitine levels are higher, direct L-carnitine→TMA transformation via CntA/B can occur. However, a significant proportion of gut microbial conversion of L-carnitine to TMA is more efficient under anaerobic conditions and occurs via a 2-step process (L-carnitine→γBB→TMA) where the second transformation (γBB→TMA ) is both rate limiting and regulated by diet (Fig. 2c).
Figure 2. E. timonensis is sufficient to provide vegan fecal polymicrobial communities with the anaerobic metabolic transformation capability to produce TMA from L-carnitine.
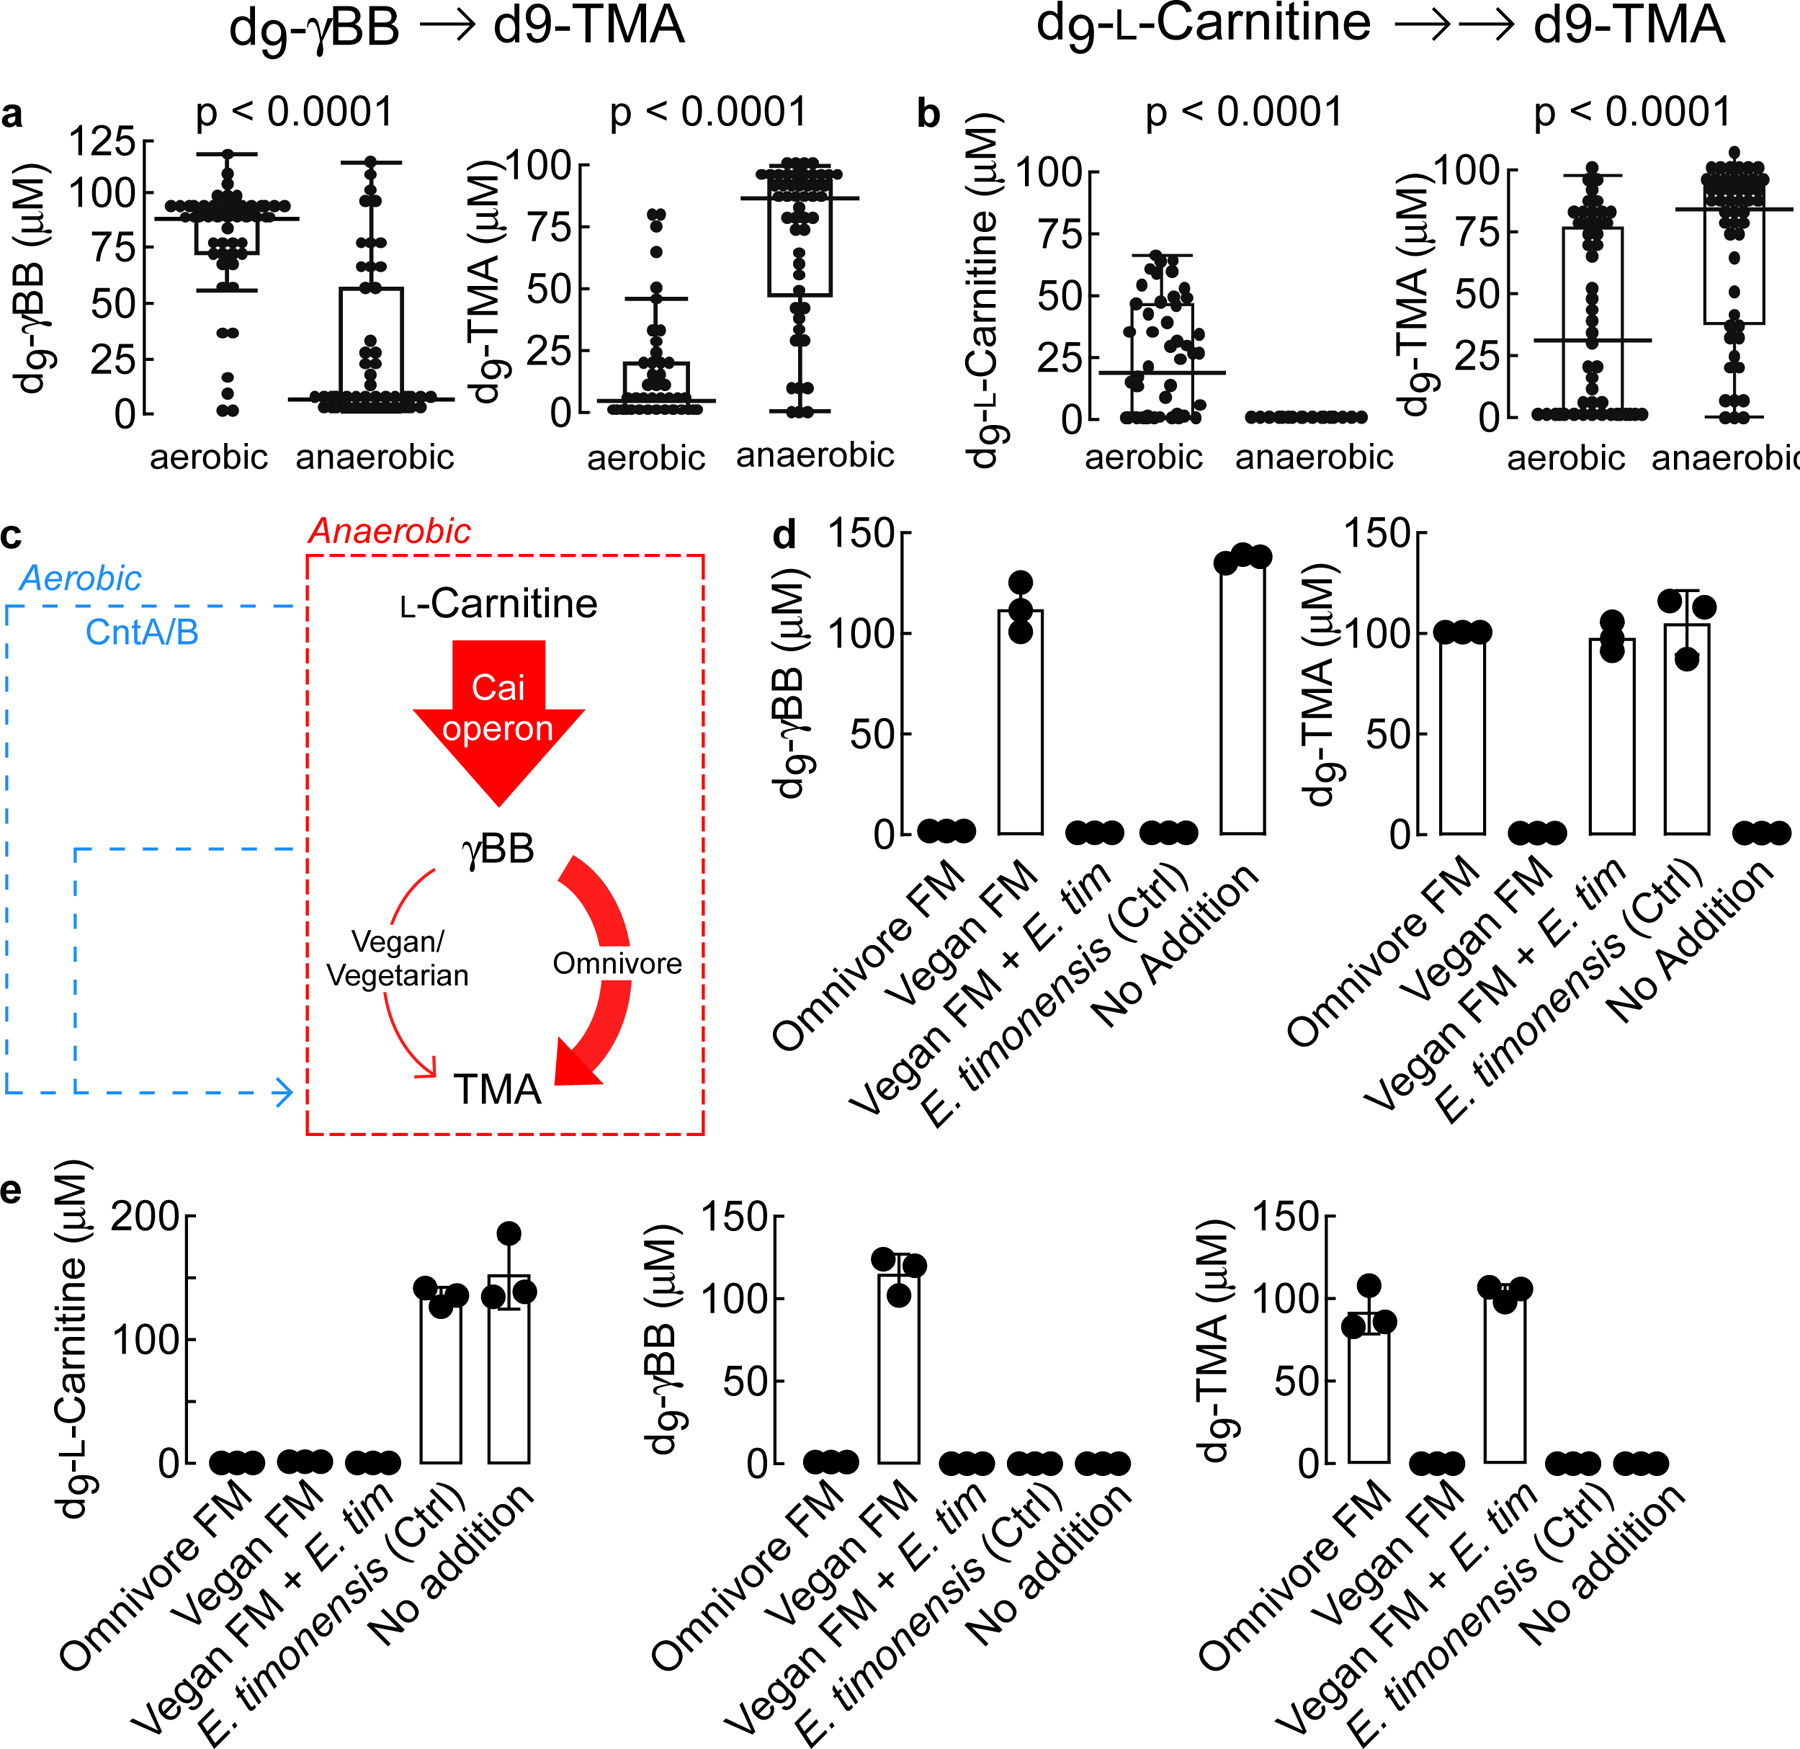
(a) LC-MS/MS quantification of d9-γBB consumption and d9-TMA production by fifty different human fecal communities 24 h after exposure to d9-γBB under either aerobic or anaerobic conditions. Results are presented as box-and-whisker plots with each point the mean metabolite value from three biological replicates of the same fecal bacterial community. The center line in the box shows the median for the data. The whiskers represent the expected variation of the data. The whiskers extend 1.5 times the IQR from the top and bottom of the box. If the data do not extend to the end of the whiskers, then the whiskers extend to the minimum and maximum data values. Fecal samples were collected from 50 healthy human subjects self-reported as omnivores. Significance was determined using two-way t-test.
(b) LC-MS/MS quantification of d9-L-carnitine consumption and d9-TMA production by fifty different human fecal communities 24 h after exposure to d9-L -carnitine under either aerobic or anaerobic conditions. Results are presented as box-and-whisker plots with each point the mean metabolite value from three biological replicates of the same fecal bacterial community. The center line in the box shows the median for the data. The whiskers represent the expected variation of the data. The whiskers extend 1.5 times the IQR from the top and bottom of the box. If the data do not extend to the end of the whiskers, then the whiskers extend to the minimum and maximum data values. Significance was determined using two-way t-test.
(c) Schematic of anaerobic (red) vs aerobic (blue) conversion of L-carnitine → TMA transformation. Arrow widths approximate measured contribution.
(d-e). Production of d9-TMA from exogenously added d9-L-carnitine (E) or d9-γBB (D) by fecal polymicrobial communities sourced from either healthy human omnivore (Omnivore FM [fecal microbiome]) or vegan (Vegan FM) donors. Where indicated, vegan polymicrobial communities were supplemented ex vivo with E. timonensis (Vegan FM + E. tim). E. timonensis alone (Ctrl) and media with no polymicrobial communities (No Addition) were used as additional controls. Samples were incubated for 24 h under anaerobic conditions. All biological replicates (n=3) are shown. Bar height represents the mean with error bars are ± one standard deviation from the mean.
E. timonensis enables vegan fecal polymicrobial communities to anaerobically convert γBB→TMA.
Previous studies from our lab identified Emergencia timonensis, a strict mesophilic anaerobe, as the primary culturable fecal organism capable of converting γBB→TMA.8 In further studies reported here, we observed that d9-γBB incubation with fecal microbial communities from omnivores completely consumed the d9-γBB, while those from vegan subjects were unable to consume any of the deuterated substrate (Fig. 2d). Consumption of d9-γBB by the omnivore communities was tied to the quantitative production of d9-TMA. Moreover, no d9-TMA was produced by the vegan communities on their own. When E. timonensis was added to vegan communities, we observed both complete consumption of d9-γBB and quantitative conversion to d9-TMA (Fig. 2d). In experiments starting with d9-L-carnitine, samples from both omnivores and vegans could completely consume d9-L-carnitine. But only omnivore samples produced d9-TMA, while vegan samples accumulated the intermediate d9-γBB (Fig. 2e). When fecal cultures from vegan subjects were incubated with d9-L-carnitine and supplemented with E. timonesis, an organism unable to metabolize d9-L-carnitine on its own,8 catabolism of d9-L-carnitine no longer led to accumulation of d9-γBB, but rather d9-TMA (Fig. 2e).
We next constructed various two-microbe systems to confirm whether E. timonensis was solely responsible for the gain of “γBB TMA-lyase” function observed in vegan fecal samples. The cai (caiTABCDE) operon has previously been identified as necessary for anaerobic carnitine metabolism into γBB,8,16,17 while the carnitine oxygenase CntA/B has been shown under aerobic conditions to convert both carnitine and γBB into TMA.10,18 We found that P. mirabilis, E. fergusonii, and K. pneumoniae were unable to consume d9-γBB independently under anaerobic conditions. Yet when co-cultured with E. timonensis, we observed complete consumption of d9-γBB and quantitative production of d9-TMA (Extended Data Fig. 1a). With L-carnitine as the substrate, only in co-culture with E. timonensis did either P. mirabilis or E. fergusonii result in TMA production. Further, anaerobic monoculture of K. pneumoniae, a cntA/B-containing microbe, could not utilize d9-L-carnitine, and co-culture with E. timonensis had no effect on either d9-γBB or d9-TMA production (Extended Data Fig. 1b). These results confirm that E. timonensis contains a gene/enzyme(s) necessary and sufficient for anaerobic conversion of γBB→TMA.
Synthetic recapitulation of the L-carnitine→γBB→TMA pathway and enhanced thrombus formation in vivo.
To confirm the ability of E. timonensis to complete the carnitine→γBB→TMA transformation and enhance thrombus formation in a host, germ-free mice were colonized with one of four communities, then maintained on a sterile chow diet and supplemented with L-carnitine via drinking water (Fig. 3; Methods). All mice received a base “Core” community, previously confirmed to be unable to consume L-carnitine or γBB, or to convert choline into TMA.14,19 A second group also received Proteus penneri (Core+P.p.), an organism previously demonstrated to contain a functional cai operon capable of converting L-carnitine to γBB8. Group three received the Core community supplemented with E. timonensis (Core+E.t.), while the forth group was colonized with the Core plus both P. penneri and E. timonensis (Core+P.p.+E.t.). After two weeks, mice were challenged by gastric gavage with both d9-γBB and d3-L-carnitine, allowing for simultaneous monitoring of d9-TMAO and d3-TMAO derived from their respective isotopologue precursor. When evaluating the d9-γBB tracer (Fig. 3b,c), mice colonized with either the Core or Core+P. penneri (P.p) communities were unable to metabolize d9-γBB. When E. timonensis (E.t.) was present (Core+E.t. or Core+P.p.+E.t.), d9-TMAO was detected in the circulation (Figure 3b,c). When evaluating the d3-L-carnitine precursor, generation of neither d3-γBB nor d3-TMAO was observed within recipients colonized by the Core community alone (Fig. 3d,e). However, additional colonization with P. penneri (either alone or with E. timonensis) resulted in detection of d3-γBB in plasma. Only when E. timonensis was co-colonized with P. penneri did we observe d3-TMAO in the circulation (Fig. 3d,e). These findings corroborate our in vitro results, and indicate that E. timonensis enables completion of the metaorganismal carnitine→TMAO transformation. Interestingly, E. timonensis fitness within the cecal microbial community was impacted by γBB production; when co-colonized with P. penneri, the abundance of E. timonensis increased 15-fold (Fig. 3f). But since the overall abundance of E timonensis within the microbial communities was so small (<1.0%), the relative abundance of other community members did not significantly vary (Extended Data Fig. 2).
Figure 3. In synthetic community E. timonensis is required to increases plasma TMAO levels and enhance thrombotic potential in response to L-carnitine supplementation.
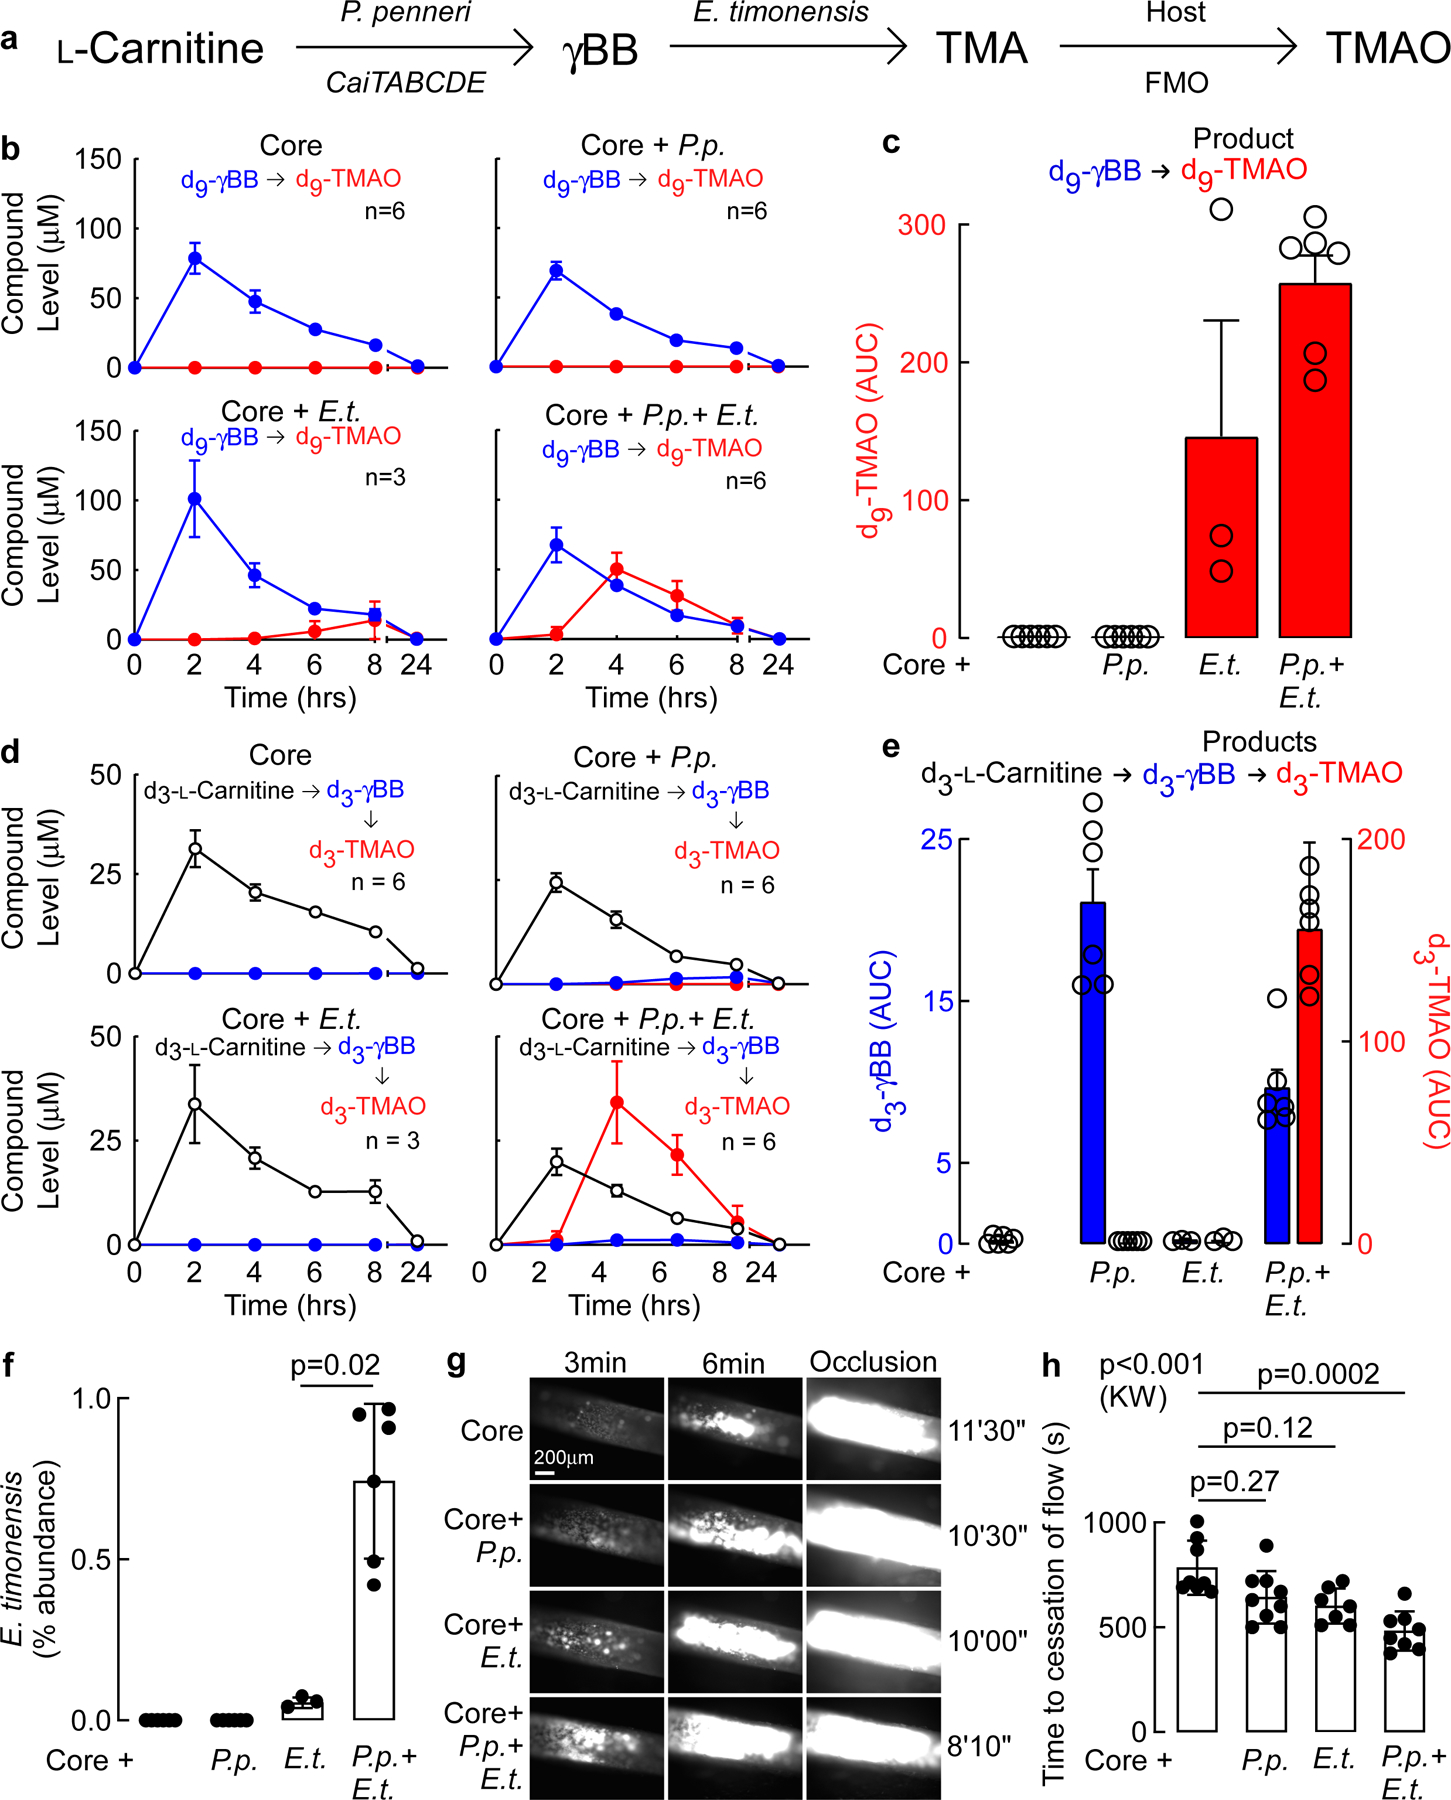
(a) Schematic identifying the role of each microbe and host in the conversion of L-carnitine to TMAO in colonized germ free mice under gnotobiotic conditions.
(b) Germ-free mice were colonized with the indicated communities and placed on 1.3 % w/v L-carnitine supplemented water ad libutium for 2 weeks, as described under Methods. The indicated numbers of animals received an oral challenge with d3-L-carnitine and d9-γBB, and blood was collected at the indicated time points. The functional capacity of synthetic polymicrobial community (Core) alone (Core = Bacteroides caccae, Bacteroides ovatus, Bacteroides thetaiotaomicron, Collinsella aerofaciens, Eubacterium rectale), versus Core in combination with either P. penneri (P.p.), E. timonensis (E.t.), or both P. penneri + E. timonensis, to promote each step in the carnitine→γBB→TMAO transformation, was monitored. Shown are the time course of plasma levels of d9-γBB (blue) and d9-TMAO (red) following d9-γBB oral challenge. Data presented as mean ± SEM.
(c) Area under the curve (AUC) quantification of d9-TMAO resulting from d9-γBB challenge. Data presented as mean ± SEM. N numbers for each bar correspond to those listed in (b): n=6 (Core), n=6 (Core+P.p.), n=3 (Core+E.t.), n=6 (Core+P.p.+E.t.).
(d) Time course of plasma levels of d3-L-carnitine (black), d3-γBB (blue), and d3-TMAO (red) following d3-L-carnitine oral challenge. Data presented as mean ± SEM.
(e) AUC quantification of d3-γBB (left y-axis) and d3-TMAO (right y-axis) resulting from d3-L-carnitine. Data presented as mean ± SEM.
(f) Relative abundance of E. timonensis in cecal contents collected from mice colonized with the Core community plus the indicated additional microbes as determined by COPROseq. Data presented as mean ± SEM; n=6 (Core), n=6 (Core+P.p.), n=3 (Core+E.t.), n=6 (Core+P.p.+E.t.). P value shown for Wilcox Rank-Sum test.
(g) Following colonization of germ free mice with Core synthetic community and the indicated additional microbes, and two weeks of dietary supplementation with L-carnitine, in vivo thrombus generation and time to cessation of flow were monitored following FeCl3-induced carotid artery injury. Shown are representative vital microscopy images of carotid artery thrombus formation at the indicated time points following arterial injury. Representative images were chosen based on proximity to the means shown in (h), from groups of n=8 (Core), n=9 (Core+P.p.), n=7 (Core+E.t.), n=8 (Core+P.p.+E.t.).
(h) Time to cessation of blood flow following arterial injury in mice from the indicated groups. Shown are mean (central line) ± SEM, and data points (individual mice). Significance was determine by nonparametric Kruskal-Wallis (K.W) test for non-pairwise comparison and by Dunn’s for multiple comparisons; n=8 (Core), n=9 (Core+P.p.), n=7 (Core+E.t.), n=8 (Core+P.p.+E.t.).
E. timonensis increases in vivo thrombus formation only when a γBB producer is present.
We next used the FeCl3-induced carotid artery injury model to test whether microbial γBB→TMA conversion is necessary to enhance dietary L-carnitine-driven in vivo thrombus formation. As expected, significant elevation in circulating TMAO in mice colonized by the above 4 communities was only observed among recipients colonized by Core+P.p.+E.t. (Extended Data Fig. 2); only in this group was the rate of clot formation visually enhanced (Fig. 3g) and the time to cessation of blood flow following injury significantly reduced (Fig. 3h). Mice colonized with Core+P.p. or Core+E.t. showed no change in thrombus formation when compared to mice colonized only with the Core community (Fig. 3g,h).
Identification of microbial gene cluster within E. timonensis that converts γBB→TMA.
To identify the gene(s) within E. timonensis responsible for γBB→TMA transformation, we assessed the transcriptome of E. timonensis using RNAseq. Analysis revealed a single gene cluster around the 800 Kbp region upregulated in the presence of γBB but not L-carnitine or choline (Fig. 4a). In total, 6 adjacent genes were markedly induced, some >25-fold, in the presence of γBB. We propose naming this gene cluster the gamma-butyrobetaine utilization cluster (gbu) (Fig. 4b, Extended Data Fig. 3; Supplemental Table 3) after its function in catalyzing the transformation of γBB→TMA. Within the cluster are a predicted acyl-coA dehydrogenase that also catalyzes the concerted release of TMA from γBB-coA (gbuA), two acyl CoA transferases (gbuB, gbuC), a ubiquinone oxidoreductase (gbuD), a betaine/carnitine/choline transporter (gbuE), and acyl-CoA thioester hydrolase (gbuF) (Extended Data Fig. 3).
Figure 4. Identification of the gamma-butyrobetaine utilization (gbu) gene cluster in E. timonensis.
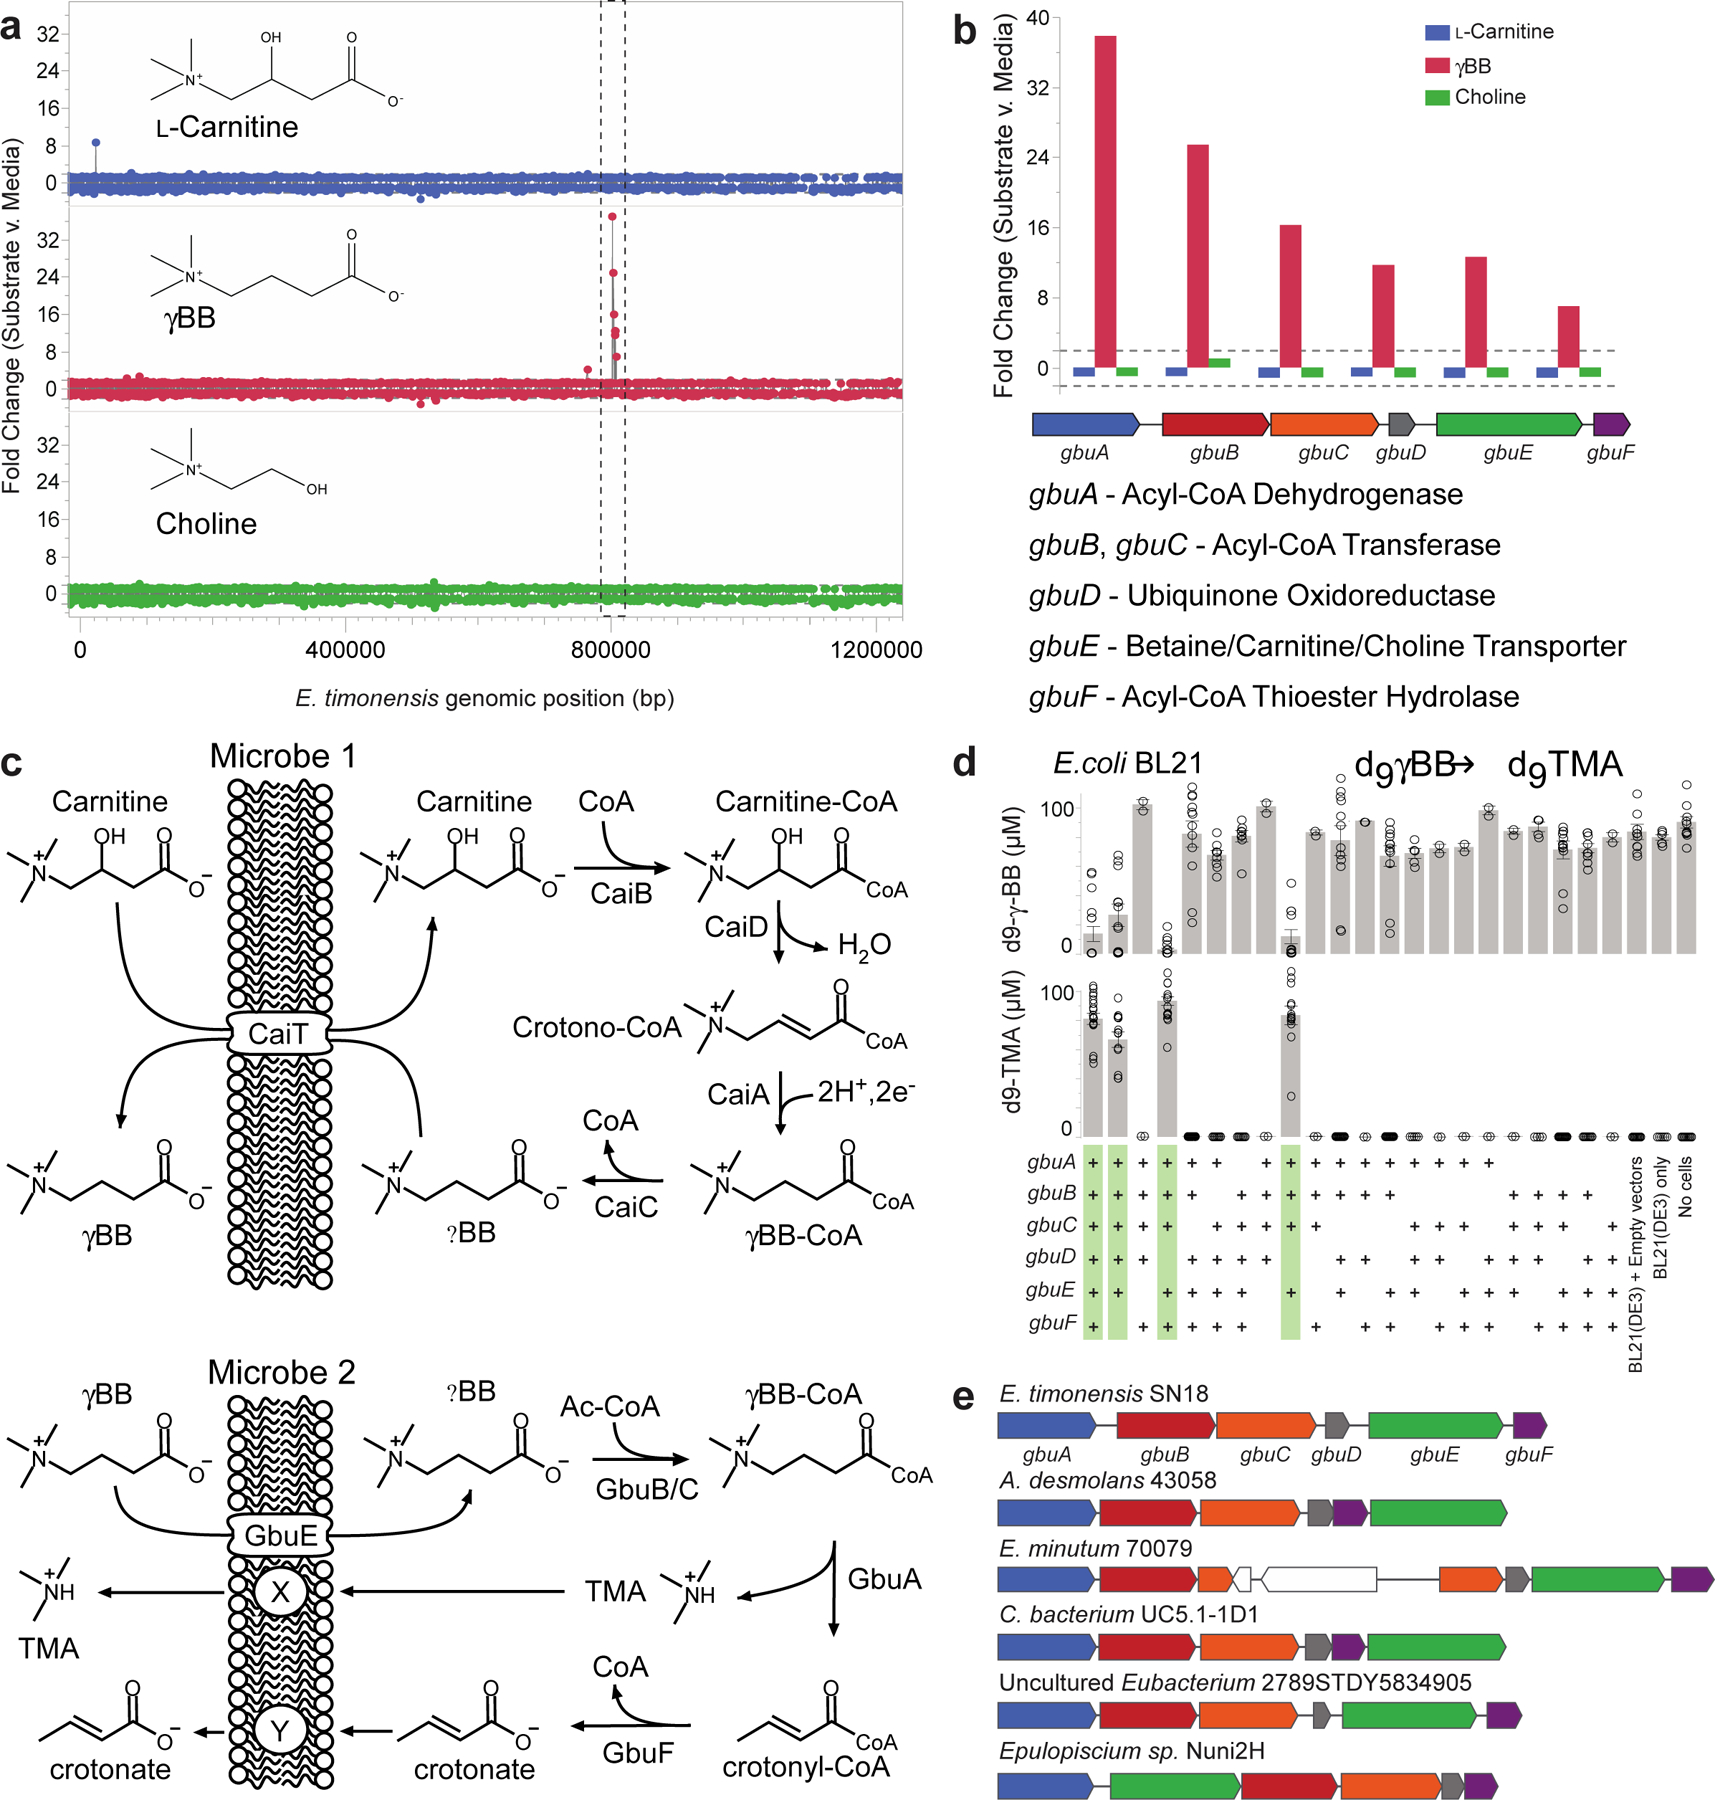
(a) Expression of E. timonensis genes, as detected by RNA-seq, after two hours of incubation with the trimethylamine containing substrates L-carnitine, γBB, or choline. The dashed box denotes the gene cluster upregulated exclusively in the presence of γBB.
(b) Cluster organization, gene annotation and comparative expression of the six genes within this gbu gene cluster from E. timonensis in the presence of L-carnitine, γBB, or choline. Dashed lines represent thresholds for significance.
(c) Proposed contribution of each cluster enzyme in TMA production via Two-Microbe systems.
(d) Heterologous expression of one or more recombinant, codon-optimized E. timonensis gbu gene cluster operon open-reading frames in the E. coli host strain BL21 (DE3). Cells were aerobically cultivated in Magic Media supplemented with d9-γBB and levels of d9-γBB and d9-TMA were determined by LC-MS/MS after 48 h. (+) symbols denote the presence of the recombinant ORF of interest on a plasmid. The four columns highlighted in green are those E. coli strains harboring a combination of recombinant gbu gene cluster genes necessary to produce d9-TMA from d9-γBB. All biological replicates (n=3 or more) are shown. Bar height represents the mean with error bars are ± one standard deviation from the mean.
(e) Presence and organization of the gbu gene cluster in other bacteria identified using basic local alignment search tool (BLAST) and MultiGeneBlast. gbu gene cluster gbuA = blue, gbuB = red, gbuC = orange, gbuD = grey, gbuE = green, gbuF = purple.
Following identification of the gbu gene cluster, we used combinatorial cloning and functional analyses to investigate the genes required for γBB→TMA conversion. Based on these and prior studies, a schematic of the two-microbe sequential carnitine→TMA transformation is shown in Fig. 4c. To ascertain the minimal gene set required for the γBB→TMA transformation completed by E. timonensis, we expressed one or more recombinant, codon-optimized, E. timonensis gbu operon open-reading frames in E. coli BL21 Star (DE3) cells (Fig. 4d, Extended Data Fig. S4a). Based on both d9-γBB consumption and d9-TMA production, 4 genes were identified as necessary and sufficient for TMA production in the non-native E. coli host: gbuA, gbuB, gbuC, and gbuE (Fig. 4c,d; Extended Data Fig. 3,4a).
We next sought to identify bacteria harboring gbu gene cluster homologs using two independent approaches (Methods), both of which yielded the same limited list (Fig. 4e; Supplemental Table 4). Beyond E. timonensis, the gbu cluster was found in only a handful of other organisms, including two isolates available in culture banks: the human oral isolate Eubacterium minutum 70079, and the feline fecal isolate Agathobaculum desmolans 43058. Culturing experiments with these and other related Clostriadiales isolates confirmed that only those organisms encoding a predicted gbu gene cluster (E. timonensis, E. minutum, A. desmolans) were able to significantly anaerobically transform γBB→TMA, whereas related species lacking a gbu cluster did not catabolize γBB→TMA (Extended Data Fig. 4b).
Red meat-rich diet enhances human fecal gbuA gene abundance.
Because a diet rich in red meat is associated with heightened cardiovascular mortality,1–5,20 we next examined the relation between fecal gbuA abundance and both dietary protein source (including red meat) and plasma TMAO levels. We leveraged access to fecal samples from a recently-reported randomized clinical dietary intervention study called APPROACH (Animal and Plant PROtein And Cardiovascular Health study; Clinicaltrials.gov NCT01427855),21 wherein 113 healthy participants consumed eucaloric diets of different protein sources (red meat, white meat, non-meat) prepared in a metabolic kitchen. A schematic of the study design is shown in Fig. 5a (see Methods and Supplemental Table 7 for further details). Across all diets the fecal abundance of gbuA was significantly correlated with paired plasma TMAO levels among all subjects examined (Fig. 5b). Regardless of diet order, subjects’ fecal gbuA abundance was overall lower following the Non-meat diet compared to Red meat diet (Fig. 5c). Diet order also impacted the overall results – subjects completing the Red meat diet before the Non-meat diet showed more pronounced reduction in fecal gbuA abundance when compared to the increase in fecal gbuA observed among those who first completed the Non-meat diet (Fig. 5c). Changes in fecal gbuA content failed to reach significance following Red meat versus Non-meat diets when examining the impact of an intermediary White meat diet, though fecal gbuA trended toward lower levels when comparing subjects with the dietary order Red meat→White meat→Non-meat (Extended Data Figure 5a-d). We also compared the impact of each of the interventional diets on fecal gbuA content independent of diet order (Fig. 5c, Extended Data Fig. 5e-h), and with every dietary order (Extended Data Fig. 6). The change in circulating TMAO was weakly correlated with the change in relative abundance of gbuA following transition from a Red meat to Non-meat diet (i.e. reduction in both plasma TMAO and fecal gbuA; Fig. 5d), but not with other diet order transitions (Extended Data Fig 7).
Figure 5. Microbial gbuA abundance in human feces is both enriched by a red meat rich diet, and associated with plasma TMAO levels.
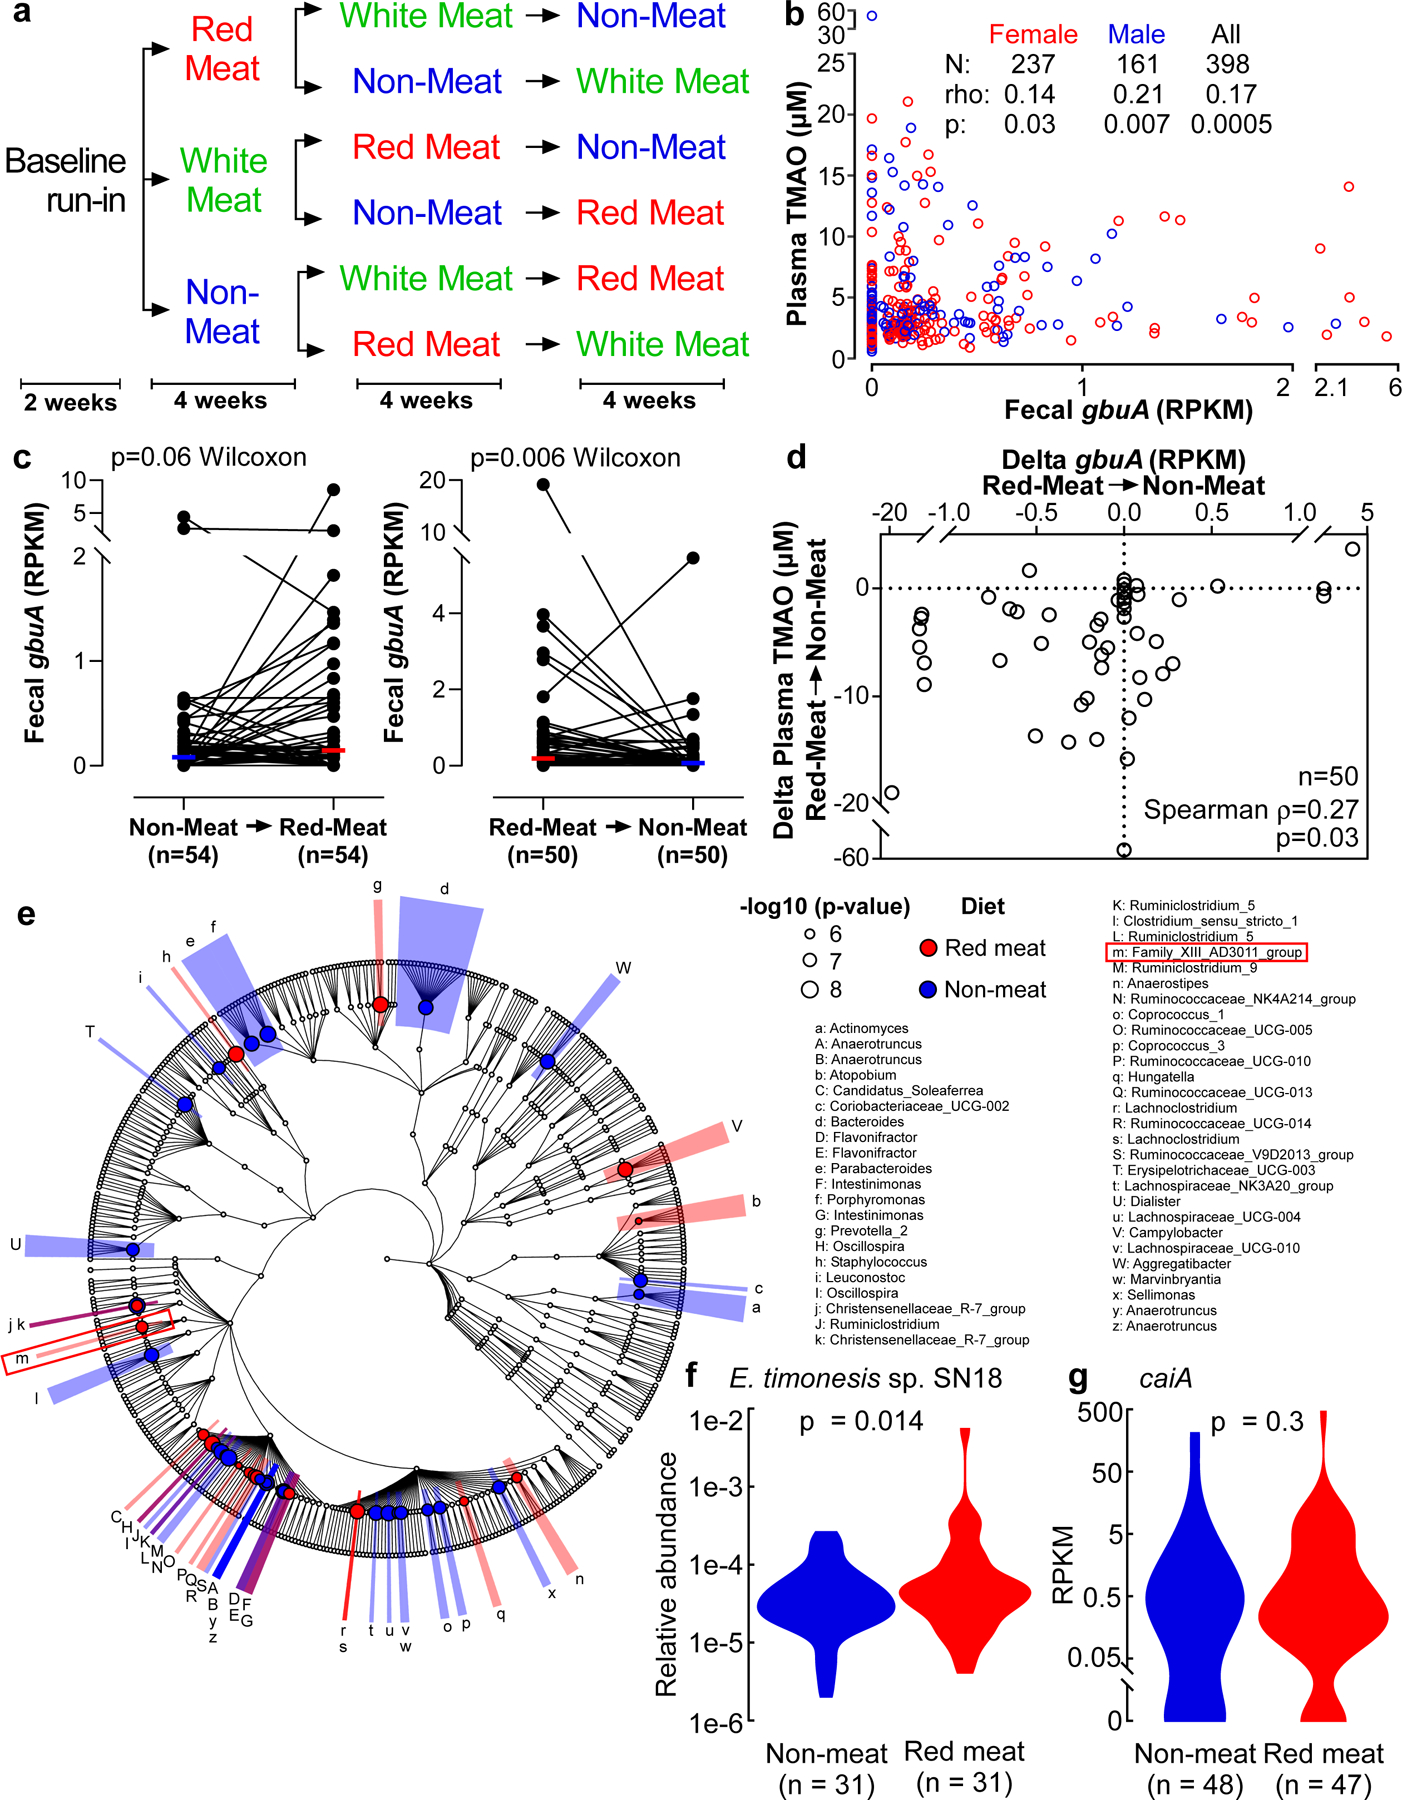
(a) Scheme showing the order of diets in subjects enrolled in the APPROACH diet intervention study.
(b) Fecal gbuA abundance was determined from metagenomics deep sequencing data from samples recovered following one month of the indicated investigational diet. Plasma TMAO was also determined on samples collected the same day. Shown are two-tailed Spearman rank correlation coefficient, and p values for the indicated numbers of males, females and all subjects.
(c) Fecal abundance of gbuA following 1 month of the indicated diets was assessed to determine how fecal gbuA abundance changes in response to dietary treatment. The chronological order of the Non-meat and Red meat diets shown includes both subjects who directly transitioned between the indicated diets, as well as those with an intervening (White meat) diet. Median lines are indicated and p-value is shown for two-way Wilcoxon signed-rank test.
(d) Changes in fecal gbuA abundance and paired changes observed in plasma TMAO levels in subjects completing the 1 month interventional Red meat diet before the Non-meat diet (i.e. the same subjects as in panel c, right). Two-tailed Spearman rank correlation coefficient and p values are shown.
(e) 16S rRNA gene taxonomy abundance upon direct transition from Red meat to Non-meat diets (n=31; paired samples). Highlighted in (red) are taxa significantly more abundant on a Red meat diet. Highlighted in (blue) are taxa significantly more abundant on a Non-meat diet. The red box indicates the location of E. timonensis (Family_XIII_AD3011_group; letter m).
(f) Relative abundance of E. timonensis in subjects from panel e determined by 16S rRNA gene analysis. P value shown for two-way Wilcox Rank-Sum test.
(g) Relative abundance of caiA (calculated from shotgun metagenomic analysis) in subjects on a Red meat or Non-meat diet (n=47 and n=48, respectively). P value shown for two-way Wilcox Rank-Sum test.
In separate analyses, we used 16S rRNA gene sequencing to assess human fecal community phylogeny. The majority of community features that significantly differed between the Red meat and Non-meat diets were consistent with prior reports examining the effect of omnivorous vs. vegetarian/vegan diets.22–25 Specifically, we observed an increase in Ruminococcaceae in subjects consuming a diet rich in red meat, while Lachnospiraceae and Lachnoclostrdium were enriched after switching to the Non-meat diet (Fig. 5e). When assessing changes associated with γBB metabolism and the gbu gene cluster, only E. timonensis was identified, and represented less than 0.21% of the total fecal microbial community (Fig. 5e,f). Despite its low abundance, 16S rRNA analyses showed levels of E. timonensis were significantly increased following the Red meat diet compared to Non-meat diet (Fig. 5e, letter “m” Family_XIII_AD3011_group; Fig. 5f), and independent shotgun metagenomics analyses showed similar results (White’s non-parametric t-test, p=0.01; Extended Data Fig 8). Fecal E. timonensis abundance (by metagenomics analyses) for all diet orders experienced are shown in Extended Data Figure 9, and indicate the anticipated changes/trends between Red meat (higher) versus Non-meat (lower) diet when subjects experienced the Red meat prior to the Non-meat diet. No change in fecal caiA abundance was observed, regardless of dietary order (Fig 5g, Extended Data Figure 10).
DISCUSSION
The connection between a red meat diet and the risk of CVD is well established,1–5,20 but the underlying mechanisms remain unclear. Previous studies link this risk to the gut microbiota-dependent production of TMA(O) from the precursor L-carnitine, a nutrient abundant in red meat.6,8,9 Both human and animal studies show that gut microbiota-dependent generation of TMA from dietary L-carnitine is a two-step conversion involving separate microbes, with γBB as an intermediate.8,9 Prior studies have revealed substantial differences in dietary L-carnitine metabolism between omnivores and vegans/vegetarians, wherein adherence to a vegan/vegetarian diet results in markedly reduced capacity to convert L-carnitine into TMA(O).6 Following either L-carnitine supplementation8 or adoption of a red meat-rich diet21, a dramatic increase in gut microbiota-dependent L-carnitine→γBB→TMA transformation occurs with TMAO elevation. However, the clinical prognostic relevance of plasma γBB in patient populations has not been explored. We now report that circulating γBB is significantly associated with CVD and MACE risk, but only with concurrent elevation of TMAO. Moreover, animal model studies suggest dietary γBB, like L-carnitine and TMAO, enhances in vivo thrombosis potential, consistent with the effects of TMAO on platelet reactivity.26 Additional studies presented identify the microbial gbu gene cluster responsible for γBB→TMA transformation, which is linked to host TMAO elevation, a pro-thrombotic physiological response from dietary carnitine, and chronic dietary red meat ingestion.
An overall scheme of our findings is shown in Figure 6. A diet rich in red meat, and thus L-carnitine, is associated with enhanced TMAO generation and cardiovascular disease risk via a two-step, microbiota-dependent anaerobic pathway. Following chronic L-carnitine ingestion, γBB is initially generated via enzymes of the cai operon, which are abundant in phylogenetically diverse gut microbiota in both omnivores and vegetarians/vegans. Exposure to γBB results in the up-regulation of a specific microbial gene cluster, gbu (gamma butyrobetaine utilizing), which is responsible for the conversion of γBB→TMA. The low abundance microbes harboring gbuA can catabolize γBB→TMA in the mostly anaerobic environment of the distal human gut. Production of γBB also enhanced fitness of gbuA-harboring microbes in colonized gnotobiotic mice. RNAseq studies show the gbu gene cluster is exclusively upregulated in response to γBB, but not by either the structurally similar molecule L-carnitine or the TMA-containing substrate choline. The minimal components of the gbu gene cluster necessary and sufficient for catalyzing the γBB→TMA transition in non-native E. coli host were defined by combinatorial cloning and functional studies, and clinical intervention studies show the abundance of the gbu gene cluster is modulated in response to a red meat vs. non-meat based diet. Subjects on the red meat rich diet had higher plasma levels of TMAO and fecal gbuA, while transitioning to a non-meat diet significantly reduced fecal gbuA abundance and TMAO. Overall, the present studies reveal a critical role for γBB and its gut microbial metabolism in the links between a red meat rich diet, TMAO elevation and heightened CVD risks (Fig. 6). We note that a recent preprint by Rajakovich et al. recently identified the same 6-membered gene cluster in E. timonensis in catalyzing TMA generation from γBB27. Their independent characterization of the microbial biochemical pathway was highly aligned with our findings, further validating the role of the gbu gene cluster in gut microbial γBB→TMA transformation reported herein.
Figure 6. Critical role of gut microbial γBB transformation into TMAO and CVD risk from a red meat rich diet in host.
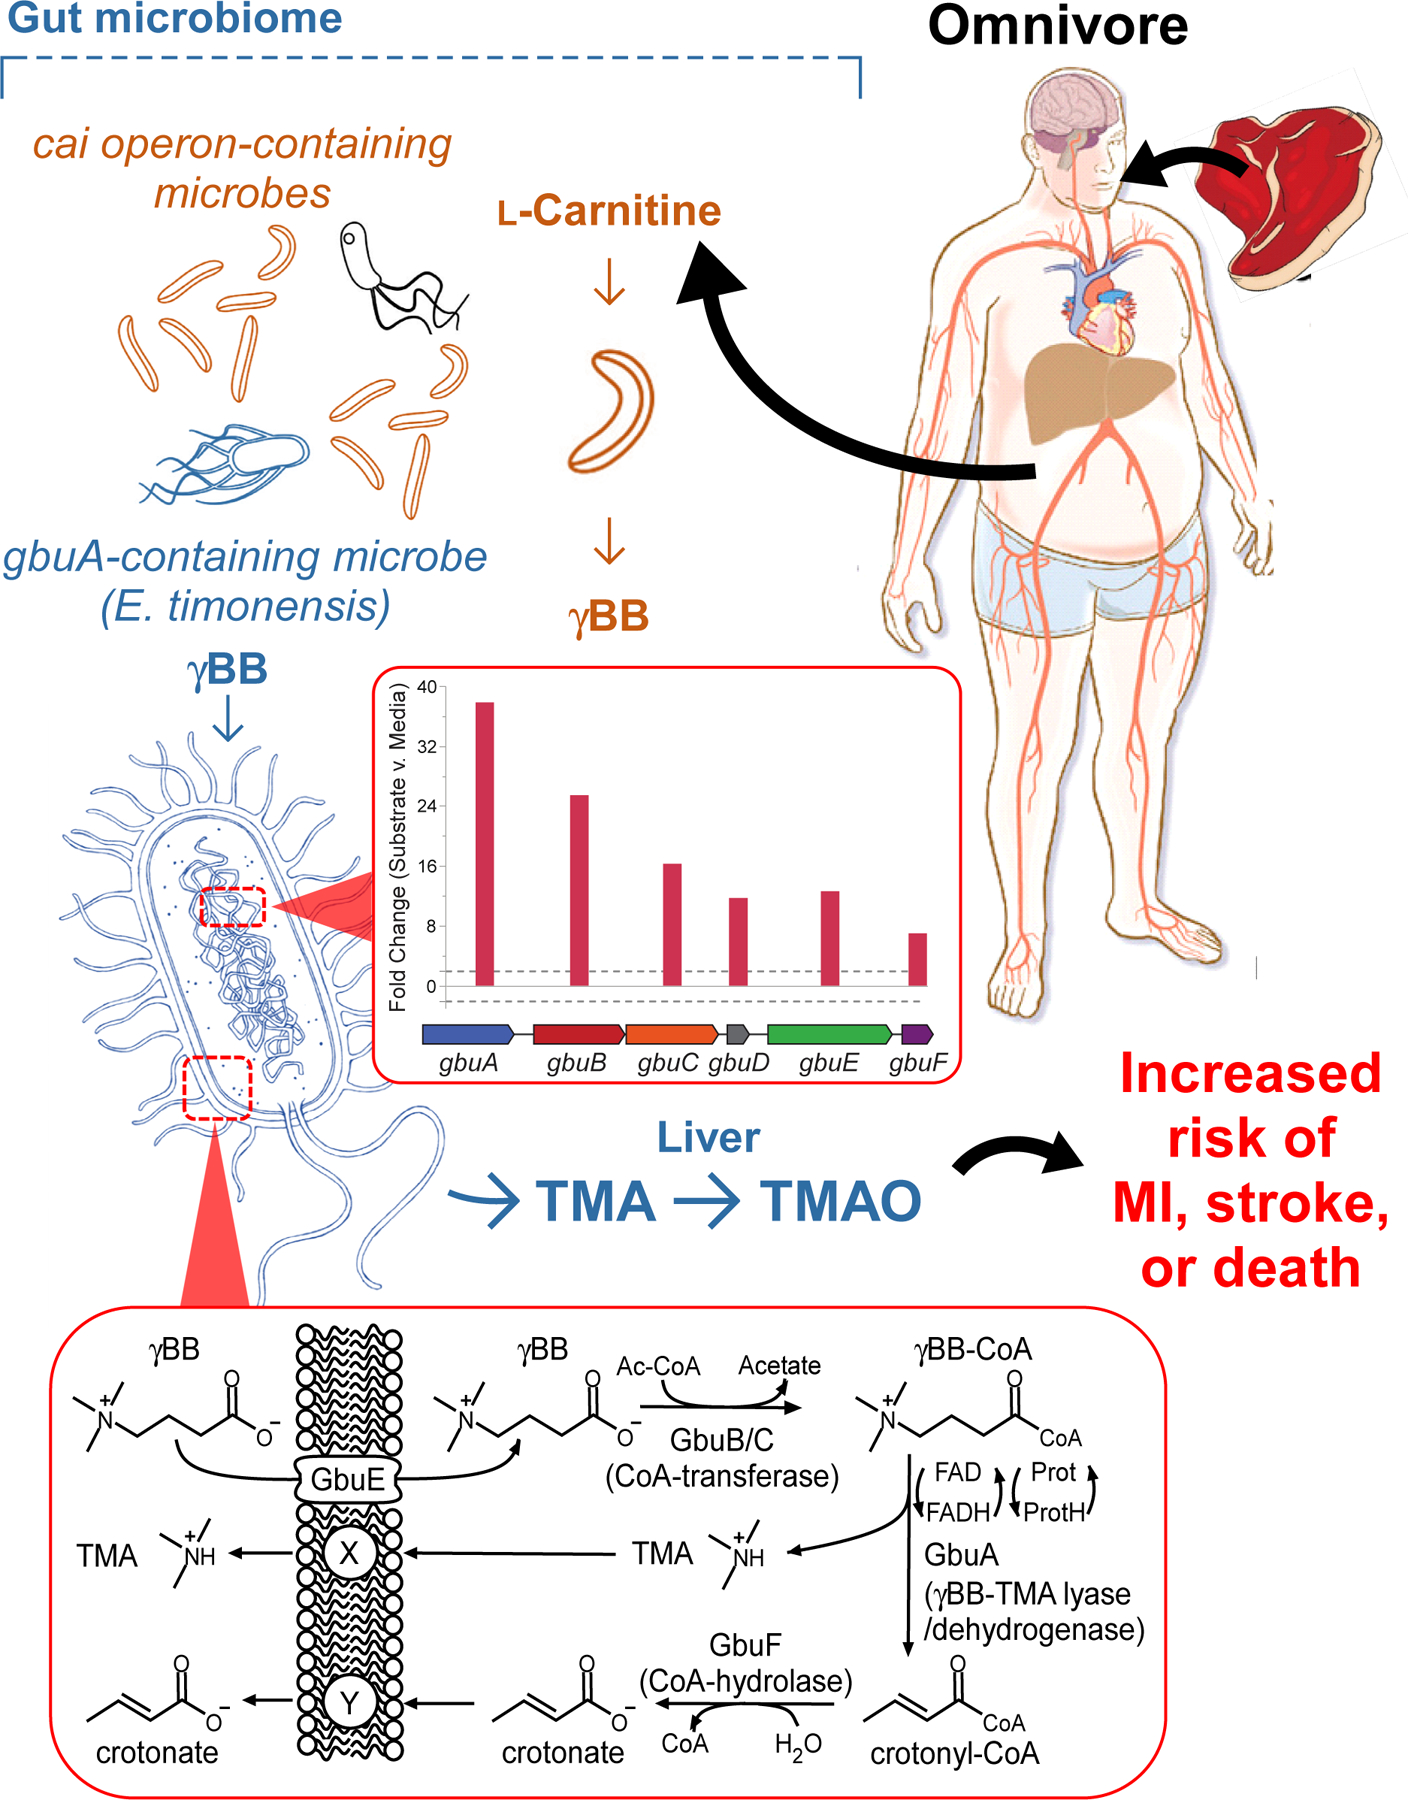
L-Carnitine, a compound abundant in red meat, is first converted into γBB by multiple human commensals that possess the cai operon. γBB is further metabolized into TMA, a precursor of a prothrombotic metabolite TMAO, by low abundance microbes (e.g. E. timonensis) harboring the gbu (gamma-butyrobetaine utilization) gene cluster. The inset graph (middle) shows both the gbu gene cluster organization and the fold increase in expression of each of the indicated genes upon exposure to γBB, as outlined in detail in Fig4. The inset scheme (bottom) depicts the overall metabolic transformation (γBB into TMA and crotonate) mediated by the microbial gbu gene cluster. The content of E. timonensis and the gbu gene cluster are both significantly enhanced by a red meat rich diet. The microbial intermediate γBB fosters this effect, and the resultant elevation in TMAO is clinically linked to heightened risk for heart attack, stroke and death. The microbial gbu gene cluster thus links microbial L-carnitine catabolism to red meat diet-enhanced cardiovascular disease risk.
The human fecal polymicrobial studies performed further suggest that a lack of the gbu gene cluster (catalyzes γBB→TMA), and not the cai operon (L-carnitine→γBB), is responsible for the reduced ability of vegetarians/vegans to produce TMA(O) from L-carnitine. In many vegans, gbuA expression appears to either be suppressed to virtually undetectable levels or absent entirely. Our studies suggest that the microbial production of γBB regulates the abundance of the gbu gene cluster and gbu-containing organisms. Therefore, prolonged consumption of a plant-based diet could in theory permanently alter the metabolic capabilities of the intestinal microbiome. In this case, effective elimination of the gbu gene cluster from the gut microbiome may provide a mechanism by which a plant-based diet could lower risk for CVD and other metabolic disorders associated with TMAO.28–30 Notably, in our clinical studies, subjects with high γBB yet low TMAO showed reduced risk for adverse cardiovascular events (Fig. 1). Further, in recent studies where both vegans and omnivores continued on their diets but were provided L-carnitine supplements, TMAO levels on average increased in both groups, but a significant portion of the vegans showed no change in TMA(O) levels,8 suggesting changes in gut microbial metabolic capacity may be maintained over time. Altogether, the present studies reveal the identification of the gut microbial pathway responsible for TMA generation from γBB, and help to explain how a diet rich in red meat can lead to elevated TMAO levels and heightened CVD risks.
Methods
Information and requests for resources and reagents should be directed to and will be fulfilled by the Lead Contact, Stanley L. Hazen (hazens@ccf.org). All unique/stable reagents generated in this study are available from the Lead Contact with a completed Materials Transfer Agreement.
Human Clinical Subjects –
All studies were approved by the Cleveland Clinic Institutional Review Board, and all participants gave their written informed consent. A clinical observational study assessed the relationship between plasma γBB levels and both prevalent and incident cardiovascular risks. These investigations used archival plasma (n = 2,918) from the GeneBank cohort (GeneBank: NCT00590200 https://clinicaltrials.gov/ct2/show/NCT00590200), a research repository comprised of sequential consenting stable subjects undergoing elective diagnostic cardiac evaluations with connecting clinical longitudinal outcome data.6,31 Exclusion criteria for GeneBank included patients with a recent myocardial infarction (< 4 weeks) or elevated troponin I (> 0.03 mg dl–1) at enrollment. CVD was clinically defined as having a previous history of documented CAD, PAD, cerebral vascular disease (history of a transient ischemic attack or cerebrovascular accident), history of revascularization (coronary artery bypass graft, angioplasty, or stent) or significant angiographic evidence of CAD (≥50% stenosis) in at least one major coronary artery at time of coronary angiography. Subjects with CAD were defined as patients with adjudicated diagnoses of stable or unstable angina, myocardial infarction, history of coronary revascularization, or angiographic evidence of ≥50% stenosis of at least one major coronary artery. PAD was defined as subjects having any clinical evidence of extra-coronary vascular disease. Fecal samples were collected from healthy volunteers during the observational pilot phase of the study CARNIVAL (CARNIVAL: NCT01731236 https://clinicaltrials.gov/ct2/show/NCT01731236), which focuses on the study of gut microbial metabolism of L-carnitine in subjects. Subjects were divided into vegan/vegetarian or omnivore groups based on extensive dietary questioning. The APPROACH trial (ClinicalTrials.gov Identifier: NCT01427855), described below, involved study protocols approved by the Institutional Review Boards of Children’s Hospital and Research Center of Oakland and the Cleveland Clinic, and all subjects gave written informed consent. In addition, fecal samples from healthy volunteers (omnivores) were collected from consenting subjects from the Procter & Gamble campus.
γBB, TMAO and in vitro diagnostics laboratory analyses –
Levels of endogenous and isotope labeled γBB and TMAO were determined as previously described by stable isotope dilution liquid chromatography–tandem mass spectrometry (LC-MS/MS) in positive ion multiple reaction monitoring (MRM) mode using a Shimadzu 8050 triple quadrupole mass spectrometer with ultra-HPLC interface.6,8 High-sensitivity C-reactive protein, plasma glucose, hemoglobin A1C, creatinine and lipid profiles were measured on the Roche Cobas platform (Roche Diagnostics). Laboratory personnel performing clinical and mass spectrometry analyses were blinded to sample group allocation and clinical data during analysis.
Human fecal polymicrobial incubation with deuterium-labeled L-carnitine and γBB –
Human fecal samples were collected with the Fisherbrand™ Commode Specimen Collection System (Cat. 02–544-208) and sealed in a secondary container with a BD BBL™ CO2 gas. Samples were homogenized under anaerobic conditions (within anaerobic chamber) into a 20% w/v slurry with a sterile solution containing 3% v/v trypticase soy broth (TSB) and 1% w/v trehalose. Homogenized fecal slurry was filtered through a 100-micron EASYstrainer (Greiner Bio-One) by gentle centrifugation at 200 x g for 2 minutes. Filtered slurry was recovered, DMSO added to 5% v/v and the samples were sealed in gas tight vials and maintained at –80°C until further use. In an anaerobic chamber (Coy Laboratory Products, Grass Lake, MI, USA) fecal slurries were thawed and diluted 100-fold into 990 µl of M9 medium (6 g/L Na2HPO4, 3 g/L KH2PO4, 0.5 g/L NaCl, 1 g/L NH4Cl, 0.1 mM CaCl2, 1 mM MgSO4) in 96-well deep-well plates. After samples were inoculated anaerobically, plates intended for aerobic incubation were removed from the anaerobic chamber and placed in an aerobic incubator. Both the anaerobic and aerobic sample plates were allowed to equilibrate for 2 hours prior to the addition of 100 µM d9-L-carnitine or d9-γBB as appropriate. Following addition of substrate, plates intended for aerobic incubation were covered with a sterile AeraSeal (Millipore-Sigma), while those intended for anaerobic incubation were covered with a sterile foil seal. Plates were incubated at 37°C with constant shaking at 800 rpm in their respective oxygen condition. For studies additionally examining the impact of E. timonensis on fecal polymicrobial community metabolism of d9-L-carnitine or d9-γBB, E. timonensis cultures were first grown overnight in sBHI Broth (Anaerobe Systems Cat# AS-872) directly from glycerol stocks at 37ºC in an anaerobic chamber. Overnight cultures of E. timonensis, like fecal slurries, were diluted 100-fold into M9 medium containing the fecal sample of interest or into media alone as a control. All other procedures were identical to those described above for fecal polymicrobial communities alone. Following 22 hrs of incubation, reactions were quenched by addition of formic acid to a final concentration of 0.1%. The products were determined by LC-MS/MS with d4-choline and 13C3,15N-TMA added as internal standards. Fecal samples for these ex vivo polymicrobial assays were collected from donations by consented, self-reported healthy volunteers on the Procter & Gamble campus.
Bacterial co-culture metabolism assays –
Escherichia fergusonii ATCC 35469, Klebsiella pneumoniae ATCC 12657, Proteus mirabilis ATCC 29906, and Emergencia timonensis 71.38 were stored in the laboratory as glycerol stocks at −80ºC. Bacteria were grown anaerobically in sBHI broth directly from the glycerol stock overnight at 37°C. The next day the turbidity of each overnight cultures was adjusted to match that of E. timonensis. A streak of each liquid culture was also created to check for culture purity. Normalized cultures were each diluted 100-fold into 990 µl of M9 media in a 96-well deep-well plate. Ten microliters of 10 mM d9-γBB or L-carnitine was added to the appropriate samples for a final substrate concentration of 100 µM. Sample plates were covered with sterile foil seals and shaken at 800 rpm overnight at 37ºC under anaerobic conditions. Following 22 hrs of incubation, reactions were quenched by addition of formic acid to a final concentration of 0.1%. Plates were removed from the anaerobic chamber, centrifuged at 4,000 x g for 12 min, and 150 µl of supernatant was transferred to a new 96-well deep-well plate. The metabolic products were determined by LC-MS/MS.
Mice and diets –
All experiments involving mice were performed using protocols approved by the Cleveland Clinic Animal Care and Use Committee. C57BL/6J conventional female mice were purchased from Jackson Laboratories (#0664, Jackson Laboratory, Bar Harbor, ME). Germ Free C57BL/6 female mice were either purchased from Charles River Laboratories or maintained as a colony in plastic flexible film gnotobiotic isolators at the Cleveland Clinic Biological Resources Unit. Animals were maintained under a strict 14 h light/10 h dark cycle, ambient temperature 68–79 ᵒF, and humidity 30–70%, with water and food available ad libitum. Mice were housed in ventilated microisolator cages, sealed sterilized cages with HEPA filters or Allentown Sealed Positive Pressure Cages depending on the study. Because of the marked suppressive effect of testosterone on adult male mouse hepatic FMO3 and TMAO levels7, only female mice were used for the present studies.
Gnotobiotic mice were fed steam-sterilized chow diet (#5010, Lab Diet; St Louis, MO) and supplemented with L-carnitine in the water (1.3% w/v, #0053, Chem Impex International)6. Conventional mice were fed ad libitum with one of the following irradiated diets, assigned randomly: Chow (TD. 2918, Envigo), TMAO supplemented diet (0.3 % w/w; TD. 120298, Envigo), γBB supplemented diet (1.3 % w/w; TD.120009, Envigo), or L-carnitine supplemented diet (1.3 % w/w; TD.1200010, Envigo). L-carnitine (#0053, Chem Impex International)6 , γBB (# 6249–56-5,BOC science)9 and TMAO (T0514, Sigma) were provided by the investigator to Envigo and included at the gram % reported of the active ingredient, not including the counter ion, or in the case of TMAO, the water molecules. For example, TMAO was provided as the dihydrate form to the diet; thus, 4.5 g of the dihydrate was added for every 1 kg of food to yield a 0.3% TMAO.
Gnotobiotic mouse colonization –
Bacteria for colonization were grown on tryptic soy blood agar plates (TSBA; Anaerobe Systems, Cat# AS-542) anaerobically for 24 to 48 h at 37 °C. Single colonies were picked and used to inoculate Mega Medium (3 mL) in prepared Hungate Tubes. Cultures were grown anaerobically for 18–24 h at 37 °C. At that time the bacterial culture was diluted 1:1 with glycerol (40%) in water (v:v) and stored at −80 °C. Prior to colonization bacterial cultures were thawed and pooled at a 1:1 volume in the indicated community combinations. Germ-free, C57BL/6, female, at least 10-week-old mice were colonized by oral gavage with ~0.2 mL of bacterial culture inside a biological safety cabinet. Mice were maintained on a sterilized diet (Lab Diet 5010) and supplemented with L-carnitine in the water (1.3% w/v, Chem-Impex Intl) for 2-weeks prior to tracer studies and in vivo thrombosis. At the time of sacrifice tissues were collected immediately, frozen, and stored at −80°C. Following colonization, the investigator handling the mice was not blinded from treatment groups to avoid cross contamination; however, the individual(s) responsible for data analysis or determining cessation of flow were blinded to treatment
Community Profiling by Sequencing –
Bacterial communities resulting from inoculation of germ-free animals were analyzed according to published methods.14,32 Briefly, DNA was isolated from flash frozen cecal contents of colonized mice with the Macherey-Nagel NucleoSpin Tissue kit according to manufactures instructions for bacterial DNA isolation. Total bacterial gDNA was sonicated in a water bath sonicator then cleaned and concentrated using a Macherey-Nagel PCR Purification Column before further processing. Concentrated DNA was blunted and poly-A tailed. A-tailed molecules were then ligated to the specified barcoded Illumina adapter sequences. Adapter bound DNA was size-selected on a 2% agarose gel by electrophoresis. Purified fragments of the desired size were PCR amplified using the Illumina primers and again purified over a Macherey-Nagel PCR Purification Column. Purified PCR products were given to the University of Wisconsin-Madison Biotechnology Center for quality assurance and library sequencing following the manufacturer’s protocols for the Illumina MiSeq platform. Raw FASTQ files were provide by the Biotechnology Center for analysis after sequencing. Sequences were demultiplexed by 7 bp barcodes present in the adapters. Barcodes required an exact match to be included in community analysis (sequences without a barcode match were excluded from the analysis). Sequences were aligned to the reference genomes of the 6 bacteria included in this study using Bowtie (v1.1.2) as a part of the COPROseq pipeline (https://github.com/DanishKhan14/aligner_RL). Only reads which mapped uniquely to the reference genomes were used for abundance analysis. Raw counts were normalized based on the genome size of each organism included in the analysis to account for genome size bias. The proportional representation of each organism in the analysis was determined by dividing its normalized counts within a sample by the total normalized counts for all organisms within that sample. Organisms used in the analysis include: Bacteroides caccae ATCC 43185, Bacteroides ovatus ATCC 8483, Bacteroides thetaiotaomicron VPI-5482, Collinsella aerofaciens ATCC 25986, Eubacterium rectale ATCC 33656, Emergencia timonensis SN18, and Proteus penneri ATCC 35198. We routinely confirmed that no significant contamination was observed within gnotobiotic colonization studies by showing that only a small proportion of reads from a sample do not map to the database. Specifically, we observe, on average with these samples, ~96% of reads map to the constructed database uniquely (i.e. were only located in one genome, one time). On average 1–2% of reads did not map to the database at all (likely from co-isolated host DNA), and another 1–2% were suppressed due to mapping to the database in more than one location (i.e. not a unique feature of a specific genome).
Gnotobiotic Community Composition Assessment by PCR –
Colonization was confirmed in a gnotobiotic mice unique PCR primers (Supplemental Table 5) were developed and utilized. Primers unique to individual members of the community were generated with aid of the following link: https://lfz.corefacility.ca/panseq/page/index.html. DNA was isolated from flash frozen cecal contents of colonized mice with the NucleoSpin Tissue kit according to manufactures instructions for bacterial DNA isolation. Isolated DNA was used in a PCR reaction with GoTaq Green Master Mix. PCR reactions were carried out in strip-tube with a 20 µl final volume as follows: 95 °C for 2 min; 95 °C for 30 s, annealing for 30 s, extension at 72 °C (x25); 72 °C for 5 min. Annealing temperature can be found in Supplemental Table 4.33,34 Completed reactions were run on a 2% gel and visualized using SYBRSafe. Expected product lengths can be found in Supplemental Table 5.
Gnotobiotic Tracer Studies –
Two weeks after colonization with the indicated gnotobiotic communities animals were orally gavaged with d3-L-carnitine (150 mM; Cambridge Isotopes) and d9-γBB (150 mM; synthesized as described)8 (150 µl) in a biological safety cabinet. Blood was collected from saphenous vein into a heparinized capillary tube at the indicated time points. Whole blood was centrifuged for the collection of plasma. Plasma was stored at −80 °C until analysis. Plasma levels of endogenous and stable isotope–labeled L-carnitine, γBB, and TMAO were determined by stable isotope dilution liquid chromatography–tandem mass spectrometry (LC-MS/MS) in positive multiple reaction monitoring (MRM) mode as previously described using a Shimadzu 8050 triple quadrupole mass spectrometer with ultra-HPLC interface.6,21 Laboratory personnel performing MS analyses were blinded to sample group allocation and clinical data during analysis.
LC/MS/MS quantitation of plasma L-carnitine, γBB and TMAO, and the corresponding deuterium labeled metabolites after oral gavage or microbial incubation –
Plasma levels of endogenous and stable isotope–labeled L-carnitine, γBB, and TMAO were determined by stable isotope dilution liquid chromatography–tandem mass spectrometry (LC-MS/MS) in positive multiple reaction monitoring (MRM) mode as previously described using a Shimadzu 8050 triple quadrupole mass spectrometer with ultra-HPLC interface as previously described.21 A Luna® 5 μm Silica column (150 × 2 mm, Phenomenex) was used to resolve analytes. The retention time of each analyte was determined by authentic standard. The parent to daughter transitions monitored were mass-to-charge ratio (m/z): m/z 165→63 for d3-L-carnitine; m/z 171→69 for d9-L-carnitine; m/z 149 →63 for d3-γBB; m/z 155→69 for d9-γBB; m/z 63 →47 for d3-TMA; m/z 69 →49 for d9-TMA; m/z 108 →60 for d4-choline; m/z 64 →47 for [13C3,15N]TMA. Laboratory personnel performing MS analyses were blinded to sample group allocation and clinical data during analysis.
Carotid artery FeCl3 injury thrombosis assay
After 2 weeks of supplementation in the diet and/or water as described, animals were anesthetized and subjected to common carotid artery injury, as previously described.26 Briefly, rhodamine 6G (100 µL; 0.5 mg/mL) was injected directly into the right jugular vein to label platelets. The left carotid artery was exposed and injured by placing a FeCl3-soaked filter paper for 1 minute. Thrombus formation was observed in real time using intravital fluorescence microscopy equipped with video recording (StreamPix 7-Multiple Camera DVR Software, NorPix Inc). Time to cessation of blood flow through clot formation for all studies was determined by visual inspection by two independent investigators. End points were set as cessation of blood flow for 30 seconds within 30 minutes. The investigator(s) preforming the assay were blinded to animal treatment group.
E. timonensis RNA-seq –
A starter culture of E. timonensis 71.3 was started by directly inoculating 50 µl of glycerol stock into 5 ml of sBHI media. The starter culture was grown anaerobically overnight for 18 hours at 37 ºC. The following day, 2 ml of starter culture was inoculated into 200 ml of sBHI and grown again anaerobically for ~ 18 hours. The culture was subsequently centrifuged for 5 min at 5,000 x g and the pellet resuspended into an equivalent volume of fresh sBHI media. The culture was subdivided into 40 ml aliquots and supplemented with either L-carnitine, γBB, or choline to a final concentration of 100 µM or vehicle alone. The substrate supplemented 40 ml cultures were further aliquoted into 13 ml cultures and incubated anaerobically at 37 ºC. At both 2 hr and 6 hr following substrate addition, 3 ml of culture was centrifuged in a microcentrifuge within an anaerobic chamber and the pellet resuspended in 1 ml of sBHI. The resuspended cells were then added to 2 ml of pre-reduced Qiagen RNA protect Bacterial reagent. The samples were vortexed for 5 seconds and incubated at room temperature for 5 min. The samples were centrifuged for 10 min at 5,000 x g, the supernatant was gently decanted, and pellets stored at −80 ºC until further use. Total RNA was isolated from the pellets using a Qiagen RNeasy Mini Kit following the manufacturer’s instructions. DNase I was incorporated into the RNA isolation protocol to assist in removal of genomic DNA. Isolated total RNA from samples of interest was checked for integrity and concentration using an Agilent Bioanalyzer and Nanodrop, respectively. Ribosomal RNA was depleted using an Illumina Ribo-Zero Kit following the manufacturer’s instructions, followed by purification of the samples by RNA Clean and Concentrator columns from Zymo Research. Depletion of rRNA was confirmed by loading an aliquot of the cleaned samples onto an Agilent Pico Chip. A ScriptSeq V2 Library preparation kit and ScriptSeq Indexes from Illumina was used for RNA-Seq library preparation with purification by Ampure XP beads. cDNA concentration was assessed using a Qubit High Sensitivity dsDNA assay and quality assessed via an Agilent High Sensitivity DNA chip. Illumina’s Denature and Dilute Library Guide was followed to prepare a 4 nM library pool for sequencing with PhiX. A custom library was made for BaseSpace by importing ScriptSeq primer sequences. Samples were sequenced using a High Output Kit (150 cycles) with paired end reads (2×75) and single indexing on an Illumina NextSeq 500 instrument. FASTQ files were filtered and sequences aligned to a previously created genome sequence of the E. timonensis isolate 71.3 using Bowtie2.35 To identify differentially expressed genes, data were analyzed in R using DESeq236 from the Bioconductor package. Comparisons of E. timonensis gene expression in the presence of each trimethylamine containing substrate to media only controls enabled fold-change calculations. Plots of these data were created in JMP from SAS.
Cloning and heterologous expression of gbu genes in E. coli BL21 Star (DE3) –
Genes encoding the six different open-reading frames of the E. timonensis gbu gene cluster were codon optimized for expression in the non-native host E. coli. Each codon optimized open-reading frame was gene synthesized and cloned into one or more pET or pETDuet vectors (Novagen via Merck KGaA, Darmstadt, Germany) by Genscript (Piscataway, NJ, USA) using restriction enzymes compatible with each vector’s multiple cloning site. A summary of the parent plasmids and those created for this study are available in Supplemental Table 6. Plasmids were transformed into chemically competent recA- E. coli TOP10 cells (Invitrogen, Waltham, MA, USA) for maintenance and propagation. For heterologous expression studies, chemically competent OneShot BL21 Star (DE3) (Invitrogen, Waltham, MA, USA) cells were transformed with one to three plasmids in order to heterologously express all combinations of the six ORFs in the gbu gene cluster. Plasmid transformation schemes were designed to maintain compatible origins of replication and antibiotic selection markers. Transformations were conducted following the manufacturer’s instructions with the following deviation: following heat shock at 42 ºC, cells were incubated for 2 h at 200 rpm. Successful transformants were selected on Luria-Bertani (LB) agar medium infused with one or more antibiotics (carbenicillin (50 µg/ml); kanamycin (50 µg/ml); chloramphenicol (34 µg/ml); spectinomycin (50 µg/ml)) following aerobic incubation at 33ºC for 24 h. To determine which combinations of gbu ORFs enabled production of TMA from γBB, freshly transformed colonies were picked and grown overnight in LB media with antibiotic selection at 33ºC and shaking at 250 rpm. The turbidity of overnight cultures was determined, and cells were inoculated into 1 or 3 ml of Magic Media (Invitrogen, Waltham, MA, USA) to a final OD600 = 0.05. d9-γBB was added to the cultures to a final concentration of 100 µM. Cultures were aerobically incubated with shaking (250 rpm) for 48 hours at 18ºC. Following incubation, 150 µl of each culture was transferred to v-bottom 96-well plates, treated with formic acid to a final concentration of 0.1%, and centrifuged at 4,000 x g for 12 minutes, transferring 100 µl of supernatant to deep-well 96-well plates for storage at −80ºC prior to analysis by LC-MS/MS.
Functional annotation –
The functional annotation of the protein sequences from the gbu cluster was performed using the EMBL-EBI bioinformatic tool Hmmer3 phmmer (version 3.2.1) (https://www.ebi.ac.uk/Tools/pfa/hmmer3_phmmer/) with the UniprotKB protein database.37,38 The amino acid sequence for each of the six proteins in the cluster (GbuA, GbuB, GbuC, GbuD, GbuE, and GbuF) was input into the webpage form of the server, the UniprotKB protein database was selected for search, and the rest of the search parameters were used with default values (significance E-values[sequence] = 0.01, significance E-values[hit] = 0.03, gap penalties[open] = 0.02, gap penalties[extend] = 0.4, gap penalties[substitution scoring matrix] = BLOSUM62, filters = true, expectation value threshold = 0.01). The search returns a list of matched proteins, and for each hit it reports the annotation score for the full sequence, an E-value, a bias value, and the entry to the UniprotKB protein database.
GbuA homolog identification –
gbuA homologs were identified by querying E. timonensis gbuA DNA coding and primary amino acid sequence using the NCBI basic local alignment search tool (BLAST)along with protein – protein BLAST analysis on the publically available JGI IMG webserver (which includes the entirety of genomes deposited as a part of the HMP (human microbiome project)). The composition and structure of the gbu operons of organisms with gbuA sequences with greater than 75% sequence identity to E. timonensis SN18 were investigated further employing the MultiGeneBlast (http://multigeneblast.sourceforge.net/) Using the E.timonensis SN18 gene cluster (gbuABCDEF) the gene neighborhoods of predictive hits were assessed to verify the identity as a putative gbuA homolog.
As an independent approach, we separately screened gbuA homologues using metagenomics data. For these analyses we screened a custom human-gut microbiome-based MAGs database (>30k genomes) we created. Briefly, we downloaded MAGs (n=>300,000) from two recently published studies.39,40 In order to achieve the species level taxonomic resolution, we also added whole genome sequences of 1520 cultivated human gut bacteria.41 We then clustered all the genomes at 99% identity cutoff using iRep (https://github.com/christophertbrown/iRep). gbuA gene homologues were then screened against the custom MAG database using abricate (https://github.com/tseemann/abricate; v1.0.1). In order to create a customized database using abricate, we used the instructions provided by the author on the github repository under the section “Making your own database”.
APPROACH study design, quantification of TMAO, gbuA, Cai, and E. timonensis in human feces –
The APPROACH study (Animal and Plant PROtein And Cardiovascular Health) was an NIH funded dietary intervention study with a factorial design to independently examine the impact of both dietary protein source and saturated fat on lipoprotein composition changes. Healthy subjects (n=113, 44 male, 69 females) 30–65 years old, who were in overall good health without evidence of chronic diseases or significant comorbidities were eligible to enroll in the study. Subjects had to agree to abstain from alcohol and dietary supplements during the study, and be willing to consume all study foods as instructed. The study has previously been described 21,42,43, and more detailed characterization of the study design, and diet composition, are found in Supplemental Table 7 and its associated legend, and within Clinicaltrials.gov NCT01427855. Briefly, APPROACH assigned healthy participants to consume isocaloric diets prepared in a metabolic kitchen that differed in protein source (run-in diet, red meat, white meat or non-meat diets) and saturated fat content (low versus high) in factorial design. Because changes in dietary saturated fat resulted in no differences in TMAO levels21, or any of its dietary nutrient precursors including γBB and carnitine21, for the present study, all analyses focused exclusively on examination of changes in dietary protein source (Supplemental Table 7) on gbuA gene content in human feces. At the start of the study, a standardized baseline run-in diet (designed to reflect a typical American diet) was provided to all participants (2 weeks) prior to initiation (in randomized order) to each of the other isocaloric intervention diets. The intervention diets used differed in protein source and were called the Red meat, White meat, or Non-meat (plant based, except for addition of egg white protein) diet, as previously described.21,42,43 Participants were assigned to the intervention diets in random order, each lasting 4 weeks and separated by at least a 2 week washout period during which participants returned to their habitual diets. When analyzing changes during transitions from one diet to another, changes, or deltas, were calculated as the measure from the second diet minus the measure from the first (after minus before the transition). Stool and plasma were collected in two separate clinic visits in the last week of each dietary intervention. The vast majority of subjects enrolled in the APPROACH study were able to provide fecal samples at all visits. TMAO was quantitated in plasma, as previously described.21 TMAO is reported as the mean of both visits, though results from the visits in the last week of each intervention diet were highly correlated.21 Fecal samples were prepared for shotgun metagenomic sequencing using the previously reported BGI methods workflow.44 SolexaQA45 was used to trim bases with Phred score < 20 and remove reads < 45bp. SOAPAligner2 was then used to map high-quality reads to the human genome (build hg19, Genome Reference Consortium Human Reference 37), and only unmapped, high-quality reads were used for metagenomic analysis (mean 11 million reads per sample).46 Five gbuA homologs were identified based on sequence similarity to Emergencia timonensis SN18 gbuA. High-quality reads were mapped to the six gbuA sequences using Bowtie2 with “very-sensitive-local” parameters. Multimapping was not allowed, and read counts were summed across all six gbuA homologs. Gene abundance was expressed in counts per million reads per kilobase (RPKM) units using the mean gene length.
E. timonensis abundance in metagenomics data was assessed as follows. Shotgun microbiome data was quality filtered using nesoni pipeline (https://github.com/Victorian-Bioinformatics-Consortium/nesoni). Quality trimmed data was mapped on a custom genome database using BBMap (https://jgi.doe.gov/data-and-tools/bbtools/; v38.90) using MAGs (n=>300,000) downloaded from two recently published studies.39,40 In order to achieve the species level taxonomic resolution, we also added whole genome sequences of 1520 cultivated human gut bacteria.41 We then clustered all the genomes at 99% identity cutoff using iRep (https://github.com/christophertbrown/iRep). Species level abundance matrix was further used for differential abundance analysis in R. In order to select a method for differential abundance analysis we benchmarked tests specifically designed to handle sequence data e.g. DESeq2, EdgeR, MetagenomeSeq, ALDEx2, baySeq, CLR/ALR, and White’s non-parametric t-test. Based on false discovery rate (FDR), area under the curve (AUC) and empirical power (Power) values we finalized White’s non-parametric t-test for differential abundance analysis.
16S analysis –
16S rRNA gene sequencing files can be found under BioProject PRJNA498128. Demultiplexed fastq files without non-biological nucleotides were processed using Divisive Amplicon Denoising Algorithm (DADA, v1.16) pipeline.47 The output of the dada2 pipeline (feature table of amplicon sequence variants (an ASV table)) was processed for alpha and beta diversity analysis using phyloseq,48 and microbiomeSeq (http://www.github.com/umerijaz/microbiomeSeq) packages in R. Alpha diversity estimates were measured within group categories using estimate_richness function of the phyloseq package (v.3.13).48 Multidimensional scaling (MDS, also known as principal coordinate analysis; PCoA) was performed using Bray-Curtis dissimilarity matrix.49 between groups and visualized by using ggplot2 package.50 We assessed the statistical significance (P < 0.05) throughout and whenever necessary, we adjusted P-values for multiple comparisons according to the Benjamini and Hochberg method to control False Discovery Rate51 while performing multiple testing on taxa abundance according to sample categories. We performed an analysis of variance (ANOVA) among sample categories while measuring the of α-diversity measures using plot_anova_diversity function in microbiomeSeq package (http://www.github.com/umerijaz/microbiomeSeq; 0.1). Permutational multivariate analysis of variance (PERMANOVA) with 999 permutations was performed on all principal coordinates obtained during PCoA with the ordination function of the microbiomeSeq package.
Data and Statistical Analysis –
All graphical and statistical analysis was preformed using Microsoft Excel v2013, GraphPad Prism 9, R (v3.6.3), or JMP 14. No statistical methods were used to pre-determine sample sizes for animal studies. Sample sizes used were similar to those reported for similar types of studies in previous publications (Ref 6, 11). Significant differences between experimental groups were determined by an unpaired two-tailed Student’s t-test or a one-way ANOVA (Kruskal-Wallis) with Dunn’s multiple comparisons post-hoc test. For all analyses, p < 0.05 was considered statistically significant. Odd ratios (OR) for CVD, CAD and PAD and Hazard ratio (HR) for MACE at 3-year follow up and corresponding 95% confidence intervals (CI) were estimated using both univariable (unadjusted) and multivariable (adjusted) generalized linear models and Cox models, respectively. Kaplan–Meier analysis with Cox proportional hazards regression was used for time-to-event analysis to determine HR and 95% CI for MACE. Adjustments were made for individual traditional cardiac risk factors in the Framingham risk score including age, sex, LDL cholesterol, HDL cholesterol, blood pressure, hypertension treatment, diabetes, and smoking, and high-sensitivity C-reactive protein (CRP) level, kidney function (creatinine) and body mass index (BMI). Generalized linear models and survival analyses were preformed using R 3.6.3 (Vienna, Austria, 2020). P values < 0.05 were considered statistically significant. Rho values of Spearman’s rank correlation coefficient were calculated using Prism 9.
Extended Data
Extended Data Fig. 1. Emergencia timonensis enables anaerobic metabolism of L-carnitine to TMA, via the intermediate γBB, in co-culture with bacterial species containing the cai operon.
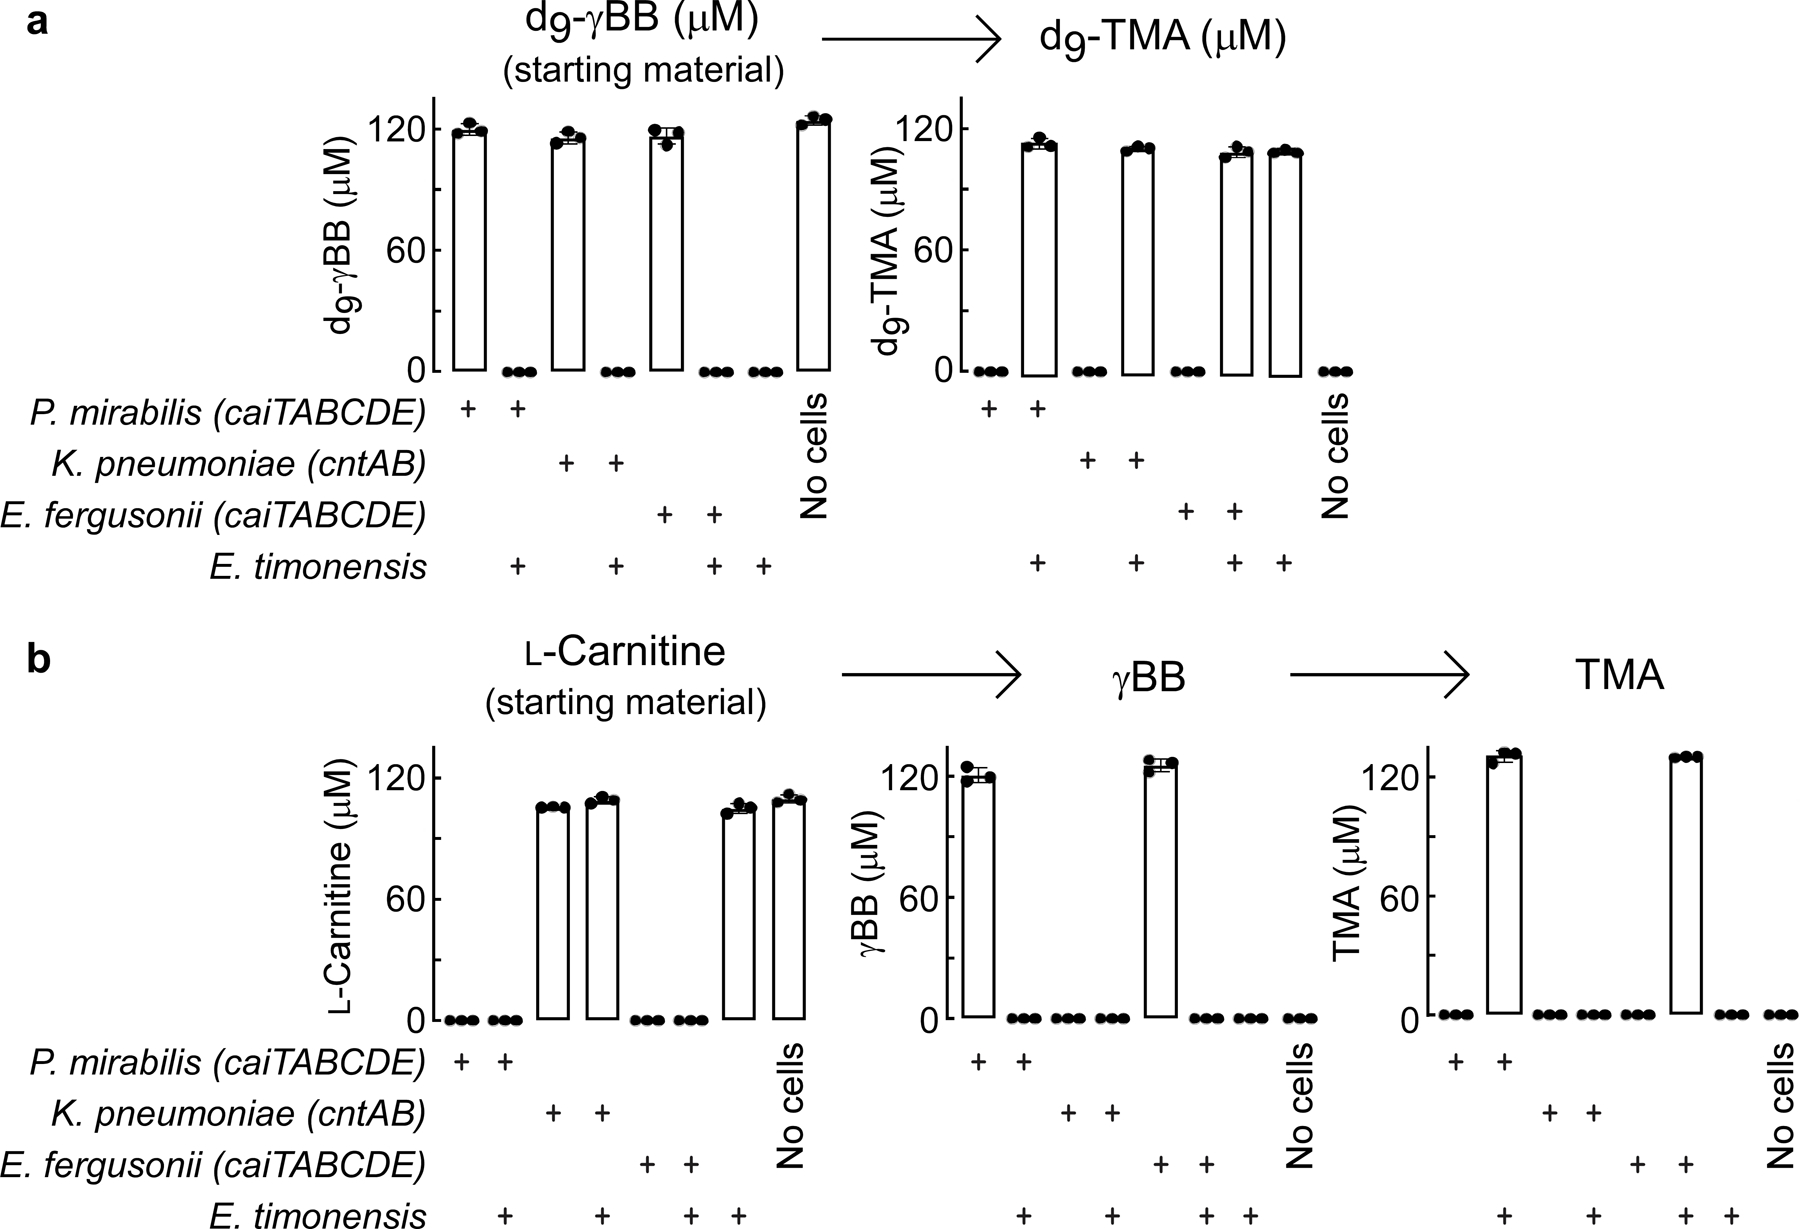
(a) Quantification of d9-γBB to TMA pathway metabolites from 22 hour anaerobic mono- or co-cultures of representative bacterial species encoding either the caiTABCDE operon (P. mirabilis), the cntAB operon (K. pneumoniae) or both operons (E. fergusonii) and the strict anaerobe E. timonensis.
(b) Quantification of L-carnitine to TMA pathway metabolites (including γBB intermediate) in the same anaerobic mono- and co-cultures detailed in (a).
All biological replicates (n=3) are shown. Bar height represents the mean, error bars are ± one standard deviation from the mean.
Extended Data Fig. 2. Relative abundance and functional metabolism of Core community microbes, P. penneri, and E. timonensis utilized in gnotobiotic mouse model studies.
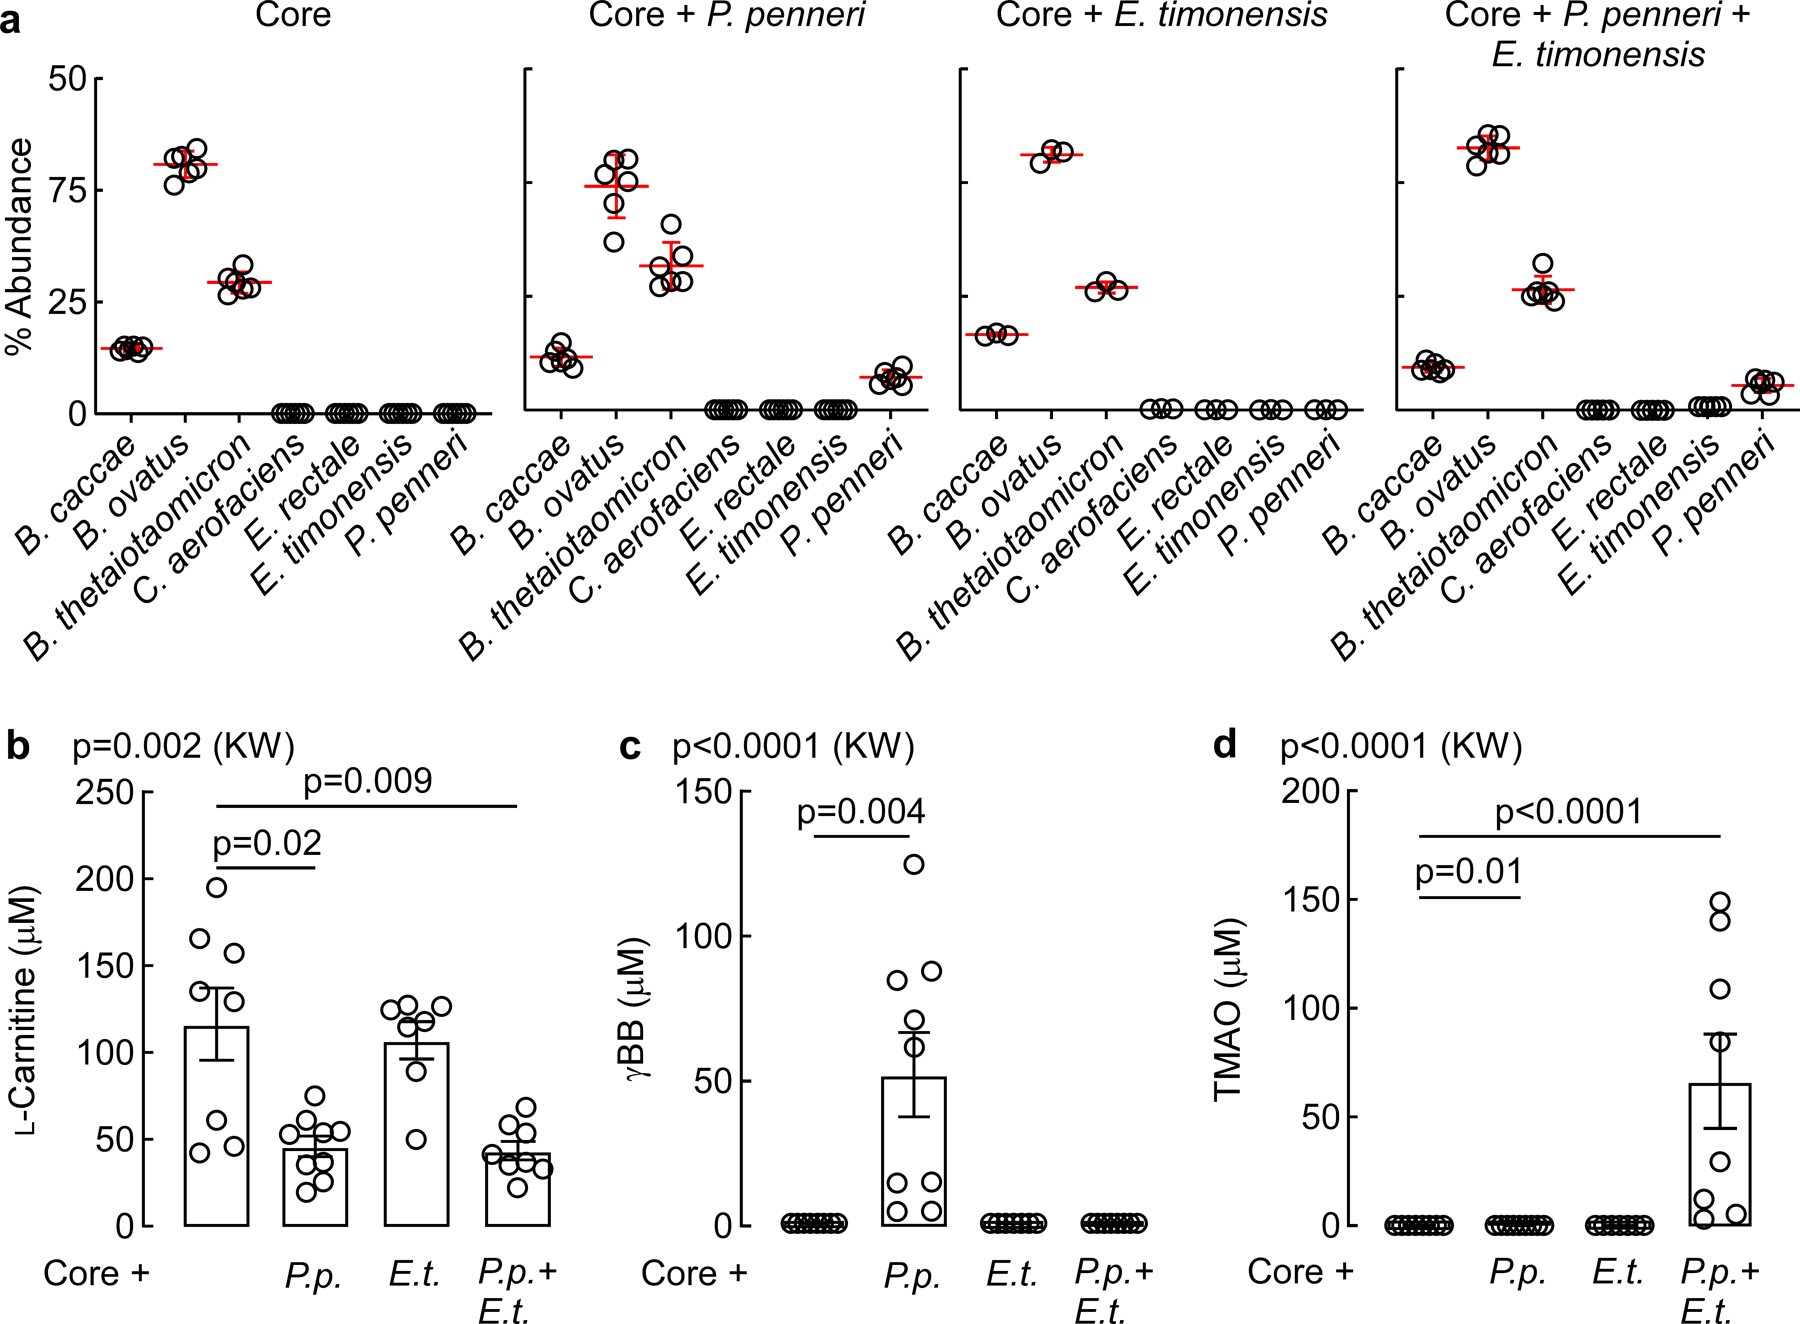
(a) Relative abundance of community members in each of the four synthetic communities used to colonize germ-free mice for tracer studies. n=6 (Core, Core+P.penneri, and Core+P.penneri+E.timonensis), n=3 (Core+E.timonensis).
(b) Circulating plasma levels of L-carnitine in mice following in vivo thrombosis. For panels b-d: n=8 (Core), n=9 (Core+P.p.), n=37 (Core+E.t.), n=8 (Core+P.p.+E.t.).
(c) Circulating plasma levels of γBB in mice following in vivo thrombosis.
(d) Circulating plasma levels of TMAO in mice following in vivo thrombosis.
All data points are shown. Bar height represents the mean, error bars are ± one standard deviation from the mean. For b-d, significance was determined by Kruskal-Walis one-way ANOVA with Dunn’s post-hoc test for multiple comparisons.
Extended Data Fig. 3. Schematic of the proposed function for each gbu gene cluster encoded enzyme and multiple sequence alignment of acyl-CoA dehydrogenases to GbuA.
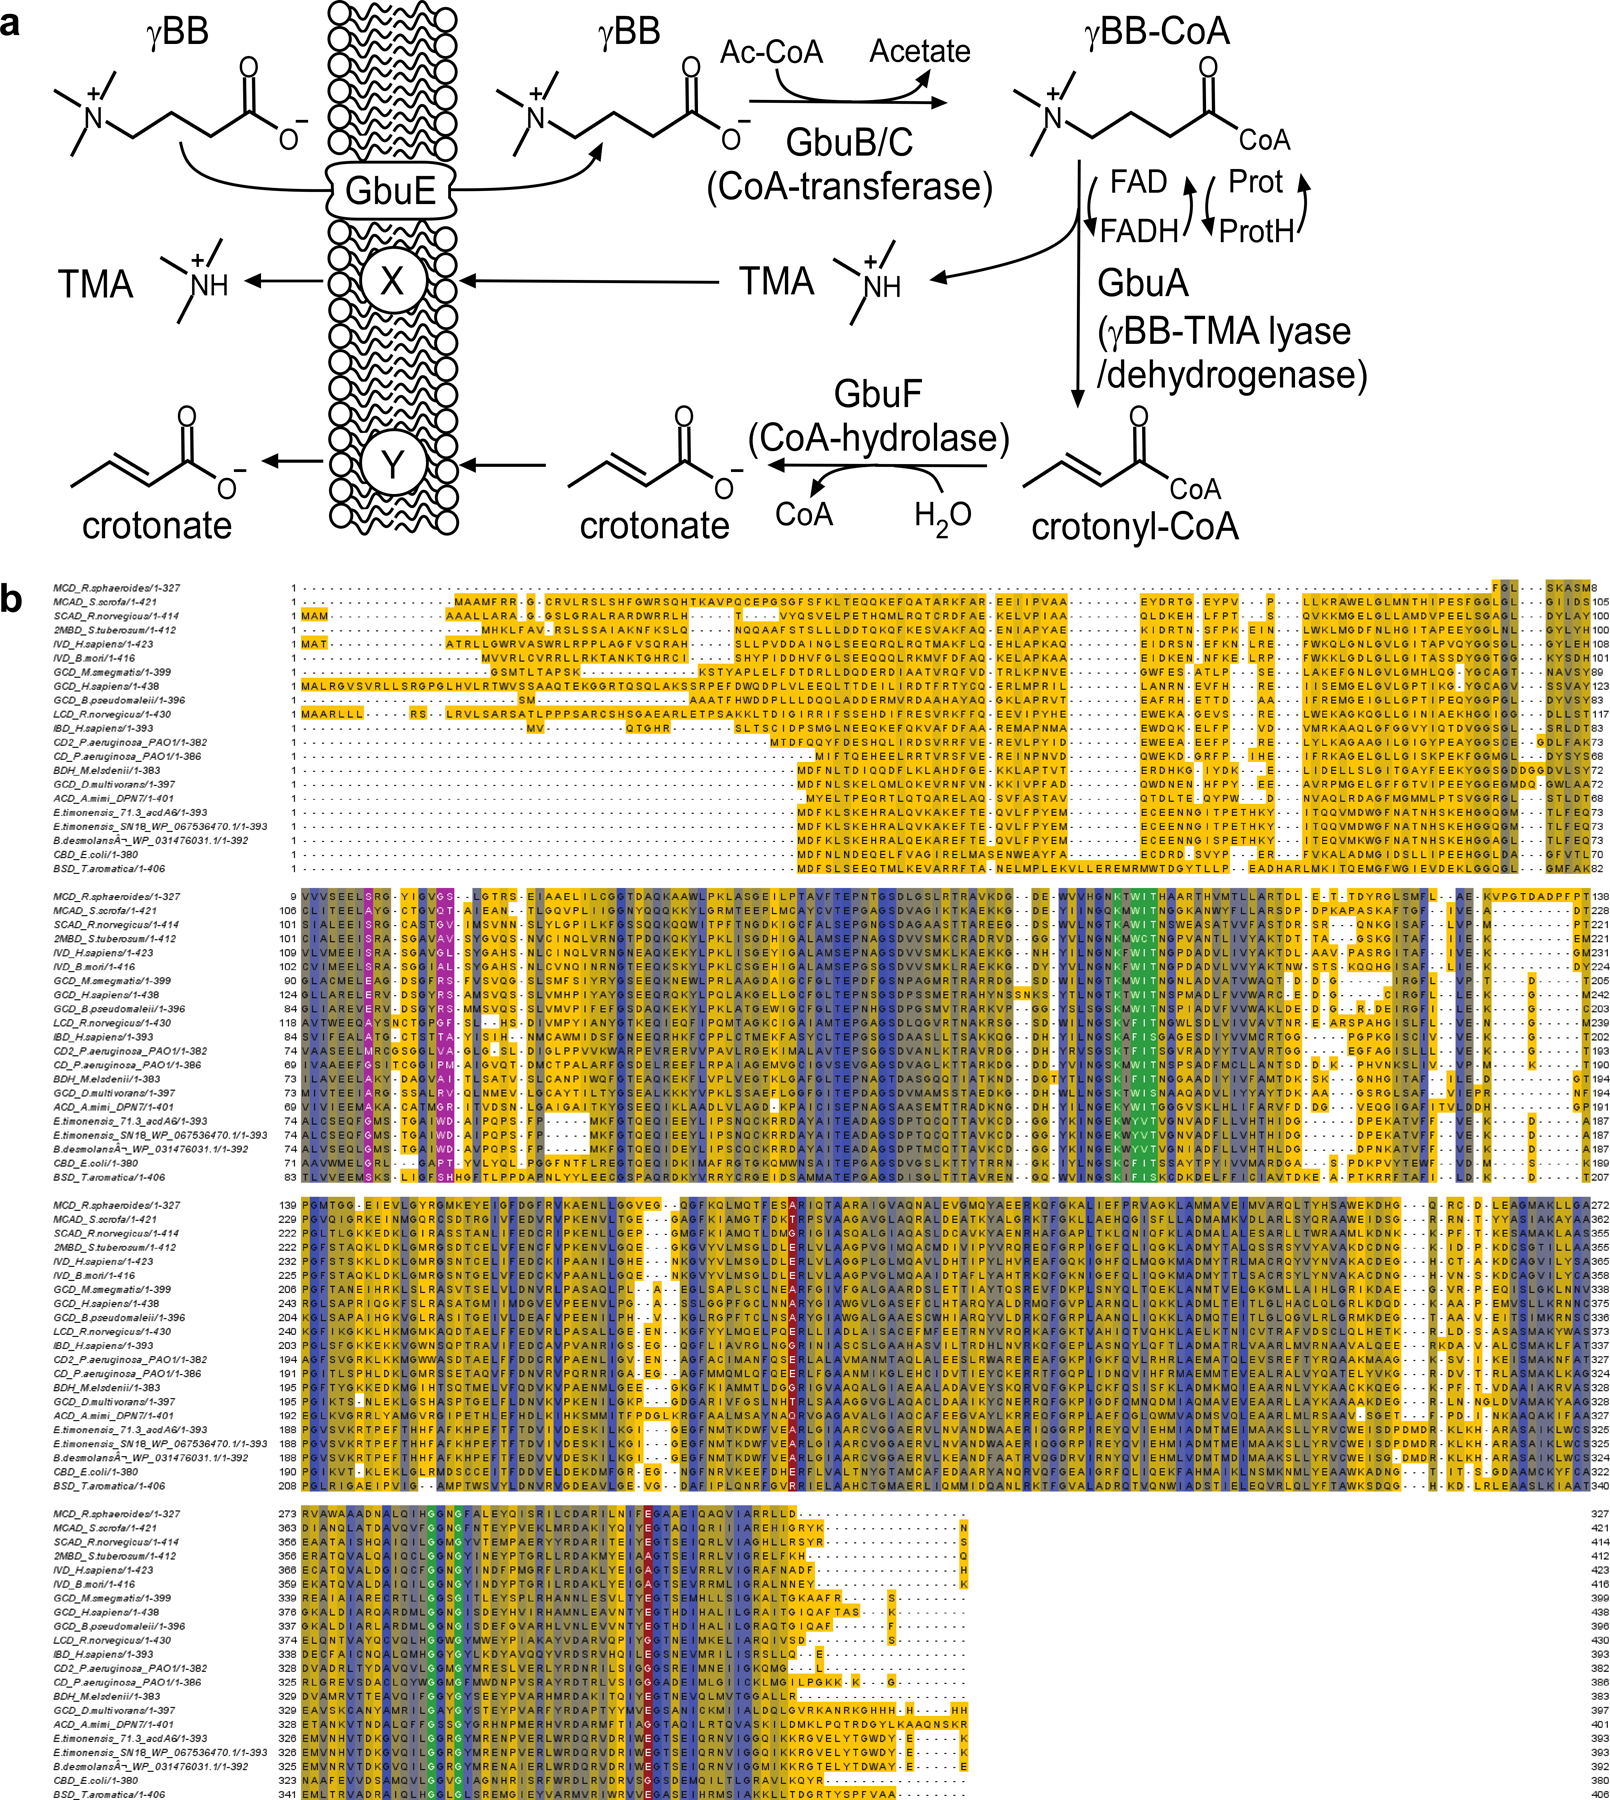
(a) Scheme depicting functional components of the gbu gene cluster in the overall transformation of γBB into TMA and crotonate. Proposed functions of the indicated genes were based both on sequence homology and bioinformatics, as well as combinatorial cloning and functional studies where analytes with m/z ratios appropriate for the predicted intermediates shown were detected in cell lysate. See Supplemental Results.
(b) Multiple Amino Acid Sequence Alignment of 18 biochemically characterized acyl-CoA dehydrogenases to GbuA from two isolates of E. timonensis (SN18 and isolate 71.3) and Agathobaculum desmolans. Amino acidsare highlighted by level of conservation with residues highlighted yellow least conserved and those in blue mostconserved. Amino acids highlighted in green, red, and magenta highlight conserved residues responsible forpotential flavin adenine nucleotide (FAD) binding sites, a key acyl-CoA dehydrogenase active site glutamate,and carboxylate binding, respectively. The multiple sequence alignment was created using the EMBL Clustal Omega program (https://www.ebi.ac.uk/Tools/msa/clustalo/) and the resulting alignment was visualized andcolored-coded using the Jalview Desktop application (http://www.jalview.org/taxonomy/term/6).
Extended Data Fig. 4. gbu gene cluster expression in E. coli and predicted presence in additional bacteria.
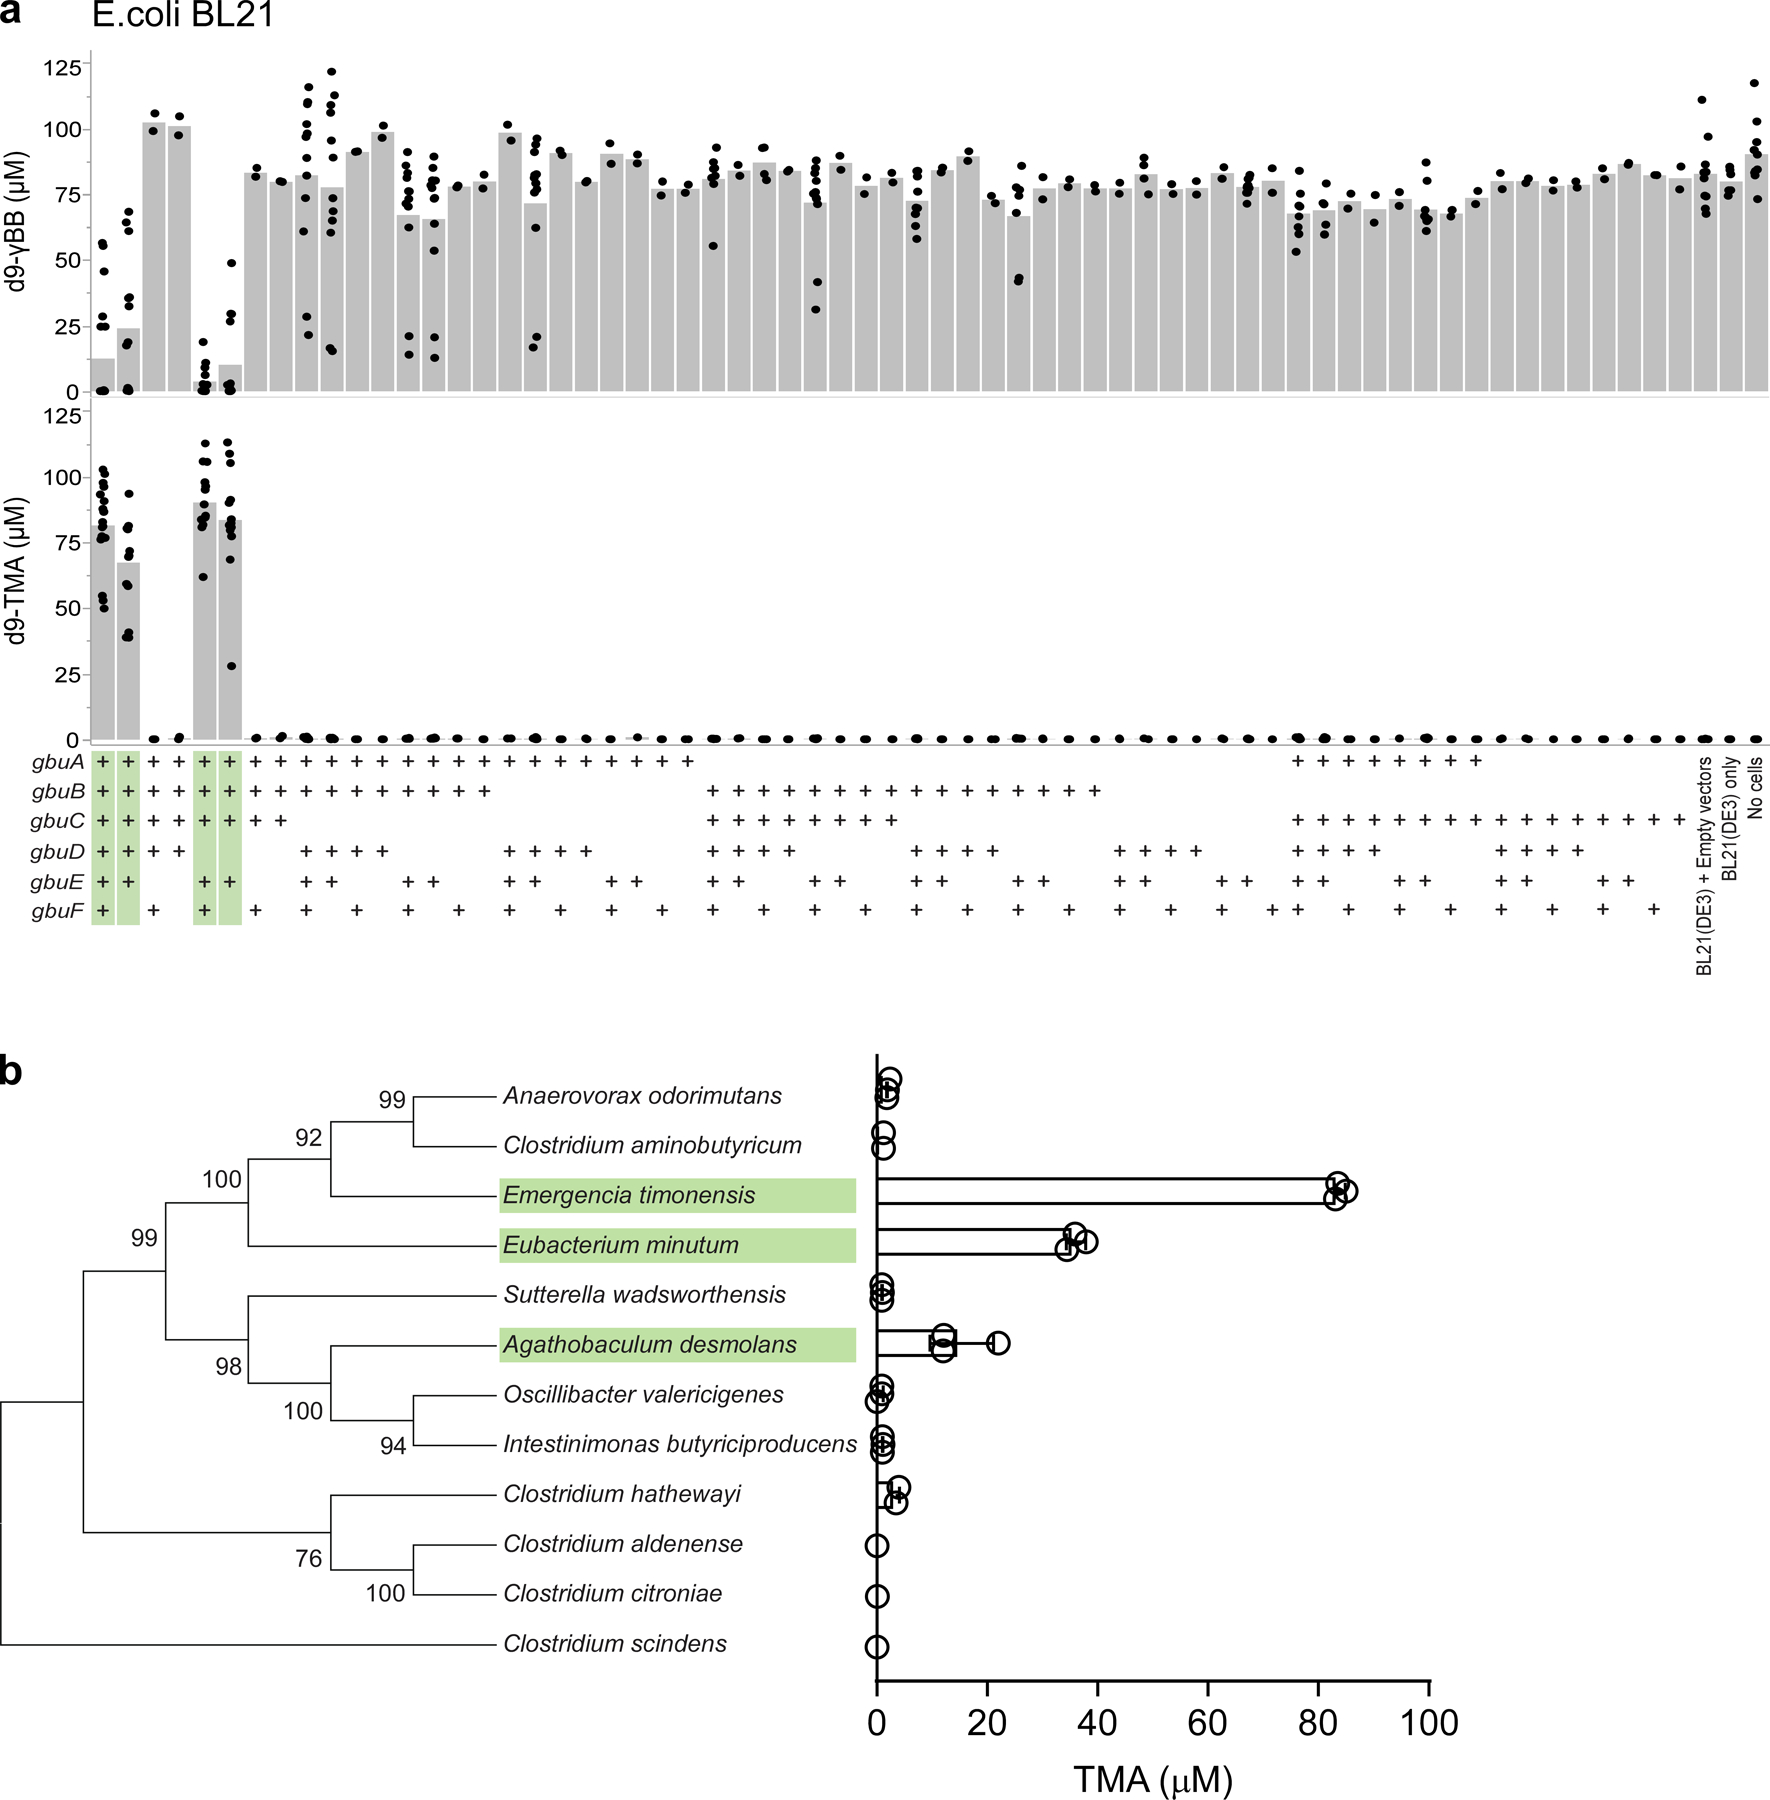
(a) Heterologous expression of one or more recombinant, codon-optimized E. timonensis gbu gene cluster open reading frames in the E. coli host strain BL21 Star (DE3). Cells were aerobically cultivated in Magic Media and levels of the metabolites d9-γBB and d9-TMA were determined by LC-MS/MS as described in the Methods. (+) symbols denote the presence of the recombinant ORF of interest on a plasmid. Bar height represents the average metabolite concentration from at least two biological replicates and each dot represents a biological replicate sample.
(b) Phylogenetic tree of twelve bacteria and their associated in vitro anaerobic γBB → TMA activity (average TMA from three biological replicates error bars are ± one standard deviation from the mean). The tree was built based on SILVA alignment of full length 16S rRNA gene sequences and constructed by the Tamura-Nei maximum likelihood method. Numbers at nodes are bootstrap values derived from 1000 bootstrap replications. Evolutionary analyses were conducted in MEGA7. Organism names highlighted in green were bioinformatically predicted to contain gbu gene cluster.
Indicated in green are the gene groups that when expressed allow for the conversion of γBB → TMA.
Extended Data Fig. 5. Fecal gbuA trends downward after transition from a red meat to non-meat or white meat diet.
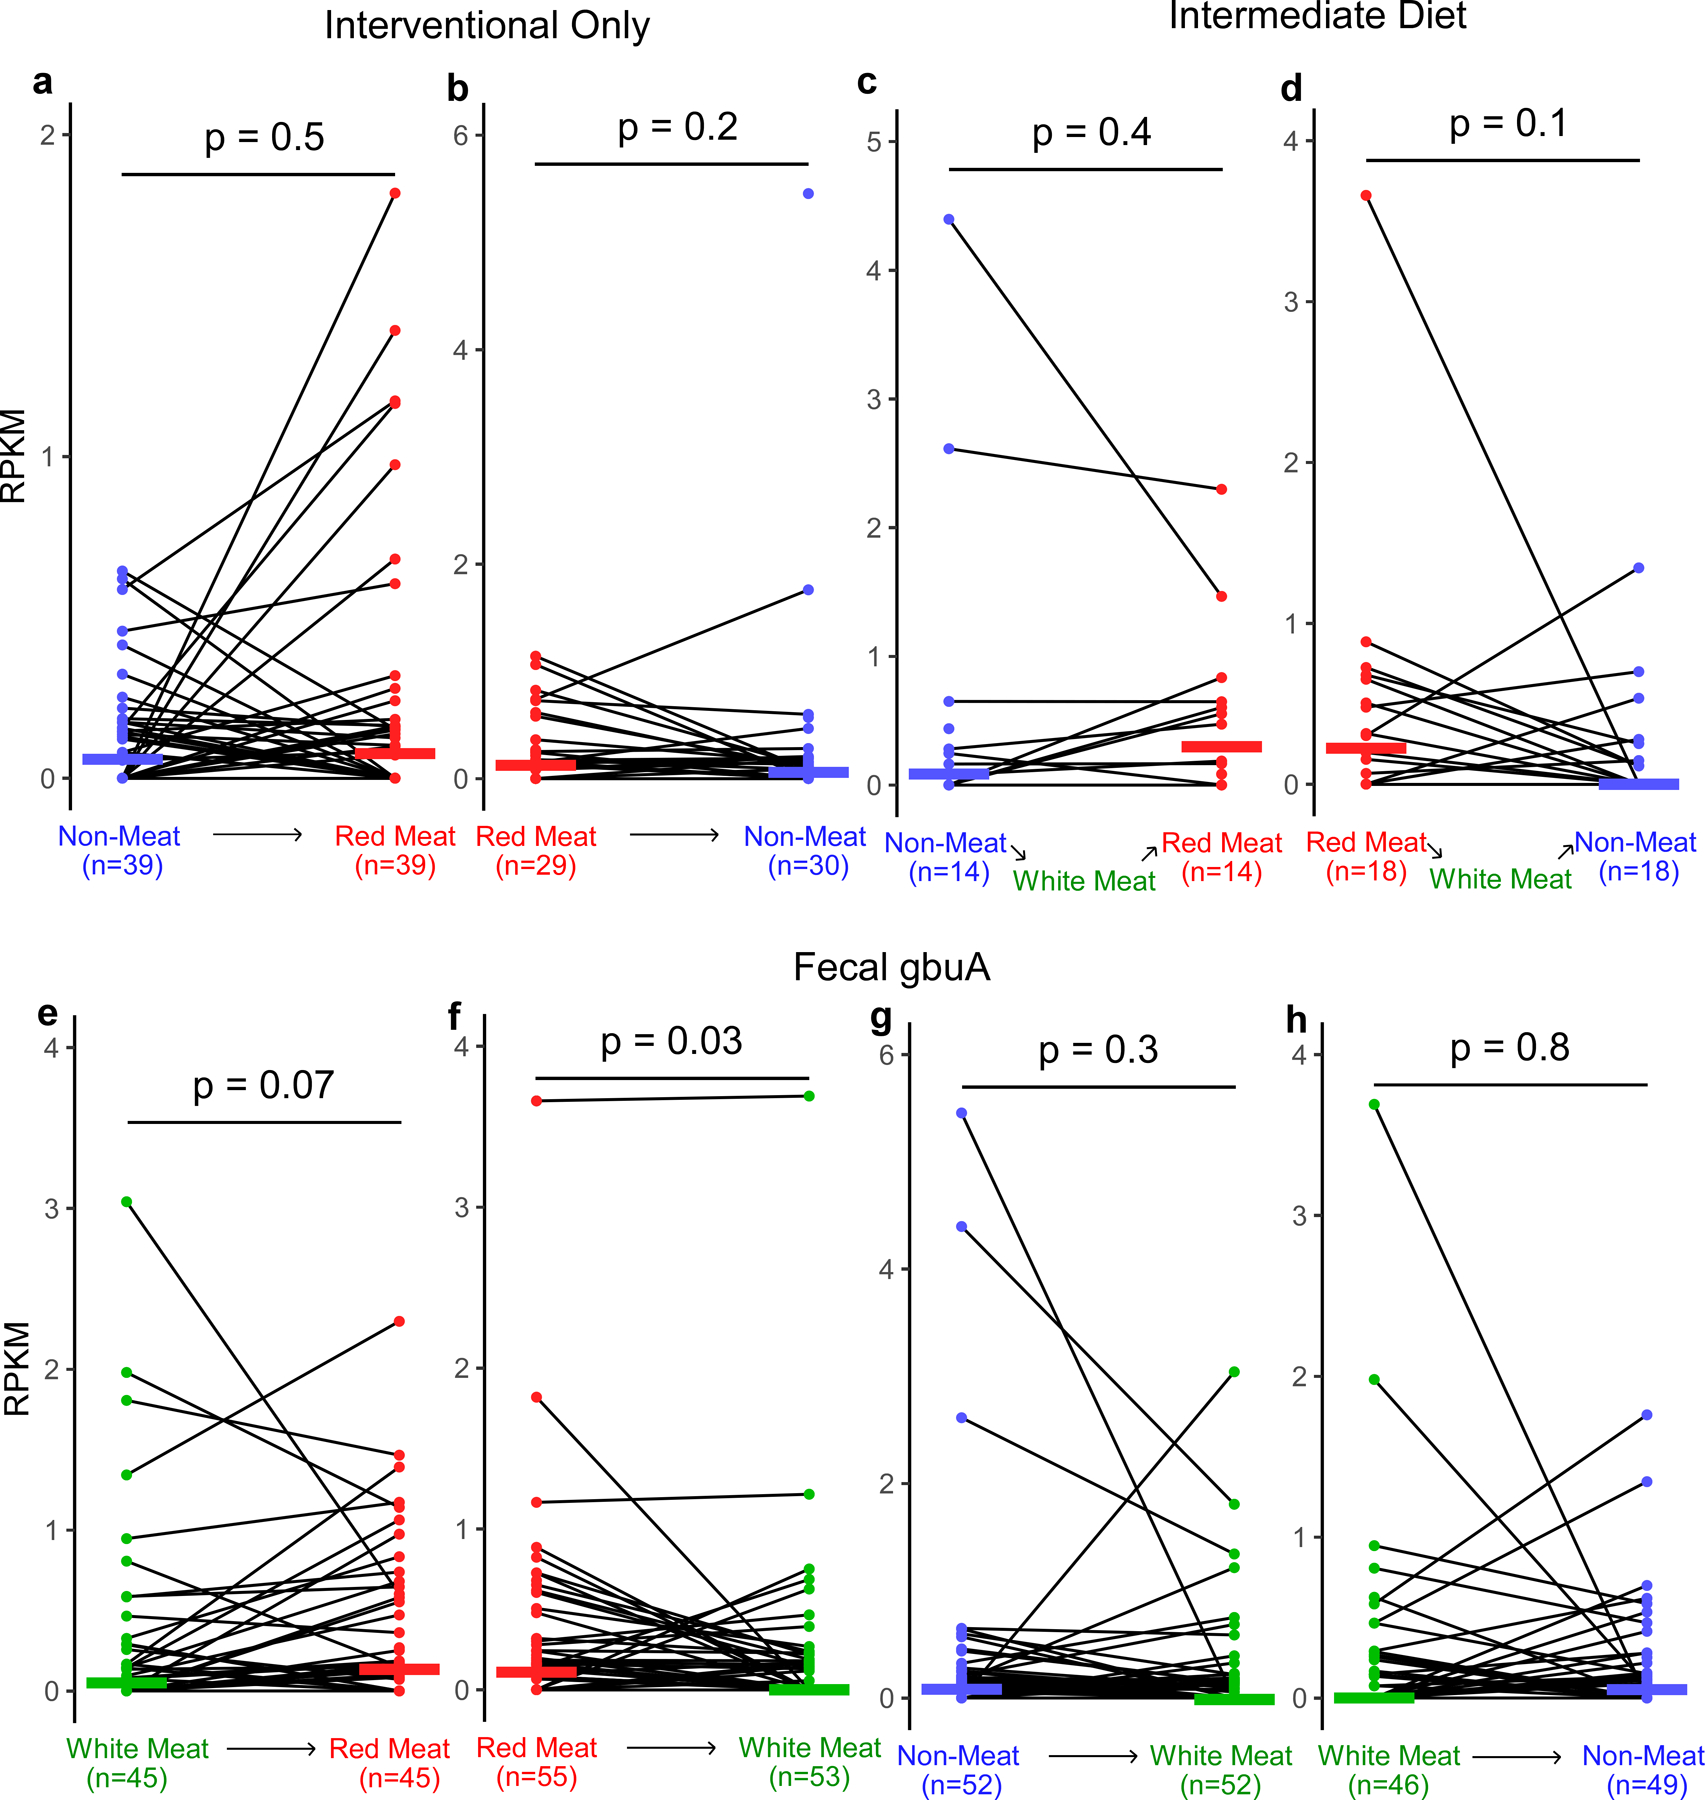
Using samples from the APPROACH study we assessed if gbuA abundance is regulated by diet. Participants were randomly assigned to consume red meat (highest L-carnitine containing diet), white meat, and non-meat (lowest L-carnitine containing diet) diets in one of six orders, with a washout period of at least two weeks between each diet intervention, as described under Methods. The two-week washout periods are expected to reduce the effect of white meat that occur between red meat and non-meat. To test the effect of this intermediate white meat diet on gbuA abundance, we separated those participants with and without an intermediate white meat diet. Using shotgun metagenomic sequencing gbuA abundance was calculated. Fecal gbuA decreased after transitioning from red meat to white meat, while no such change was detected after transition from white meat to non-meat.
(a) Fecal gbuA abundance (RPKM) in subjects while consuming a non-meat diet and after transition to a red meat diet without an intervening white meat diet.
(b) Fecal gbuA abundance (RPKM) in subjects while consuming a red-meat diet and after transition to a non-meat diet without an intervening white meat diet.
(c) Fecal gbuA abundance (RPKM) in subjects while consuming a non-meat diet and after transition to a red meat diet with an intervening white meat diet.
(d) Fecal gbuA abundance (RPKM) in subjects while consuming a red-meat diet and after transition to a non-meat diet with an intervening white meat diet.
(e) Fecal gbuA abundance (RPKM) in subjects consuming a white meat diet and after transition to a red meat diet regardless of intermediary diet consumption.
(f) Fecal gbuA abundance (RPKM) in subjects while consuming a red meat diet and after transition to a white meat diet regardless of intermediary diet consumption.
(g) Fecal gbuA abundance (RPKM) in subjects while consuming a non-meat diet and after transition to a white meat diet regardless of intermediary diet consumption.
(h) Fecal gbuA abundance (RPKM) in subjects while consuming a white meat diet and after transition to a non-meat diet regardless of intermediary diet consumption.
Median lines are shown and P values were determined by two-way Wilcox test.
Extended Data Fig. 6. Fecal gbuA abundance in all diet order groups.
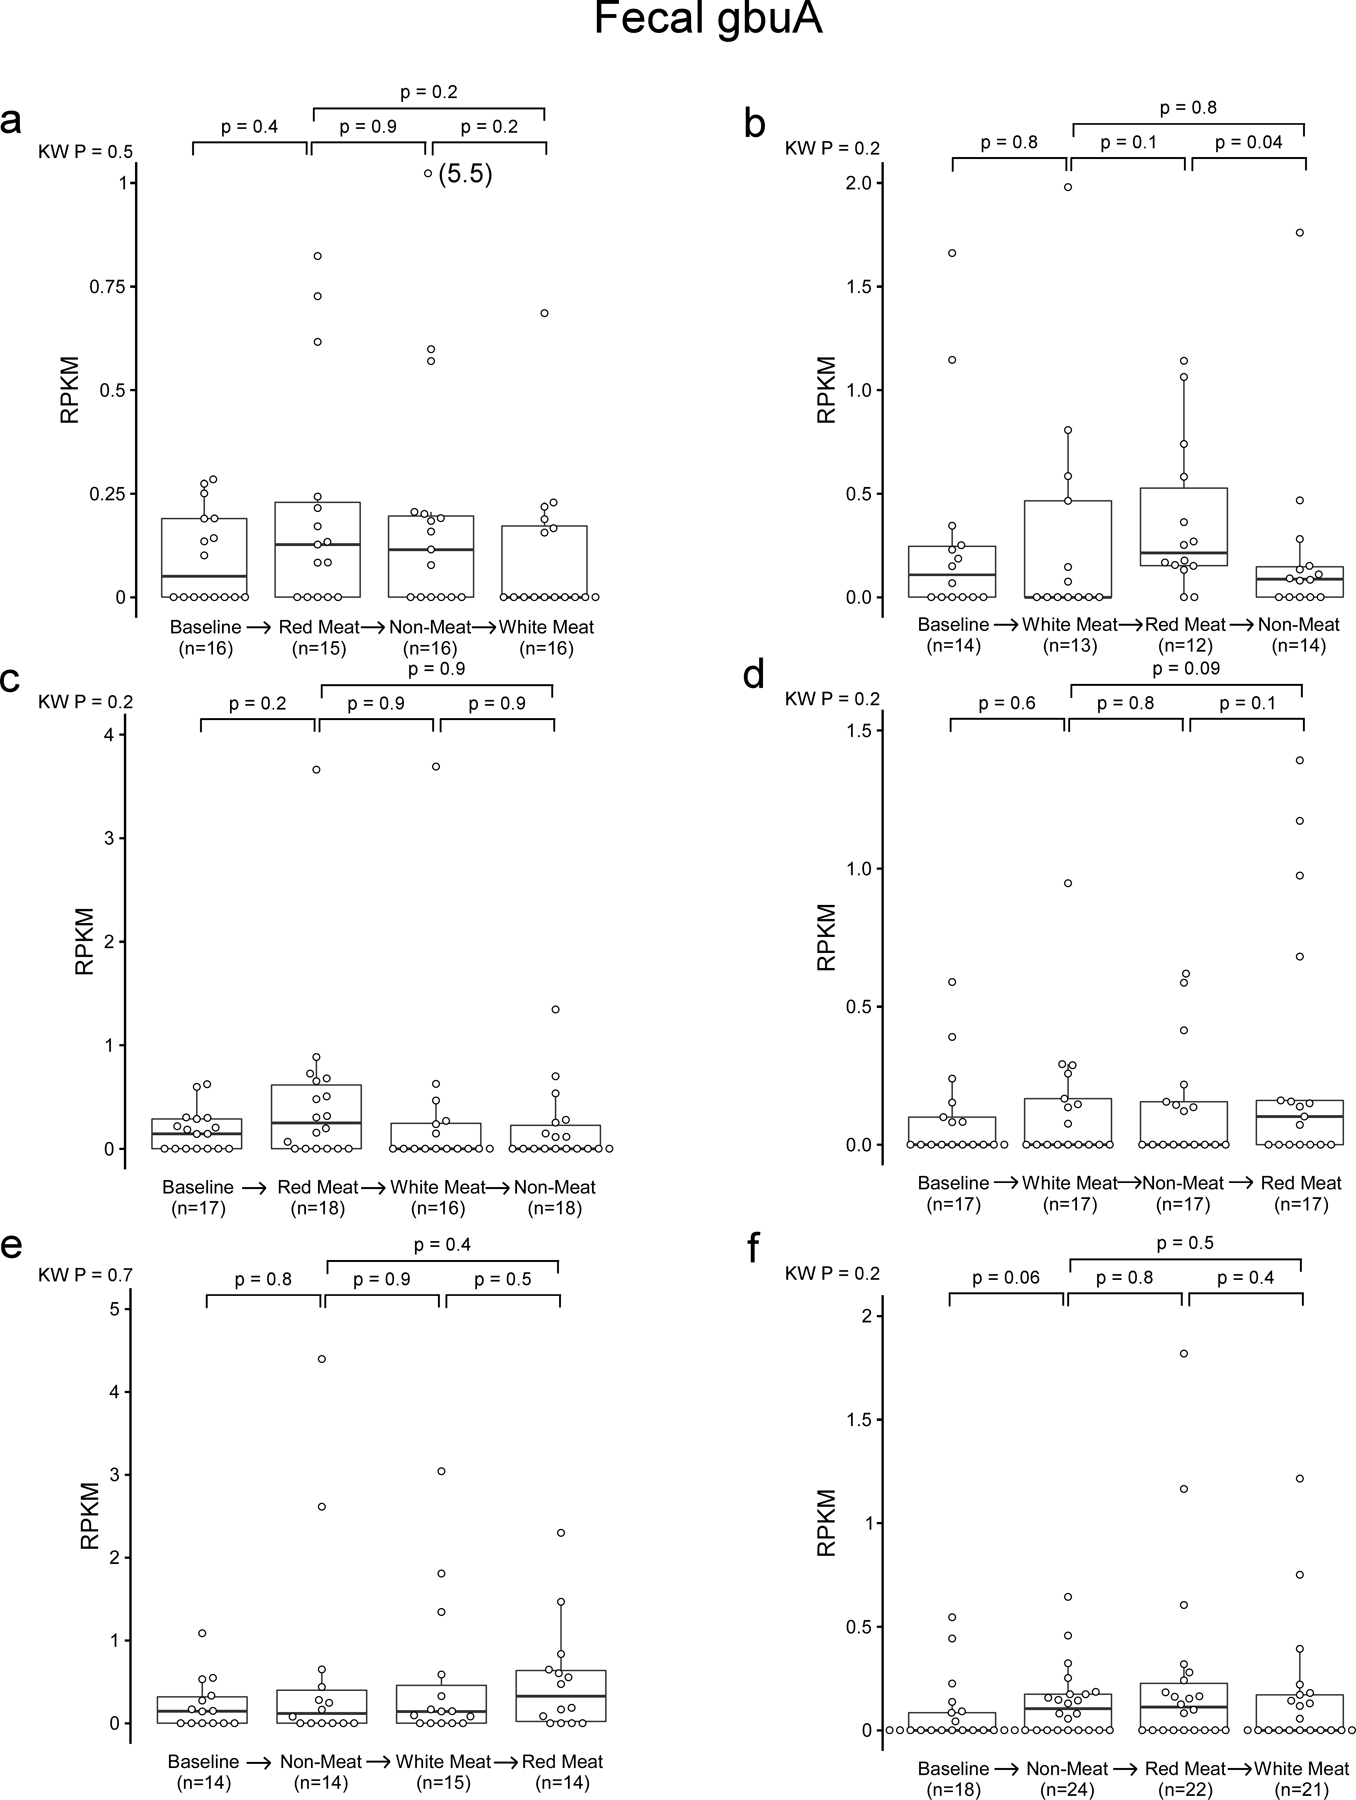
Using samples from the APPROACH study we assessed if gbuA abundance is regulated by diet. Participants were randomly assigned to consume red meat (highest L-carnitine containing diet, white meat, and non-meat (lowest L-carnitine containing diet) diets in one of six orders, with a washout period of at least two weeks between each diet intervention, as described under Methods. Using shotgun metagenomic sequencing gbuA abundance was calculated. In the box-whisker plot, the upper and lower boundaries of the box represent the 25th and 75th percentiles, the median is marked by a horizontal line inside the box, and whiskers extend to the largest or smallest point within 1.5 times the interquartile range of the 25th or 75th percentile. Values of outliers are shown in parenthesis next to the point. P values are determined by Kruskal-Wallis test (KW) or post-hoc Wilcox test.
Extended Data Fig. 7. Changes in plasma TMAO and fecal gbuA across all diet transitions.
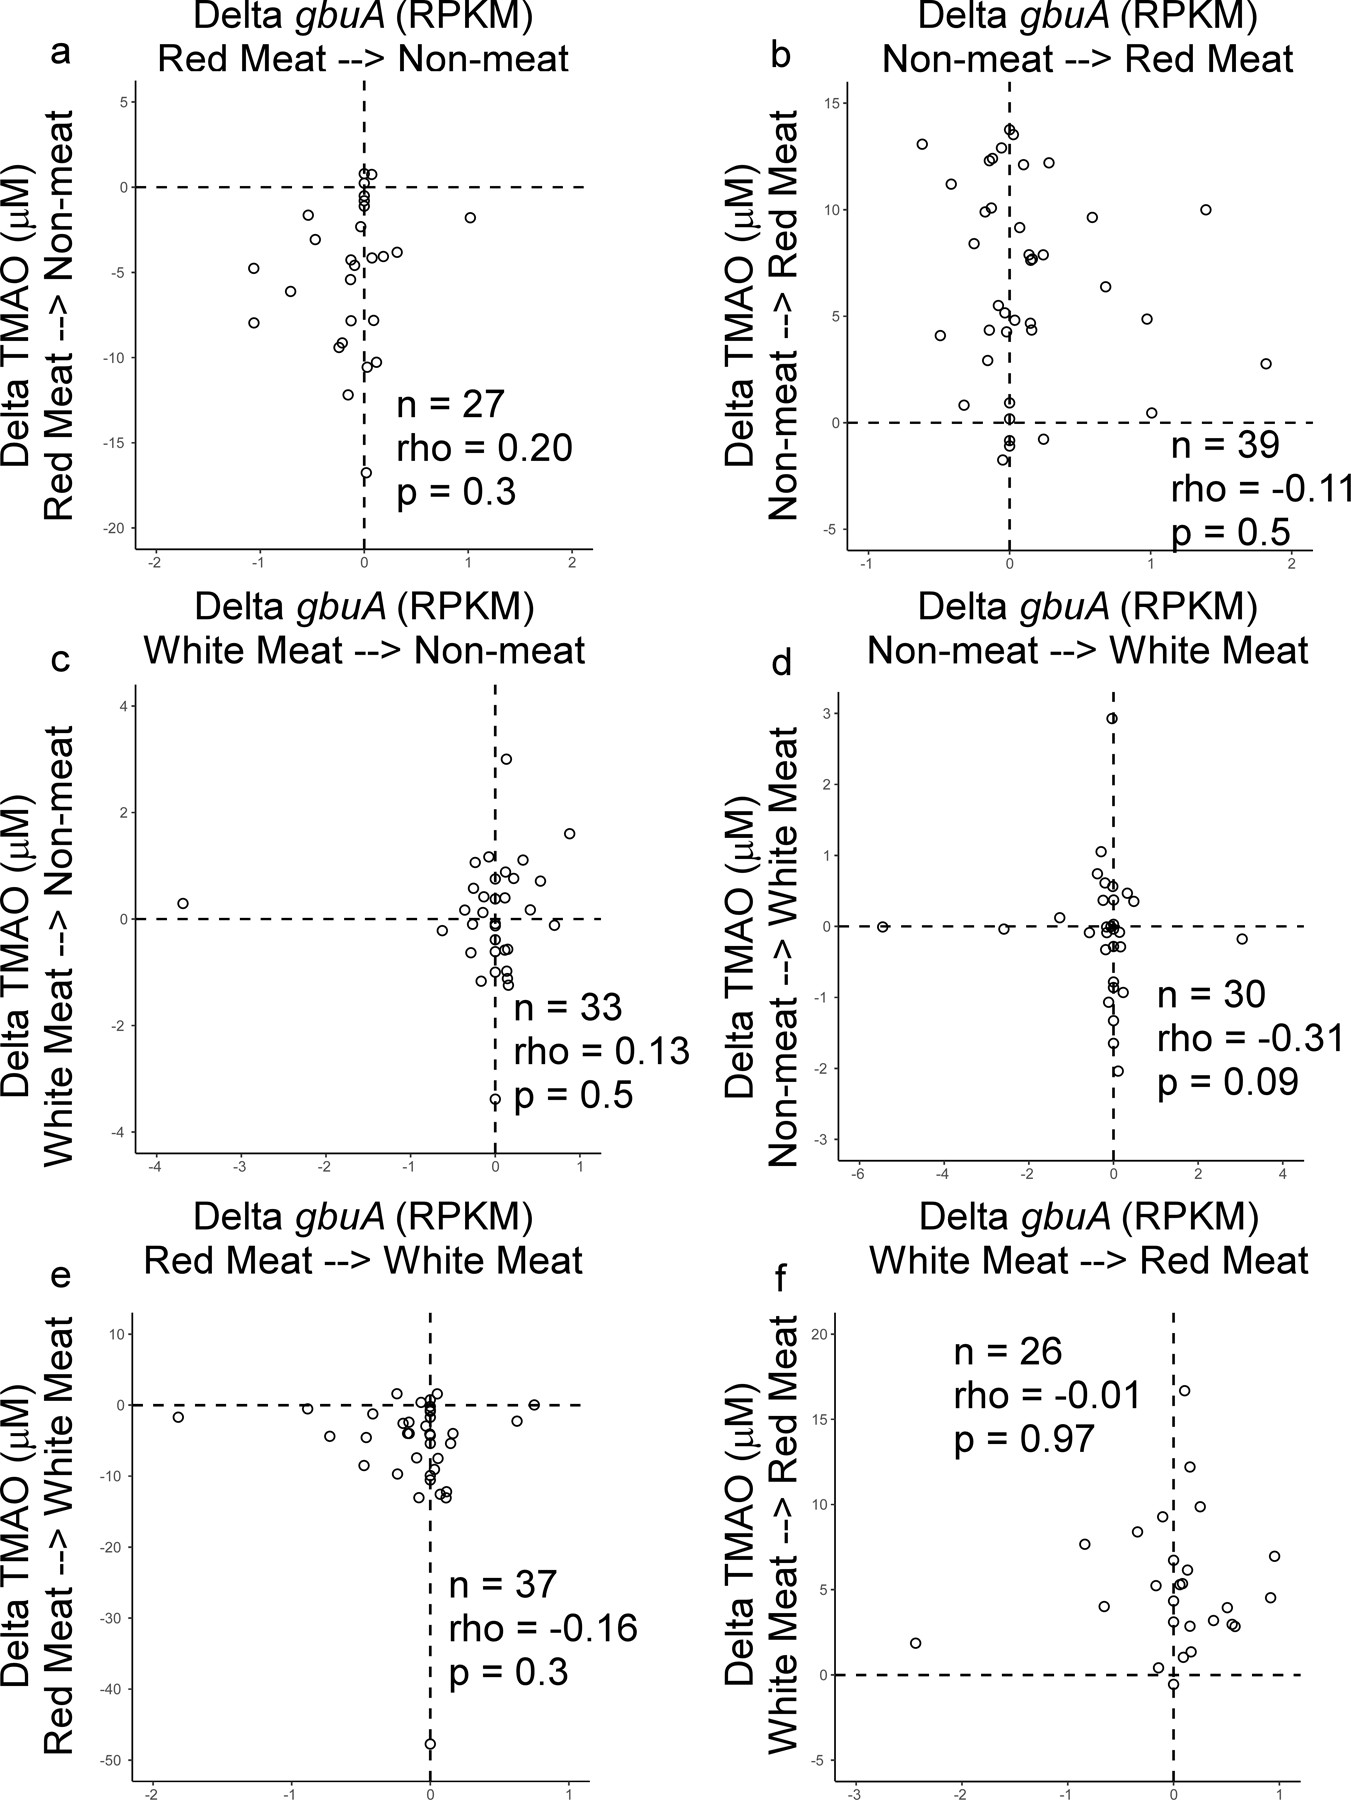
Using samples from the APPROACH study we assessed if gbuA abundance is regulated by diet. Participants were randomly assigned to consume red meat (highest L-carnitine containing diet), white meat, and non-meat (lowest L-carnitine containing diet) diets in one of six orders, with a washout period of at least two weeks between each diet intervention, as described under Methods. Using shotgun metagenomic sequencing gbuA abundance was calculated and correlated to corresponding plasma TMAO levels.
(a) Changes in fecal gbuA abundance and paired changes observed in plasma TMAO levels in subjects consuming the red-meat diet followed by the direct transition to the non-meat diet without an intervening white meat diet (non-meat minus red meat).
(b) Changes in fecal gbuA abundance and paired changes observed in plasma TMAO levels in subjects consuming the non-meat diet followed by the direct transition to the red-meat diet without an intervening white meat diet (red meat minus non-meat).
(c) Changes in fecal gbuA abundance and paired changes observed in plasma TMAO levels in subjects consuming the white-meat diet followed by the direct transition to the non-meat diet without an intervening red meat diet (non-meat minus white meat).
(d) Changes in fecal gbuA abundance and paired changes observed in plasma TMAO levels in subjects consuming the non-meat diet followed by the direct transition to the white-meat diet without an intervening red meat diet (white meat minus non-meat).
(e) Changes in fecal gbuA abundance and paired changes observed in plasma TMAO levels in subjects consuming the red-meat diet followed by the direct transition to the white-meat diet without an intervening non meat diet (white meat minus red meat).
(f) Changes in fecal gbuA abundance and paired changes observed in plasma TMAO levels in subjects consuming the white-meat diet followed by the direct transition to the red meat diet without an intervening non-meat diet (red meat minus white meat).
Two-tailed Spearman rank correlation coefficient (rho) and p values are shown.
Extended Data Fig. 8. Emergencia timonensis abundance decreased after transitioning from a red meat to a non-meat diet.
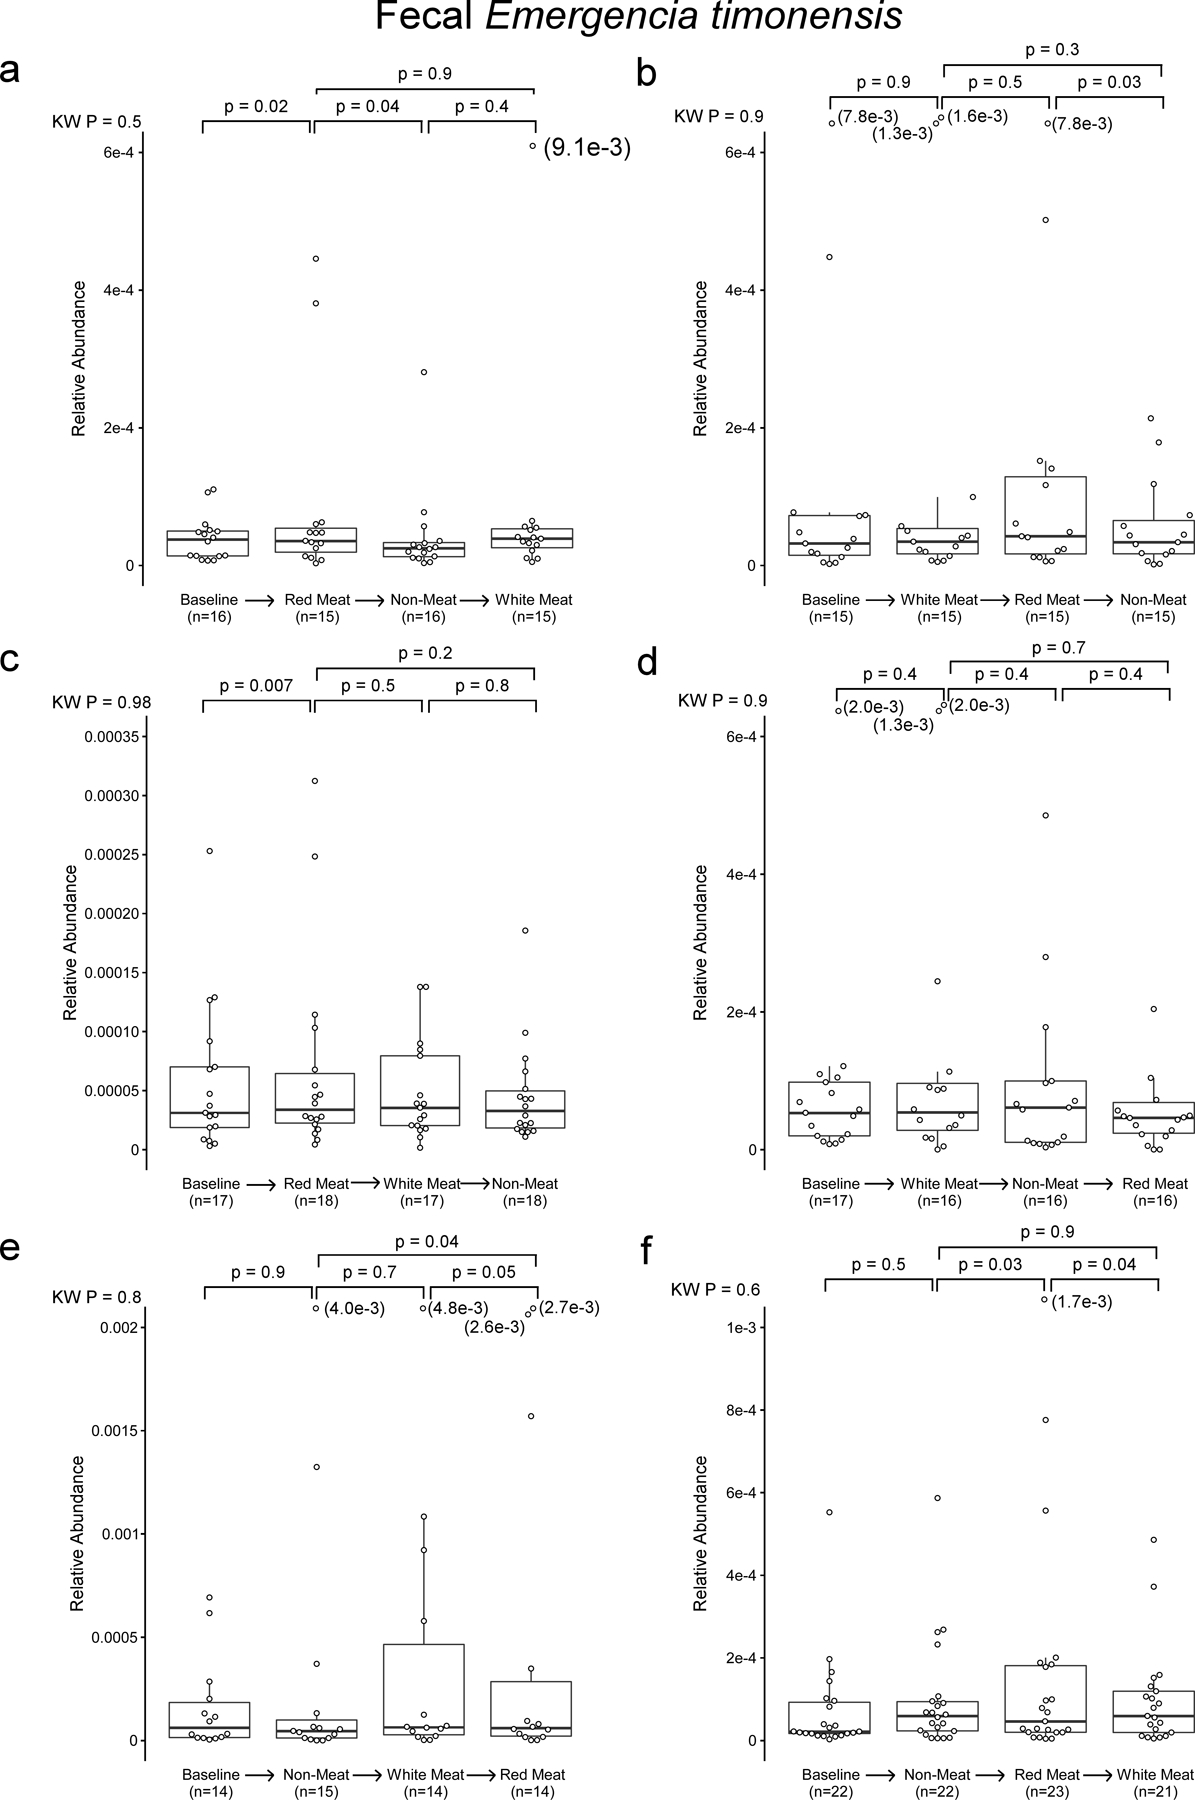
The gbuA gene is necessary to confer the ability to convert γBB to TMA to E. coli. Since this conversion is required to convert L-carnitine to TMA is human feces, we tested whether gbuA abundance is regulated by diet in a dietary intervention study. Participants were randomly assigned to consume red meat, white meat, and non-meat diets in one of six orders, with a two-week washout period between each diet intervention. Fecal gbuA decreases after switching to a non-meat diet from a red meat diet. If E. timonensis is the primary carrier of gbuA in the human fecal microbiota, then E. timonensis should decrease with gbuA. The V4 region of the E. timonensis 16S rRNA gene may have the same sequence as closely related species, causing 16S analysis to conflate E. timonensis with other organisms. Publicly available microbial genome sequences assembled de novo from shotgun metagenomic data allow the use of any distinctive feature of the genome to quantify E. timonensis. High-quality reads generated in shotgun metagenomic sequencing were mapped to metagenome-assembled genomes identified as E. timonensis through sequence homology. This analysis shows that E. timonensis decreased after switching from red meat to non-meat. Participants were included if they were assigned to red meat before non-meat, regardless of intervening white meat diet.
P value determined with White’s non-parametric t-test.
Extended Data Fig. 9. Emergencia timonensis decreased after switching from red meat to non-meat diet.
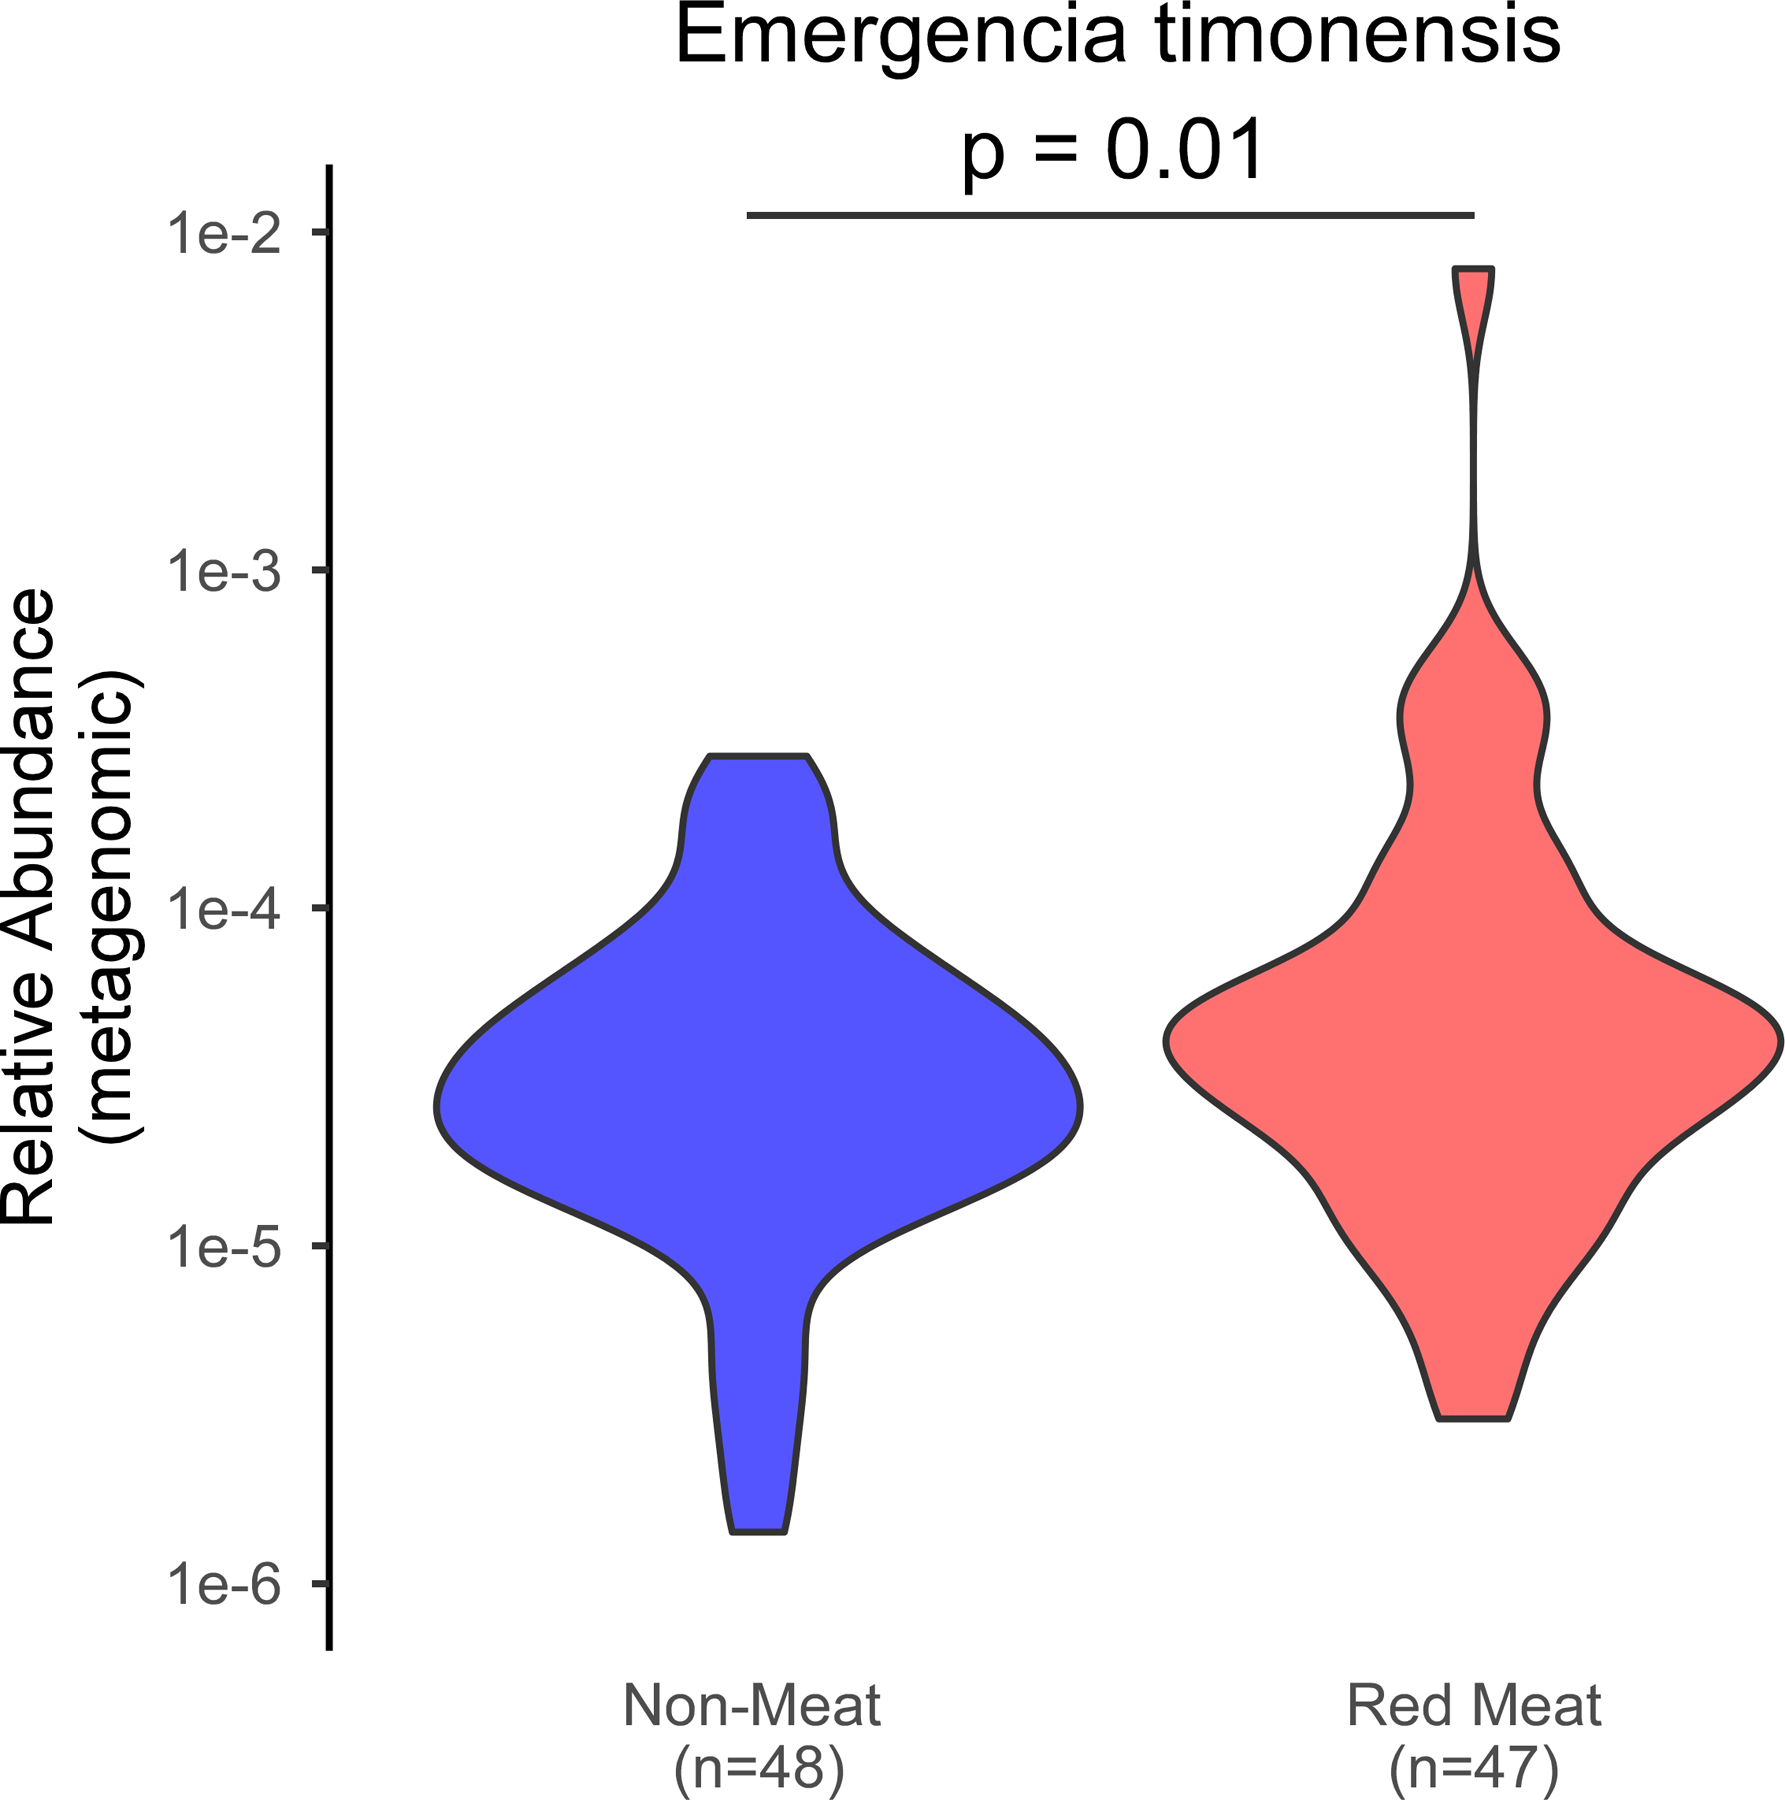
Using samples from the APPROACH study we assessed if E. timonensis abundance is regulated by diet. Participants were randomly assigned to consume red meat (highest L-carnitine containing diet, white meat, and non-meat (lowest L-carnitine containing diet) diets in one of six orders, with a washout period of at least two weeks between each diet intervention, as described under Methods. Using shotgun metagenomic sequencing E. timonensis abundance was calculated. In the box-whisker plot, the upper and lower boundaries of the box represent the 25th and 75th percentiles, the median is marked by a horizontal line inside the box, and whiskers extend to the largest or smallest point within 1.5 times the interquartile range of the 25th or 75th percentile. Values of outliers are shown in parenthesis next to the point. P values are determined by Kruskal-Wallis test (KW) or post-hoc Wilcox test.
Extended Data Fig. 10. Fecal caiA abundance in all diet order groups.
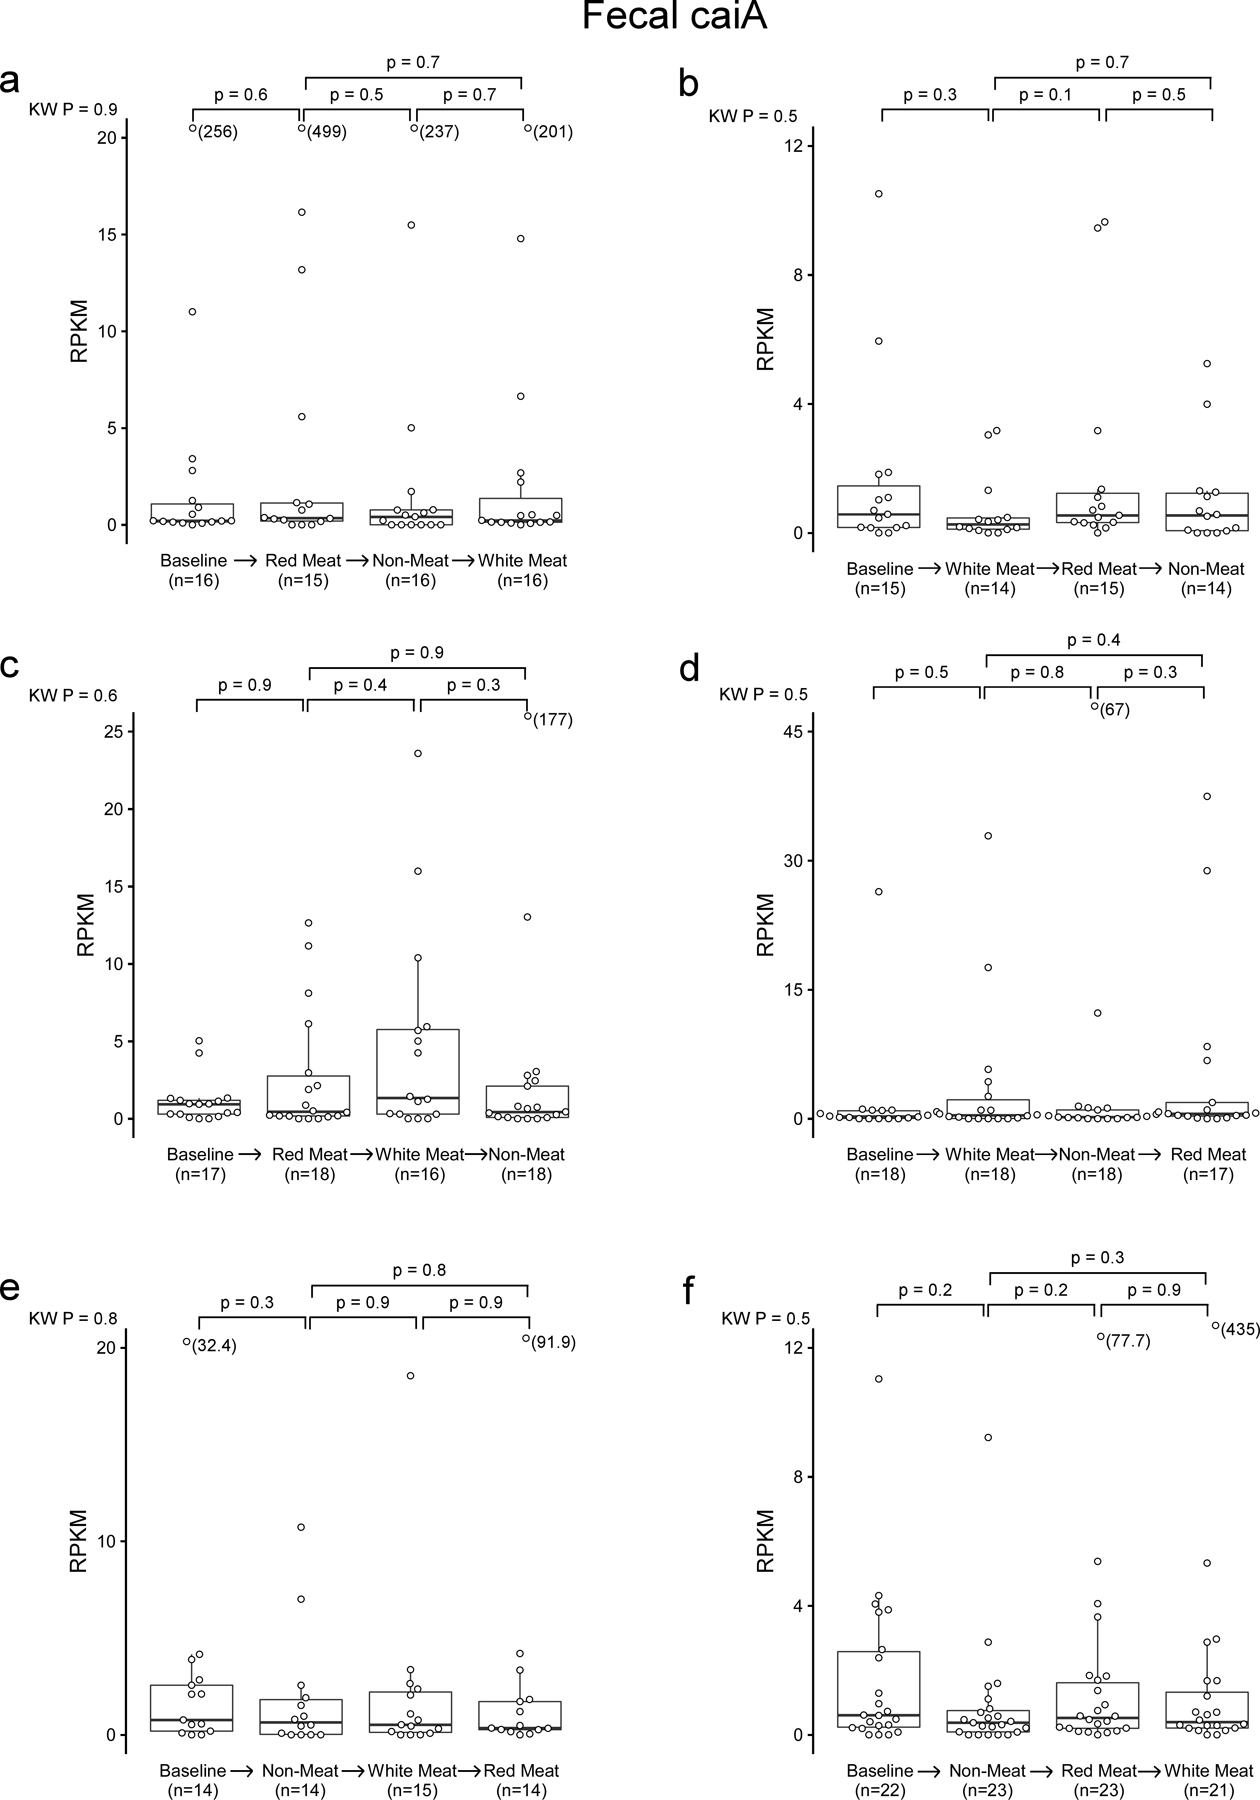
Using samples from the APPROACH study we assessed if caiA abundance is regulated by diet. Participants were randomly assigned to consume red meat (highest L-carnitine containing diet, white meat, and non-meat (lowest L-carnitine containing diet) diets in one of six orders, with a washout period of at least two weeks between each diet intervention, as described under Methods. Using shotgun metagenomic sequencing caiA abundance was calculated. In the box-whisker plot, the upper and lower boundaries of the box represent the 25th and 75th percentiles, the median is marked by a horizontal line inside the box, and whiskers extend to the largest or smallest point within 1.5 times the interquartile range of the 25th or 75th percentile. Values of outliers are shown in parenthesis next to the point. P values are determined by Kruskal-Wallis test (KW) or post-hoc Wilcox test.
Supplementary Material
Acknowledgements –
We thank the University of Wisconsin Biotechnology Center DNA Sequencing Facility and Dr. Kazuyuki Kasahara for assistance in sequencing cecal contents from mice with defined synthetic communities. This work was supported in part by National Institutes of Health (NIH) including the NIH Office of Dietary Supplements grants R01HL103866 and P01 HL147823 (SLH), and R01HL126827 (WHWT and SLH). SLH and FER were also supported by an award from the Leducq Foundation (17CVD01). Funds for all metagenomic and 16S sequence data for the APPROACH study were provided by Procter & Gamble. The APPROACH study was supported by R01 HL106003 (RMK and NB) and the NIH National Center for Advancing Translational Sciences through the University of California, San Francisco Clinical & Translational Science Institute under award number UL1TR000004 (RMK and NB). Mass spectrometry studies were performed on instrumentation housed in a facility supported in part through a Shimadzu Center of Excellence award.
Footnotes
Data Availability - Sequencing data sets used for community composition analysis of gnotobiotic mice are publicly available through NCBI’s Sequence Read Archive (SRA) Database under BioProject PRJNA701645. Shotgun metagenomic data sets used for gbuA abundance analysis in subjects are publicly available through NCBI’s Sequence Read Archive (SRA) Database under BioProject PRJEB44883. 16S rRNA gene sequencing files can be found under BioProject PRJNA498128. RNAseq data is available under BioProject PRJNA769418. There are restrictions to the availability of some of the clinical data generated in this study (Figure 1), as we do not have permission in our informed consent from research subjects to share data outside of our institution without their authorizations. Where permissible, the data sets generated and or/analyzed during the current study are available from the corresponding author upon request.
Code Availability – Custom R code is available at https://doi.org/10.5281/zenodo.5603090.52
Competing interests - Drs Hazen and Wang report being named as co-inventors on pending and issued patents held by the Cleveland Clinic relating to cardiovascular diagnostics and therapeutics. Drs Hazen and Wang report having received royalty payments for inventions or discoveries related to cardiovascular diagnostics or therapeutics from Cleveland Heart Lab, a fully owned subsidiary of Quest Diagnostics, and Procter & Gamble. Dr. Hazen is a paid consultant for Procter & Gamble, and Zehna Therapeutics, and has received research funds from Procter & Gamble, Pfizer Inc., Roche Diagnostics and Zehna Therapeutics. Jennifer Buffa reports having received royalty payments from Procter & Gamble. GFG, MFC, DBC, KLW, BRLG, HJD, PH and JCGG are employees of Procter & Gamble. Dr. Tang reports being a consultant for Sequana Medical A.G., Owkin Inc, Relypsa Inc, and PreCardiac Inc, having received honorarium from Springer Nature for authorship/editorship and American Board of Internal Medicine for exam writing committee participation - all unrelated to the subject and contents of this paper. The other authors have reported that they have no relationships relevant to the contents of this paper to disclose.
References
- 1.Kwok CS et al. Dietary components and risk of cardiovascular disease and all-cause mortality: a review of evidence from meta-analyses. Eur. J. Prev. Cardiol 26, 1415–1429 (2019). [DOI] [PubMed] [Google Scholar]
- 2.Bechthold A et al. Food groups and risk of coronary heart disease, stroke and heart failure: A systematic review and dose-response meta-analysis of prospective studies. Crit. Rev. Food Sci. Nutr 59, 1071–1090 (2019). [DOI] [PubMed] [Google Scholar]
- 3.Pan A et al. Red Meat Consumption and Mortality: Results From 2 Prospective Cohort Studies. Arch. Intern. Med 172, 555 (2012). [DOI] [PMC free article] [PubMed] [Google Scholar]
- 4.Wang X et al. Red and processed meat consumption and mortality: dose–response meta-analysis of prospective cohort studies. Public Health Nutr 19, 893–905 (2016). [DOI] [PMC free article] [PubMed] [Google Scholar]
- 5.Abete I, Romaguera D, Vieira AR, Lopez de Munain A & Norat T Association between total, processed, red and white meat consumption and all-cause, CVD and IHD mortality: a meta-analysis of cohort studies. Br. J. Nutr 112, 762–775 (2014). [DOI] [PubMed] [Google Scholar]
- 6.Koeth RA et al. Intestinal microbiota metabolism of l-carnitine, a nutrient in red meat, promotes atherosclerosis. Nat. Med 19, 576–585 (2013). [DOI] [PMC free article] [PubMed] [Google Scholar]
- 7.Bennett BJ et al. Trimethylamine-N-Oxide, a Metabolite Associated with Atherosclerosis, Exhibits Complex Genetic and Dietary Regulation. Cell Metab 17, 49–60 (2013). [DOI] [PMC free article] [PubMed] [Google Scholar]
- 8.Koeth RA et al. l-Carnitine in omnivorous diets induces an atherogenic gut microbial pathway in humans. J. Clin. Invest 129, 373–387 (2018). [DOI] [PMC free article] [PubMed] [Google Scholar]
- 9.Koeth RA et al. γ-Butyrobetaine Is a Proatherogenic Intermediate in Gut Microbial Metabolism of L -Carnitine to TMAO. Cell Metab 20, 799–812 (2014). [DOI] [PMC free article] [PubMed] [Google Scholar]
- 10.Zhu Y et al. Carnitine metabolism to trimethylamine by an unusual Rieske-type oxygenase from human microbiota. Proc. Natl. Acad. Sci 111, 4268–4273 (2014). [DOI] [PMC free article] [PubMed] [Google Scholar]
- 11.Wang Z et al. Gut flora metabolism of phosphatidylcholine promotes cardiovascular disease. Nature 472, 57–63 (2011). [DOI] [PMC free article] [PubMed] [Google Scholar]
- 12.Craciun S & Balskus EP Microbial conversion of choline to trimethylamine requires a glycyl radical enzyme. Proc. Natl. Acad. Sci 109, 21307–21312 (2012). [DOI] [PMC free article] [PubMed] [Google Scholar]
- 13.Thibodeaux CJ & van der Donk WA Converging on a mechanism for choline degradation. Proc. Natl. Acad. Sci 109, 21184–21185 (2012). [DOI] [PMC free article] [PubMed] [Google Scholar]
- 14.Romano KA, Vivas EI, Amador-Noguez D & Rey FE Intestinal Microbiota Composition Modulates Choline Bioavailability from Diet and Accumulation of the Proatherogenic Metabolite Trimethylamine-N-Oxide. mBio 6, e02481–14 (2015). [DOI] [PMC free article] [PubMed] [Google Scholar]
- 15.Martínez-del Campo A et al. Characterization and Detection of a Widely Distributed Gene Cluster That Predicts Anaerobic Choline Utilization by Human Gut Bacteria. mBio 6, e00042–15 (2015). [DOI] [PMC free article] [PubMed] [Google Scholar]
- 16.Eichler K, Bourgis F, Buchet A, Kleber H-P & Mandrand-Berthelot M-A Molecular characterization of the cai operon necessary for carnitine metabolism in Escherichia coii. Mol. Microbiol 13, 775–786 (1994). [DOI] [PubMed] [Google Scholar]
- 17.Eichler K, Buchet A, Lemke R, Kleber HP & Mandrand-Berthelot MA Identification and characterization of the caiF gene encoding a potential transcriptional activator of carnitine metabolism in Escherichia coli. J. Bacteriol 178, 1248–1257 (1996). [DOI] [PMC free article] [PubMed] [Google Scholar]
- 18.Roberts AB et al. Development of a gut microbe–targeted nonlethal therapeutic to inhibit thrombosis potential. Nat. Med 24, 1407–1417 (2018). [DOI] [PMC free article] [PubMed] [Google Scholar]
- 19.Skye SM et al. Microbial Transplantation With Human Gut Commensals Containing CutC Is Sufficient to Transmit Enhanced Platelet Reactivity and Thrombosis Potential. Circ. Res 123, 1164–1176 (2018). [DOI] [PMC free article] [PubMed] [Google Scholar]
- 20.Micha R, Michas G, Lajous M & Mozaffarian D Processing of meats and cardiovascular risk: time to focus on preservatives. BMC Med 11, 136 (2013). [DOI] [PMC free article] [PubMed] [Google Scholar]
- 21.Wang Z et al. Impact of chronic dietary red meat, white meat, or non-meat protein on trimethylamine N-oxide metabolism and renal excretion in healthy men and women. Eur. Heart J 40, 583–594 (2019). [DOI] [PMC free article] [PubMed] [Google Scholar]
- 22.Pagliai G et al. Influence of a 3-month low-calorie Mediterranean diet compared to the vegetarian diet on human gut microbiota and SCFA: the CARDIVEG Study. Eur. J. Nutr 59, 2011–2024 (2020). [DOI] [PubMed] [Google Scholar]
- 23.Sakkas H et al. Nutritional Status and the Influence of the Vegan Diet on the Gut Microbiota and Human Health. Medicina (Mex.) 56, 88 (2020). [DOI] [PMC free article] [PubMed] [Google Scholar]
- 24.Djekic D et al. Effects of a Vegetarian Diet on Cardiometabolic Risk Factors, Gut Microbiota, and Plasma Metabolome in Subjects With Ischemic Heart Disease: A Randomized, Crossover Study. J. Am. Heart Assoc 9, (2020). [DOI] [PMC free article] [PubMed] [Google Scholar]
- 25.David LA et al. Diet rapidly and reproducibly alters the human gut microbiome. Nature 505, 559–563 (2014). [DOI] [PMC free article] [PubMed] [Google Scholar]
- 26.Zhu W et al. Gut Microbial Metabolite TMAO Enhances Platelet Hyperreactivity and Thrombosis Risk. Cell 165, 111–124 (2016). [DOI] [PMC free article] [PubMed] [Google Scholar]
- 27.Rajakovich LJ, Fu B, Bollenbach M & Balskus EP Elucidation of an anaerobic pathway for metabolism of L-carnitine-derived γ-butyrobetaine to trimethylamine in human gut bacteria. Proc Natl Acad Sci U S A 118, e2101498118 (2021).. [DOI] [PMC free article] [PubMed] [Google Scholar]
- 28.Guasti L et al. TMAO as a biomarker of cardiovascular events: a systematic review and meta-analysis. Intern. Emerg. Med 16, 201–207 (2021). [DOI] [PubMed] [Google Scholar]
- 29.Zhuang R et al. Gut microbe–generated metabolite trimethylamine N ‐oxide and the risk of diabetes: A systematic review and dose‐response meta‐analysis. Obes. Rev 20, 883–894 (2019). [DOI] [PubMed] [Google Scholar]
- 30.Xu R, Wang Q & Li L A genome-wide systems analysis reveals strong link between colorectal cancer and trimethylamine N-oxide (TMAO), a gut microbial metabolite of dietary meat and fat. BMC Genomics 16, S4 (2015). [DOI] [PMC free article] [PubMed] [Google Scholar]
- 31.Tang WHW et al. Intestinal Microbial Metabolism of Phosphatidylcholine and Cardiovascular Risk. N. Engl. J. Med 368, 1575–1584 (2013). [DOI] [PMC free article] [PubMed] [Google Scholar]
- 32.Romano KA et al. Metabolic, Epigenetic, and Transgenerational Effects of Gut Bacterial Choline Consumption. Cell Host Microbe 22, 279–290.e7 (2017). [DOI] [PMC free article] [PubMed] [Google Scholar]
- 33.Goodman AL et al. Identifying Genetic Determinants Needed to Establish a Human Gut Symbiont in Its Habitat. Cell Host Microbe 6, 279–289 (2009). [DOI] [PMC free article] [PubMed] [Google Scholar]
- 34.Kageyama A, Sakamoto M & Benno Y Rapid identification and quantification of Collinsella aerofaciens using PCR. FEMS Microbiol. Lett 183, 43–47 (2000). [DOI] [PubMed] [Google Scholar]
- 35.Langmead B & Salzberg SL Fast gapped-read alignment with Bowtie 2. Nat. Methods 9, 357–359 (2012). [DOI] [PMC free article] [PubMed] [Google Scholar]
- 36.Love MI, Huber W & Anders S Moderated estimation of fold change and dispersion for RNA-seq data with DESeq2. Genome Biol 15, 550 (2014). [DOI] [PMC free article] [PubMed] [Google Scholar]
- 37.Finn RD et al. HMMER web server: 2015 update. Nucleic Acids Res 43, W30–W38 (2015). [DOI] [PMC free article] [PubMed] [Google Scholar]
- 38.Finn RD, Clements J & Eddy SR HMMER web server: interactive sequence similarity searching. Nucleic Acids Res 39, W29–W37 (2011). [DOI] [PMC free article] [PubMed] [Google Scholar]
- 39.Almeida A et al. A new genomic blueprint of the human gut microbiota. Nature 568, 499–504 (2019). [DOI] [PMC free article] [PubMed] [Google Scholar]
- 40.Nayfach S, Shi ZJ, Seshadri R, Pollard KS & Kyrpides NC New insights from uncultivated genomes of the global human gut microbiome. Nature 568, 505–510 (2019). [DOI] [PMC free article] [PubMed] [Google Scholar]
- 41.Zou Y et al. 1,520 reference genomes from cultivated human gut bacteria enable functional microbiome analyses. Nat. Biotechnol 37, 179–185 (2019). [DOI] [PMC free article] [PubMed] [Google Scholar]
- 42.Bergeron N, Chiu S, Williams PT, M King S & Krauss RM Effects of red meat, white meat, and nonmeat protein sources on atherogenic lipoprotein measures in the context of low compared with high saturated fat intake: a randomized controlled trial. Am. J. Clin. Nutr 110, 24–33 (2019). [DOI] [PMC free article] [PubMed] [Google Scholar]
- 43.Lang JM et al. Impact of Individual Traits, Saturated Fat, and Protein Source on the Gut Microbiome. mBio (2018). [DOI] [PMC free article] [PubMed] [Google Scholar]
- 44.Bäckhed F et al. Dynamics and Stabilization of the Human Gut Microbiome during the First Year of Life. Cell Host Microbe 17, 690–703 (2015). [DOI] [PubMed] [Google Scholar]
- 45.Cox MP, Peterson DA & Biggs PJ SolexaQA: At-a-glance quality assessment of Illumina second-generation sequencing data. BMC Bioinformatics 11, 485 (2010). [DOI] [PMC free article] [PubMed] [Google Scholar]
- 46.Li R, Li Y, Kristiansen K & Wang J SOAP: Short oligonucleotide alignment program. Bioinformatics 24, 713–714 (2008). [DOI] [PubMed] [Google Scholar]
- 47.Callahan BJ et al. DADA2: High-resolution sample inference from Illumina amplicon data. Nat. Methods 13, 581–583 (2016). [DOI] [PMC free article] [PubMed] [Google Scholar]
- 48.McMurdie PJ & Holmes S phyloseq: An R Package for Reproducible Interactive Analysis and Graphics of Microbiome Census Data. PLoS ONE 8, e61217 (2013). [DOI] [PMC free article] [PubMed] [Google Scholar]
- 49.McMurdie PJ & Holmes S Waste Not, Want Not: Why Rarefying Microbiome Data Is Inadmissible. PLoS Comput. Biol 10, e1003531 (2014). [DOI] [PMC free article] [PubMed] [Google Scholar]
- 50.Wickham H Ggplot2: elegant graphics for data analysis (Springer, 2009). [Google Scholar]
- 51.Benjamini Y Discovering the false discovery rate: False Discovery Rate. J. R. Stat. Soc. Ser. B Stat. Methodol 72, 405–416 (2010). [Google Scholar]
- 52.maf167. The-microbial-gbu-gene-cluster-cardiovascular-disease: The-microbial-gene-cluster-gbu-CVD-custom-code-102721 (gbu-v2.0). Zenodo(2021). [Google Scholar]
Associated Data
This section collects any data citations, data availability statements, or supplementary materials included in this article.


