Abstract
Swift recruitment of phagocytic leukocytes is critical to prevent infection when bacteria breach through the protective layers of the skin. According to canonical models, this occurs via an indirect process that is initiated by contact of bacteria with resident skin cells and which is independent of the pathogenic potential of the invader. Here, we describe a more rapid mechanism of leukocyte recruitment to the site of intrusion of the important skin pathogen Staphylococcus aureus that is based on direct recognition of specific bacterial toxins, the phenol-soluble modulins (PSMs), by circulating leukocytes. We used a combination of intravital imaging, ear infection and skin abscess models, and in-vitro gene expression studies to demonstrate that this early recruitment was dependent on the transcription factor EGR1 and significantly contributed to the prevention of infection. Our findings refine the classical notion of the non-specific and resident cell-dependent character of the innate immune response to bacterial infection by demonstrating a pathogen-specific high-alert mechanism involving direct recruitment of immune effector cells by secreted bacterial products.
The human skin and mucous surfaces are inhabited by a plethora of bacteria. While many have an important beneficial function1,2, some can become dangerous when they penetrate the protective layer of the skin. Among potentially harmful skin-colonizing bacteria, Staphylococcus aureus is by far the most important in terms of infection severity and frequency3,4. Notwithstanding the considerable number of severe S. aureus skin infections, the presumably quite common event of S. aureus epithelial intrusion usually can be controlled by host defenses. However, it remains poorly understood how our immune system mounts a response to such a dangerous invader that is sufficiently rapid and efficient to prevent the development of infection.
The most important initial immune reaction to bacterial invasion is the mobilization of phagocytic leukocytes, predominantly neutrophils, to the site of intrusion. This is commonly believed to occur through “immune sensing” by resident skin cells. According to this model, pathogen recognition receptors (PRRs) on the resident cells, when activated by pro-inflammatory bacterial surface structures (“pathogen-associated molecular patterns”, PAMPs), stimulate processes that result in the secretion of chemo-attractants that recruit leukocytes from the bloodstream5–8. Of note, despite termed “pathogen-associated”, classical PAMPs, such as lipopolysaccharide in Gram-negative bacteria or lipoteichoic acids and lipopeptides in Gram-positive bacteria, are conserved throughout large bacterial classes independently of pathogenicity.
As basis of the present study, we hypothesized that bacterial toxins trigger a response that is not only virulence-tuned but faster than that described by the classical model of “immune sensing”, because their diffusible nature may overcome the dependence on resident cell involvement. We present a rapid mechanism of phagocyte recruitment after skin infection in which leukocytes in circulation can directly sense bacterial toxins in a process that is dependent on induction of the transcription factor EGR1 in the leukocytes and independent of resident cells.
Dependence of early leukocyte influx on S. aureus PSM toxins
Among the various S. aureus toxins, the phenol-soluble modulins (PSMs)9 appear to be particularly well suited to function as signals for innate host defense. Genes encoding PSMs are found in all S. aureus strains and PSMs are produced in high amounts especially in highly virulent S. aureus. Furthermore, they are critical virulence factors of S. aureus9,10. Research on PSMs has focused mostly on the cytolytic properties of PSMs, which are observed at micromolar concentrations and believed to underlie the significant impact PSMs have on many S. aureus infection types9,11–13. In comparison, the biological role of the pro-inflammatory properties of PSMs, which are dependent on the formyl peptide receptor (FPR) 2 and observed already at low nanomolar concentrations14,15, has remained less well understood9,16,17.
To evaluate the role of PSMs in the initial response of the innate immune system to intrusion of S. aureus through the skin, we employed intravital imaging by confocal microscopy in a mouse ear infection model. We infected with S. aureus strain LAC, which is a representative of S. aureus pulsed-field type USA300, the most frequent source of skin infections in the U.S.4, or an isogenic mutant in which all psm gene loci were deleted or altered to completely suppress PSM production (Δpsm)18, and monitored leukocyte influx into the site of infection for up to 24 h post infection. These strains do not show significant growth differences in vitro18, and we verified that there were also no differences in bacterial numbers during the initial hours of skin infection in our model (Extended Data Fig. 1). In mice infected with the wild-type S. aureus strain, an increase in leukocyte influx to the infection site was observed at 4 h post infection (p. i.), and over the measured time of 12 h post infection remained significantly more pronounced than that observed in the Δpsm deletion strain (Fig. 1a,b). Most infiltrating cells were neutrophils and there also was a significant PSM-dependent effect regarding neutrophils at most timepoints. Similar trends were observed with non-neutrophil leukocytes although this did not reach statistical significance except for at 4 h p. i. (Fig. 1a). Significant leukocyte influx in mice infected with the Δpsm deletion strain was only observed at 18 h and 24 h p. i. (Fig. 1a,b), reaching levels that were not significantly lower than those in wild-type infected mice (Fig. 1a,b). These data show that the early leukocyte influx to the site of S. aureus invasion into the skin is strongly dependent on the PSM toxins, and that in their absence this chemotactic response is considerably delayed. The response we saw starting at 18 h likely reflects the canonical response to conserved PAMPs.
Figure 1. S. aureus PSM toxins are critical to the early leukocyte influx to the site of skin infection - Experiments with bacteria.
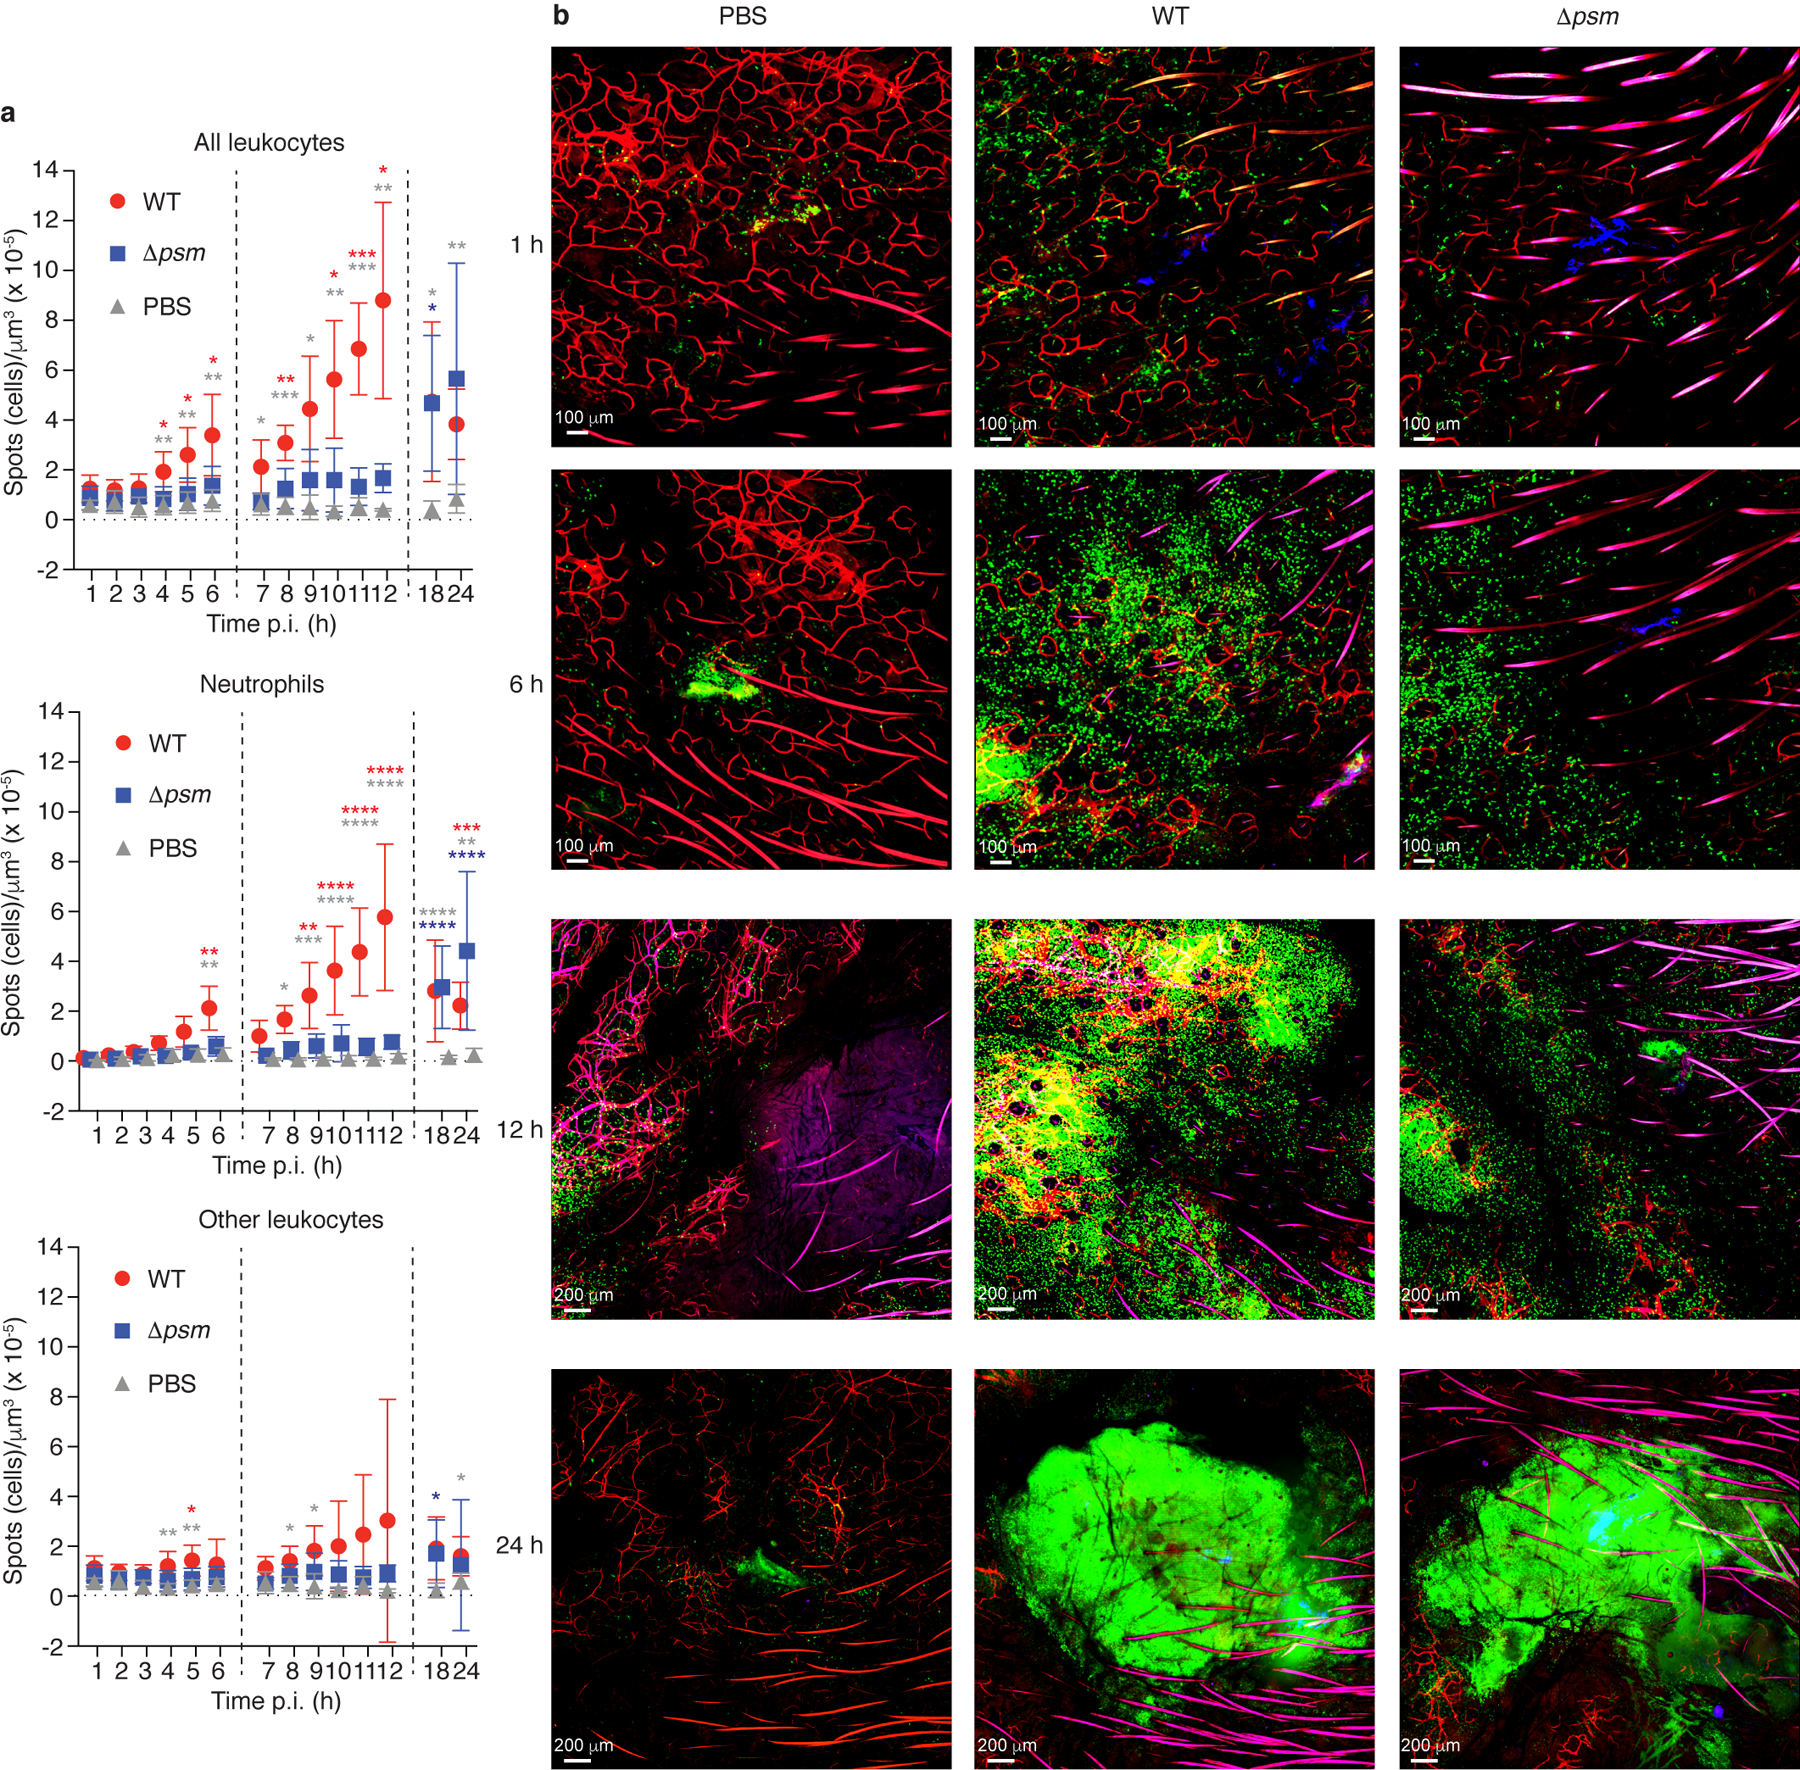
a, Influx of total leukocytes, neutrophils, and non-neutrophil leukocytes to the infection site. Data are from the analysis of C-LSM intravital imaging using C57BL/6-Lysozymetm1M-GFP mice. Fluorescently labeled S. aureus LAC (WT) or Δpsm bacteria were injected in a volume of 3 μl into the ear pinnae and images of the infection site were taken every hour over 1 – 6 h and 7 – 12 h, and at 18 h and 24 h p. i. Bacterial inocula were set up to be in the range of 1 – 2 × 10⁷ CFU and actual injected bacterial CFU were determined in the inocula: LAC, 2.48 ± 0.93 (SD) × 107; Δpsm, 2.00 ± 0.85 (SD) × 107 (p=0.21, unpaired two-tailed t-test). Controls received the same volume of PBS. Vertical dashed lines depict separate experiments as mice can only be monitored for a maximum of 6 h. Neutrophils were distinguished from other leukocytes in the image analysis protocol by their higher fluorescence. n = 4 – 8/group. Statistical analysis is by 2-way ANOVA or mixed model with Tukey’s post-tests. *, p<0.05; **, p < 0.01; ***, p < 0.001; ****, p < 0.0001; red asterisks, WT versus Δpsm; grey asterisks, WT versus PBS; blue asterisks, Δpsm versus PBS. Error bars show the mean ± SD. b, Selected representative images. Green, leukocytes; blue, bacteria; red, blood vessels (fluorescent antibody-labeled).
In addition to activating FPR2, PSMs are indirectly pro-inflammatory as they release lipopeptides, which are canonical TLR2 agonists, from the bacterial cell surface, most likely owing to their detergent-like properties19. While we confirmed that psm genes are expressed during the early hours of skin infection (Extended Data Fig. 1), the levels of secreted PSM peptides are likely still too low at that time to cause lipopeptide release, especially given that PSM expression is strictly quorum-sensing controlled20 and we did not observe bacterial proliferation during these hours (Extended Data Fig. 1). Nevertheless, to confirm a direct rather than indirect role of PSMs in leukocyte attraction, we injected a sublytic concentration of pure PSMα3 peptide, which also led to early attraction of leukocytes (Extended Data Fig. 2). Furthermore, we compared to a PSMα3 derivative (PSMα3K12A) with strongly reduced pro-inflammatory capacity21. Early leukocyte attraction with this peptide was significantly reduced as compared to that observed with PSMα3, pinpointing the observed leukocyte attraction to a direct PSM-triggered pro-inflammatory effect (Extended Data Fig. 2).
These findings showing strong dependence of early leukocyte influx on the PSM toxins confirmed our hypothesis that secreted toxins play an important role in early pathogen recognition and suggested that the classical model based on recognition of surface-associated conserved structures is not sufficient to completely account for the mechanisms underlying early events of pathogen-triggered leukocyte influx to an infection site. Therefore, we set out to investigate the mechanism of this toxin-triggered response in more detail.
Dominance of PSMs in stimulating neutrophil gene expression
The results obtained in the mouse ear infection model indicated that PSMs play a predominant role in leukocyte recruitment. The most important leukocytes that are attracted and activated by bacterial invaders are neutrophils, also called polymorphonuclear leukocytes (PMNs). However, the gene regulatory events inside neutrophils that are triggered by PSMs are unknown. To answer this question and also to analyze the relative importance of PSMs among secreted S. aureus substances in stimulating neutrophil gene expression, we investigated the human neutrophil response to S. aureus culture filtrate and PSMs by whole-genome gene expression analysis using microarrays. We set up a large series of experiments, in which the impact on neutrophil gene expression of pure PSM peptides and culture filtrates of clinical S. aureus and isogenic psm deletion strains was determined. Among the PSM peptides, we included PSMα3, as it is the most pro-inflammatory, and δ-toxin, as it is the most strongly produced PSM in S. aureus9,22. The peptides and culture filtrates were applied at concentrations determined to be sublytic (Extended Data Fig. 3). Furthermore, we used the FPR2 inhibitor, formyl peptide receptor-like 1 inhibitor (FLIPr)23 to analyze the impact of FPR2, and PSM recognition by FPR2 in particular, on neutrophil gene expression.
We first analyzed the overall numbers of genes with significantly changed expression (Tab. 1). Most remarkably, comparison of the impact of wild-type S. aureus culture filtrate with that of the total PSM-deficient strain showed that virtually all of the many observed gene expression changes were due to PSMs. Accordingly, pure PSMα3 and δ-toxin both led to changes in the expression of a high number of genes. Contrastingly, when FLIPr was applied in addition to those peptides, virtually no changes were observed, in accordance with the notion that these peptides signal through FPR215. The experiments using culture filtrates of the psmα deletion strain (with the genes encoding PSMα1, PSMα2, PSMα3, and PSMα4 deleted) demonstrated particular importance of the PSMα peptides in stimulating neutrophil gene expression. Furthermore, the high number of gene expression changes stimulated by S. aureus wild-type culture filtrate could be strongly reduced by FLIPr. Moreover, there was a considerable number of genes with changed expression comparing stimulation by wild-type culture filtrate with and without application of FLIPr. These findings demonstrate a vastly predominant role of PSMs among secreted S. aureus molecules in stimulating neutrophil gene expression.
Tab. 1.
Number of differentially expressed genes in the human neutrophil microarray analysis comparisons
| Comparison (test versus control) | Number of significant probe sets with at least 2-fold change | ||
|---|---|---|---|
| 30 min | 60 min | 180 min | |
| Culture filtrate experiments | |||
| WT vs. PMN control* | 58 | 465 | 953 |
| Δpsm vs. PMN control | 0 | 1 | 6 |
| Δpsmα vs. PMN control | 1 | 33 | 381 |
| WT + FLIPr vs. PMN control | 1 | 37 | 618 |
| WT vs. WT + FLIPr | 37 | 173 | 249 |
| WT vs. Δpsm | 64 | 234 | 347 |
| WT vs. Δpsmα | 41 | 136 | 171 |
| Δpsmα vs. Δpsm | 1 | 2 | 29 |
| Experiments with peptides | |||
| PSMα3 vs. PMN control | 58 | 273 | 564 |
| δ-toxin vs. PMN control | 39 | 333 | 684 |
| PSMα3 + FLIPr vs. PMN control | 2 | 0 | 0 |
| δ-toxin + FLIPr vs. PMN control | 0 | 0 | 17 |
| PSMα3 vs. PSMα3 + FLIPr | 89 | 142 | 381 |
| δ-toxin vs. δ-toxin + FLIPr | 17 | 168 | 976 |
PMN control is without added stimulant.
Strong early induction of EGR1 transcription by PSMs
We then analyzed the PSM-dependent gene expression changes in detail. When comparing changes elicited by wild-type culture filtrate versus those elicited by culture filtrate of the psm-deficient strain (Δpsm), we noted a striking change particularly of the transcription factor, early growth response protein (EGR)1, which was extensive at 30 minutes and declined later (Fig. 2a, Supplementary Tab. 1). Two other EGR family transcription factors, EGR2 and EGR3, were also up-regulated in a PSM-dependent fashion, but to a minor degree (Fig. 2b, Supplementary Tab. 1). At 60 and 180 minutes, we observed an increase in the expression of a series of cytokine genes (Fig. 2c). Those cytokines included oncostatin M (OSM), known to stimulate the production of additional cytokines such as IL-6 in endothelial cells24, the antimicrobial lymphocyte-attractant C-C motif cytokine (CCL) 2025, the neutrophil attractant CXCL226, the pleiotropically inflammatory alarmin IL-1α27, and the epidermal growth factors (EGFs) epiregulin and heparin-binding EGF. We also observed significant up-regulation of genes related to migration regulation (PLEKHG2) and initiation of translation (eukaryotic initiation factor, EIF; translation initiation factor GOS2), consistent with the notion that PSMs trigger neutrophil migration and activation as reflected by increased protein (e.g., cytokine) expression (Supplementary Tab. 1). Gene expression changes in the other experiments followed this general picture and showed that EGR1 expression was changed in a PSM- and FPR2-dependent fashion, inasmuch as EGR1 expression was also stimulated by pure PSM peptides and inhibited by the addition of FLIPr (Fig. 2a). The results highlighted the particular importance of the PSMα peptides, as no significant changes in EGR1 expression were observed when comparing the psmα vs. the total psm mutant (Fig. 2a, Tab. 1). We validated the microarray results using qRT-PCR, which also showed strong PSM-, and particularly PSMα peptide-dependent up-regulation of EGR1 expression and inhibition by FLIPr (Extended Data Fig. 4). Furthermore, we determined Ca2+ flux, a proxy commonly measured for neutrophil activation, in neutrophils obtained from wild-type, FPR2−/−, and EGR1−/− mice upon stimulation with sublytic concentrations of PSMα3 or PSMα3K12A as control. Ca2+ flux in PSMα3-stimulated EGR1−/− neutrophils was strongly reduced as compared to wild-type neutrophils, to the level observed in PSMα3-stimulated FPR2−/− neutrophils, confirming a key role of EGR1 in the neutrophil response to PSMs (Fig. 2d). Together, these data indicate that the transcription factor EGR1 plays a key role in the neutrophil response to secreted S. aureus molecules, among which according to our results PSMs are by far the most important.
Figure 2. Genome-wide gene expression experiments reveal EGR1 as the main mediator of the early human neutrophil response to S. aureus.
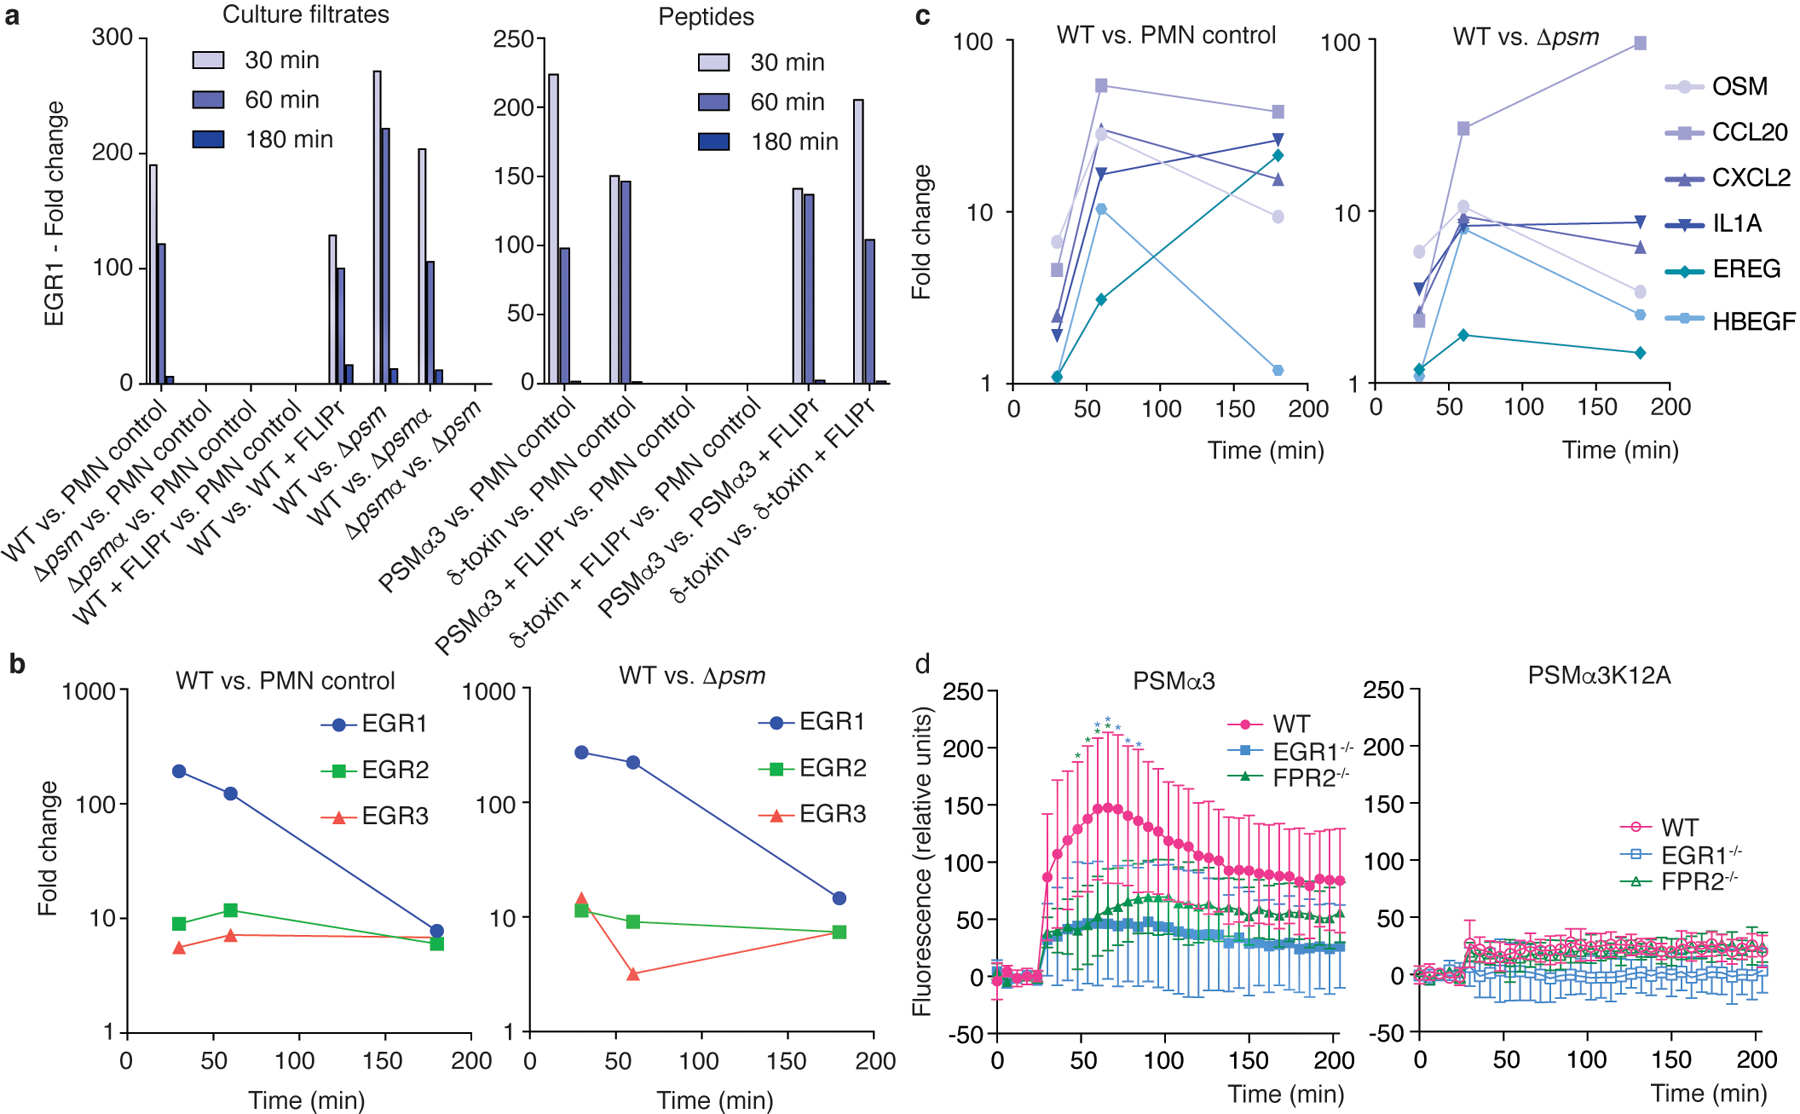
Bacterial culture filtrates (8 h of growth in TSB, at 1: 600 sublytic dilution; see Extended Data Fig. 3) or synthetic PSM peptides (330 nM, sublytic concentration; see Extended Data Fig. 3) were given to 1 × 10⁷ isolated human neutrophils and genome-wide gene expression was determined using microarrays at 30, 60, and 180 min thereafter. a, Differential expression of the transcription factor EGR1 in the indicated comparisons. b, Differential expression of EGR1, EGR2, and EGR3 over time in the indicated comparisons. c, Differential expression of selected cytokine genes over time in the indicated comparisons. See Supplementary Tab. 1 for a list of main genes with strong differential expression (all annotated genes with > factor 10 up-regulation at 30 or 60 min, or > factor 20 at 180 min) in the WT vs. PMN control and WT vs. Δpsm comparisons and GEO (https://www.ncbi.nlm.nih.gov/geo/query/acc.cgi?acc=GSE103779) for the entire microarray data. d, Stimulation of Ca2+ flux in wild-type (WT), EGR1−/− and FPR2−/− neutrophils by PSMα3 or PSMα3K12A (200 nM). Statistical analysis is by repeated measures 2-way ANOVA with Tukey’s post-tests. Asterisks show statistically significant difference (p<0.05) with the color representing the respective comparison (blue, WT versus EGR1−/−; green, WT versus FPR2−/−). n=6/group. Error bars show the mean ± SD.
PSM-stimulated signal pathway
Next, we wanted to determine the signaling mechanism of PSM-mediated activation of EGR1 transcription. According to the literature, several possibilities exist for signaling pathways to exert an impact on EGR1, including via nuclear factor of activated T-cells (NFAT)-type transcription factors28 and mitogen-activated protein kinase kinase (MAPKK or MEK), a signaling module of the mitogen-activated protein kinase (MAPK) signaling cascade, also called extracellular signal-regulated kinase (ERK)29.
To elucidate by which pathway PSMs activate EGR1 transcription, we employed the small molecule pathway inhibitor approach and tested for inhibition of NFAT and MAPK-dependent pathways using the PSMα3 peptide in human neutrophils. To test for stimulation via NFAT, we used the NFAT-specific inhibitors, cyclosporin A and FK-506. As for MAPK-dependent pathways, by far the most extensively studied mammalian MAPK-signaling cascades are the ERK1/2, c-Jun N-terminal kinases (JNKs), and p38 cascades30. To determine whether these pathways are involved in PSM-mediated EGR1 transcription, we used SP600125, SB202190, and U0126, which are JNK-, p38-, and MEK/ERK-specific inhibitors, respectively. PSMα3-dependent EGR1 transcription was strongly inhibited by the MEK/ERK-specific inhibitor U0126 in a dose-dependent fashion, but not the inhibitors of the other pathways (Fig. 3a,b). Thus, PSM-mediated activation of EGR1 transcription seems to signal exclusively through ERK (Fig. 3c), which is in accordance with the finding that FPR2 inhibition blocks ERK phosphorylation31, highlighting the importance of the PSM-FPR2-EGR1 signaling axis and the role of EGR1 in PSM-mediated effects.
Figure 3. PSMs trigger EGR1 transcription via the MEK/ERK pathway.
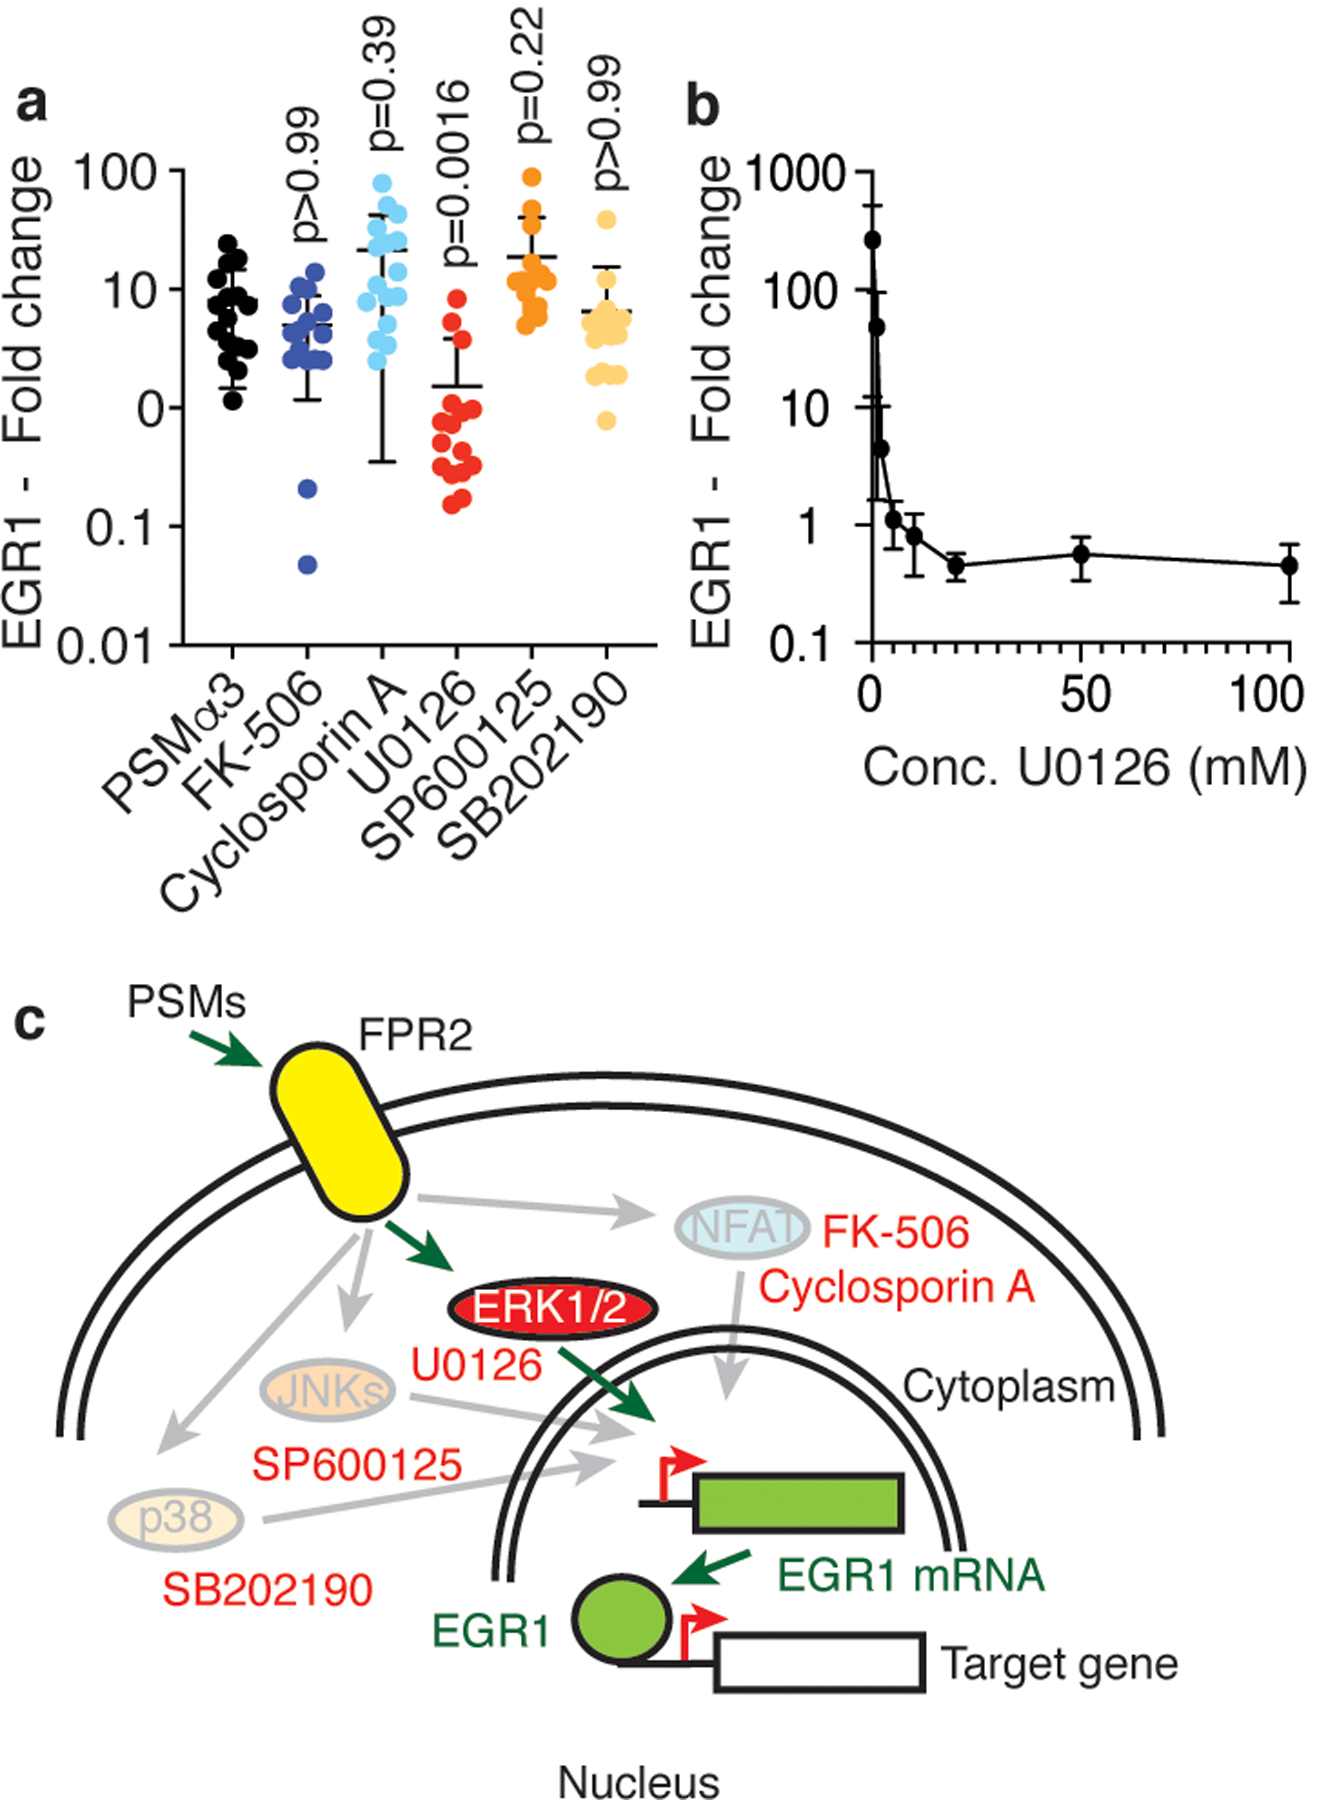
a, Isolated human neutrophils (1 × 10⁷) were stimulated with synthetic PSMα3 (330 nM) diluted from a stock solution in DMSO for 30 min with or without addition of 10 μM of the indicated pathway inhibitors and EGR1 expression relative to a control that received equal amounts of DMSO was determined by qRT-PCR. n=16/group. Statistical analysis is by Kruskal-Wallis test with Dunn’s post-test vs. values obtained with PSMα3. b, Dose-response curve with different amounts of the MEK/ERK pathway inhibitor U0126 under the same conditions. n=3–5. c, Scheme of PSM-triggered signal transduction and tested pathways and their inhibitors (red font). Pathways that were not PSM-induced (not inhibited by the specific inhibitors) are shaded. a,b, Error bars show the mean ± SD.
FPR2/EGR1 dependence of leukocyte influx and direct mechanism of leukocyte attraction
Our results showing PSM dependence of early leukocyte influx to the epithelial infection site and our data on a key involvement of EGR1 in neutrophil attraction by PSMs suggested that PSM-mediated early leukocyte influx in vivo is dependent on EGR1. Furthermore, the observed kinetics of PSM-mediated leukocyte influx observed in this study, and the fact that PSMs are secreted and myeloid cells strongly express the PSM receptor FPR232, are in accordance with our initial hypothesis that leukocytes may be attracted to the site of S. aureus intrusion by direct interaction with PSMs, rather than by cytokines resulting from prior activation of resident skin cells. However, some resident cells, such as keratinocytes, skin-resident T-cells, mast cells, or Langerhans cells, also express FPR2, albeit at much lower levels than leukocytes32. Furthermore, the attraction of leukocytes may be stimulated by PSM-mediated cytolytic effects9,13, although this is unlikely given the early hours of infection, quorum-sensing control of PSMs20,33, and the fact that cytolysis requires much higher PSM concentrations9. Therefore, to establish the contribution of FPR2/EGR1 signaling to PSM-mediated influx to the infection site as well as the mechanism of direct attraction of circulating leukocytes as opposed to a possible involvement of resident cells, we performed an adoptive transfer experiment, in which we fluorescently labeled and then transferred cells obtained from the bone marrows of wild-type, FPR2−/−, and EGR1−/− mice, in a 1:1:1 mix, to recipient wild-type, FPR2−/−, or EGR1−/− mice, which then received S. aureus bacteria by intradermal injection into the ears (Fig. 4a). 3D-pictures of the infection site were taken at 10 h post infection using a confocal microscope and the number of recruited leukocytes was determined using an image analysis protocol. Data obtained in a given mouse were always normalized with regard to the corresponding infiltration into the spleen (Extended Data Fig. 5). We did not observe differences in the influx of leukocytes obtained from wild-type, EGR1−/− and FPR2−/− mice into the spleen (Fig. 4b), demonstrating that there are no differences in survival or general mobility defects associated with the used genotypes.
Figure 4. Leukocyte attraction via the FPR2-EGR1 pathway is direct and independent of resident skin cells.
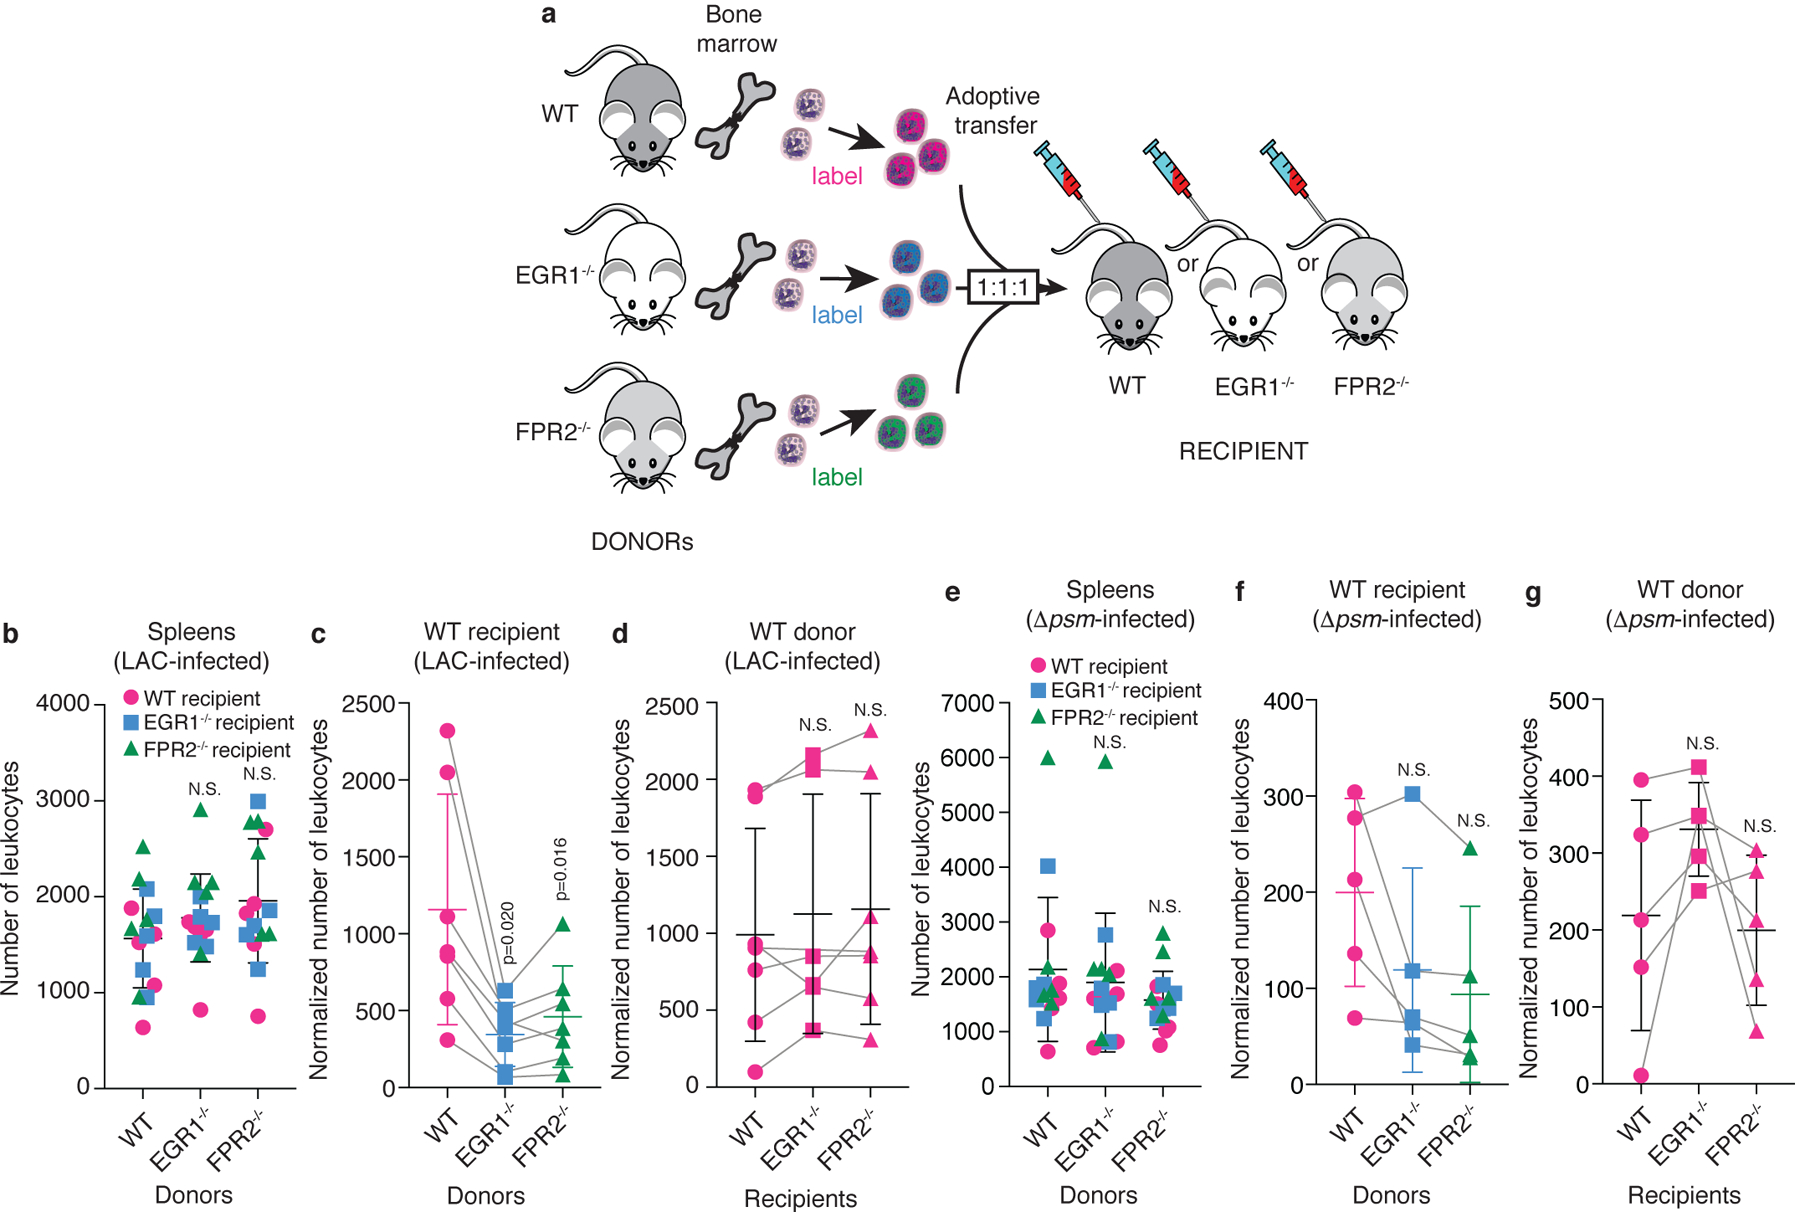
a, Scheme of experimental setup. Leukocytes were obtained from the bone marrow of wild-type, FPR2−/−, and EGR1−/− mice, labeled with different fluorescent dyes, mixed in equal amounts, and injected into wild-type, FPR2−/−, or EGR1−/− recipient mice. Leukocyte infiltration to the site of infection was imaged by confocal microscopy 10 h post infection with Alexa Fluor 700 NHS ester-labeled S. aureus LAC or Δpsm and fluorescence due to infiltrated leukocytes was analyzed as described in Methods, which included normalization to leukocyte infiltration into the spleen. Bacterial inocula were set up to be in the range of 1 – 2 × 10⁷ CFU and actual injected bacterial CFU were determined in the inocula: LAC, 1.27 ± 0.31(SD) × 107; Δpsm, 1.46 ± 0.19 (SD) × 107. Note that the absolute numbers of leukocytes varied in the 1:1:1 mixes, and each adoptive transfer experiment represents a separate experiment in a different mouse, which were combined in the data shown in panels b-g. Therefore, influx numbers show wide variation between experiments. This was addressed by using matched data (repeated measures) analyses. b, Infiltration of leukocytes obtained from the bone marrow of wild-type, FPR2−/−, and EGR1−/− mice into the spleen (setup with LAC infection of ears, n=5 mice). c, Ear infiltration results obtained with different donor leukocytes in wild-type recipient mice, and d, wild-type donor leukocytes in different recipient mice with LAC-infected mice. n=6–7. (Note that in some mice, both ears were used, which is why there are corresponding spleen values from only 5 mice in panel b.) e-g, Corresponding experiments with Δpsm-infected mice. (e, n=5; f,g, n=5) b,e, Statistical analysis is by 1-way ANOVA with Dunnett’s post-test (b) or Kruskal-Wallis test with Dunn’s multiple comparison test (e) versus WT (wild-type) donor mice. c,d,f,g, Statistical analysis is by repeated measures 1-way ANOVA with Dunnett’s post-test versus WT. b-g, Error bars show the mean ± SD. For comparisons with mixed n, a mixed model (rather than ANOVA) was automatically employed by Prism. Grey lines connect matched values. See Extended Data Fig. 6 for exemplary confocal pictures and illustration of image processing, and Extended Data Fig. 7 for the corresponding analyses with FPR2−/− and EGR1−/− recipient mice.
Influx of leukocytes from EGR1−/− and FPR2−/− donors to the infection site in wild-type recipient mice was significantly impaired as compared to leukocytes from wild-type donor mice (Fig. 4c, Extended Data Fig. 6). In contrast, there was no significant difference in the influx of wild-type donor leukocytes comparing wild-type, EGR1−/−, and FPR2−/− recipient mice (Fig. 4d). Corresponding results were obtained with EGR1−/− and FPR2−/− donor leukocyte versus recipient mice comparisons (Extended Data Fig. 7). These results demonstrate a key role of FPR2 and EGR1 in early leukocyte influx to the epithelial infection site and rule out a contribution of resident cells.
In experiments that used the Δpsm deletion strain for infection, we observed overall strongly reduced leukocyte infiltration, confirming the results shown in Fig. 1 (Fig. 4e–g, Extended Data Fig. 7). Influx of leukocytes from EGR1−/− and FPR2−/− donors to the infection site appeared lower as compared to leukocytes from wild-type donor mice, but this was significant only in FPR2−/− recipient mice (Fig. 4f, Extended Data Fig. 7). These results demonstrate the key importance of PSMs in attracting circulating leukocytes via FPR2 and EGR1, but also point to a possible minor contribution of other secreted S. aureus molecules. Notably, also with Δpsm infecting bacteria, we did not observe significant differences in the influx of any donor leukocytes comparing wild-type, EGR1−/−, and FPR2−/− recipient mice, demonstrating that resident cell activation is also not involved in the part of early leukocyte influx stimulation that is mediated by non-PSM molecules (Fig. 4g, Extended Data Fig. 7).
In addition to PSMs, the only known key secreted pro-inflammatory S. aureus molecules stimulating FPR2 are (non-PSM) formylated peptides, which stem from the general N-formylation of bacterial proteins during translation and which in contrast to PSMs mainly stimulate FPR1. We therefore tested the stimulation of EGR1−/− and FPR2−/− neutrophils by fMLP, a formylated peptide analog that generally stimulates FPR receptors34. There was a slight impact using FPR2−/− neutrophils, as expected, explaining at least in part the results we obtained with Δpsm infecting bacteria. However, there was no effect with EGR1−/− neutrophils, indicating, in accordance with previous results15, that signaling via PSMs is different from that generally exerted by formylated peptides (Extended Data Fig. 8). Thus, formylated peptides may represent at least some of the non-PSM secreted molecules underlying the additional, minor leukocyte attraction effects we observed with the Δpsm infecting strain.
Overall, the adoptive transfer experiments confirmed the key role of PSMs in S. aureus-stimulated leukocyte influx to the epithelial infection site and demonstrated that this effect is due to FPR2/EGR1 signaling. Furthermore, they indicated that this influx is dependent on the EGR1 and FPR2 status of the infiltrating leukocytes and not on any cells present in the recipient mice, indicating that EGR1-mediated leukocyte influx occurs via direct attraction of leukocytes by secreted S. aureus products.
Role of EGR1 and PSM recognition in infection control
To evaluate the role that EGR1 plays in the control of S. aureus skin infection, we used the conventional mouse back skin abscess model. In contrast to the ear infection model, which is optimized for intravital imaging of early events post infection that is not possible at other body sites, this model allows for the monitoring of abscesses that exceed the size of the ear, which frequently happens with virulent S. aureus at the doses commonly used for skin infection models. We injected equal amounts (1 × 10⁷ CFU) of wild-type S. aureus LAC or Δpsm deletion strains in wild-type or EGR1−/− mice and monitored abscess formation over 8 days post infection. Abscesses formed in EGR1−/− mice by wild-type LAC bacteria were significantly larger over the entire time frame than those formed in in wild-type mice, emphasizing the key role EGR1 plays in the control of S. aureus skin infection (Fig. 5a,b), although we cannot completely rule out a possible minor contribution of the slightly different genetic background of the EGR1−/− mice (B6 versus B6N of wild-type mice). Furthermore, the absence of a significant difference between EGR1−/− and wild-type mice infected with Δpsm S. aureus links this effect to the recognition of PSMs we describe herein.
Figure 5. EGR1 signaling has a significant impact on S. aureus skin infection.
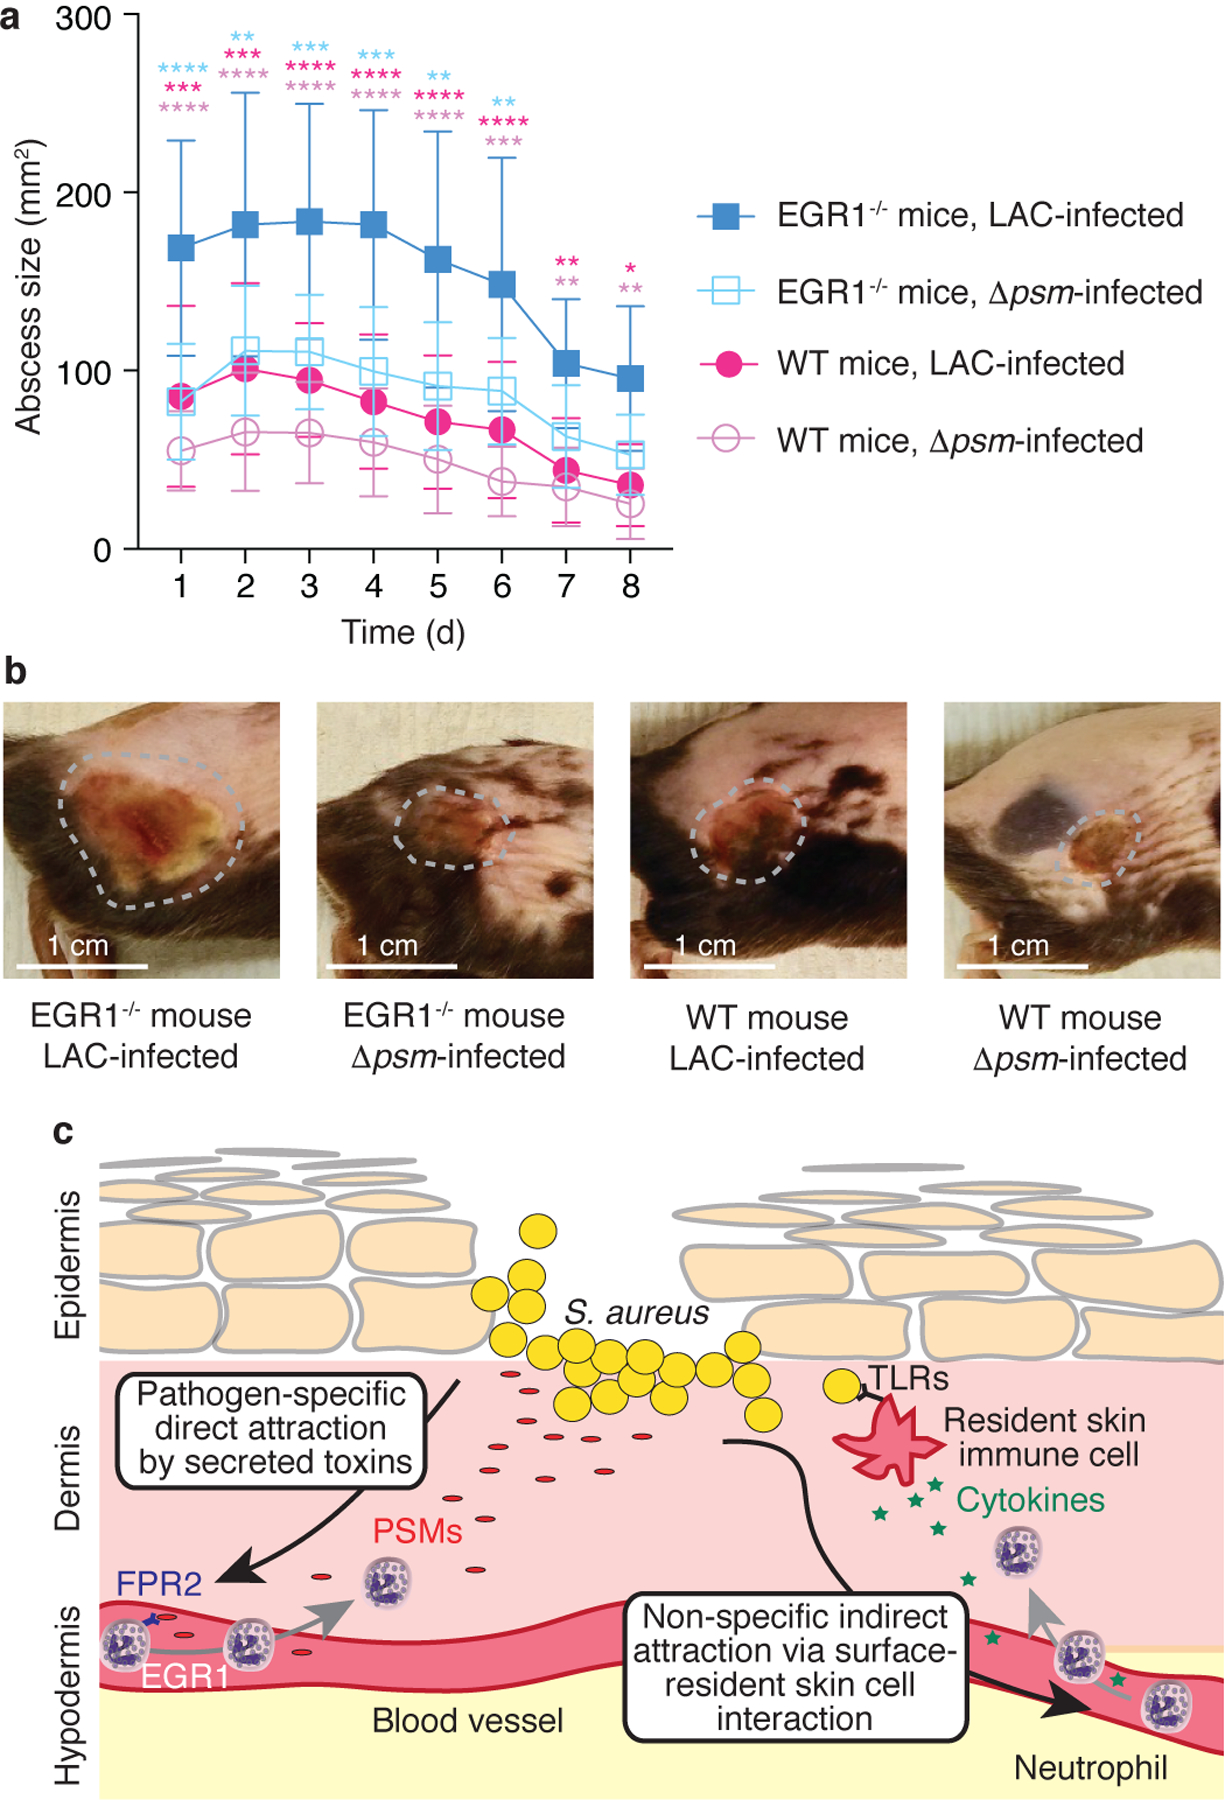
a, Back skin abscess model. Mice were shaved on the back and infected with 1 × 10⁷ CFU of the indicated bacteria in 50 μl of PBS subcutaneously into the left and right flank. Abscess sizes were measured daily. n=8–10/group. Statistical analysis is by repeated measures 2-way ANOVA (or mixed model) with Tukey’s post-tests. Results of the statistical analysis are shown using asterisks (****, p<0.0001; ***, p<0.001; **, p<0.01; *, p<0.05) with the colors indicating the group against which the post-tests compared the LAC-infected EGR1−/− group. No comparisons other than those indicated versus the LAC-infected EGR1−/− mice group were statistically significant. Error bars show the mean ± SD. b, Representative examples of abscesses on day 3. Abscesses were selected that were close to the average size within each group. c, Model comparing the canonical (right) versus the EGR1-mediated, toxin-triggered mechanism of leukocyte attraction to the infection site (left). The EGR1-mediated mechanism directly senses secreted, pathogen-derived molecules (PSMs) as opposed to the surface-located molecules (lipopolysaccharide, lipoteichoic acid, and others) that are widely conserved throughout Gram-positive or Gram-negative bacteria and sensed commonly by receptors of the Toll-like receptor (TLR) family in the canonical pathway. In contrast to the canonical pathway, which cannot distinguish between bacteria with different pathogenicity, the EGR1-mediated pathway is thus pathogen-specific and not dependent on the prior activation of and cytokine release by resident skin cells.
Discussion
Our study describes a mechanism of direct leukocyte attraction during skin infection by secreted bacterial toxins, which is mediated by a transcriptional response that is centered on and likely largely controlled by the transcription factor EGR1 (see model in Fig. 5c). EGR1 has occasionally been previously implicated in the response to bacteria35–38, but the EGR1-activating substances in those studies were conserved surface-located PAMPs such as peptidoglycan39 or LPS40, or have remained unidentified. While EGR1 activation thus may show a baseline response to invariant surface PAMPs, according to our results, in S. aureus these responses by far do not reach the EGR1-activating capacity of PSMs. The notion of a predominant role of PSMs in triggering EGR1 and EGR1-mediated protective responses versus other possible EGR1 agonists present in S. aureus is reflected in our in-vitro gene expression and in-vivo abscess model results.
Our results illustrate that PSMs have two important functions that work in opposite fashion in respect to pathogen success. First, PSMs have the established role in pathogenesis that they exert primarily through their cytolytic function9,13. (Of note, the previously established contribution of PSMs to skin infection9 was only recognizable in the EGR1−/− mouse background and not in wild-type mice in our back skin infection model, as the dose was adjusted not to exceed our experimental endpoint of >30 mm in abscess diameter.) In contrast, as our results show, the host has evolved to recognize PSMs as key components of the invader’s pathogenic program to mount rapid and efficient countermeasures that significantly limit subsequent infection.
PSMs are also produced by some less pathogenic staphylococcal species17, but PSM production has been correlated with pathogenicity41; and particularly homologues of the PSMα peptides that we found to be predominant triggers of EGR1 are only secreted in considerable amounts in highly pathogenic S. aureus9,22. It is thus fair to assume that the same mechanism of leukocyte recruitment is also initiated by epithelial breach of less pathogenic staphylococci, but in a reduced fashion, in accordance with the notion of PSMs representing pathogenicity-dependent signals.
Being secreted as the primary translational product by a dedicated transporter, PSMs represent the most abundant N-formylated peptides in S. aureus secretions9,22,42. However, activation of FPR2 by PSMs is largely independent of N-formylation and PSMs activate other FPRs only to a very limited degree15. Thus, our results showing PSM- and FPR2-dependence imply that general neutrophil-chemoattractant N-formylated peptides43, which are produced by all bacteria independently of pathogenicity and activate predominantly FPR144, do not contribute to a considerable extent to the direct leukocyte recruitment effect we observed. Our results directly showing that EGR1 is not involved in mediating neutrophil stimulation as a response to fMLP are in further support of this notion.
In contrast to classical pathways of innate host defense that rely on invariant, surface-located bacterial triggers and primary activation of resident skin cells, the mechanism we describe provides for a pathogen-specific, rapid reaction. We speculate that the canonical mechanisms of recruitment, as well as later-onset indirect PSM-triggered responses13, may play a more important role in the later hours and days of infection, synergizing with the mechanism we have described. Our findings showing that there are defined high-alert responses to diffusible toxins of dangerous skin bacteria that precede the non-specific and indirect canonical leukocyte recruitment pathways call for a significant adjustment of our view of the innate immune response to infection.
Methods
No statistical methods were used to predetermine sample size. The experiments were not randomized, and the investigators were not blinded to allocation during experiments and outcome assessment.
Ethics statement
The animal experiments and protocols were performed according to the regulations of NIAID’s Division of Intramural Research Animal Care and Use Committee (DIR ACUC), animal study proposal LB1E. All animals were euthanized by CO2 at the end of the studies. Human neutrophils were isolated from venous blood of healthy volunteers in accordance with a protocol (No. 99-CC-0168) approved by the Institutional Review Board for Human Subjects, NIAID. Informed written consent was obtained from all volunteers.
Bacterial strains and growth conditions
S. aureus LAC is a community-associated methicillin-resistant clinical isolate of pulsed-field type USA300. Bacteria used in this study were the LAC wild-type (WT) strain, its isogenic Δpsmα mutant, and an isogenic mutant that was made totally PSM-deficient by sequential deletion of the psmα and psmβ genes in addition to abolishing translation of hld by changing the start codon (Δpsmαpsmβhld, or abbreviated in here to Δpsm)9,18.
Unless indicated otherwise, 1:100 dilutions of overnight bacterial cultures were grown to mid-log phase (~ 2 h) in tryptic soy broth (TSB) with shaking at 180 rpm at 37 °C. The bacterial cultures were then harvested, washed, and resuspended in sterile phosphate-buffered saline (PBS). Bacterial concentrations were determined spectrophotometrically at 600 nm optical density and verified by plating dilutions of the inoculum onto tryptic soy agar (TSA). In some experiments, supernatant filtrates were collected after 8 h post inoculation. The culture supernatants were filtered through PES filters (0.2 μm pore size, Millipore) and used fresh or stored at − 80 °C until needed.
Synthetic peptides
fMLP was purchased from Sigma. N-formyl methionine synthetic PSMα3 (fMEFVAKLFKFFKDLLGKFLGNN), PSMα3K12A (fMEFVAKLFKFFADLLGKFLGNN), and δ-toxin (fMAQDIISTIGDLVKWIIDTVNKFTKK) were obtained from commercial vendors at a purity of >95%. N-formylation is characteristic to PSMs as they are secreted without a signal peptide42. Dimethyl sulfoxide (DMSO) was used to reconstitute the PSM peptides at 10 mg/ml and further dilutions were made in water or PBS. For comparison of in-vivo effects of PSMα3 versus PSMα3K12A, PSM peptides originally resuspended in DMSO went through a purification procedure to remove DMSO and verify peptide concentrations. To that end, 100 μl of a 10 mg/ml PSM solution was applied to a Superdex Peptide 10/30 column (Cytiva) using an ÄKTA Pure protein purification system (Cytiva) and isocratic elution with 0.1% trifluoroacetic acid (TFA) in 30% acetonitrile at 0.5 ml/min. Peptide peaks were collected and lyophilized overnight using a FreeZone 4.5 Liter freeze dryer (Labconco). Peptides were resuspended in water, aliquoted, and stored at −20 °C until needed. Peak area absorption at 214 nm was used to quantify peptide amount and normalize peptide concentration.
Human neutrophil isolation
Human neutrophils were isolated from venous blood of healthy donors. The heparinized blood was incubated with an equal volume of 3% (v/v) dextran (Sigma) for 20 min to separate the erythrocytes. The clear supernatant above the erythrocytes was aspirated and leukocytes collected by centrifugation. The cell pellet was resuspended in 0.9% NaCl and layered with Ficoll Paque Plus (GE Healthcare). After centrifugation, the supernatant was discarded, and the remaining cell pellet was subjected to a brief hypotonic shock with pyrogen-free water. The cells were washed and resuspended in RPMI without phenol red (Gibco) supplemented with 10 mM [4-(2-hydroxyethyl)-1-piperazineethanesulfonic acid (RPMI/H)] (Sigma) to the desired concentration.
Human neutrophil microarray
Isolated human neutrophils (1 × 10⁷) were incubated in RPMI/H with synthetic PSMs at sublytic concentrations of PSMα3 (330 nM, 870 ng/ml), δ-toxin (330 nM, 992 ng/ml) or culture filtrate (1:600 dilution) of the indicated strains at 37 °C for 30, 60, or 180 minutes. To determine the sublytic concentrations that were used, concentration-dependent lysis of neutrophils was determined by lysis assays measuring release of lactate dehydrogenase (LDH) using the Cytotoxicity Detection Kit (Roche) (Extended Data Fig. 3). It was verified that with those concentrations of PSMs, there was detectable pro-inflammatory activity as determined by measuring expression of CD11b (Extended Data Fig. 3), which was measured by flow cytometry using phycoerythrin-conjugated mouse anti-human CD11b/MAC-1 antibody (BD Pharmingen) and a FACSCalibur flow cytometer (Becton Dickinson) using BD FACSDiva software version 6.0 as described9. The FPR2 inhibitor FLIPr23 was added in some experiments to determine the impact of signal transduction via FPR2. A final concentration of 2 μg/ml of FLIPr was used, which was determined to completely inhibit expression of CD11b at the used concentrations of stimulatory PSMs (Extended Data Fig. 3). Sample RNAs were then isolated using RNeasy Mini Kit (Qiagen) and transcriptional changes were measured using GeneChip HU133 plus 2.0 GeneChips (ThermoFisher, catalogue no. 902483) according to the manufacturer’s instructions. Microarray data were normalized using GeneChip Operating Software, and analyzed with Partek Genomics Suite (Partek, St. Louis, MO, USA). Genes were defined as differentially expressed if they were significantly different (p < 0.05, two-way ANOVA) and changed two-fold or greater in expression in the comparison of interest. Subsequent networks and functional analyses were generated through the use of IPA (QIAGEN Inc., https://www.qiagenbioinformatics.com/products/ingenuity-pathway-analysis).
qRT-PCR for signal pathway analysis and microarray validation
Isolated human neutrophils (1 × 10⁷) in RPMI/H were stimulated with PSMα3 (330 nM), DMSO control, culture filtrate (1:600 dilution) of the indicated strains, or filtered TSB as control, at 37 °C for 30 minutes. In some of the experiments, 2 μg/ml FLIPr, 10 μM SP600125, 10 μM SB202190, 10 μM U0126 (or between 1 and 100 μM for the dose-response experiment), 10 mM cyclosporin A, and 10 μM FK-506 were added to the samples. RNA was then isolated using an RNeasy Mini Kit (Qiagen), and samples were treated with DNAse using a DNA-free™ DNA Removal Kit (Invitrogen Life Technologies: AM1906).
Sample RNAs were subjected to One-Step SYBR® Green real-time PCR using the SuperScript® III Platinum ® SYBR® Green One-Step qRT-PCR Kit (Invitrogen Life Technologies) and an ABI 7500 thermocycler (Applied Biosystems) as described previously45. The expression level of EGR1 transcripts was normalized against the housekeeping gene glyceraldehyde 3-phosphate dehydrogenase (GAPDH) and calculated by the comparative CT method (ΔΔ CT method)46 and then expressed as the fold change compared to cells treated with DMSO or TSB. Primers were purchased from Qiagen (EGR1: QT00218505; GAPDH: QT00079247).
Mice
C57BL/6NCrl (wild-type; WT) were purchased from Charles River Laboratories. B6/m FPR-RS2 (−/−) mice (FPR2−/−) were obtained from J. M. Wang. B6N;129-Egr1tm1Jmi/J (EGR1−/−) mice were purchased from Jackson Laboratories. C57BL/6-Lysozymetm1M-GFP mice47, shared by Thomas Graf at Albert Einstein College of Medicine, were obtained from the NIAID/NIH Taconic Repository. This mouse strain produces green fluorescent neutrophils due to a GFP protein encoded downstream of the lysozyme M promoter. Lysozyme M (LysM) is highly expressed in neutrophils and at lower levels in other myeloid cells; therefore, neutrophils can be distinguished from other leukocytes on the basis of their morphology and strong GFP expression. Mice were bred and maintained under pathogen-free conditions in an AAALAC-accredited animal in the NIAID. Age-, sex-, and littermate-matched mice were randomly assigned into treatment groups in each experiment. Female mice aged between 6 – 8 weeks were used for experiments.
Ear infection and intravital confocal laser scanning microscopy (C-LSM)
All imaging experiments were performed at the Biological Imaging Section (NIH, NIAID) using a Leica DIVE (Deep In Vivo Explorer) inverted microscope (Leica Microsystems) equipped with MaiTai, InSight DeepSee, and a full range of visible light lasers (Spectra Physics). The microscope was additionally equipped with ultra-sensitive HyD detectors, an L 25.0 water-immersion objective, 0.95 NA (Leica Microsystems), a motorized stage, and an environmental chamber (NIH Division of Scientific Equipment and Instrumentation Services) to maintain 37 °C and 5 % CO2. A temperature sensor was positioned near the anesthetized animal.
Non-invasive intravital imaging of ears of anesthetized C57BL/6-Lysozymetm1M-GFP mice was performed hourly over the course of 6 h either immediately or 6 h after injection of bacteria (~ 1 – 2 × 10⁷ CFUs in 3 μl of sterile PBS intradermally into the pinnae of each ear) that were fluorescently labeled with Alexa Fluor 700 NHS Ester dye (see below), as well as for 1 h imaging at 18 h and 24 h after injection (yielding 0 – 6, 6 – 12, 18 and 24 h timepoints) and subjected to confocal microscopy. This setup was due to a maximally allowed time span in the animal protocol of 6 h for mouse imaging under these conditions, because longer periods under anesthesia may have a fatal outcome. In other experiments, mice were injected with pure PSM peptides dissolved in water instead of bacteria. Mai Tai was tuned to 880 nm excitation, and InSight to a 1150 nm excitation wavelength. A diode laser was used for 405 nm excitation, an Argon laser for 488 nm excitation, a HeNe laser for 594 nm excitation, and a HeNe laser for 633 nm and 700 nm excitation wavelengths. All lasers were tuned to minimal power (between 0.5 and 2 %).
To obtain labeled S. aureus for the inoculum, 1:100 dilutions of overnight cultures of S. aureus LAC were grown to mid-log phase (~ 2 h) in TSB with shaking at 180 rpm at 37 °C. The bacterial cultures were then harvested, washed, and resuspended in sterile PBS. 2 × 10⁹ CFU in 300 μl PBS were incubated with Alexa Fluor 700 NHS Ester dye (Life Technologies, A20010) at a final concentration of 5 μM for 20 min in a 37 °C incubator. To stop the reaction, 1 ml of sterile PBS was added, and the sample was incubated on ice for 10 min. The sample was washed twice with 1 ml PBS, resuspended in 500 μl of PBS, and ~ 1 – 2 × 10⁷ CFUs of labeled bacteria in 3 μl were injected in the ears. One hour prior to sacrifice, 25 μg of CD31 Alexa Flour 594 antibodies (Clone: MEC13.3, Biolegend) were intravenously delivered into the mice via retroorbital injections to stain blood vessels.
Between 0 to 6 h p. i., each image represents 1.9 mm × 1.9 mm fields. A larger 3 mm × 3 mm field was used to image timepoints beyond 6 hours p. i. because of greater neutrophil recruitment. Post-acquisition image processing was performed using LAS X (version 3.5.6, Leica, Wetzlar, Germany), Imaris (ver. 9.6.0, Bitplane/Andor Technology, Belfast, UK), and Huygens (SVI) software (version 20.10.1, Scientific Volume Imaging, Hilversum, The Netherlands). Imaris arithmetic XTension and surface region of interest (ROI) was used to mask out auto-fluorescent hair and other non-specific background signals. The spot module of Imaris was used to count the total number of GFP-positive leukocytes. Additionally, a threshold filter was applied to the mean GFP intensities for each image in order to specifically enumerate neutrophils, which express high GFP signal. Data are reported as total number of spots (cells)/volume (μm3).
For the measurement of the tissue bacterial burden, the ears from euthanized mice were harvested, cut into small pieces (< 0.1 mm2) using sterile scalpels, and placed into a 2-ml tube containing 500 μl of sterile PBS with 500 mg of 2-mm borosilicate glass beads (Sigma). Tissue samples were homogenized in a Fast Prep bead beater (MP Biomedicals) at 6 m/s twice for 20 s each. An aliquot of the homogenate was collected, diluted in PBS, plated onto TSB agar plates, and incubated overnight at 37 °C for CFU counting.
Adoptive transfer experiment
Bone marrow cells were flushed from femurs and tibias of WT, EGR1−/−, and FPR2−/− mice (sex, and age-matched, 6 – 21 weeks old) using sterile, cold PBS containing 2 mM EDTA, and filtered through a 40-μm filter. Red blood cells were then lysed with 1 ml ACK lysis buffer (GIBCO) at room temperature. After three minutes, 15 ml of cold PBS was added, and cells were washed twice with the same volume. Purified WT, EGR1−/−, and FPR2−/− bone marrow cells were then labeled with CellTrace Far Red (Life Technologies, C34564), CellTrace Violet (Life Technologies, C34557), and CellTrace CFSE (Life Technologies, C34554), respectively, according to the manufacturer’s instructions and recommended dilutions. The working concentrations of CellTrace Far Red, CellTrace Violet, CellTrace CFSE were 2 μM, 5 μM, and 5 μM respectively, and all staining was performed with at least 1 × 10⁸ cells/ml. The viability of labeled cells was assessed by the trypan blue exclusion method, cell numbers were normalized to equal proportions in PBS/2 mM EDTA, and the resulting 1:1:1 mixture of labeled cells was adoptively transferred via retroorbital injections into recipient 6 – 8 weeks-old WT, EGR1−/−, or FPR2−/− mice. While ascertaining a precise 1:1:1 mixture, absolute numbers of cells varied between 2 × 10⁷ and 8 × 10⁷ of each type of labeled cells in different experiments, because the maximally possible cell number was used as imposed by the cell type with the lowest yield. This resulted in varying absolute influx data between different mice, which was addressed by using a repeated measures statistical analysis.
Two hours after the transfer, ~ 1 – 2 × 10⁷ CFU of Alexa Fluor 700 NHS Ester dye (Life Technologies, A20010) labeled S. aureus LAC or Δpsm bacteria were intradermally injected into the ears. Both ears of each mouse were used. Data from all ears were included in the evaluation, unless the technically challenging injection of bacteria had failed. To obtain labeled S. aureus for the inoculum, 1:100 dilutions of overnight cultures of S. aureus LAC or Δpsm bacteria were grown to mid-log phase (~ 2 h) in TSB with shaking at 180 rpm at 37 °C. The bacterial cultures were then harvested, washed, and resuspended in sterile PBS. 2 × 10⁹ CFU in 300 μl PBS were incubated with Alexa Fluor 700 NHS Ester dye (Life Technologies, A20010) at a final concentration of 5 μM for 20 min in a 37 °C incubator. To stop the reaction, 1 ml of cold sterile PBS was added, and the sample was incubated on ice for 10 min. The sample was washed twice with 1 ml PBS, resuspended in 500 μl of PBS, and ~ 1 – 2 × 10⁷ CFUs of labeled bacteria in 3 μl were injected in the ears. One hour prior to sacrifice, 20 mg of anti-mouse CD31 Alexa Flour 594 antibody (Biolegend, 102520, clone MEC13.3, lot B216399) were intravenously delivered into the mice via retroorbital injections to stain blood vessels. Spleens and ears were harvested 10 h p. i. and subjected to confocal microscopy.
Images were deconvolved using Huygens Pro deconvolution software package (version 20.10.1, Scientific Volume Imaging, Hilversum, The Netherlands). Sequential Z-sections of stained cells were acquired for 3D reconstruction and surface modelling of representative cells with Imaris software (ver. 9.6.0, Bitplane/Andor Technology, Belfast, UK). 3D surface models of hair particles were used to create a masked channel and filter out non-specific staining. The spot module of Imaris was then used to specify numbers and location of different cell populations in the images. Hair masks were used again to filter out the non-specific spots from the dataset. 3D surface models of bacterial ROIs were created and distance transformation XTension of Imaris was used to measure the distance of all cells (defined as spots) from the bacterial ROIs. Numbers, intensities and distances of cell populations from bacterial ROIs were extracted and analyzed using Microsoft Excel and Graph Pad Prism software. The same method was used to determine leukocyte numbers in the spleen and ears, and the spleen values were used to normalize those obtained in the ears of a given mouse. To that end, the relative proportion of labeled leukocytes from different donors was determined in the spleen, that with the maximal value set to 1, and the reciprocal value of the other determined proportions used to correct ear data (ear value × 1/spleen proportion = normalized ear value).
Back skin infection model
The mouse back skin infection model was performed essentially as previously described9. Briefly, the dorsa were shaved, and fine hair was removed with the application of depilatory cream at least 24 hours prior to infection. Then, 1 × 10⁷ CFU of bacteria in 50 μl of PBS were injected subcutaneously into the left and right flank. Abscess sizes were determined at 24-h intervals using a digital camera. Images were loaded into ImageJ (version 1.53) and the entire abscess areas (mm2) were measured using a scale of 19.2 pixels/mm.
qRT-PCR of bacterial RNA transcripts from mouse tissue
Both ears of C57BL/6NCrl wild-type mice were intradermally injected with 1 × 10⁷ CFU of non-labeled S. aureus LAC. Three, 6 h, 9 h, 12 h, and 3 days post inoculation, each ear was collected and immersed into 1 ml of RNAlater solution (ThermoFisher Scientific) and stored at 4°C, until ready for processing. Ears were retrieved from the RNAlater solution and cut into small pieces (<0.1 mm2) in the presence of QIAzol Lysis Reagent (Qiagen), transferred into a 2-ml Lysing Matrix A tube (MP Biomedicals) and subsequently homogenized in a FastPrep-24 sample preparation system (MP Biomedicals). Genomic DNA was removed and total RNA extracted using the RNeasy Plus mini kit (Qiagen) according to the manufacturer’s protocol. The genomic DNA-free total RNA samples were treated with MICROBEnrich (Ambion/Life Technologies) to increase the concentration of prokaryotic RNA. RNA quality and concentration were assessed by use of a 2100 Bioanalyzer (Agilent Technologies). Samples were analyzed by qRT-PCR with primers specific for gyrB and psmα (synthesized by Sigma; gyrBFw, CAAATGATCACAGCATTTGGTACAG; gyrBRv, CGGCATCAGTCATAATGACGAT; psmalphaFw, TATCAAAAGCTTAATCGAACAATTC; psmalphaRv, CCCCTTCAAATAAGATGTTCATATC) as described above. Expression of psmα was measured relative to that of a housekeeping gene gyrB. Data for each time point are from four independent samples.
Neutrophil isolation from mouse bone marrow
Magnetic negative selection was used to purify neutrophils from bone marrow of mouse femurs and tibias as previously described48 with the following modifications. After flushing the bone marrow, red blood cells were lysed with 2 ml ACK lysis buffer (GIBCO) at room temperature for 2 minutes. Then, 10 ml of cold PBS/1% bovine serum albumin (BSA) (MP Biomedicals) was added to stop the reaction and cells were filtered through a 40-μm cell strainer (Fisher Scientific). The leukocytes, collected by centrifugation, were resuspended with 300 μl of cold PBS/1% BSA, and for negative selection incubated with biotinylated anti-mouse-B220 (BD Pharmingen, 553086, clone RA3–6B2, lot 5195834), anti-mouse-CD138 (BD Biosciences, 553713, clone 281–2, lot 9304708), anti-mouse-CD11c (BD Pharmingen, 553800, clone HL3, lot 0052274), anti-mouse-CD4 (BD Biosciences, 553649, clone H129.19, lot 8169517), anti-mouse-CD8a (BD Pharmingen, 553029, clone X53–6.7, lot 9092519), anti-mouse-CD49b (BD Biosciences, 553856, clone DX5, lot 8169517), anti-mouse-CD117 (BD Pharmingen, 553353, clone 2B8, lot 9042967) and anti-mouse-F4/80 antibodies (eBioscience, 13-4801-85, clone BM8, lot 2067000) for 15 minutes on ice. All antibodies were supplied at 0.5 mg/ml and used at 1:100 dilution. The leukocytes were then filtered through another 40-μm cell strainer (Fisher Scientific), collected by centrifugation, and then resuspended with 500 μl of cold PBS/1% BSA. Neutrophils were separated from the total population using Dynabeads™ M-280 Streptavidin (Thermo Fisher Scientific) and a DynaMag™-15 Magnet (Thermo Fisher Scientific) as per manufacturer protocols. Bone marrow-derived neutrophils were finally resuspended in RPMI/H.
Real-time calcium imaging
Murine neutrophils were suspended at a concentration of 5 × 10⁶ cells/ml in RPMI/H and incubated with ~ 2 mM Fluo3-AM (Invitrogen, F1242) for 20 minutes at 37 °C. Cells were then washed three times with HEPES buffer (10 mM HEPES, 137 mM NaCl, 2.7 mM KCl, 0.4 mM Na2HPO4, 5.6 mM Glucose, 1.8 mM CaCl2, 1.3 mM MgSO4 and 0.04% BSA, pH 7.4), resuspended to a concentration of 5 × 10⁵ cells/ml and dispensed into wells of a black 96-well plate (Costar) in 200-μl volumes. The plate was centrifuged at 240 × g for 5 minutes and calcium fluxes were monitored in a Spark® Multimode Microplate Reader (Tecan) by measuring fluorescence using excitation and emission wavelengths of 485 nm and 535 nm, respectively, with manual gain set to 50%. Five baseline measurements were collected 6 seconds apart prior to the addition of 100 × stocks of PSMs (200 nM) or fMLP (1, 10, 100 μM). Calcium fluxes were monitored for 3 minutes immediately afterwards at 6-second intervals. All incubations were performed at 31 – 33 °C. Fluorescence signals from the non-stimulated controls were subtracted from stimulated samples to account for background.
Statistics and reproducibility
Samples were compared using Prism 8 software (GraphPad Software, Inc., CA) by unpaired, two-tailed Student’s t-tests when comparing two, or one-way or two-way ANOVA when comparing more than two groups. In ANOVAs, Tukey’s or Dunnett’s post-tests were used. The Prism program automatically uses a mixed model instead of ANOVA with different numbers per group. ANOVAs were only used when data passed normality tests (Anderson-Darling, D’Agostino-Pearson, Shapiro-Wilk, Kolmogorov-Smirnov). Otherwise, non-parametric tests were used. All error bars show the mean ± standard deviation (SD). Experiments were not repeated independently in addition to the number of repeats indicated.
Extended Data
Extended Data Fig. 1. Bacterial numbers and psm gene expression during early ear infection.
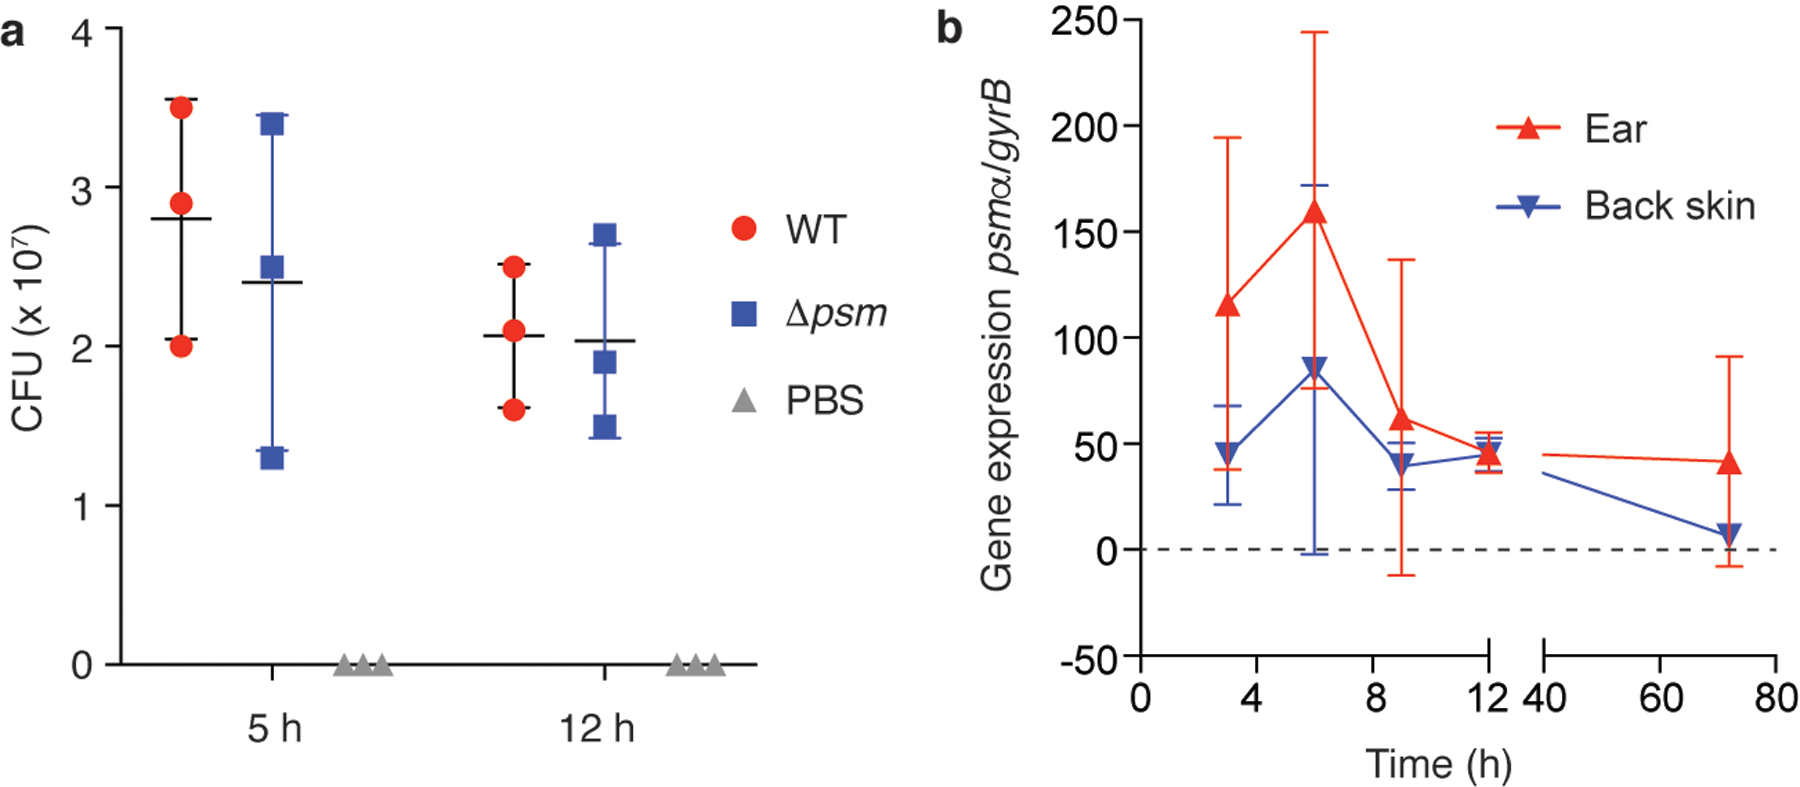
a, CFU in ears infected with wild-type LAC or Δpsm S. aureus, and with PBS as control to analyze for contaminating skin bacteria. n=3/group. b, Expression of the psmα locus by S. aureus LAC bacteria during early ear and back skin infection. n=4/group and time point. a,b, Error bars show the mean ± SD.
Extended Data Fig. 2. S. aureus PSM toxins are critical to the early leukocyte influx to the site of skin infection – Experiments with pure peptides.
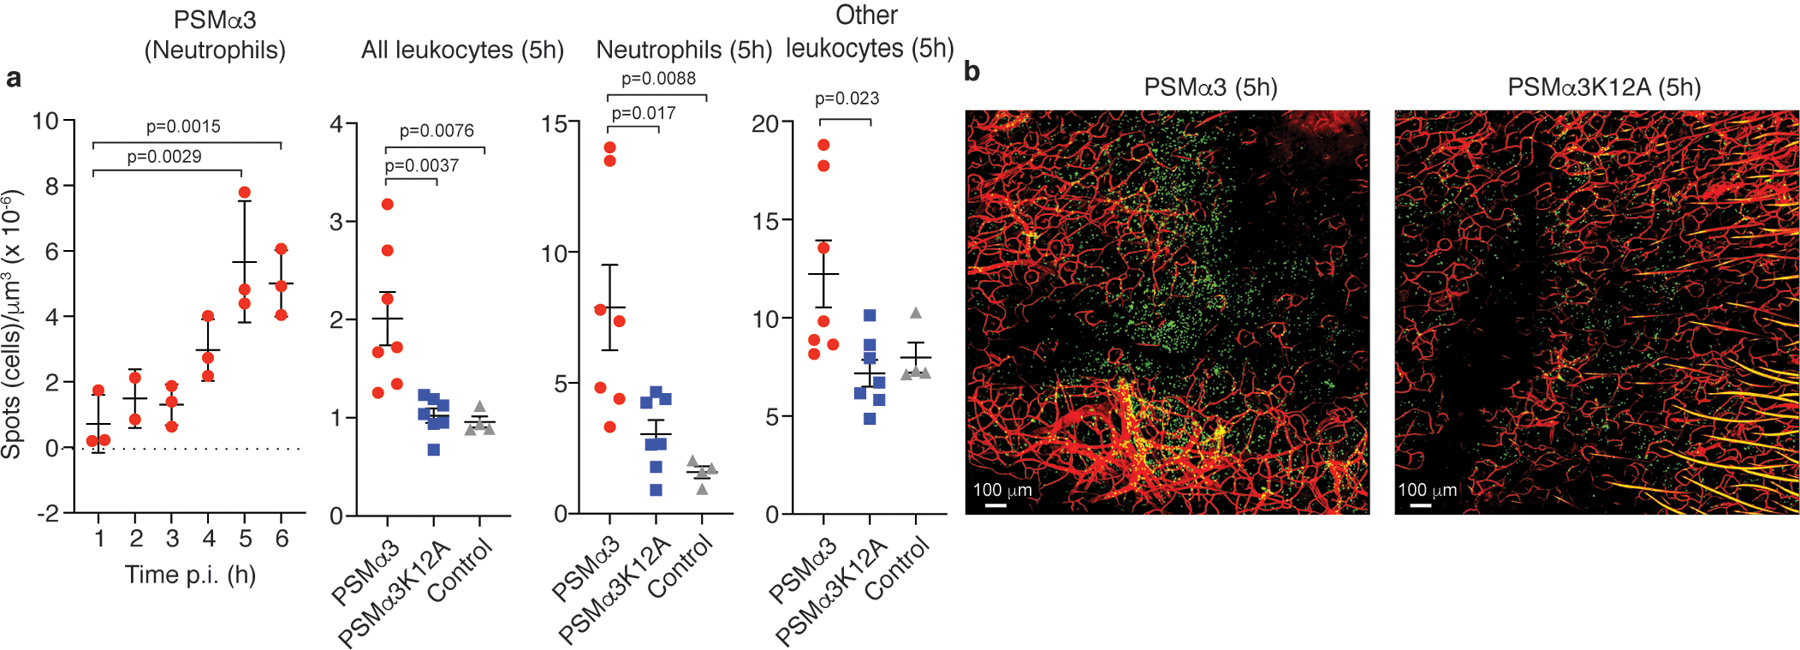
a, Neutrophil influx measured after injection of 3 μl of a 1 μM solution of PSMα3 peptide in water over 6 h p. i. (n=3), and influx of total leukocytes, neutrophils, and non-neutrophil leukocytes 5 h p. i. after injection of 3 μl of a 1 μM solution of PSMα3 or PSMα3K12A, or 3 μl water as control. n=7/group (peptides); n=4/group (water control). Statistical analysis is by 1-way ANOVA with Dunnett’s post-test versus the data obtained at 1 h p. i. (left panel) or Tukey’s post-tests (other panels). Error bars show the mean ± SD. b, Selected representative images. Green, leukocytes; red, blood vessels.
Extended Data Fig. 3. Establishment of sublytic and pro-inflammatory culture filtrate dilutions or pure PSMs and impact of FLIPr.
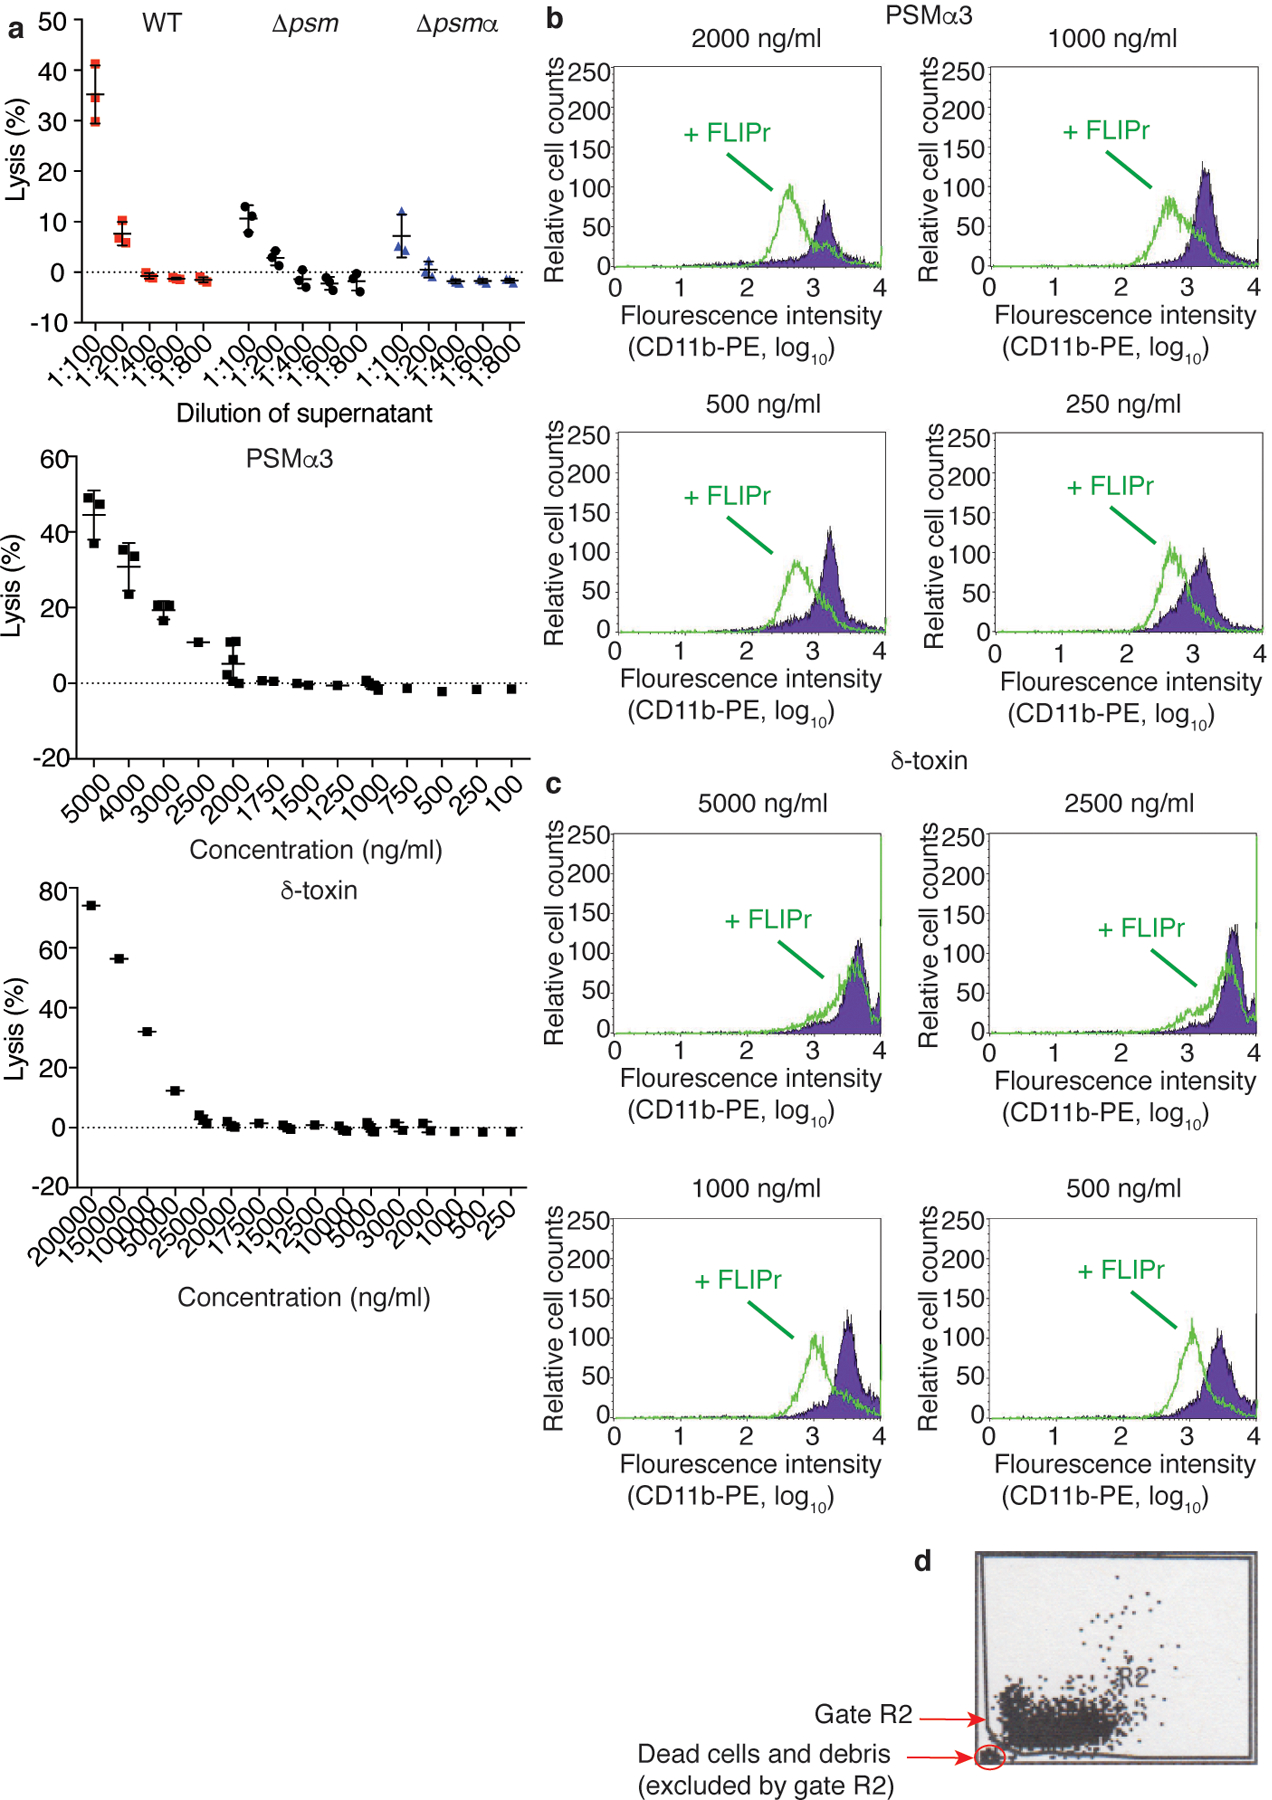
a, Test of S. aureus culture filtrate dilutions and PSMα3 and δ-toxin concentrations on cytolytic activity toward human neutrophils by release of LDH. n=3/group. Error bars show the mean ± SD. b-d, Test by flow cytometry of the impact of FLIPr (green line) on blocking of induced pro-inflammatory effect in human neutrophils (expression of CD11b) by different concentrations of PSMα3 or δ-toxin. FLIPr was tested at concentrations between 0.5 and 10 μg/ml. Shown are the 0.5 μg/ml results for PSMα3 and the 1.0 μg/ml results for δ-toxin. Tests were performed ranging from n=1 to n=6 at concentrations close to the range of interest. A gate was set during data analysis to exclude dead cells and debris (as indicated in panel d). Error bars show the mean ± SD.
Extended Data Fig. 4. Verification of differential EGR1 expression in selected comparisons by qRT-PCR.
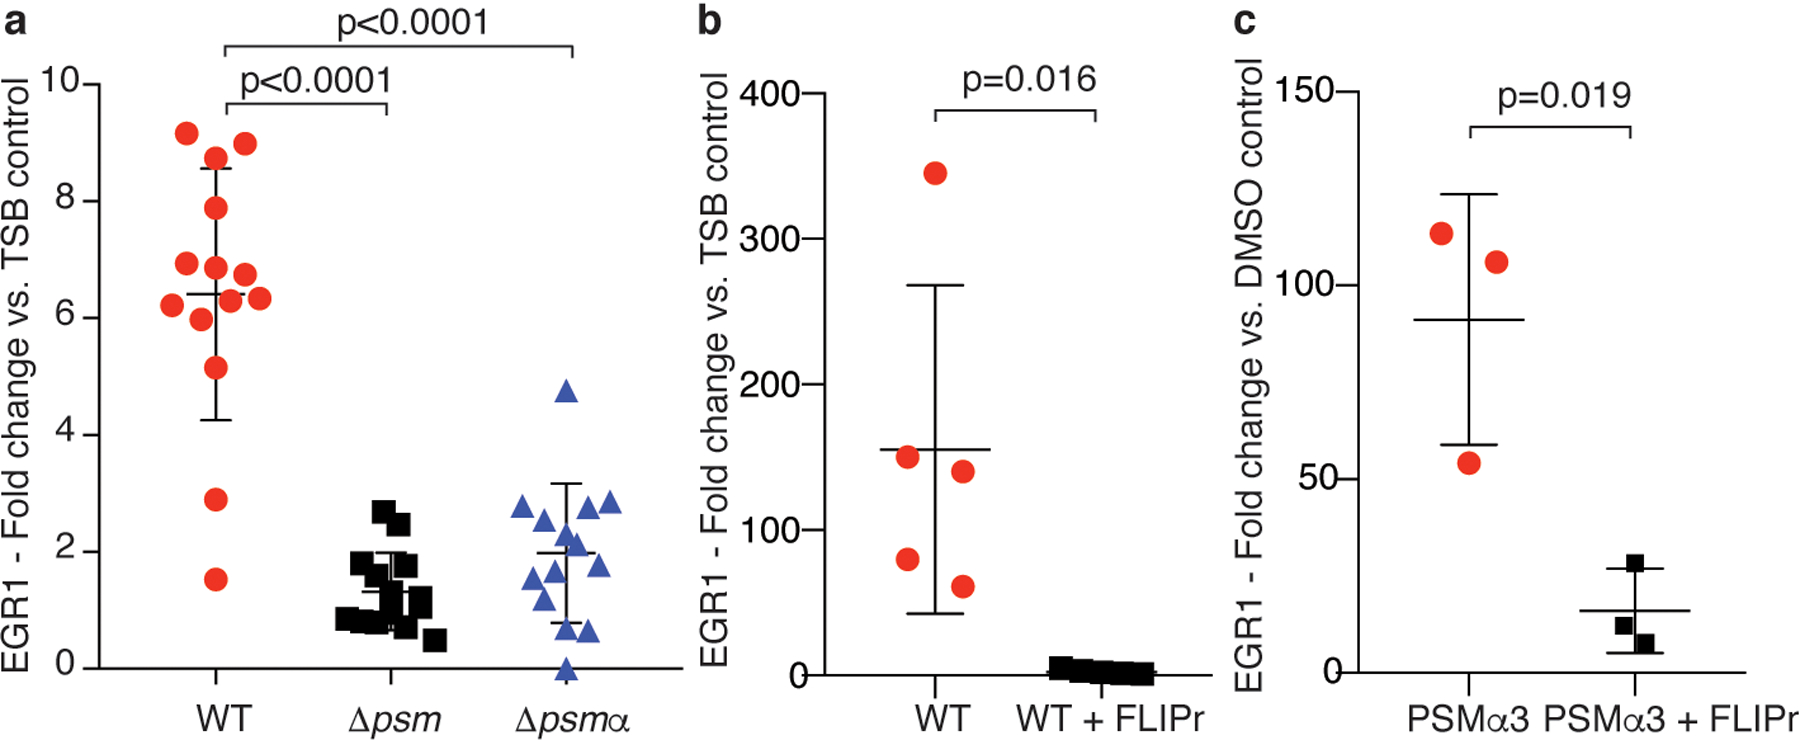
a, Comparison of the impact of diluted culture filtrates of S. aureus wild-type (WT) versus Δpsm and Δpsmα mutants on EGR1 expression in human neutrophils. Statistical analysis is by 1-way ANOVA with Tukey’s post-test. n=14. b, Impact of FLIPr on stimulation by S. aureus WT culture filtrate. n=5. c, Impact of FLIPr on stimulation by PSMα3. n=3. b,c, Statistical analysis is by two-tailed unpaired Student’s t-test. a-c, Error bars show the mean ± SD.
Extended Data Fig. 5. Determination of leukocyte infiltration into spleens for normalization in the adoptive transfer experiment.

a-c, Exemplary confocal pictures of spleens. Leukocytes were labeled with different dyes and visualized as follows: leukocytes from wild-type mice in magenta, from FPR2−/− mice in green, and from EGR1−/− mice in blue. Note that computation and analysis was performed in a 3D manner; the pictures only show 2D slices. The exemplary pictures shown here are from the same mice as those in Extended Data Fig. 6.
Extended Data Fig. 6. Leukocyte attraction via the FPR2-EGR1 pathway is direct and independent of resident skin cells – exemplary confocal microscopy pictures.
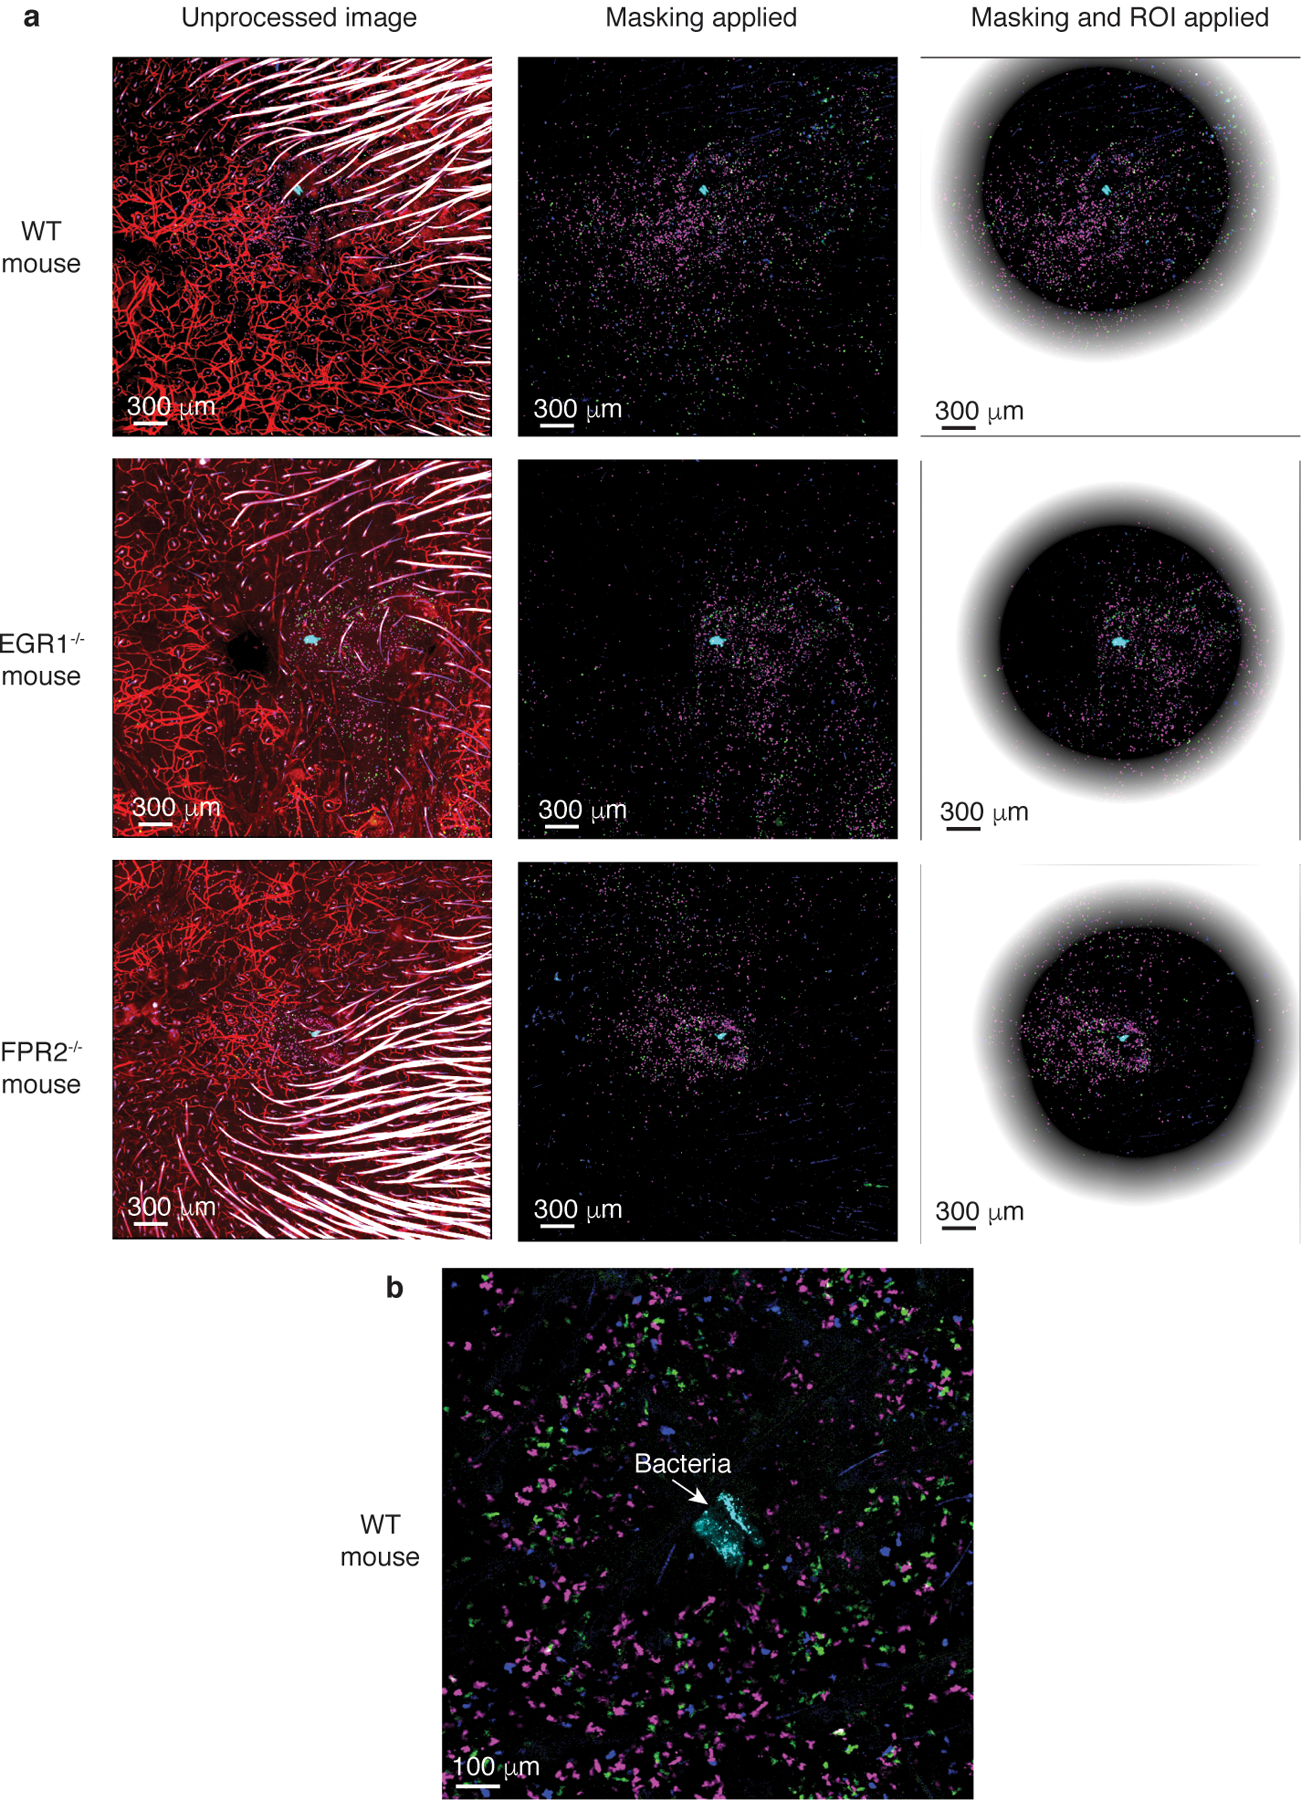
a, The pictures show the unprocessed images and the two steps of processing: masking of hairs and ROI determination (see methods). Leukocytes are labeled with different dyes: leukocytes from wild-type mice in magenta, from FPR2−/− mice in green, and from EGR1−/− mice in blue. Dye-labeled bacteria are in cyan. Central, non-shaded areas represent the analyzed, computed regions of interest (ROIs). Note that computation and analysis was performed in a 3D manner; the pictures only show 2D slices. b, Processed WT mouse picture in higher magnification centered on the injected bacteria. The exemplary pictures shown here are from the same mice as those in Extended Data Fig. 5 showing spleen controls.
Extended Data Fig. 7. Leukocyte attraction via the FPR2-EGR1 pathway is direct and independent of resident skin cells – FPR2−/− and EGR1−/− comparisons.
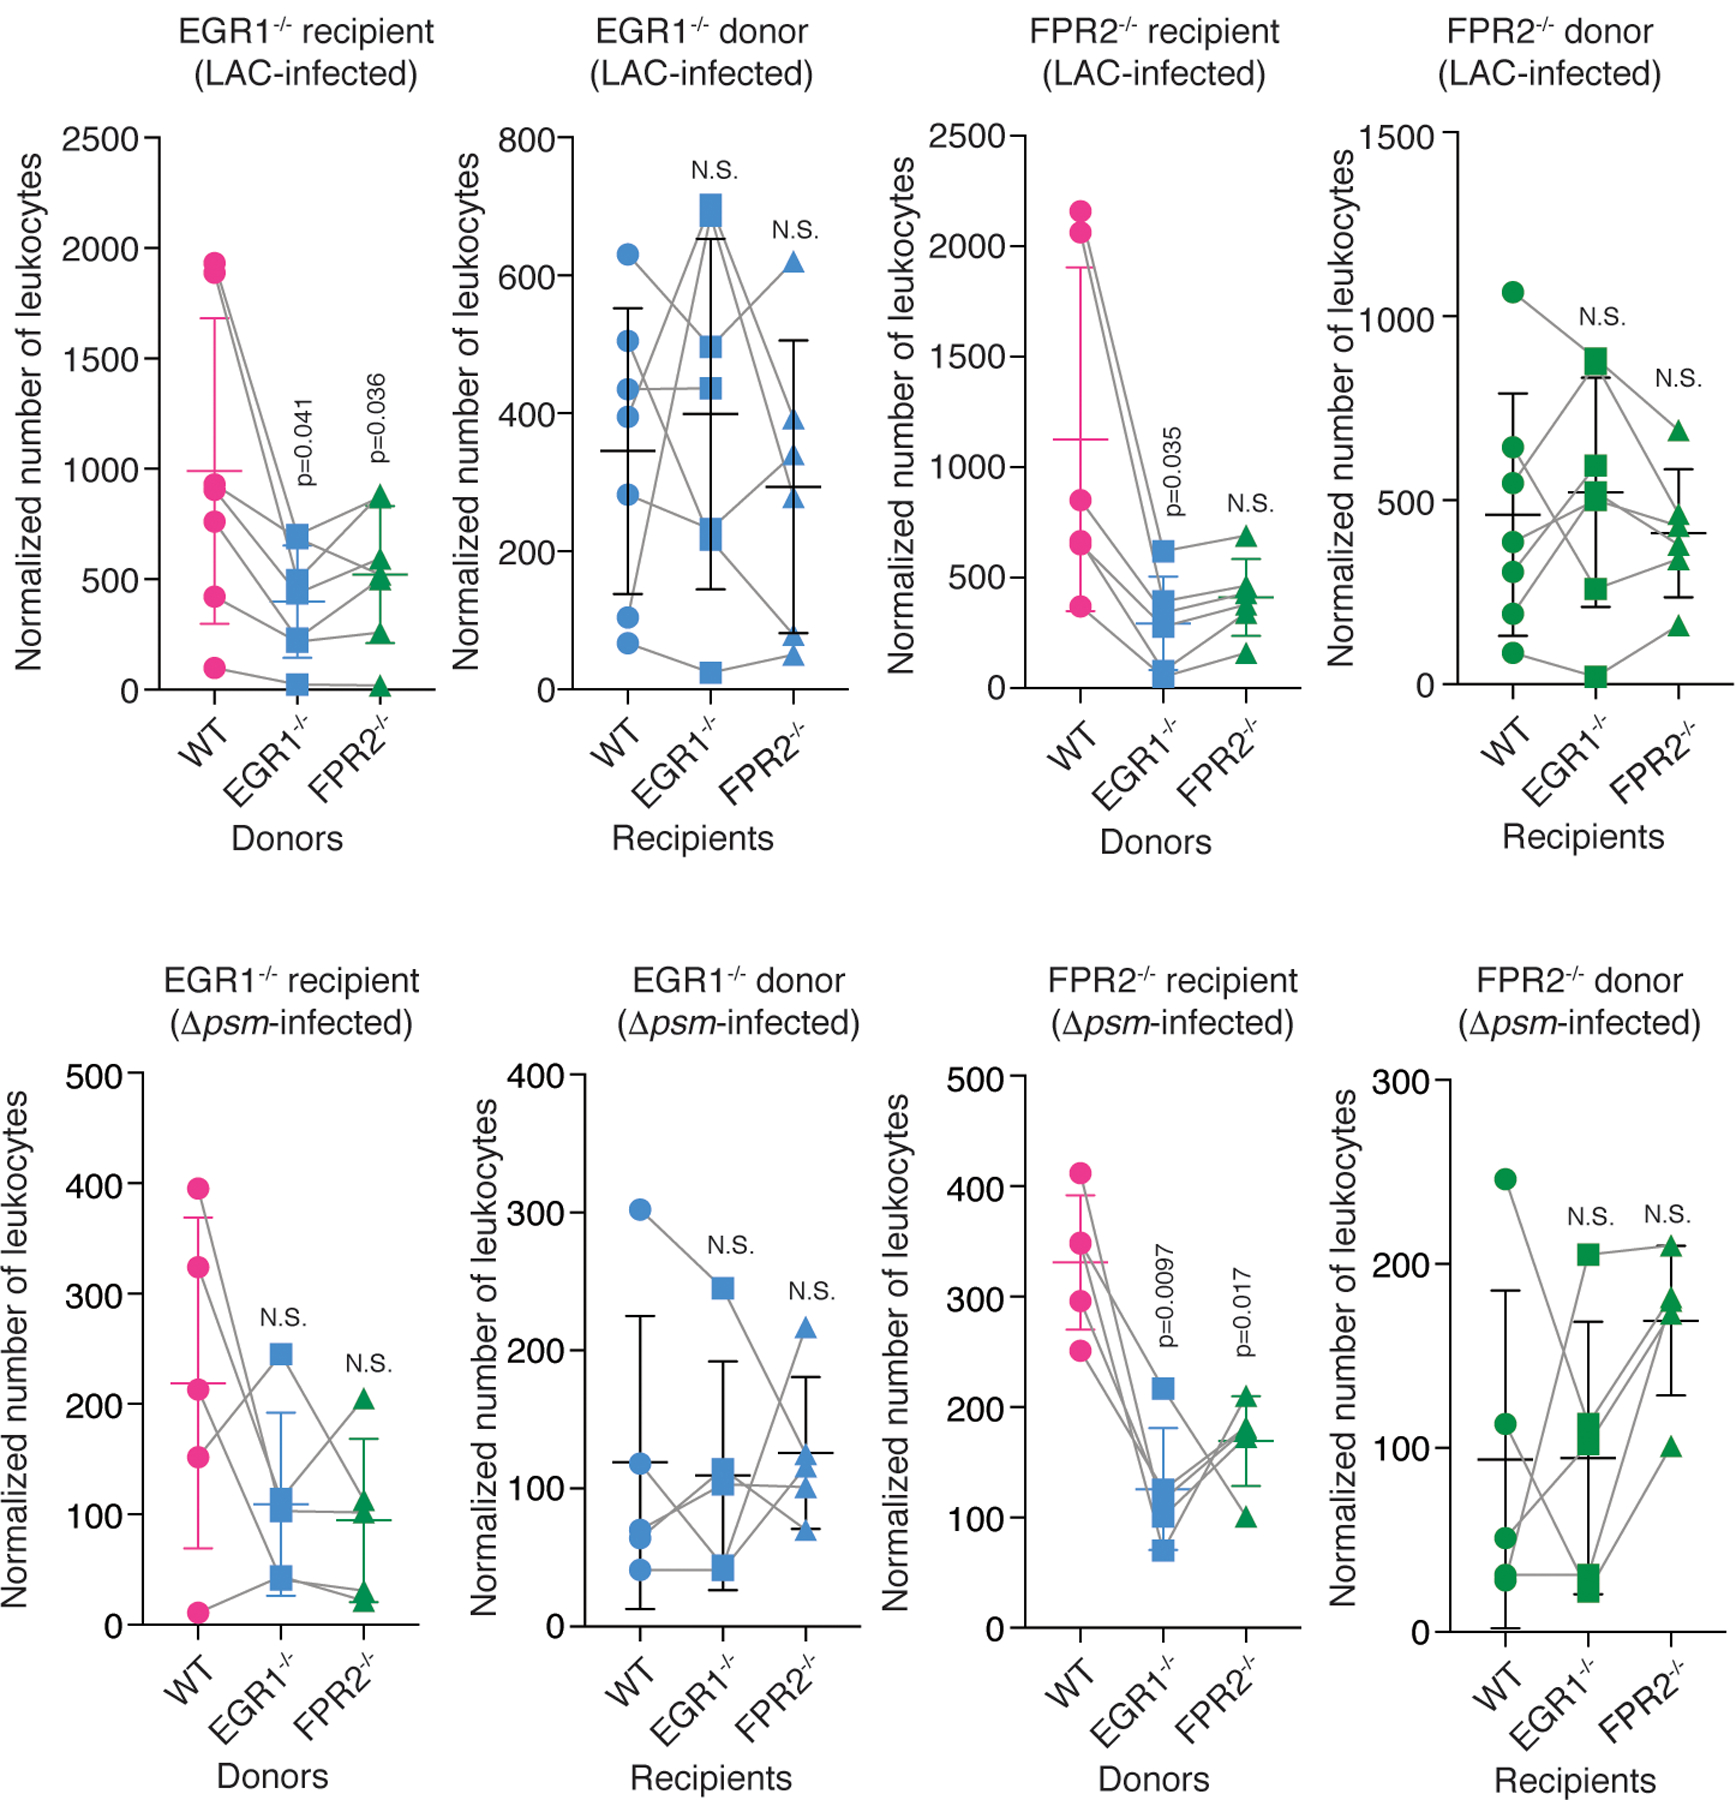
Shown are the comparisons with FPR2−/− and EGR1−/− recipient mice versus FPR2−/− and EGR1−/− donor leukocyte comparisons, in analogy to the comparisons with wild-type recipient mice versus wild-type donor leukocytes shown in Fig. 4c,d,f,g. Statistical analysis is by repeated measures ANOVA with Dunnett’s post-test versus WT (wild-type). Error bars show the mean ± SD. n=4–6. For the comparisons with mixed group numbers, a mixed model (rather than ANOVA) was automatically employed by Prism for data analysis.
Extended Data Fig. 8. Activation of mouse neutrophils by fMLP.
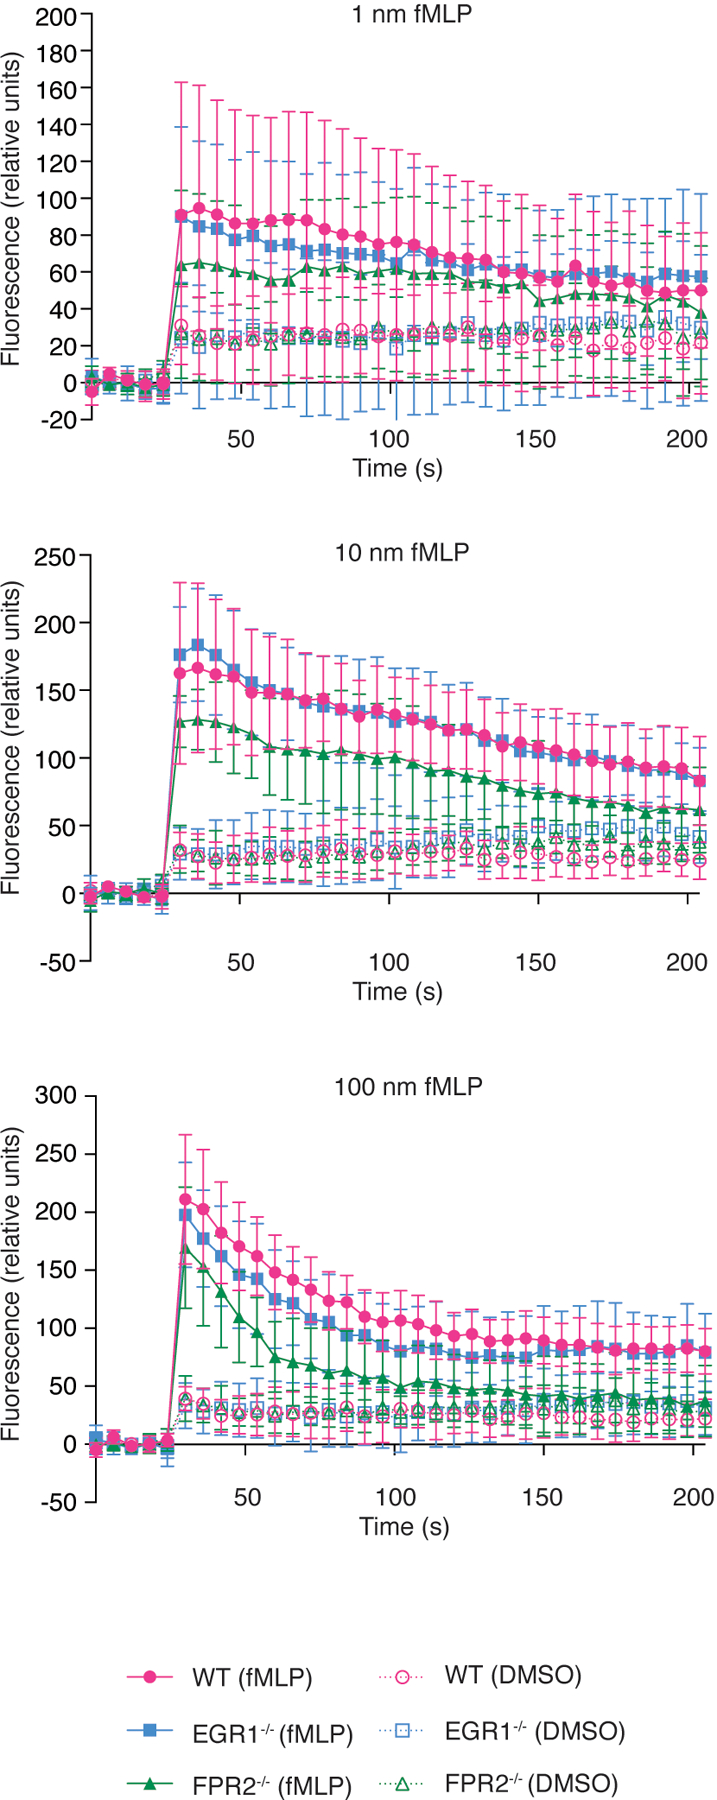
Neutrophil activation was assessed by determination of Ca2+ flux. 1 × 10⁵ neutrophils isolated from wild-type, EGR1−/−, and FPR2−/− mice were stimulated with fMLP in DMSO at the indicated concentrations. DMSO controls are shown. Error bars show the mean ± SD. n=8/group.
Supplementary Material
Source Data Fig. 1 Numerical source data and associated statistical analysis
Source Data Fig. 2 Numerical source data and associated statistical analysis
Source Data Fig. 3 Numerical source data and associated statistical analysis
Source Data Fig. 4 Numerical source data and associated statistical analysis
Source Data Fig. 5 Numerical source data and associated statistical analysis
Source Data Extended Data Fig. 1 Numerical source data
Source Data Extended Data Fig. 2 Numerical source data and associated statistical analysis
Source Data Extended Data Fig. 3 Numerical source data
Source Data Extended Data Fig. 4 Numerical source data and associated statistical analysis
Source Data Extended Data Fig. 7 Numerical source data and associated statistical analysis
Source Data Extended Data Fig. 8 Numerical source data
Acknowledgements
This study was supported by the Intramural Research Program of the National Institute of Allergy and Infectious Diseases (NIAID) and the National Cancer Institute (NCI), U.S. National Institutes of Health (NIH), project numbers ZIA AI000904 (M.O.), ZIA AI001079 (F.R.D.), ZIA AI001171 (D.E.B.), ZIA BC010725 (J.M.W.), and by federal funds from the NCI (contract no. HSN261200800001E, to J.M.W.). F.M.F.A received a scholarship from Shaqra University, Al Quwaiiyah, Saudi Arabia. The authors thank Kok van Kessel, University of Utrecht, for supplying FLIPr.
Footnotes
Competing interests
The authors declare that there are no conflicts of interest.
Data availability
Microarray data have been deposited in NCBI’s Gene Expression Omnibus and are accessible through GEO Series accession number GSE103779. All other data generated or analyzed during this study are included in this published article or in the supplementary information files.
References
- 1.Grice EA & Segre JA The skin microbiome. Nat Rev Microbiol 9, 244–253, doi: 10.1038/nrmicro2537 (2011). [DOI] [PMC free article] [PubMed] [Google Scholar]
- 2.Naik S et al. Commensal-dendritic-cell interaction specifies a unique protective skin immune signature. Nature 520, 104–108, doi: 10.1038/nature14052 (2015). [DOI] [PMC free article] [PubMed] [Google Scholar]
- 3.Klevens RM et al. Invasive methicillin-resistant Staphylococcus aureus infections in the United States. JAMA 298, 1763–1771, doi: 10.1001/jama.298.15.1763 (2007). [DOI] [PubMed] [Google Scholar]
- 4.Moran GJ et al. Methicillin-resistant S. aureus infections among patients in the emergency department. N Engl J Med 355, 666–674, doi: 10.1056/NEJMoa055356 (2006). [DOI] [PubMed] [Google Scholar]
- 5.Kolaczkowska E & Kubes P Neutrophil recruitment and function in health and inflammation. Nat Rev Immunol 13, 159–175, doi: 10.1038/nri3399 (2013). [DOI] [PubMed] [Google Scholar]
- 6.Krishna S & Miller LS Innate and adaptive immune responses against Staphylococcus aureus skin infections. Semin Immunopathol 34, 261–280, doi: 10.1007/s00281-011-0292-6 (2012). [DOI] [PMC free article] [PubMed] [Google Scholar]
- 7.Kumar H, Kawai T & Akira S Pathogen recognition by the innate immune system. Int Rev Immunol 30, 16–34, doi: 10.3109/08830185.2010.529976 (2011). [DOI] [PubMed] [Google Scholar]
- 8.Sadik CD & Luster AD Lipid-cytokine-chemokine cascades orchestrate leukocyte recruitment in inflammation. J Leukoc Biol 91, 207–215, doi: 10.1189/jlb.0811402 (2012). [DOI] [PMC free article] [PubMed] [Google Scholar]
- 9.Wang R et al. Identification of novel cytolytic peptides as key virulence determinants for community-associated MRSA. Nat Med 13, 1510–1514, doi: 10.1038/nm1656 (2007). [DOI] [PubMed] [Google Scholar]
- 10.Surewaard BG et al. Staphylococcal alpha-phenol soluble modulins contribute to neutrophil lysis after phagocytosis. Cell Microbiol 15, 1427–1437, doi: 10.1111/cmi.12130 (2013). [DOI] [PMC free article] [PubMed] [Google Scholar]
- 11.Cassat JE et al. A secreted bacterial protease tailors the Staphylococcus aureus virulence repertoire to modulate bone remodeling during osteomyelitis. Cell Host Microbe 13, 759–772, doi: 10.1016/j.chom.2013.05.003 (2013). [DOI] [PMC free article] [PubMed] [Google Scholar]
- 12.Kobayashi SD et al. Comparative analysis of USA300 virulence determinants in a rabbit model of skin and soft tissue infection. J Infect Dis 204, 937–941, doi: 10.1093/infdis/jir441 (2011). [DOI] [PMC free article] [PubMed] [Google Scholar]
- 13.Nakagawa S et al. Staphylococcus aureus Virulent PSMalpha Peptides Induce Keratinocyte Alarmin Release to Orchestrate IL-17-Dependent Skin Inflammation. Cell Host Microbe 22, 667–677 e665, doi: 10.1016/j.chom.2017.10.008 (2017). [DOI] [PMC free article] [PubMed] [Google Scholar]
- 14.Weiss E et al. Formyl-peptide receptor 2 governs leukocyte influx in local Staphylococcus aureus infections. FASEB J, doi: 10.1096/fj.201700441R (2017). [DOI] [PMC free article] [PubMed] [Google Scholar]
- 15.Kretschmer D et al. Human formyl peptide receptor 2 senses highly pathogenic Staphylococcus aureus. Cell Host Microbe 7, 463–473, doi: 10.1016/j.chom.2010.05.012 (2010). [DOI] [PMC free article] [PubMed] [Google Scholar]
- 16.Peschel A & Otto M Phenol-soluble modulins and staphylococcal infection. Nat Rev Microbiol 11, 667–673, doi: 10.1038/nrmicro3110 (2013). [DOI] [PMC free article] [PubMed] [Google Scholar]
- 17.Cheung GY, Joo HS, Chatterjee SS & Otto M Phenol-soluble modulins--critical determinants of staphylococcal virulence. FEMS Microbiol Rev 38, 698–719, doi: 10.1111/1574-6976.12057 (2014). [DOI] [PMC free article] [PubMed] [Google Scholar]
- 18.Joo HS, Cheung GY & Otto M Antimicrobial activity of community-associated methicillin-resistant Staphylococcus aureus is caused by phenol-soluble modulin derivatives. J Biol Chem 286, 8933–8940, doi: 10.1074/jbc.M111.221382 (2011). [DOI] [PMC free article] [PubMed] [Google Scholar]
- 19.Hanzelmann D et al. Toll-like receptor 2 activation depends on lipopeptide shedding by bacterial surfactants. Nat Commun 7, 12304, doi: 10.1038/ncomms12304 (2016). [DOI] [PMC free article] [PubMed] [Google Scholar]
- 20.Queck SY et al. RNAIII-independent target gene control by the agr quorum-sensing system: insight into the evolution of virulence regulation in Staphylococcus aureus. Mol Cell 32, 150–158, doi: 10.1016/j.molcel.2008.08.005 (2008). [DOI] [PMC free article] [PubMed] [Google Scholar]
- 21.Cheung GY et al. Insight into structure-function relationship in phenol-soluble modulins using an alanine screen of the phenol-soluble modulin (PSM) alpha3 peptide. FASEB J 28, 153–161, doi: 10.1096/fj.13-232041 (2014). [DOI] [PMC free article] [PubMed] [Google Scholar]
- 22.Cheung GY et al. Staphylococcus epidermidis strategies to avoid killing by human neutrophils. PLoS Pathog 6, e1001133, doi: 10.1371/journal.ppat.1001133 (2010). [DOI] [PMC free article] [PubMed] [Google Scholar]
- 23.Prat C, Bestebroer J, de Haas CJ, van Strijp JA & van Kessel KP A new staphylococcal anti-inflammatory protein that antagonizes the formyl peptide receptor-like 1. J Immunol 177, 8017–8026 (2006). [DOI] [PubMed] [Google Scholar]
- 24.Brown TJ, Rowe JM, Liu JW & Shoyab M Regulation of IL-6 expression by oncostatin M. J Immunol 147, 2175–2180 (1991). [PubMed] [Google Scholar]
- 25.Schutyser E, Struyf S & Van Damme J The CC chemokine CCL20 and its receptor CCR6. Cytokine Growth Factor Rev 14, 409–426 (2003). [DOI] [PubMed] [Google Scholar]
- 26.Kobayashi Y The role of chemokines in neutrophil biology. Front Biosci 13, 2400–2407 (2008). [DOI] [PubMed] [Google Scholar]
- 27.Bertheloot D & Latz E HMGB1, IL-1alpha, IL-33 and S100 proteins: dual-function alarmins. Cell Mol Immunol 14, 43–64, doi: 10.1038/cmi.2016.34 (2017). [DOI] [PMC free article] [PubMed] [Google Scholar]
- 28.Greenblatt MB, Aliprantis A, Hu B & Glimcher LH Calcineurin regulates innate antifungal immunity in neutrophils. J Exp Med 207, 923–931, doi: 10.1084/jem.20092531 (2010). [DOI] [PMC free article] [PubMed] [Google Scholar]
- 29.Abdel-Latif MM et al. Helicobacter pylori activates the early growth response 1 protein in gastric epithelial cells. Infect Immun 72, 3549–3560, doi: 10.1128/IAI.72.6.3549-3560.2004 (2004). [DOI] [PMC free article] [PubMed] [Google Scholar]
- 30.Cargnello M & Roux PP Activation and function of the MAPKs and their substrates, the MAPK-activated protein kinases. Microbiol Mol Biol Rev 75, 50–83, doi: 10.1128/MMBR.00031-10 (2011). [DOI] [PMC free article] [PubMed] [Google Scholar]
- 31.Sundqvist M et al. Staphylococcus aureus-Derived PSMalpha Peptides Activate Neutrophil FPR2 but Lack the Ability to Mediate beta-Arrestin Recruitment and Chemotaxis. J Immunol, doi: 10.4049/jimmunol.1900871 (2019). [DOI] [PubMed] [Google Scholar]
- 32.Migeotte I, Communi D & Parmentier M Formyl peptide receptors: a promiscuous subfamily of G protein-coupled receptors controlling immune responses. Cytokine Growth Factor Rev 17, 501–519, doi: 10.1016/j.cytogfr.2006.09.009 (2006). [DOI] [PubMed] [Google Scholar]
- 33.Vuong C et al. Regulated expression of pathogen-associated molecular pattern molecules in Staphylococcus epidermidis: quorum-sensing determines pro-inflammatory capacity and production of phenol-soluble modulins. Cell Microbiol 6, 753–759, doi: 10.1111/j.1462-5822.2004.00401.x (2004). [DOI] [PubMed] [Google Scholar]
- 34.Panaro MA & Mitolo V Cellular responses to FMLP challenging: a mini-review. Immunopharmacol Immunotoxicol 21, 397–419, doi: 10.3109/08923979909007117 (1999). [DOI] [PubMed] [Google Scholar]
- 35.Keates S, Keates AC, Nath S, Peek RM Jr. & Kelly CP Transactivation of the epidermal growth factor receptor by cag+ Helicobacter pylori induces upregulation of the early growth response gene Egr-1 in gastric epithelial cells. Gut 54, 1363–1369, doi: 10.1136/gut.2005.066977 (2005). [DOI] [PMC free article] [PubMed] [Google Scholar]
- 36.de Grado M, Rosenberger CM, Gauthier A, Vallance BA & Finlay BB Enteropathogenic Escherichia coli infection induces expression of the early growth response factor by activating mitogen-activated protein kinase cascades in epithelial cells. Infect Immun 69, 6217–6224, doi: 10.1128/IAI.69.10.6217-6224.2001 (2001). [DOI] [PMC free article] [PubMed] [Google Scholar]
- 37.Hannemann S, Gao B & Galan JE Salmonella modulation of host cell gene expression promotes its intracellular growth. PLoS Pathog 9, e1003668, doi: 10.1371/journal.ppat.1003668 (2013). [DOI] [PMC free article] [PubMed] [Google Scholar]
- 38.de Klerk N, Saroj SD, Wassing GM, Maudsdotter L & Jonsson AB The Host Cell Transcription Factor EGR1 Is Induced by Bacteria through the EGFR-ERK1/2 Pathway. Front Cell Infect Microbiol 7, 16, doi: 10.3389/fcimb.2017.00016 (2017). [DOI] [PMC free article] [PubMed] [Google Scholar]
- 39.Xu Z et al. Bacterial peptidoglycan-induced tnf-alpha transcription is mediated through the transcription factors Egr-1, Elk-1, and NF-kappaB. J Immunol 167, 6975–6982 (2001). [DOI] [PubMed] [Google Scholar]
- 40.Coleman DL, Bartiss AH, Sukhatme VP, Liu J & Rupprecht HD Lipopolysaccharide induces Egr-1 mRNA and protein in murine peritoneal macrophages. J Immunol 149, 3045–3051 (1992). [PubMed] [Google Scholar]
- 41.Rautenberg M, Joo HS, Otto M & Peschel A Neutrophil responses to staphylococcal pathogens and commensals via the formyl peptide receptor 2 relates to phenol-soluble modulin release and virulence. FASEB J 25, 1254–1263, doi: 10.1096/fj.10-175208 (2011). [DOI] [PMC free article] [PubMed] [Google Scholar]
- 42.Chatterjee SS et al. Essential Staphylococcus aureus toxin export system. Nat Med 19, 364–367, doi: 10.1038/nm.3047 (2013). [DOI] [PMC free article] [PubMed] [Google Scholar]
- 43.Dahlgren C, Gabl M, Holdfeldt A, Winther M & Forsman H Basic characteristics of the neutrophil receptors that recognize formylated peptides, a danger-associated molecular pattern generated by bacteria and mitochondria. Biochem Pharmacol 114, 22–39, doi: 10.1016/j.bcp.2016.04.014 (2016). [DOI] [PubMed] [Google Scholar]
- 44.Forsman H et al. Structural changes of the ligand and of the receptor alters the receptor preference for neutrophil activating peptides starting with a formylmethionyl group. Biochim Biophys Acta 1853, 192–200, doi: 10.1016/j.bbamcr.2014.10.021 (2015). [DOI] [PubMed] [Google Scholar]
- 45.Qin L et al. Toxin Mediates Sepsis Caused by Methicillin-Resistant Staphylococcus epidermidis. PLoS Pathog 13, e1006153, doi: 10.1371/journal.ppat.1006153 (2017). [DOI] [PMC free article] [PubMed] [Google Scholar]
- 46.Schmittgen TD & Livak KJ Analyzing real-time PCR data by the comparative C(T) method. Nat Protoc 3, 1101–1108 (2008). [DOI] [PubMed] [Google Scholar]
- 47.Faust N, Varas F, Kelly LM, Heck S & Graf T Insertion of enhanced green fluorescent protein into the lysozyme gene creates mice with green fluorescent granulocytes and macrophages. Blood 96, 719–726 (2000). [PubMed] [Google Scholar]
- 48.Kamenyeva O et al. Neutrophil recruitment to lymph nodes limits local humoral response to Staphylococcus aureus. PLoS Pathog 11, e1004827, doi: 10.1371/journal.ppat.1004827 (2015). [DOI] [PMC free article] [PubMed] [Google Scholar]
Associated Data
This section collects any data citations, data availability statements, or supplementary materials included in this article.
Supplementary Materials
Source Data Fig. 1 Numerical source data and associated statistical analysis
Source Data Fig. 2 Numerical source data and associated statistical analysis
Source Data Fig. 3 Numerical source data and associated statistical analysis
Source Data Fig. 4 Numerical source data and associated statistical analysis
Source Data Fig. 5 Numerical source data and associated statistical analysis
Source Data Extended Data Fig. 1 Numerical source data
Source Data Extended Data Fig. 2 Numerical source data and associated statistical analysis
Source Data Extended Data Fig. 3 Numerical source data
Source Data Extended Data Fig. 4 Numerical source data and associated statistical analysis
Source Data Extended Data Fig. 7 Numerical source data and associated statistical analysis
Source Data Extended Data Fig. 8 Numerical source data
Data Availability Statement
Microarray data have been deposited in NCBI’s Gene Expression Omnibus and are accessible through GEO Series accession number GSE103779. All other data generated or analyzed during this study are included in this published article or in the supplementary information files.


