Abstract
Both pleiotropic connectivity and mutational correlations can restrict the decoupling of traits under divergent selection, but it is unknown which is more important in trait evolution. To address this question, we create a model that permits within-population variation in both pleiotropic connectivity and mutational correlation, and compare their relative importance to trait evolution. Specifically, we developed an individual-based stochastic model where mutations can affect whether a locus affects a trait and the extent of mutational correlations in a population. We find that traits can decouple whether there is evolution in pleiotropic connectivity or mutational correlation, but when both can evolve, then evolution in pleiotropic connectivity is more likely to allow for decoupling to occur. The most common genotype found in this case is characterized by having one locus that maintains connectivity to all traits and another that loses connectivity to the traits under stabilizing selection (subfunctionalization). This genotype is favored because it allows the subfunctionalized locus to accumulate greater effect size alleles, contributing to increasingly divergent trait values in the traits under divergent selection without changing the trait values of the other traits (genetic modularization). These results provide evidence that partial subfunctionalization of pleiotropic loci may be a common mechanism of trait decoupling under regimes of corridor selection.
Keywords: pleiotropy, correlated mutation, genetic architecture, correlational selection, modularity, mutation, trait divergence, genetic constraints, subfunctionalization, metamerism
Introduction
One of the central problems in evolutionary biology is understanding the processes through which new traits arise. One process that can lead to the creation of new traits is when existing traits become differentiated from one another because they are selected for a new purpose (Rueffler et al. 2012). There has long been evidence that this can happen through gene duplication followed by trait decoupling (Muller 1936; Ohno 1970; Rastogi and Liberles 2005; Han et al. 2009). One example in vertebrates is the differentiation of forelimbs from hindlimbs, where the same gene that was responsible for both fore and hindlimb identity in development diverged (Graham and McGonnell 1999; Minguillon et al. 2009; Petit et al. 2017). In this case, the paralogous genes Tbx4/Tbx5 that encode transcription factors (TFs) for fore/hindlimb identity likely evolved from the same ancestral gene, and their expression differentiated after duplication (Minguillon et al. 2009). Somehow during selection for functional divergence, there was a decoupling of genetically integrated traits, which allowed them to respond to selection as independent genetic modules (Wagner and Altenberg 1996; Hansen 2006). Genetic decoupling was likely also responsible for the evolution of trait divergence in vertebrate metameric segmentation into differentiated somites, and the emergence of cell differentiation in multicellular organisms (Holley 2007; Wagner et al. 2019; see also Newman 2020).
Although modular structures in phenotypic covariation (where phenotypic variation is more correlated within groups of traits than between them) are found in a wide range of organisms, including yeast, round worms, mice, and humans (Jiang et al. 2008; Wang et al. 2010; Hlusko 2016), the underlying genetic architectures producing genetic integration between traits are still uncertain. Genetic integration, constraining the decoupling of traits, may arise from pleiotropic connections between loci and traits, where they may or may not create genetic and phenotypic covariation (Baatz and Wagner 1997; Kenney-Hunt et al. 2008; Smith 2016). When selection favors the divergence of traits, the constraining effect of pleiotropy may come in two forms: a pleiotropic connectivity effect or a mutational correlation effect (Stern 2000). A pleiotropic connectivity effect depends on how highly pleiotropically connected a gene is. For instance, a gene product (e.g. enzyme, TF, etc.) may affect more than one trait (or function) by having multiple substrates or binding sites, thus affecting multiple downstream processes. This may constrain the evolutionary divergence of those traits because the effect of a mutation beneficial for one trait may be deleterious for other traits (when those other traits are under stabilizing selection). It is expected that the net fitness effect of a pleiotropic mutation is decreased in proportion to the number of traits it affects (Orr 2000; Welch and Waxman 2003; Martin and Lenormand 2006). Therefore, pleiotropic connections may constrain divergent trait evolution even without creating genetic correlation among traits, whereas, a mutational correlation effect is the effect of a mutation affecting how correlated are the effects of mutations at pleiotropic loci. Thus, a mutational correlation effect may induce correlated changes in the traits affected by pleiotropic loci. However, the strength of the correlational effect of the mutations is not dependent on the number of traits affected but on the properties of the genes, processes, or traits affected. When those effects are correlated among traits, they can constrain trait decoupling in addition to those caused by the dimensionality of the pleiotropic loci (Lande 1979; Arnold 1992; Stern 2000).
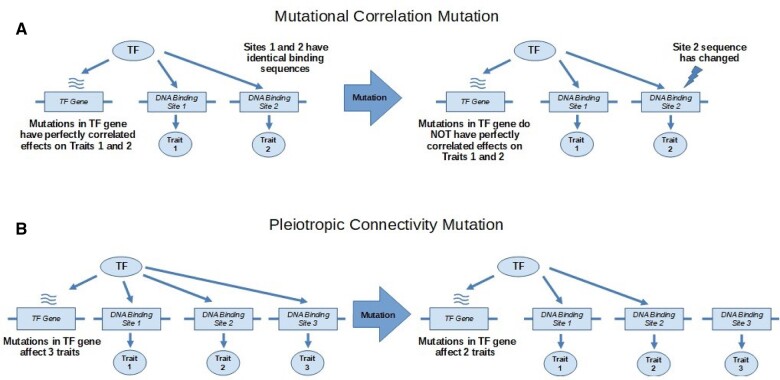
Biological examples may help to illuminate the distinction between the two types of pleiotropy that can hinder the decoupling of traits. Imagine a TF that has multiple target binding sites affecting the expression of multiple genes, which in turn affect several traits. If the binding sites have identical sequences, then mutations in the gene encoding the TF are expected to be in perfect correlation with respect to their effects on the traits. In this scenario, a mutational correlation mutation may be a mutation in one of the binding sequences that leads to differential binding of the TF (Figure 1). Now, that the binding sites are no longer identical, mutations in the gene encoding the TF may no longer have perfectly correlated effects on the traits. As the name suggests, the mutational correlation mutation has affected the correlation between effects of mutations in the TF’s gene on the traits it affects, whereas another type of mutation might affect a TF’s access to one of its binding sites by methylating the DNA in the region of that binding site or by changing the TF’s binding specificity (Stewart et al. 2012; Pougach et al. 2014). If this type of mutation causes the TF to affect more or less traits than it did before the mutation, it would be considered a pleiotropic connectivity mutation.
Figure 1.
The two types of mutations affecting pleiotropic effects using a transcription factor (TF) as an example. (A) A mutation in DNA-Binding Site 2 changes its sequence so that it is no longer identical with binding site 1. This mutational correlation mutation changes the correlation in effects of mutations in the TF gene on traits 1 and 2. (B) A mutation affects a TF’s ability to access binding site 3. This pleiotropic connectivity mutation changes the number of traits that are affected by the TF gene.
Both pleiotropic connectivity and mutational correlations can evolve as a result of divergent selection and affect the ability of traits to decouple from one another. Although previous models have included either evolution in pleiotropic connections or mutational correlation, their relative importance in constraining trait decoupling remains to be seen (Jones et al. 2003, 2007; Melo and Marroig 2015; Chebib and Guillaume 2017). Here, we attempt to answer this question by using stochastic simulations, where individuals in a population can vary in both pleiotropic connections and mutational correlations, while applying divergent selection on some traits but not others, and then observing what affects the decoupling of traits.
Methods
Simulation model
We modified the individual-based, forward-in-time, population genetics simulation software Nemo (v2.3.46) (Guillaume and Rougemont 2006) to allow for the evolution of pleiotropic connectivity and mutational correlations. The simulations consisted of a single population of size N of randomly mating, hermaphroditic, diploid individuals, with a probability of self-fertilization, similar to a classical Wright–Fisher population model. Each individual had two pleiotropic quantitative trait loci (QTLs) affecting four traits. The phenotypic value of each trait, zi, was calculated by adding the allelic values at the two loci: , where X is the maternally inherited allele and Y the paternally inherited allele, i is the trait number (), and L is the locus number ()) (Figure 2). For simplicity, we assumed no environmental variance (i.e. heritability is 1).
Figure 2.
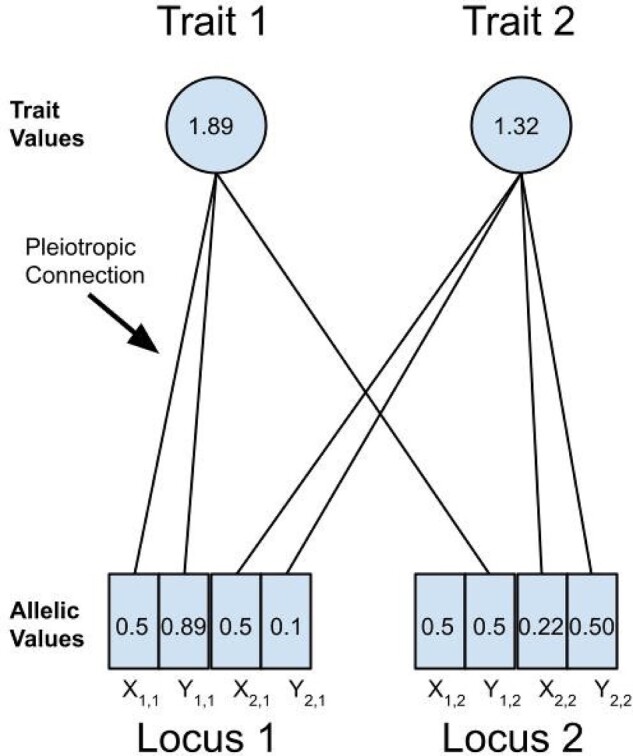
Pictorial representation of quantitative trait locus (QTL) alleles and the traits they affect with example values for illustration (the experimental model has four traits and is described in the Experimental design section). Here, trait 1 has a value of 1.89 determined by the sum of allelic values () pleiotropically connected to it from locus 1 (0.5 + 0.89) and locus 2 (0.5), where represents the maternally inherited allele of locus 2 that affects trait 1. Trait 2 is affected differently by the two loci and has a value of 1.32 (0.5 + 0.1 + 0.22 + 0.5). The allelic values of a QTL were affected by mutation at a rate of μ. The pleiotropic connections between a QTL and a trait could be removed or added by mutation at a rate of μpleio, and toggled whether an allelic value was added to a trait value or not.
Generations were non-overlapping and consisted of three main stages: mating, viability selection, and ageing. In the mating stage, pairs of individuals were chosen to produce offspring (with a mean fecundity of three offspring to ensure population size replenishment). It was during the mating stage that recombination between loci and mutations occurred. In the viability selection stage, Gaussian stabilizing selection was applied on offspring and determined the survival probability of individuals, whose fitness was calculated as , where z is the individual trait value vector, θ is the vector of local optimal trait values, and is the selection variance–covariance matrix (n × n, for n traits) describing the multivariate Gaussian selection surface. The matrix is a diagonal matrix with diagonal elements corresponding to the strength of selection, , on each trait (where strength of selection scales inversely with ), and off-diagonal elements corresponding to the strength of correlational selection, , between traits i and j. In the ageing stage, the adults were removed from the population and the offspring matured into breeding adults for the next generation.
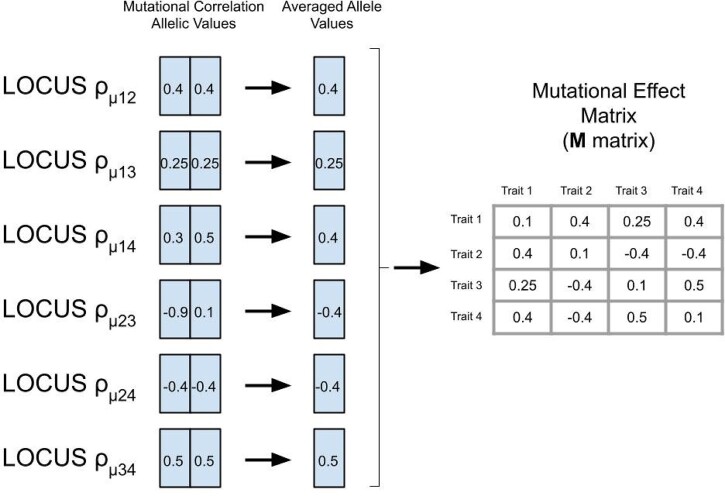
Three types of mutations (each with a separate mutation rate) were possible: mutations at the additive QTL affecting the traits, mutations at a set of modifier loci separately affecting the correlation of the mutational effects at the additive QTL, and mutations affecting the connectivity of the QTL to the traits, reducing or increasing the pleiotropic degree (the number of traits a locus affects) of each locus. The first type of mutations changed the allelic values of a QTL by randomly drawing effects from a multivariate normal distribution, with variance–covariance matrix M. The mutational effects were added to the existing allelic values at the QTL (continuum-of-alleles model; Crow and Kimura 1964). These mutations appeared at a rate given by μ. The variance of the mutational effect for all traits were constant and set at in the diagonal of the M-matrix. Each pairwise trait covariance of the M matrix was governed by its own separate modifier locus. We will refer to variance-standardized covariance values, or mutational correlation as the off-diagonal elements of the M matrix. As M is a 4 × 4 symmetrical matrix, the six coefficients were controlled by six diploid modifier loci, carried by each individual and inherited in the same manner as the additive QTL. Each individual thus carried its own M matrix. The second type of mutation thus changed these mutational correlation allelic values by randomly drawing from a uniform distribution (), and adding the effect to the existing allelic value (which was bound between –1 and 1). These mutations appeared at a rate given by μmutcor. In order to get a particular mutational effect correlation, , the two mutational correlation allelic values of the corresponding modifier locus were averaged together (Figure 3). All the pairwise mutational effect correlations () were combined with mutational effect variances () to create the M matrix for an individual, whenever a mutational effect on a QTL that directly affected traits was required. The third type of mutation affected the pleiotropic connections between QTLs and traits, determining whether the allelic value of a QTL was added to a trait value. A mutation of this type affected the pleiotropic connections between a trait and the maternally or paternally inherited alleles separately. Thus, QTLs could be “heterozygotes” in their pleiotropic degree depending on the pleiotropic degree of the maternally and paternally inherited alleles. These discrete mutations connecting or disconnecting allelic effects from traits occurred at a rate given by μpleio (Figure 2).
Figure 3.
Pictorial representation of the modifier loci that contained the allelic values for producing the pairwise mutational effect correlations () between traits i and j. The allelic values of a modifier locus were affected by mutation at a rate of μmutcor, and were averaged together to produce the corresponding correlation for the M matrix. The mutational effect variances, , remained static with a value of 0.1 for all traits. Each individual had its own M matrix, which was used to create the multivariate distribution from which new mutational effects on the QTL’s allelic value could be drawn.
Experimental design
To understand the impact of divergent selection on the structure of genetic architecture, simulations were run with a population of 500 individuals each having two additive loci underlying four traits (Figure 4). The initial conditions were set to full pleiotropy (each locus affecting every trait) and strong mutational correlations between trait pairs (). This way, mutational effects in phenotypic space were highly constrained to fall along a single direction, and reducing variation for divergent selection. All traits had an initial phenotypic value of 2 with equal allelic values of 0.5 at each allele of the two QTL.
Figure 4.
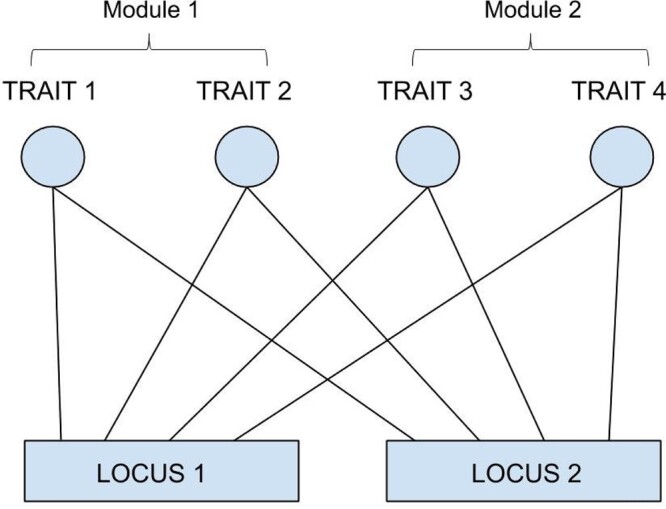
Pictorial representation of the genetic architecture modelled within individuals at the start of the simulations, with two loci, four traits, and full pleiotropic connectivity between them.
Selection regimes were designed to mimic divergent selection between trait modules, where trait module 1 included traits 1 and 2, and trait module 2 included traits 3 and 4. Initially, optimum trait values, , were all set to 2 (the same as the initial trait values). There was moderately strong stabilizing selection on each trait ( = 5), strong correlational selection between traits in the same trait module (), and no correlational selection between traits in different trait modules (). After this, divergent directional selection proceeded by maintaining constant optimal trait values for traits 3 and 4 () and increasing the optimal trait values for traits 1 and 2 by 0.001 per generation for 5000 generations, bringing the trait optima to (corridor model of selection sensu Wagner 1984; Bürger 1986). These 5000 generations of divergent, directional selection on traits 1 and 2 were then followed by 5000 generations of purely stabilizing selection, to ensure that a mutation-selection equilibrium was reached.
To compare the differential effects of evolving pleiotropic connectivity and evolving mutational correlations on trait decoupling, nine different simulations were run with all combinations of three different rates of mutation in pleiotropic connectivity and mutational correlations (μpleio and μmutcor = 0, 0.001, or 0.01) representing no evolution in genetic constraints, and mutation rates at and above the QTL allelic mutation rate (μ = 0.001), respectively.
Simulations were also run with initial mutational correlations between all pairs set to 0 ( = 0) to compare highly constraining genetic architecture (within a corridor selection regime) to ones with no constraints in the direction of mutational effects.
We observed general patterns of average trait value divergence, population fitness, genetic correlation, pleiotropic degree (the number of traits a locus affects), and mutational correlation. In the case of pleiotropic degree, the two loci affecting trait values were sorted into a high and low pleiotropic degree locus for each individual before averaging over populations or replicates so that differential effects of the two loci were not averaged out in the final analysis. Statistics were averaged over 50 replicate simulations for each particular set of parameter values of μpleio, μmutcor, and initial .
Results
Trait divergence and genetic modularity evolution under constraints to genetic decoupling
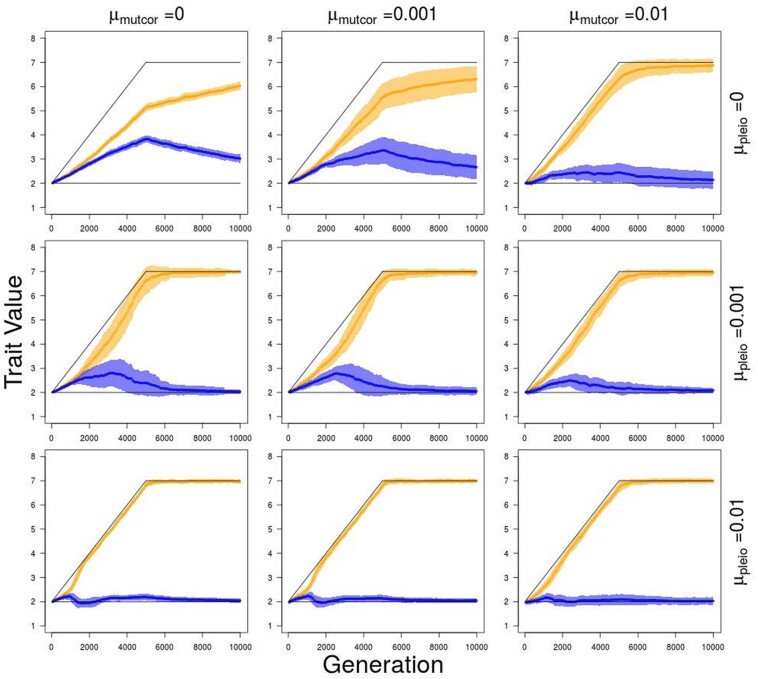
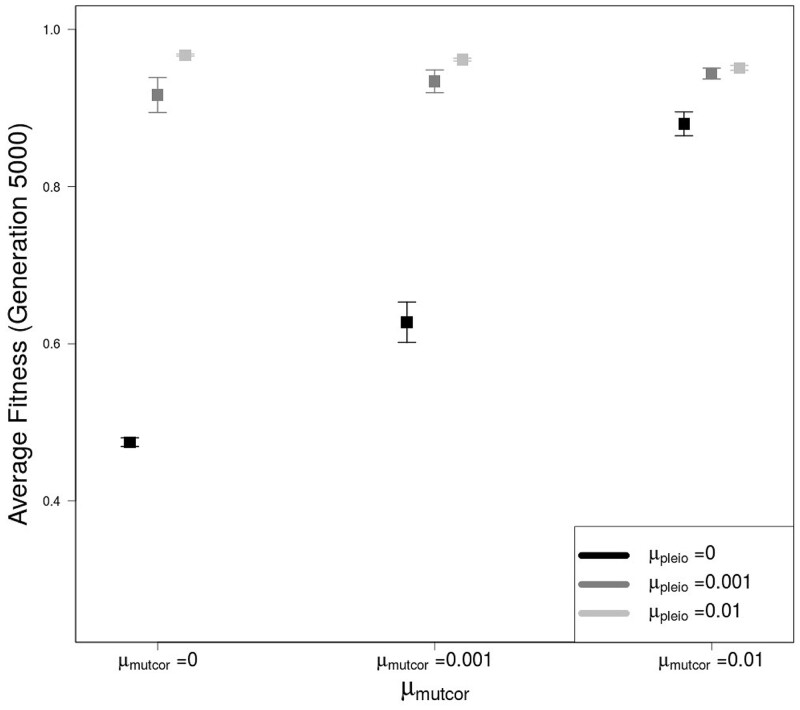
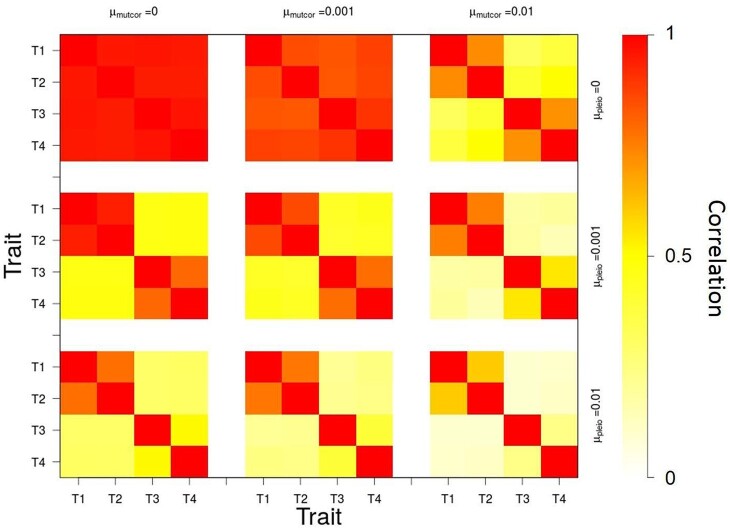
In the absence of genetic architecture evolution (μpleio = μmutcor = 0), traits are still capable of divergence, but do not follow trait optima closely since traits 3 and 4 get pulled away from their optima as traits 1 and 2 increase to follow theirs (Figure 5). With the introduction of variation in genetic architecture through mutation (μpleio, 0), average trait values follow their optima more closely and the capability of trait divergence increases as mutation rates in genetic architecture increases, which leads to higher average population fitness values by generation 5000 (Figure 6). Also by generation 5000, simulations with higher pleiotropic connection mutation rates ( 0.001 or 0.01) have distinctly modular genetic correlation structures with stronger correlations between traits 1 and 2 (and 3 and 4) than between traits of different modules (e.g. traits 1 and 4) (Figure 7). An increase in pleiotropic connectivity variation has a greater impact on trait divergence evolution and modularization of the genetic architecture of the traits than the same increase in mutational correlation variation, which is evident when either μpleio or μmutcor is the same as the allelic mutation rate ( 0.001). Even when the mutation rate for mutational correlation is at the highest tested (μmutcor = 0.01), an increase in the mutation rate for pleiotropic connections still improves the ability for traits to diverge, which can be seen in the decrease in variance over replicate simulations (Figure 5).
Figure 5.
Trait value divergence over 5000 generations of divergent selection on traits 1 and 2 (trait module 1), when all ρμ values are initialized to 0.99, followed by 5000 generations of stabilizing selection for different combinations of mutation rate in pleiotropic connectivity (μpleio) and mutational correlations (μmutcor). Orange—average values of traits 1 and 2; blue—average values of traits 3 and 4; black—trait value optima for trait modules 1 and 2. Shaded regions show standard errors of the mean for 50 replicate simulations.
Figure 6.
Average population fitness after 5000 generations of divergent selection on traits 1 and 2 (trait module 1), when all values are initialized to 0.99, for different combinations of mutation rate in pleiotropic connectivity (μpleio), and mutational correlations (μmutcor). All error bars represent standard errors of the mean for 50 replicate simulations.
Figure 7.
Genetic correlations between traits after 5000 generations of divergent selection on traits 1 and 2 (trait module 1), when all values are initialized to 0.99, for different combinations of mutation rate in pleiotropic connectivity (μpleio), and mutational correlations (μmutcor). Red—higher genetic correlation. White—no genetic correlation.
Effects of pleiotropic connectivity and mutational correlation evolution on rate and extent of trait decoupling
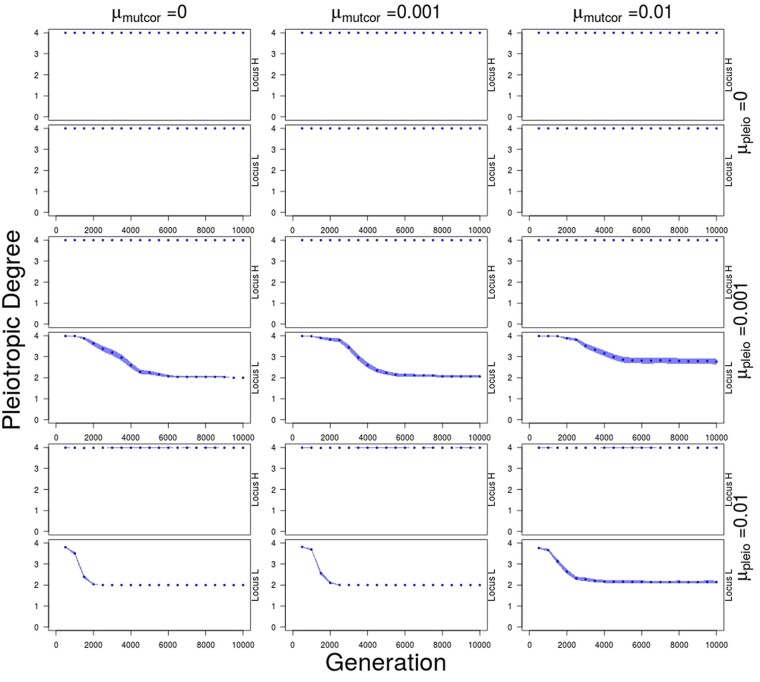
When evolution of pleiotropic connections is possible ( 0), the most common allele in almost all cases is one that maintains connections to traits 1 and 2, but has lost connections to traits 3 and 4 after two mutational events. This allele is found in locus 1 or 2 at a frequency of 0.873 averaged over the populations of all simulations where evolution of pleiotropic connections is possible. The allele goes to fixation or near fixation in one locus where its pleiotropic degree decreases from four to two, and this happens more rapidly as μpleio increases (Figure 8). The decrease in pleiotropic degree resulting from the increase in frequency of this allele coincides with the modularization of genetic correlations, the divergence of traits, and the increase in fitness. The proportion of times in which this particular allele becomes common in locus 1 or in locus 2 is approximately equal over all simulations (0.491 and 0.509, respectively, over 300 simulations) and is never observed in both loci in any one individual.
Figure 8.
Average number of traits connected to each locus over 5000 generations of divergent selection on traits 1 and 2 (trait module 1), when all values are initialized to 0.99, followed by 5000 generations of stabilizing selection for different combinations of mutation rate in pleiotropic connectivity (μpleio) and mutational correlations (μmutcor). Loci are sorted so that locus with higher pleiotropic degree (locus H) is always shown above and lower pleiotropic degree (locus L) shown below. Shaded regions show standard errors of the mean for 50 replicate simulations.
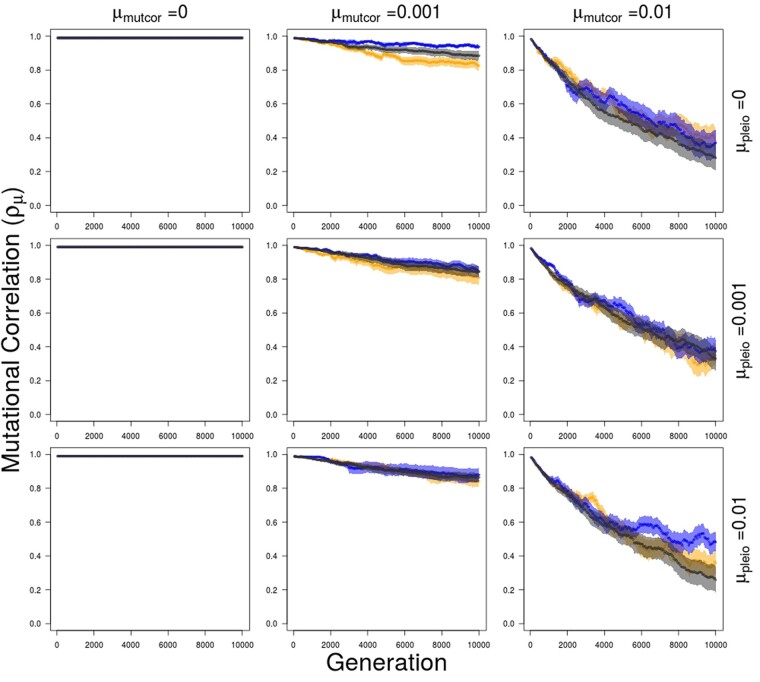
When the mutation rate for pleiotropic connectivity (μpleio) is zero, mutational correlation evolution can still lead to trait selection response but this takes longer, does not diverge as fully, and therefore leads to lower population mean fitness. Evolution of the mutational correlation occurs by a general decrease in all mutational correlations between traits at a rate determined by the mutation rate of mutational correlations (Figure 9). When the mutation rate at the mutational correlation loci is higher than the pleiotropic mutation rate, then genotypic patterns do emerge where one locus disconnected from trait 3 combines with lower mutational correlations between traits 1 and 4 or 2 and 4, or a locus disconnected to trait 4 combines with lower mutational correlations between traits 1 and 3 or 2 and 3 (at frequencies of 0.16 and 0.10 over 50 replicates, respectively). But even in the case with a higher mutation rate for mutational correlation than the pleiotropic connectivity mutation rates, full subfunctionalization (one locus loses connections to traits 3 and 4) is a common outcome occurring in 18% of 50 replicates after 5000 generations.
Figure 9.
Average within and between trait module mutational correlation over 5000 generations of divergent selection on traits 1 and 2 (trait module 1), when all values are initialized to 0.99, followed by 5000 generations of stabilizing selection for different combinations of mutation rate in pleiotropic connectivity (μpleio) and mutational correlations (μmutcor). Orange—mutational correlation between traits 1 and 2 (within trait module 1); blue—mutational correlation between traits 3 and 4 (within trait module 2); black—average mutational correlations between traits 1 and 3, 1 and 4, 2 and 3, and 2 and 4 (between trait modules 1 and 2). Shaded regions show standard errors of the mean for 50 replicate simulations.
Effect of mutational correlation initial conditions set to zero ( 0 vs. 0.99)
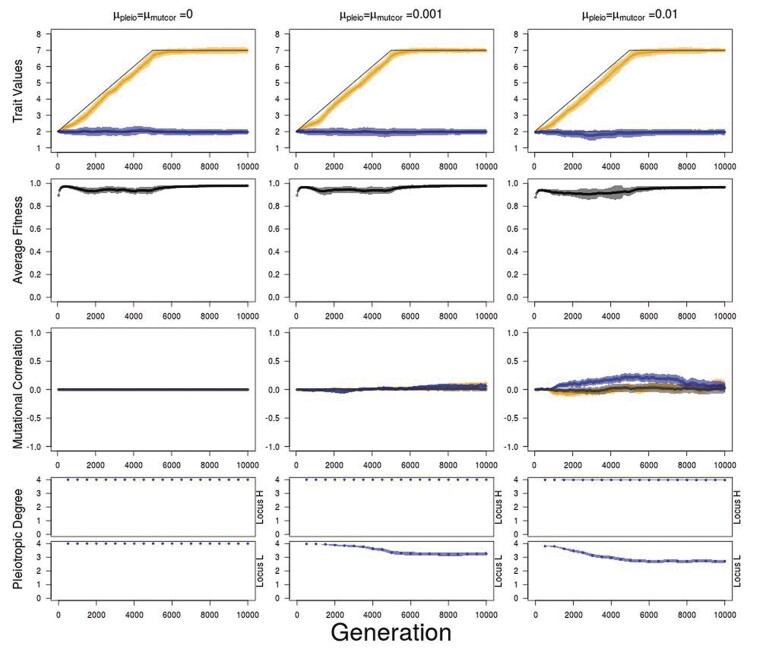
In simulations where all mutational correlations are initialized at zero, there is little to no constraint on trait response to selection despite full pleiotropic connectivity. This can be observed in trait values that follow their optima closely, leading to little reduction in fitness as optima for traits 1 and 2 diverge from traits 3 and 4, with little evolution in mutational correlations and pleiotropic degree during divergent selection (Figure 10). There are still patterns of genetic architecture evolution as alleles with lowered pleiotropic degree still emerge in the populations, but fixation is not common nor are any allelic patterns of mutational correlations.
Figure 10.
Average trait value, fitness, mutational correlation, and pleiotropic degree over 5000 generations of divergent selection on traits 1 and 2 (trait module 1), when all values are initialized to 0, followed by 5000 generations of stabilizing selection for different combinations of mutation rate in pleiotropic connectivity (μpleio) and mutational correlations (μmutcor). For pleiotropic degree, loci are sorted so that locus with higher pleiotropic degree (locus H) is always shown above and lower pleiotropic degree (locus L) shown below. Orange—traits 1 and 2 values or mutational correlation between traits 1 and 2 (trait module 1); blue—trait 3 and 4 values or mutational correlation between traits 3 and 4 (trait module 2); black—average mutational correlations between traits 1 and 3, 1 and 4, 2 and 3, and 2 and 4 (between trait modules 1 and 2). Shaded regions show standard errors of the mean for 50 replicate simulations.
Discussion
Evolution in pleiotropic connectivity and mutational correlation can lead to trait divergence
Previous models of genetic architecture evolution have shown that evolution in pleiotropic connections and mutational correlation can influence genetic correlation between traits and therefore responses to selection, but as far as we are aware this is the first time both have been allowed to evolve in the same model. When a genetic architecture is highly constraining to the decoupling of some traits from others, then evolution of the structure of the genetic architecture itself can clearly facilitate the rate and extent of a trait’s response to divergent selection. When the genetic architecture is constraining and cannot evolve, traits may still diverge, but this occurs by the slow accumulation of less probable mutational effects changing some trait values without affecting others. When genetic architectures can evolve, they may do so through changes in pleiotropic connectivity between genes and traits or in the mutational correlations between traits, where the former leads to a greater release of genetic constraints and faster adaptation to the corridor selection regime. Both result in two separate modules of genetic correlation, but a qualitative distinction exists between these two types of genetic constraints to decoupling for two reasons. First, genetic constraints based on mutational correlation distributions are more difficult targets of selection compared to pleiotropic connections because mutations on modifiers of genetic correlations do not affect the trait phenotypes directly, whereas a single allele that differs in its pleiotropic connectivity does. Second, mutational correlations require pleiotropic connections to be effectual on traits (there can be no mutational correlations if a QTL affects only one trait), whereas the latter can affect the rate of adaptation regardless of mutational correlation (Baatz and Wagner 1997; Chebib and Guillaume 2017).
The results of this study corroborate results from previous models of pleiotropic evolution. We observe that divergent selection in the form of the corridor model leads to modular genetic architecture with greater genetic correlations between traits within trait modules and lower correlations between trait modules. This was also the case in both Melo and Marroig (2015) and Pavlicev et al. (2011) under the corridor model. Unfortunately, it is unclear whether patterns of partial modular pleiotropy that were responsible for the emergence of genetic modularity in our study were also observed in these studies because they did not report the most common resulting genotypes after corridor selection. However, Melo and Marroig (2015) did vary the mutation rate in pleiotropic connectivity (while keeping allelic mutation rate the same) and found that when μpleio was 10 times greater than μ, there were higher within and between trait module correlation compared to when μpleio and μ were the same. Though our results corroborate this relationship as well, we cannot deduce the state of the pleiotropic connections that led to those results in their simulations. Their study also did not include evolution in mutational correlations so it is not possible to do a comparison on the relative effects of mutational correlation and pleiotropic connectivity evolution on patterns of genetic modularity. Pavlicev et al. (2011) had a deterministic model with relationship quantitative trail loci (rQTL) modifier loci that affected the correlations between traits directly instead of affecting the pleiotropic connections, making it difficult to compare patterns of partial modular pleiotropic connectivity. Jones et al. (2007) found “extreme” variation among replicates in the average mutational correlation observed when was capable of evolving, similar to what was observed in our study (as well as when simulations were run with the same parameter values as the Jones et al. 2007 study; Supplementary Figure S1). This variation of the evolution of mutational correlation is likely due to an unstable equilibrium in the adaptive landscape in which highly positive or negative mutational correlations have a selective advantage over mutational correlations closer to zero (Lande 1980; Zhang and Hill 2002; Jones et al. 2007; Supplementary Figure S2).
In comparison to all the simulations where trait divergence was initially constrained by strong mutational correlation, when mutational effects were uncorrelated, there appeared to be no constraints to trait divergence. Even when pleiotropic connectivity (or mutational correlations) could not change, traits could respond on pace with selection. This result may not be unexpected, even with pleiotropic connections between all loci and all traits, because the uncorrelated mutational effects of pleiotropic loci do not necessarily translate into genetic correlations. This was observed previously in a study that compared patterns of genetic correlation in fully pleiotropic loci with different degrees of mutational correlation (Chebib and Guillaume 2017). These studies together suggest that regardless of the number of pleiotropic connections, in the absence of mutational correlation, genetic variation arises equally in all directions of trait space, allowing for trait evolution to proceed unhindered.
Patterns of pleiotropy
What explains the emergence of one dominant genotype that was observed with one locus losing its connections to traits 3 and 4, and the other locus maintaining full pleiotropy? When mutational correlations are strong, genetic modularization should arise so that mutational effects can increase traits 1 and 2 values without also increasing traits 3 and 4 (especially when stabilizing selection is strong compared to directional selection). If stabilizing selection had been weaker and/or directional selection been much stronger, then more loci affecting the traits would have increased the proportion of advantageous mutations allowing for traits to respond to selection (Hansen 2003). For the same reason, we do not observe complete genetic modularization with one locus only connected to traits 1 and 2, and the other only connected to traits 3 and 4. When both loci contribute to traits 1 and 2, more mutational input is available to increase their values. We may have also observed complete modularization had the trait optimums for traits 3 and 4 been moving in the opposite direction of the trait optimums for traits 1 and 2, but this is a much less likely scenario in natural populations. Also, since we were interested in the evolution of genetic architectures allowing trait decoupling, we started our simulations with a highly genetically integrated, monomorphic population. This makes evolution in our model dependent on de-novo mutations and as traits diverged, the negative effects of pleiotropy on traits under stabilizing selection increased, leading to modularization in the genetic architecture. But, if we had simulated genetic architectures where the allelic mutation rate (μ) was high enough and/or selection acted on many loci with small effects, pleiotropy may not have been as constraining, and integrated genetic architectures (loci affecting all traits) may have evolved. Whether integrated or modular genetic architectures will evolve in response to divergent selection is dependent on the relative effects of mutation and selection on the different traits (Pavlicev and Hansen 2011). This also would have been true if standing genetic variation had already existed in pleiotropic connectivity and mutational correlations in a population prior to divergent selection. We could imagine that many possible combinations of pleiotropic connectivity and mutational correlation alleles that allow for increased variation and reduced covariation between traits could also exist. In those scenarios, genetic modularization may not be associated with trait divergence.
Gene duplication and subdivision of functions by change of pleiotropic degree
The results we obtain in this study are also related to work done on the evolutionary fate of duplicated, pleiotropic genes (Ohno 1970; Hahn 2009; Innan and Kondrashov 2010; Guillaume and Otto 2012). Previous models describe the conditions under which both genes remained fully pleiotropic, which is expected to be favorable when there is selection for increased dosage as we had for traits 1 and 2 (Ohno 1970). There is some empirical evidence of this in ribosomal RNA, histone genes, as well as amylase genes in humans with high starch diets (Zhang 2003; Perry et al. 2007; Qian et al. 2010). Other models describe when one or both genes lose their connection to some traits, known as subfunctionalization, if there is a relaxation of selection after duplication (Force et al. 1999; Lynch and Force 2000). Empirical evidence for subfunctionalization exists for vertebrate limb evolution, as discussed in the introduction, as well as pathway specialization in plants (Bomblies and Doebley 2006; Des Marais and Rausher 2008). Compared to models with selection for increased dosage, our model has selection only for higher values in traits 1 and 2, whereas selection for increased values in all four traits is expected to maintain all pleiotropic connections. The difference compared to neutral models where subfunctionalization is the result is that in our model, there is no relaxation of selection due to duplication and redundancy. In that case, Guillaume and Otto (2012) showed that the maintenance of pleiotropy in one gene and subfunctionalization in the other (the most common outcome in our simulations) is predicted when there is asymmetry in either the trait contributions to fitness or in the expression levels of the genes. The gene with higher expression was predicted to remain fully pleiotropic, with loss of pleiotropy in the second, less expressed gene. Our results fit very well with that later outcome, although the conditions were different. In Guillaume and Otto (2012), a fitness trade-off emerged from the competitive allocation of the gene product (amount of protein produced) between two traits under positive selection (i.e. increased allocation to one trait reduced allocation to the other trait). The fitness trade-off in our model arose from the corridor model of selection whereby increased additive contributions to traits 1 and 2 via fully pleiotropic mutations with correlated allelic values trade-off negatively with traits 3 and 4 under stabilizing selection. The trade-off is quickly attenuated when the mutational correlations between traits under divergent selection decreases. Mutation in pleiotropic connections of the QTL was nevertheless more efficient in breaking the constraint to a trait’s response to selection. It is also a more plausible mechanism since mutations changing a TFs’ access to transcription binding sites may cause a drastic change associated with a change in pleiotropic connectivity.
Empirical evidence for mutational correlation and pleiotropy
The pleiotropic connections and mutational correlations in our model abstract out the types of molecular level changes that may lead to changes in genetic correlations between traits. Some examples of variation in pleiotropic connectivity come from empirical studies on transcriptional regulation. For example, expression of the Tbx4 gene (described earlier) is required not only for hindlimb development but is also expressed in genital development (Chapman et al. 1996). Although the upstream enhancer of Tbx4, hindlimb enhancer B (or HLEB), is functional in both hindlimb and genital development in both mice and lizards, HLEB appears to have lost its hindlimb enhancer function in snakes due to mutations in one of the enhancer’s binding regions (Infante et al. 2015). A more recent example comes from two species of Drosophila that diverged only 500,000 years ago. D. yakuba has both hypandrial and sex comb bristles, whereas D. santomea has only sex comb bristles (Rice and Rebeiz 2019). Quantitative trait mapping crosses between the species and with D. melanogaster revealed that a single nucleotide change in a regulatory enhancer of the scute gene, which promotes bristle development, was responsible for D. santomea losing its hypandrial bristles and increasing its sex comb bristle number (Nagy et al. 2018). These examples provide evidence that mutations in DNA-binding sites can affect a gene’s pleiotropic degree, allowing for evolution of trait decoupling.
Correlated mutational effects, on the other hand, may arise from mutations that cause correlated effects in more than one of a gene’s molecular functions or from mutations causing correlated effects in a gene product’s multiple processes, but empirical data are still needed to discover the mechanisms underlying mutational correlations (Hodgkin 1998; Wagner and Zhang 2011). Even if the specific molecular mechanism that is the cause of correlation is not known, it is still possible to estimate the genomic M-matrix, which describes the combined pattern of (co)variation arising from mutations in all loci that affect the traits of interest. Mutation accumulation experiments in D. melanogaster (Houle and Fierst 2013) or Caenorhabditis elegans (Estes et al. 2005) provide examples of such genomic M-matrix estimates and show the existence of strong mutational correlation among morphological and life-history traits. Additionally, mutational correlations in C. elegans seem to correspond to phenotypic correlations among traits after removing environmental correlations and suggest that pleiotropy is somewhat restricted within traits of related function (Estes et al. 2005). Unfortunately, the M-matrix is only a summary statistic, which represents patterns of mutational variance across traits. It does not necessarily represent the correlations of mutational effects underlying that mutational variance between traits, which may be hidden due to multiple effects cancelling each other out.
It is also possible to discover evidence of modular pleiotropy from genome-wide studies using gene knock-out/-down experiments as was performed in yeast (Dudley et al. 2005; Güldener et al. 2005; Ohya et al. 2005), C. elegans (Sönnichsen et al. 2005), and the house mouse (Bult et al. 2008), which have shown that whole-gene pleiotropy is variable (not all genes affect all traits) and often modular (Wang et al. 2010; Wagner and Zhang 2011). QTL studies further show variable pleiotropy in D. melanogaster (Mezey et al. 2005), threespine stickleback (Albert et al. 2008), the house mouse (Cheverud et al. 1997; Kenney-Hunt et al. 2008; Miller et al. 2014), and Arabidopsis thaliana (Juenger et al. 2005), among others (Porto et al. 2016).
One empirical study based on human patient data manages to link mutational correlation with modular variation of pleiotropy by measuring both the genomic M-matrices and the pleiotropic degree of main and epistatic effects of mutations affecting the replicative capacity (fitness) of HIV-1 in different drug environments (Polster et al. 2016). In doing so, they discovered that epistasis can affect the pleiotropic degree of single mutations producing modular genetic architectures and that epistatic–pleiotropic effect modules matched modules of fitness co-variation among drugs. These results suggest that epistasis may be fundamental in shaping the genetic integration itself, which may allow organisms to enhance their evolvability in the face of selection (Pavlicev et al. 2008, 2011; Pavlicev and Cheverud 2015).
Conclusion
Both pleiotropic connectivity and mutational correlation can constrain the divergence of traits under divergent selection, but when both can evolve, trait divergence occurs because pleiotropic connections are broken between loci and traits under stabilizing selection. The evolution of pleiotropic connectivity is favored because it is an easier target of selection than a distribution of mutational effects. The most commonly observed genotype thus includes one locus that maintains connections to both traits under directional selection and both traits under stabilizing selection, and the other locus losing its connection to the traits under stabilizing selection (subfunctionalization). The subfunctionalization of one locus allows it to contribute to increasingly divergent trait values in the traits under directional selection without changing the trait values of the other traits, which leads to separate genetic modules. These results indicate that partial subfunctionalization is sufficient to allow genetic decoupling and the divergence of traits with little to no loss of average fitness.
Data availability
The data and initialization files for this study are available online through Zenodo online repository at: https://zenodo.org/record/3980997#.XzPnFcBKi70 and code for simulations can be found at: https://github.com/jmchebib/nemo_evolving_pleio.
Supplementary material is available at GENETICS online.
Supplementary Material
Acknowledgments
This manuscript benefited from the constructive comments provided by Thomas F. Hansen, Mihaela Pavlicev, Joachim Hermisson, Jason Wolf, Nicholas Barton, and several reviewers of the Genetics journal.
J.C. performed software modification for model implementation and acquisition of data, as well as drafting of manuscript. J.C. and F.G. performed study conception and design, analysis and interpretation of data, and critical revision of manuscript.
Funding
J.C. and F.G. were supported by the Swiss National Science Foundation, grant PP00P3_144846 and PP00P3_176965 to F.G.
Conflicts of interest
The authors declare that there is no conflict of interest.
Literature cited
- Albert AYK, Sawaya S, Vines TH, Knecht AK, Miller CT, et al. 2008. The genetics of adaptive shape shift in stickleback: pleiotropy and effect size. Evolution. 62:76–85. [DOI] [PubMed] [Google Scholar]
- Arnold SJ. 1992. Constraints on phenotypic evolution. Am Nat. 140: S85–S107. [DOI] [PubMed] [Google Scholar]
- Baatz M, Wagner GP. 1997. Adaptive inertia caused by hidden pleiotropic effects. Theor Popul Biol. 51:49–66. [Google Scholar]
- Bomblies K, Doebley JF. 2006. Pleiotropic effects of the duplicate maize floricaula/leafy genes zfl1 and zfl2 on traits under selection during maize domestication. Genetics 172:519–531. [DOI] [PMC free article] [PubMed] [Google Scholar]
- Bult CJ, Eppig JT, Kadin JA, Richardson JE, Blake JA, et al. ; Mouse Genome Database Group. 2008. The mouse genome database (mgd): mouse biology and model systems. Nucleic Acids Res. 36: D724–D728. [DOI] [PMC free article] [PubMed] [Google Scholar]
- Bürger R. 1986. Constraints for the evolution of functionally coupled characters: a nonlinear analysis of a phenotypic model. Evolution 40:182–193. [DOI] [PubMed] [Google Scholar]
- Chapman DL, Garvey N, Hancock S, Alexiou M, Agulnik SI, et al. 1996. Expression of the t-box family genes, tbx1–tbx5, during early mouse development. Dev Dyn. 206:379–390. [DOI] [PubMed] [Google Scholar]
- Chebib J, Guillaume F. 2017. What affects the predictability of evolutionary constraints using a g-matrix? The relative effects of modular pleiotropy and mutational correlation. Evolution 71:2298–2312. [DOI] [PubMed] [Google Scholar]
- Cheverud JM, Routman EJ, Irschick DJ. 1997. Pleiotropic effects of individual gene loci on mandibular morphology. Evolution. 51:2006–2016. [DOI] [PubMed] [Google Scholar]
- Crow JF, Kimura M. 1964. The theory of genetic loads. In: Proc. XI Int. Congr. Genetics. Vol. 2. p. 495–505. Oxford, UK: Pergamon Press. [Google Scholar]
- Des Marais DL, Rausher MD. 2008. Escape from adaptive conflict after duplication in an anthocyanin pathway gene. Nature 454:762–765. [DOI] [PubMed] [Google Scholar]
- Dudley AM, Janse DM, Tanay A, Shamir R, Church GM. 2005. A global view of pleiotropy and phenotypically derived gene function in yeast. Mol Syst Biol. 1:1–11. [DOI] [PMC free article] [PubMed] [Google Scholar]
- Estes S, Ajie BC, Lynch M, Phillips PC. 2005. Spontaneous mutational correlations for life-history, morphological and behavioral characters in Caenorhabditis elegans. Genetics. 170:645–653. [DOI] [PMC free article] [PubMed] [Google Scholar]
- Force A, Lynch M, Pickett FB, Amores A, Yan Y-L, et al. 1999. Preservation of duplicate genes by complementary, degenerative mutations. Genetics 151:1531–1545. [DOI] [PMC free article] [PubMed] [Google Scholar]
- Graham A, McGonnell I. 1999. Limb development: farewell to arms. Curr Biol. 9: R368–R370. [DOI] [PubMed] [Google Scholar]
- Guillaume F, Otto SP. 2012. Gene functional trade-offs and the evolution of pleiotropy. Genetics 192:1389–1409. [DOI] [PMC free article] [PubMed] [Google Scholar]
- Guillaume F, Rougemont J. 2006. Nemo: an evolutionary and population genetics programming framework. Bioinformatics 22:2556–2557. [DOI] [PubMed] [Google Scholar]
- Güldener U, Münsterkötter M, Kastenmüller G, Strack N, van Helden J, et al. 2005. CYGD: the comprehensive yeast genome database. Nucleic Acids Res. 33: D364–D368. [DOI] [PMC free article] [PubMed] [Google Scholar]
- Hahn MW. 2009. Distinguishing among evolutionary models for the maintenance of gene duplicates. J Hered. 100:605–617. [DOI] [PubMed] [Google Scholar]
- Han MV, Demuth JP, McGrath CL, Casola C, Hahn MW. 2009. Adaptive evolution of young gene duplicates in mammals. Genome Res. 19:859–867. [DOI] [PMC free article] [PubMed] [Google Scholar]
- Hansen TF. 2003. Is modularity necessary for evolvability? Biosystems. 69:83–94. [DOI] [PubMed] [Google Scholar]
- Hansen TF. 2006. The evolution of genetic architecture. Annu Rev Ecol Evol Syst. 37:123–157. [Google Scholar]
- Hlusko LJ. 2016. Elucidating the evolution of hominid dentition in the age of phenomics, modularity, and quantitative genetics. Ann Anat. 203:3–11. [DOI] [PubMed] [Google Scholar]
- Hodgkin J. 1998. Seven types of pleiotropy. Int J Dev Biol. 42:501–505. [PubMed] [Google Scholar]
- Holley SA. 2007. The genetics and embryology of zebrafish metamerism. Dev Dyn. 236:1422–1449. [DOI] [PubMed] [Google Scholar]
- Houle D, Fierst J. 2013. Properties of spontaneous mutational variance and covariance for wing size and shape in Drosophila melanogaster. Evolution 67:1116–1130. [DOI] [PubMed] [Google Scholar]
- Infante CR, Mihala AG, Park S, Wang JS, Johnson KK, et al. 2015. Shared enhancer activity in the limbs and phallus and functional divergence of a limb-genital cis-regulatory element in snakes. Dev Cell. 35:107–119. [DOI] [PMC free article] [PubMed] [Google Scholar]
- Innan H, Kondrashov F. 2010. The evolution of gene duplications: classifying and distinguishing between models. Nat Rev Genet. 11:97–108. [DOI] [PubMed] [Google Scholar]
- Jiang X, Liu B, Jiang J, Zhao H, Fan M, et al. 2008. Modularity in the genetic disease-phenotype network. FEBS Lett. 582:2549–2554. [DOI] [PubMed] [Google Scholar]
- Jones AG, Arnold SJ, Bürger R. 2003. Stability of the g-matrix in a population experiencing pleiotropic mutation, stabilizing selection, and genetic drift. Evolution 57:1747–1760. [DOI] [PubMed] [Google Scholar]
- Jones AG, Arnold SJ, Bürger R. 2007. The mutation matrix and the evolution of evolvability. Evolution 61:727–745. [DOI] [PubMed] [Google Scholar]
- Juenger T, Perez-Perez JM, Bernal S, Micol JL. 2005. Quantitative trait loci mapping of floral and leaf morphology traits in Arabidopsis thaliana: evidence for modular genetic architecture. Evol Dev. 7:259–271. [DOI] [PubMed] [Google Scholar]
- Kenney-Hunt JP, Wang B, Norgard EA, Fawcett G, Falk D, et al. 2008. Pleiotropic patterns of quantitative trait loci for 70 murine skeletal traits. Genetics 178:2275–2288. [DOI] [PMC free article] [PubMed] [Google Scholar]
- Lande R. 1979. Quantitative genetic analysis of multivariate evolution, applied to brain: body size allometry. Evolution 33:402–416. [DOI] [PubMed] [Google Scholar]
- Lande R. 1980. The genetic covariance between characters maintained by pleiotropic mutations. Genetics 94:203–215. [DOI] [PMC free article] [PubMed] [Google Scholar]
- Lynch M, Force A. 2000. The probability of duplicate gene preservation by subfunctionalization. Genetics 154:459–473. [DOI] [PMC free article] [PubMed] [Google Scholar]
- Martin G, Lenormand T. 2006. A general multivariate extension of fisher’s geometrical model and the distribution of mutation fitness effects across species. Evolution 60:893–907. [PubMed] [Google Scholar]
- Melo D, Marroig G. 2015. Directional selection can drive the evolution of modularity in complex traits. Proc Natl Acad Sci U S A. 112:470–475. [DOI] [PMC free article] [PubMed] [Google Scholar]
- Mezey JG, Houle D, Nuzhdin SV. 2005. Naturally segregating quantitative trait loci affecting wing shape of Drosophila melanogaster. Genetics 169:2101–2113. [DOI] [PMC free article] [PubMed] [Google Scholar]
- Miller CT, Glazer AM, Summers BR, Blackman BK, Norman AR, et al. 2014. Modular skeletal evolution in sticklebacks is controlled by additive and clustered quantitative trait loci. Genetics 197:405–420. [DOI] [PMC free article] [PubMed] [Google Scholar]
- Minguillon C, Gibson-Brown JJ, Logan MP. 2009. Tbx4/5 gene duplication and the origin of vertebrate paired appendages. Proc Natl Acad Sci U S A. 106:21726–21730. [DOI] [PMC free article] [PubMed] [Google Scholar]
- Muller HJ. 1936. Bar duplication. Science. 83:528–530. [DOI] [PubMed] [Google Scholar]
- Nagy O, Nuez I, Savisaar R, Peluffo AE, Yassin A, et al. 2018. Correlated evolution of two copulatory organs via a single cis-regulatory nucleotide change. Curr Biol. 28:3450–3457. [DOI] [PMC free article] [PubMed] [Google Scholar]
- Newman SA. 2020. Cell differentiation: what have we learned in 50 years? J Theor Biol. 485:110031. [DOI] [PubMed] [Google Scholar]
- Ohno S. 1970. Evolution by gene duplication. New York, NY: springer. [Google Scholar]
- Ohya Y, Sese J, Yukawa M, Sano F, Nakatani Y, et al. 2005. High-dimensional and large-scale phenotyping of yeast mutants. Proc Natl Acad Sci U S A. 102:19015–19020. [DOI] [PMC free article] [PubMed] [Google Scholar]
- Orr HA. 2000. Adaptation and the cost of complexity. Evolution 54:13–20. [DOI] [PubMed] [Google Scholar]
- Pavlicev M, Cheverud JM. 2015. Constraints evolve: context dependency of gene effects allows evolution of pleiotropy. Annu Rev Ecol Evol Syst. 46:413–434. [Google Scholar]
- Pavlicev M, Cheverud JM, Wagner GP. 2011. Evolution of adaptive phenotypic variation patterns by direct selection for evolvability. Proc Biol Sci. 278:1903–1912. [DOI] [PMC free article] [PubMed] [Google Scholar]
- Pavlicev M, Hansen TF. 2011. Genotype-phenotype maps maximizing evolvability: modularity revisited. Evol Biol. 38:371–389. [Google Scholar]
- Pavlicev M, Kenney-Hunt JP, Norgard EA, Roseman CC, Wolf JB, et al. 2008. Genetic variation in pleiotropy: differential epistasis as a source of variation in the allometric relationship between long bone lengths and body weight. Evolution 62:199–213. [DOI] [PubMed] [Google Scholar]
- Perry GH, Dominy NJ, Claw KG, Lee AS, Fiegler H, et al. 2007. Diet and the evolution of human amylase gene copy number variation. Nat Genet. 39:1256–1260. [DOI] [PMC free article] [PubMed] [Google Scholar]
- Petit F, Sears KE, Ahituv N. 2017. Limb development: a paradigm of gene regulation. Nat Rev Genet. 18:245–258. [DOI] [PubMed] [Google Scholar]
- Polster R, Petropoulos CJ, Bonhoeffer S, Guillaume F. 2016. Epistasis and pleiotropy affect the modularity of the genotype–phenotype map of cross-resistance in hiv-1. Mol Biol Evol. 33:3213–3225. [DOI] [PMC free article] [PubMed] [Google Scholar]
- Porto A, Schmelter R, VandeBerg JL, Marroig G, Cheverud JM. 2016. Evolution of the genotype-to-phenotype map and the cost of pleiotropy in mammals. Genetics 204:1601–1612. [DOI] [PMC free article] [PubMed] [Google Scholar]
- Pougach K, Voet A, Kondrashov FA, Voordeckers K, Christiaens JF, et al. 2014. Duplication of a promiscuous transcription factor drives the emergence of a new regulatory network. Nat Commun. 5:1–12. [DOI] [PMC free article] [PubMed] [Google Scholar]
- Qian W, Liao B-Y, Chang AY-F, Zhang J. 2010. Maintenance of duplicate genes and their functional redundancy by reduced expression. Trends Genet. 26:425–430. [DOI] [PMC free article] [PubMed] [Google Scholar]
- Rastogi S, Liberles DA. 2005. Subfunctionalization of duplicated genes as a transition state to neofunctionalization. BMC Evol Biol. 5:28. [DOI] [PMC free article] [PubMed] [Google Scholar]
- Rice G, Rebeiz M. 2019. Evolution: how many phenotypes do regulatory mutations affect? Curr Biol. 29: R21–R23. [DOI] [PubMed] [Google Scholar]
- Rueffler C, Hermisson J, Wagner GP. 2012. Evolution of functional specialization and division of labor. Proc Natl Acad Sci U S A. 109: E326–E335. [DOI] [PMC free article] [PubMed] [Google Scholar]
- Smith SD. 2016. Pleiotropy and the evolution of floral integration. New Phytol. 209:80–85. [DOI] [PubMed] [Google Scholar]
- Sönnichsen B, Koski L, Walsh A, Marschall P, Neumann B, et al. 2005. Full-genome rnai profiling of early embryogenesis in Caenorhabditis elegans. Nature. 434:462–469. [DOI] [PubMed] [Google Scholar]
- Stern DL. 2000. Perspective: evolutionary developmental biology and the problem of variation. Evolution. 54:1079–1091. [DOI] [PubMed] [Google Scholar]
- Stewart AJ, Hannenhalli S, Plotkin JB. 2012. Why transcription factor binding sites are ten nucleotides long. Genetics 192:973–985. [DOI] [PMC free article] [PubMed] [Google Scholar]
- Wagner G. 1984. Coevolution of functionally constrained characters: prerequisites for adaptive versatility. Biosystems. 17:51–55. [DOI] [PubMed] [Google Scholar]
- Wagner GP, Altenberg L. 1996. Perspective: complex adaptations and the evolution of evolvability. Evolution. 50:967–976. [DOI] [PubMed] [Google Scholar]
- Wagner GP, Erkenbrack EM, Love AC. 2019. Stress-induced evolutionary innovation: a mechanism for the origin of cell types. BioEssays. 41:1800188. [DOI] [PMC free article] [PubMed] [Google Scholar]
- Wagner GP, Zhang J. 2011. The pleiotropic structure of the genotype–phenotype map: the evolvability of complex organisms. Nat Rev Genet. 12:204–213. [DOI] [PubMed] [Google Scholar]
- Wang Z, Liao BY, Zhang JZ. 2010. Genomic patterns of pleiotropy and the evolution of complexity. Proc Natl Acad Sci U S A. 107:18034–18039. [DOI] [PMC free article] [PubMed] [Google Scholar]
- Welch JJ, Waxman D. 2003. Modularity and the cost of complexity. Evolution 57:1723–1734. [DOI] [PubMed] [Google Scholar]
- Zhang J. 2003. Evolution by gene duplication: an update. Trends Ecol Evol. 18:292–298. [Google Scholar]
- Zhang XS, Hill WG. 2002. Joint effects of pleiotropic selection and stabilizing selection on the maintenance of quantitative genetic variation at mutation-selection balance. Genetics 162:459–471. [DOI] [PMC free article] [PubMed] [Google Scholar]
Associated Data
This section collects any data citations, data availability statements, or supplementary materials included in this article.
Supplementary Materials
Data Availability Statement
The data and initialization files for this study are available online through Zenodo online repository at: https://zenodo.org/record/3980997#.XzPnFcBKi70 and code for simulations can be found at: https://github.com/jmchebib/nemo_evolving_pleio.
Supplementary material is available at GENETICS online.


