


Abstract
Introduction
The signalling cascades that contribute to lupus pathogenesis are incompletely understood. We address this by using an unbiased activity‐based kinome screen of murine lupus.
Methods
An unbiased activity‐based kinome screen (ABKS) of 196 kinases was applied to two genetically different murine lupus strains. Systemic and renal lupus were evaluated following in vivo PLK1blockade. The upstream regulators and downstream targets of PLK1 were also interrogated.
Results
Multiple signalling cascades were noted to be more active in murine lupus spleens, including PLK1. In vivo administration of a PLK1‐specific inhibitor ameliorated splenomegaly, anti‐dsDNA antibody production, proteinuria, BUN and renal pathology in MRL.lpr mice (P < 0.05). Serum IL‐6, IL‐17 and kidney injury molecule 1 (KIM‐1) were significantly decreased after PLK1 inhibition. PLK1 inhibition reduced germinal centre and marginal zone B cells in the spleen, but changes in T cells were not significant. In vitro, splenocytes were treated with anti‐mouse CD40 Ab or F(ab’)2 fragment anti‐mouse IgM. After 24‐h stimulation, IL‐6 secretion was significantly reduced upon PLK1 blockade, whereas IL‐10 production was significantly increased. The phosphorylation of mTOR was assessed in splenocyte subsets, which revealed a significant change in myeloid cells. PLK1 blockade reduced phosphorylation associated with mTOR signalling, while Aurora‐A emerged as a potential upstream regulator of PLK1.
Conclusion
The Aurora‐A → PLK1 → mTOR signalling axis may be central in lupus pathogenesis, and emerges as a potential therapeutic target.
Keywords: drug target, kinase activity, PLK1, SLE
In this study, we found multiple signaling cascades were elevated in murine lupus spleens, including PLK1. Systemic and renal lupus were alleviated following in vivo PLK1 blockade. The Aurora‐A → PLK1 → mTOR signaling axis may be central in lupus pathogenesis and emerges as a potential therapeutic target.

Introduction
Systemic lupus erythematosus (SLE) is a chronic, multifactorial autoimmune disease characterised by the production of increased titres of autoantibodies and the involvement of multiple organs, which causes significant morbidity and early mortality in young women and minorities. 1 SLE has been classically reported as an adaptive immune response dysregulation involving T and B cells, while growing evidence indicates that innate immunity also contributes to disease pathogenesis, involving dendritic cells (DCs), neutrophils and macrophages. Cytokines secreted by adaptive and innate immune cells orchestrate the immune response by adjusting the balance of stimulation and suppression of the immune system. 2 , 3 Current treatment for lupus is largely dependent on immunosuppressive drugs, which can have significant side effects. Considerable efforts have been invested in the identification of targeted drugs 4 , 5 , 6 , 7 ; however, the complex pathogenesis and heterogeneity of this disease have impeded the discovery of novel therapeutic targets. During the past 50 years, the only FDA‐approved targeted drug for lupus is belimumab. 8 , 9 , 10 Hence, there is an urgent need to develop more effective targeted therapies for this chronic autoimmune disease.
Polo‐like kinase 1 (PLK1) is an evolutionarily conserved serine/threonine kinase in mammals, with a catalytic kinase domain at the amino terminus and a regulatory domain at the carboxyl terminus termed the polo box domain (PBD). 11 It has been implicated in mitosis, 11 apoptosis, oncogenesis 12 and proliferation of immune cells. 13 , 14 , 15 , 16 , 17 , 18 , 19 The activity of PLK1 is regulated by the phosphorylation on its threonine residue (Thr210 in PLK1 of vertebrates and Thr201 in Plx1 of Xenopus, the homolog of PLK1) in the activation loop, 20 , 21 as well as by its conformational change. 22 , 23 PLK1 is overexpressed in various malignancies, correlating with poor prognosis 24 and oncogenic transformation, 25 , 26 with therapeutic implications. 27 In lymphomas, B‐cell signalling molecules correlate with PLK1 expression, and B‐cell numbers are modulated by PLK1 inhibition. 28 The growth of cutaneous T‐cell lymphoma (CTCL) cells was also reported to be decreased either by genetic knockdown or enzyme activity inhibition targeting PLK1. 16
Previous studies have indicated that SLE is associated with a myriad of immunoregulatory abnormalities, including aberrant B‐cell and T‐cell signalling and function. 29 , 30 , 31 , 32 Although PLK1 has not been directly implicated in lupus, PLK1 interacts with several signalling molecules implicated in lupus. For instance, phosphatase and tensin homolog (PTEN) is phosphorylated and regulated by PLK1 during the cell cycle, 33 mammalian target of rapamycin (mTOR) can be activated by constitutively active PLK1, 34 and cyclin‐dependent kinases (CDK) inhibitor p21 is downregulated by PLK1. 35 Given that these molecules have been implicated in immune dysregulation of lupus B cells or T cells, these findings indirectly implicate PLK1 as a key pathogenic molecule in lupus. More excitingly, recent studies also indicate that PLK1 may be involved in inflammation, cytokine production and Toll‐like receptor (TLR) signalling. 36 , 37 Evidence from single‐cell RNA sequencing (scRNA‐seq) indicates that PLK1 is upregulated at G2/M transition in the kidney of proliferative lupus nephritis (class III or class IV) compared to the other classes. 38
Using a novel, unbiased and comprehensive activity‐based kinome screen (ABKS) targeted proteomic approach, we discovered several signalling cascades including PLK1 activity to be significantly elevated in murine lupus. The goal of this study is to explore the molecular and cellular mechanisms by which PLK1 contributes to the pathogenesis of lupus and to determine whether PLK1 could serve as a therapeutic target in SLE.
Results
PLK1 emerges as a novel signalling node in murine lupus
To uncover novel signalling molecules that are up‐ or downregulated in murine lupus, we performed an unbiased activity‐based kinome screen (ABKS) using spleens from two genetically different lupus mouse models, B6.Sle1.Sle3 and MRL.lpr, together with B6 control (Figure 1). As shown in Figure 1a, a biotin‐labelled kinase probe composed of acyl phosphate‐containing nucleotides with ATP or ADP, could selectively and covalently bind kinases at the ATP binding sites. 39 A total of 196 kinases were identified in the spleen lysates. Compared to the healthy control B6 spleen, the upregulated kinases (fold‐change > 1.3) in MRL.lpr spleens included Aurora‐A, CDC2, CDK2, CDK8, CHK1, CHK2, CK1γ1/2/3, FES, FYN, IKKε/TBK1, IRAK4, JAK1, KHS1, LCK, MAP2K4, MASTL, MLKL, NEK1, NEK7, PI3KCB, PKR, PLK1, PLK3, RIPK3, RSK2, TLK1/2, TXK, ZAP70 and ZC3/MINK1; the upregulated kinases in B6.Sle1.Sle3 spleens (fold‐change > 1.3) included Aurora‐A, CaMK1d, CDK5, JAK1, KHS1, MAP2K4, MASTL, NEK7, p38α‐MAPKAP2/3, PI42A/B, PKR, PLK1, PRP4 homolog, RIPK3, RSK3, SYK, ZC1 and ZC3/MINK1. The downregulated kinases (< −1.5 fold‐change) in MRL.lpr spleens included ATR, CaMK2, CaMKK2, CDK9, CHED, EphA2, FAK, FGR, ILK, IRAK3, LCK, LYN, MAP3K5, MYLK, NDR1, p38γ/δ, PCTAIRE2/3, PI42A, PI4K2A, PKCβ, PKCδ, PKD2, PKD3, PTTAIRE1, PYK2, ROCK1, SLKK6, SYK, TAO1/3, UFO and YES, and the downregulated kinases (< −1.5 fold‐change) in B6.Sle1.Sle3 spleens included CaMK2, EphA2, MAP2K1, MYLK, PAK2, PKCβ, PKCδ, SLKK6 and YES. A comprehensive analysis of the activity fold changes across the kinome between murine lupus and the B6 control is shown in Supplementary figure 1a and b.
Figure 1.
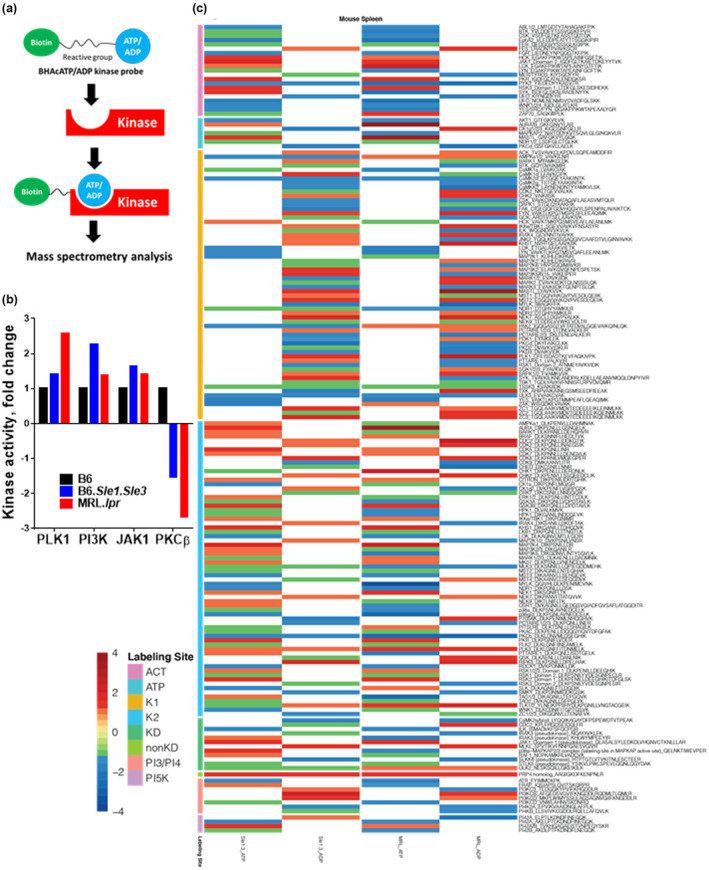
Screening the activity of 196 kinases in lupus spleen using an unbiased Activity‐Based Kinome Scan (ABKS). (a) Model of the biotinylated acyl phosphate—ATP probe irreversibly reacting with protein kinases in the ATP binding pocket. (b) Kinome screening revealed several kinases with significantly altered activity in the spleens of lupus mouse models, B6.Sle1.Sle3 and MRL.lpr, compared to B6 controls (Female mice, 2–3‐month‐old, n = 3 per strain). (c) Detailed kinase activities of the screened kinome are presented in a heatmap where red represents upregulated kinases and blue represents downregulated kinases in lupus mice, MRL.lpr, and B6.Sle1.Sle3 spleens, normalised by the activity level of the same kinase from B6 healthy control spleens. For each strain, both the ADP‐binding and the ATP‐binding kinase activities are depicted in separate columns and each experiment was performed twice. Female mice, 2–3‐month‐old, n = 3 per strain.
Interestingly, Aurora‐A, JAK1, PKR, PLK1, RIPK3 and ZC3/MINK1 were upregulated in both lupus strains, while CaMK2, EphA2, MYLK, PKCβ, SLKK6 and YES were downregulated in both lupus strains. These results further suggest that there may indeed be shared signalling molecules or axes, which may potentially lead to the pathogenesis of lupus across genetically disparate strains. Among these, some kinases have previously been implicated in lupus, including PI3K, 40 , 41 JAK, 42 , 43 PKR, 44 RIPK3 45 and PKC. 46 , 47 In contrast, increased PLK1 activity in lupus has not been explored before and was hence further pursued (Figure 1b). The kinase activities of the screened kinome are shown in Figure 1c, where red represents upregulated kinases and blue represents downregulated kinases in lupus mice, MRL.lpr and B6.Sle1.Sle3 spleens, normalised by the activity level of the same kinase from B6 control spleens. For each strain, both the ADP‐binding and the ATP‐binding kinase activities are depicted.
Aurora‐A, an upstream regulator of PLK1, is activated in MRL.lpr lupus mice
To explore upstream regulators of PLK1, we chose to investigate the expression of Aurora‐A, a physiological PLK1 kinase, which phosphorylates Thr 210 in PLK1 and therefore activates cyclin‐dependent kinase 1 (Cdk1) to promote mitotic entry and spindle assembly. 48 , 49 Indeed, the activity‐based kinome screen indicated increased Aurora‐A kinase activity in MRL.lpr spleens compared to B6 (Figure 2a). To validate these initial kinome screening findings, we used western blot to demonstrate that splenic B220+ B cells exhibited elevated phosphorylation of Aurora‐A and PLK1 in MRL.lpr compared to B6 mice (Figure 2b–e).
Figure 2.
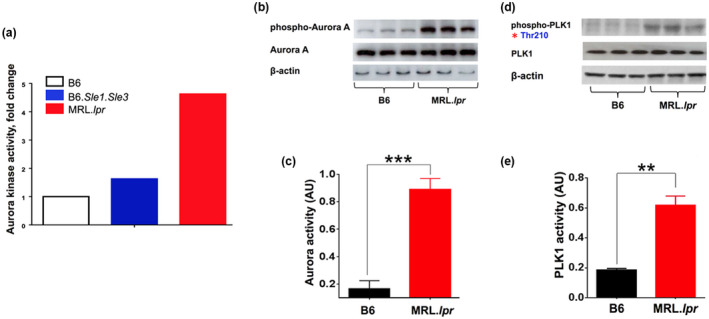
Aurora‐A exhibits increased kinase activity and expression in MRL.lpr lupus mice, together with PLK1. Kinase activity of Aurora‐A, a putative regulator of PLK1, was measured in the spleens of lupus mouse models. (a) Elevated protein kinase activity of Aurora‐A was found in B6.Sle1.Sle3 and MRL.lpr, compared to B6 controls, in the initial ABKS screen (Figure 1). (b–e) Elevated phosphorylation and activity of Aurora‐A and PLK1 in splenic B cells of lupus mice. The assays were performed in triplicate. Female mice, 10‐week‐old, n = 3 per group. *P < 0.05; **P < 0.01; ***P < 0.001.
Blockade of PLK1 alleviates lupus phenotypes in mice
Ten‐week‐old MRL.lpr mice were used to perform the blockade studies using the PLK1 inhibitor. As shown in Figure 3a–f, PLK1 blockade ameliorated splenomegaly, reduced the levels of IgG anti‐dsDNA autoantibodies, proteinuria and BUN in murine lupus and improved renal pathology when compared to the placebo group. In addition, similar therapeutic effects were observed in older mice (4–5 months of age) with NMS‐P937 (Supplementary figure 1). We next asked whether PLK1 inhibition could impact cytokine secretion in vivo, focusing on a couple of well‐studied disease biomarkers. Serum IL‐6, IL‐17 and kidney injury molecule 1 (KIM‐1) were found to be significantly reduced after PLK1 blockade (Figure 3g–i). Together, the blockade of PLK1 subdued disease in murine lupus and led to the remission of lupus nephritis with reduced disease biomarker levels.
Figure 3.
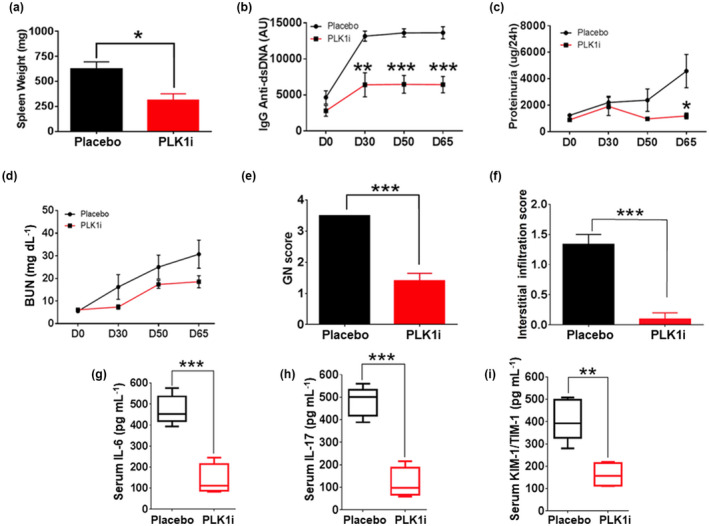
PLK1 inhibition in vivo rescues lupus phenotypes in MRL.lpr mice. A PLK1‐specific inhibitor or the vehicle control was administered to lupus mice, MRL.lpr via oral gavage at a dosage of 40 mg kg–1 daily for 2 days followed by a stop of 5 days, repeated every week for a total of 65 days. (a–f) Spleen weight, IgG anti‐dsDNA antibodies, proteinuria, BUN, renal pathology GN and interstitial infiltration score were considerably reduced after treatment. (g–i) Circulating mediators including serum IL‐6, IL‐17 and KIM‐1/TIM‐1 were also reduced by PLK1 inhibition. The assays were performed in triplicate. Female MRL.lpr, 10‐week‐old, n = 10 per group. *P < 0.05; **P < 0.01; ***P < 0.001.
PLK1 inhibition modulated splenic B‐cell subsets and activation status in murine lupus
To explore the cellular and molecular basis by which PLK1 modulates lupus nephritis, we first utilised flow cytometry to examine the changes in major splenic cell subsets in MRL.lpr mice 4 weeks after PLK1 blockade in vivo. The detailed gating strategy is shown in Figure 4a, b, and h, and Supplementary figure 2a. Total B cells (B220+) (Figure 4c), germinal centre B cells (B220+GL7+), marginal zone B cells (B220+CD21hiCD23low) and myeloid cells (CD11b+CD11c+) (Figure 4e, i, and g) were reduced after inhibition of PLK1 compared to the placebo group. Moreover, the activation status of germinal centre B cells (B220+GL7+I‐Ab+) and marginal zone B cells (B220+CD21hiCD23low I‐Ab+) was reduced after PLK1 inhibition (Figure 4f and j). However, there were no significant changes in cell populations or activation status of CD3+ T cell, double‐negative CD4−CD8− cells or other T‐cell subsets (Figure 4d and Supplementary figure 2) upon PLK1 inhibition. The same treatment was also applied to B6 mice, and the cell number changes of splenic subsets 4 weeks after in vivo treatment are shown in Supplementary table 2. Taken together, PLK1 blockade appears to ameliorate autoantibody production via the suppression of B‐cell differentiation and activation.
Figure 4.
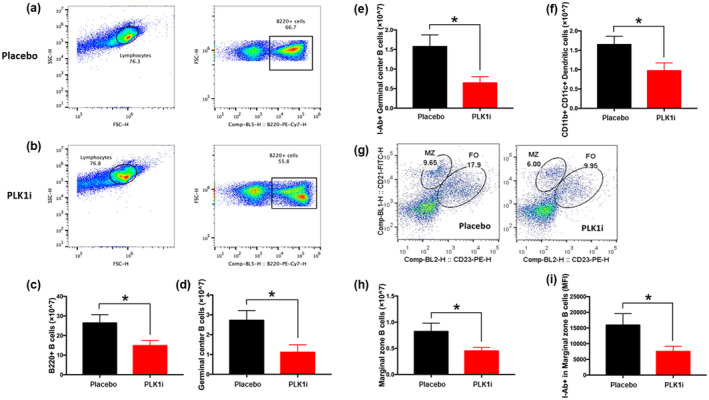
Blocking PLK1 in vivo modulates B‐cell subsets and their activation status. A PLK1‐specific inhibitor was administered to MRL.lpr lupus mice, as detailed in Figure 2. Shown findings were derived when the mice were sacrificed following treatment. B220+ total B cells from (a) the placebo group and (b) the PLK1 inhibitor‐treated group were analysed. (c) Reduced numbers of B220+ total B cells, (e) B220+GL7+ germinal centre B cells, (g) CD11b+CD11c+ dendritic cells and (i) B220+CD21hiCD23low marginal zone B cells were observed after PLK1 blockade compared to the placebo group. (d) Numbers of double negative T cells exhibited no change after inhibitor treatment. (h) Gating strategy to define marginal zone and follicular B cells. Left, Placebo group. Right, Treatment group. (f) Numbers of I‐Ab+ germinal centre B cells were significantly decreased in the treatment group as well as the (j) MFI of the activation marker I‐Ab+ on marginal zone B cells. The assays were performed in triplicate. Female MRL.lpr, n = 10 per group. *P < 0.05.
PLK1 phosphorylation in immune cells was regulated by upstream inflammatory signals
Next, we asked whether the phosphorylation and activation of PLK1 in immune cells and their subsets are regulated by inflammatory signals. We used LPS (TLR4 agonist), CL264 (TLR7 agonist), ODN1585 (TLR9 agonist), anti‐mouse IgM F(ab’)2 and CD40 Ligand to stimulate splenocytes, and intracellular staining was used to assess the phosphorylation of PLK1 at the T210 site. Intracellular staining for phospho‐PLK1 was established with an isotype control, which has the same fluorescent label as the PLK1 (pT210) (Figure 5a). Most cell subsets exhibited upregulation of PLK1 activation following the indicated stimulations except the CD23+CD93+ T2 B cells (Figure 5b, Supplementary table 1).
Figure 5.
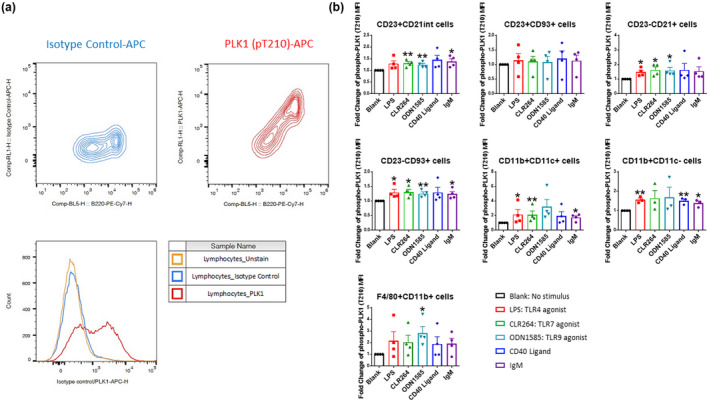
Upregulated phospho‐PLK1(Thr210) expression in splenic cell subsets following various stimuli. (a) Validation of intracellular staining of phosphorylation of PLK1 at Thr210 through flow cytometry analysis. APC labelled isotype control and anti‐PLK1 (pT210) Ab were used for cell staining. PLK1 (pT210) exhibited clear and strong expression in B220+ splenic cells. (b) Splenocytes were cultured with various stimuli and the responses of B cell and myeloid cell subsets to LPS, CL264, ODN1585, CD40L and anti‐IgM were analysed. The assays were performed in triplicate. MFI, mean fluorescence intensity; fold‐change is presented relative to the p‐PLK1 levels on unstimulated cells (‘Blank’). Female MRL.lpr, 10‐week‐old, n = 5 per group. *P < 0.05; **P < 0.01.
PLK1 blockade could modulate cytokine production in vitro
We then investigated how PLK1 activity might be regulated in immune cells upon stimulation with immune triggers, and how PLK1, in turn, controls downstream signalling cascades. In vitro stimulation with CD40 Ab for 24h increased IL‐6 and IL‐10 levels in MRL.lpr splenocytes (Figure 6a), with similar findings noted for IL‐1β and TNFα production with 24‐h IgM stimulation (Figure 6b). Moreover, with PLK1 inhibition in vivo, pro‐inflammatory IL‐6 was decreased upon CD40 Ab stimulation, whereas the anti‐inflammatory IL‐10 was increased upon IgM stimulation (Figure 6). These results suggest that the blockade of PLK1 may be beneficial in ameliorating inflammation in murine lupus.
Figure 6.
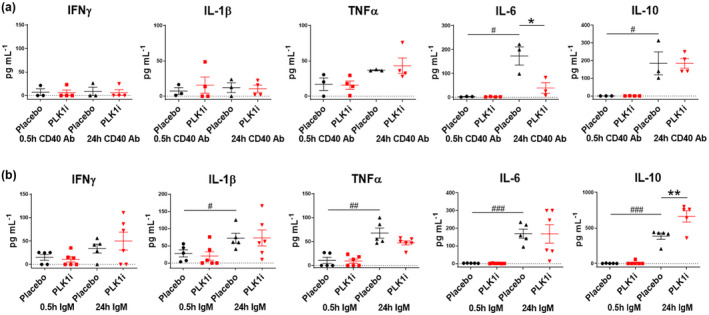
PLK1 regulates inflammatory cytokines induced by anti‐CD40 and anti‐IgM stimulation in vitro. Splenocytes were isolated from MLR.lpr mice, stimulated with (a) anti‐CD40 antibody or (b) anti‐IgM for 0.5 h and 24 h, with or without PLK1 blockade. Secretion of inflammatory cytokine in the culture supernatant were measured by ELISA, including IFNγ, IL‐1β, TNFα, IL‐6 and IL‐10. The assays were performed in triplicate. Female MRL.lpr, 10‐week‐old, n = 3–6 per group. * indicates change between groups. # indicates change within one group. *P < 0.05; **P < 0.01; # P < 0.05; ## P < 0.01; ### P < 0.001.
PLK1 modulates downstream mTOR signalling in lupus mice
Next, we investigated potential downstream signalling pathways regulated by PLK1 in vitro. Splenocytes from 10‐month‐old B6.MRL.lpr mice were isolated and pre‐stimulated with LPS for 1 h and then treated with the PLK1 inhibitor. p‐mTOR (Ser2448)+CD11b+CD11c+ DCs were reduced after PLK1 inhibition (Figure 7a and b). Similarly, the mean fluorescence intensity of p‐mTOR in CD11b+F4/80+ cells (macrophages) was also reduced following PLK1 inhibition (Figure 7c), whereas the phosphorylation of mTOR was not significantly changed in splenic B‐ or T‐cell subsets (Supplementary figure 3). Next, Western blot was used to track phosphorylated mTOR at Ser2448 in splenic cell lysates from MRL.lpr mice treated with the PLK1 inhibitor or placebo in vivo. Indeed, phosphorylation of mTOR and its downstream target eukaryotic initiation factor 4E‐binding protein 1 (4E‐BP1) were both significantly decreased after PLK1 inhibition in vivo (Figure 7d–f). Collectively, these results suggest that PLK1 may lead to the pathogenesis of lupus, in part by regulating mTOR‐mediated signalling (Figure 8).
Figure 7.
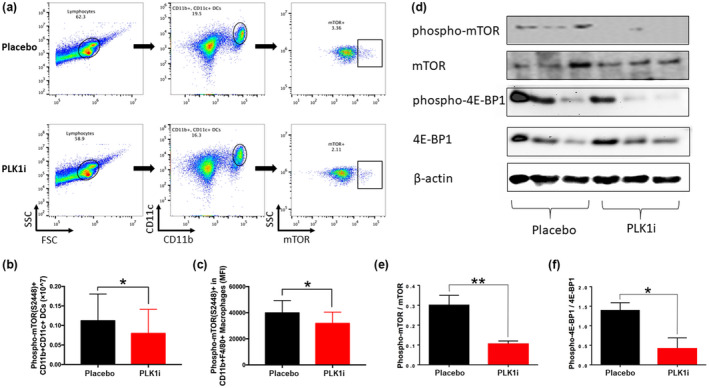
mTOR is a downstream signalling target, potentially regulated by PLK1, in murine lupus. The expression level of phospho‐mTOR (Ser2448) was investigated, and its activity change was also examined after PLK1 inhibition in vitro. (a) Gating strategy for identifying CD11b+CD11c+ dendritic cells, as well as phospho‐mTOR(Ser2448) expression levels in the placebo and treatment groups. Top: Placebo group; Bottom: treatment group. (b) The number of splenic p‐mTOR(Ser2448)+CD11b+CD11c+ dendritic cells was reduced in the PLK1 inhibitor‐treated group. (c) The mean fluorescence intensity of phosphorylated mTOR was decreased in CD11b+F4/80+ splenic macrophages after PLK1 treatment. Female B6.lpr, 10‐month‐old, n = 3 per group. (d–f) Western blot results (with statistical analysis) of mTOR and phospho‐mTOR(Ser2448) expression in total spleen lysates from MRL.lpr mice, and its downstream targets 4E‐BP1 and phospho‐4E‐BP1 (Ser65), after in vivo PLK1 inhibition. Western blot images were cropped and aligned in Microsoft PowerPoint 2016. The assays were performed in triplicate. Female MRL.lpr, 10‐week‐old, n = 3 per group. *P < 0.05; **P < 0.01.
Figure 8.
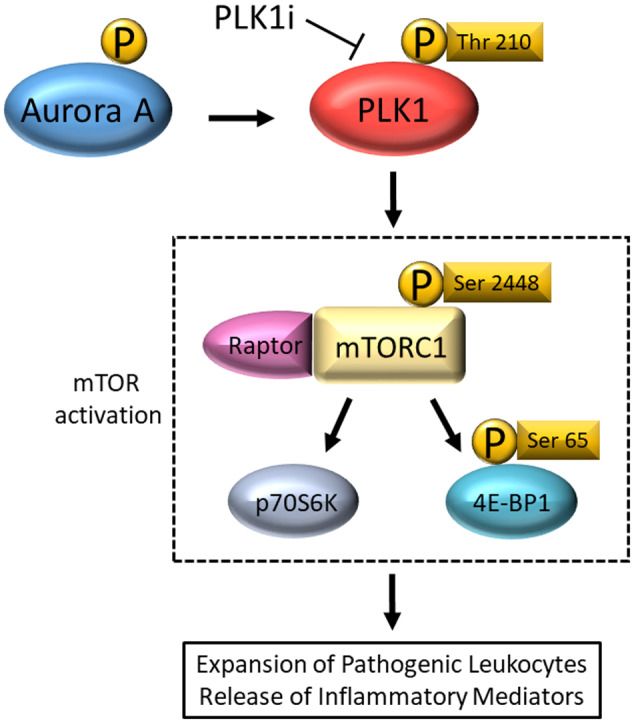
Schematic representation of the PLK1/mTOR signalling pathway. Phosphorylated Aurora‐A is elevated in murine lupus, which is highly conducive to the activation of PLK1. 49 Activation of the PLK1 on Thr 210 regulates downstream mTOR association with a regulatory‐associated protein of mTOR (RAPTOR; a required component of mTORC1), but not the rapamycin‐insensitive companion of mTOR (RICTOR; a required component of mTORC2). 59 Activated 4E‐BP1 is also a consequence of downstream mTORC1 mediated response to PLK1 regulation. 34 Given that all of the above changes are observed in murine lupus, and the observation that PLK1 inhibition ameliorates systemic and renal lupus in mice, the pathogenic cascade shown is likely to be central in lupus pathogenesis.
Discussion
Individual signalling molecules and pathways in lupus have been investigated in various studies 32 , 50 ; for example, RNAi screen and affinity mass spectrometry‐based proteomics were used to reveal NXF1 as a novel regulator of IRF5 signalling. 51 Cyclic GMP‐AMP synthase (cGAS) signalling was examined in lupus patients using multiple reaction monitoring with ultra‐performance liquid chromatography‐tandem mass spectrometry. 52 A previous study by Taher et al. utilised a kinome array to map the substrates of about 50 kinases in B lymphocytes from SLE patients. 53 , 54 Nevertheless, the present study represents by far the most comprehensive activity‐based kinome scanning assays in lupus, using acyl phosphate‐containing nucleotide probes (ActivX Biosciences, Inc.) as detailed elsewhere. 39
PLK1 is a known substrate of cyclin‐dependent kinases (CDKs), an evolutionarily conserved regulator of the cell cycle. 11 , 55 Depletion of PLK1 leads to apoptosis in cancer cells, and long‐term PLK1 inhibition arrests cells in prometaphase. 56 , 57 Using chemical proteomics and unbiased protein kinase inhibitor drug screens, PLK1 was identified as a hub for the MYC‐dependent kinome in a subgroup of aggressive B‐cell lymphomas. 58 Administration of a PLK1 inhibitor diminished cell proliferation of diffuse large B‐cell lymphoma, as well as T‐cell acute lymphoblastic leukaemia. 13 , 15 PLK1 also physically interacts with mTOR complex 1 (MTORC1), and the inhibition of PLK1 promoted mTOR localisation in lysosomes, consequently mitigating autophagy. 59 Consistent with our findings, PLK1 signalling was reported to be one of the top ten canonical signal transduction pathways that were regulated in macrophages at different stages of lupus nephritis. 60
mTOR is a serine/threonine protein kinase that participates in a variety of cell functions, including cell proliferation, cell size regulation, transcription and cytoskeletal regulation. 61 , 62 , 63 Previous studies have identified two mTOR complexes in mammalian cells, mTORC1 and mTORC2. 64 mTORC1 controls downstream functions such as protein translation, cell growth and cell proliferation through regulating the phosphorylation of p70S6 kinase and 4E‐BP1. 65 mTORC2 is implicated in the regulation of the actin cytoskeleton. 66 PI3K/AKT/mTOR has been reported to be a key axis in lupus pathogenesis, 67 and a functional link between PLK1 and the mTOR pathway has been described. 34 Inducible expression of a constitutively active form of PLK1 led to increased phosphorylation of 4E‐BP1 and RPS6, while both pharmacological and siRNA‐mediated inhibition of PLK1 downregulated the activation of the mTOR pathway. 34 Indeed, the PI3K/AKT/mTOR axis has been implied as a potential signalling pathway and therapeutic target in murine lupus. 41 , 68 , 69 Consistently, the present study demonstrates that PLK1 blockade could suppress downstream mTOR signalling in an autoimmune lupus setting, suggesting that PLK1 signalling may play a critical role in the pathogenesis of lupus, acting in part through PI3K/AKT/mTOR signalling.
An essential feature of SLE is the intrinsic tendency of B cells to respond excessively to immune stimulation. 70 Depletion of B cells ameliorates glomerulonephritis and vasculitis in lupus mice, which further underscores the critical role of B cells in murine lupus. 71 In this study, we found that germinal centre B cells and marginal zone B cells, and the cell cycle progression of these B cells may be suppressed by PLK1 blockade, which in turn could attenuate the production of pathogenic autoantibodies. Also, we report that PLK1 phosphorylation may be enhanced in various cell subsets upon stimulation of TLR4, TLR7, TLR9 or B‐cell/T‐cell receptor crosslinking in murine lupus in vitro, whereas the blockade of PLK1 induces the upregulation of IL‐10. These results provide strong evidence for the role of PLK1 as a key regulator of the inflammatory response underlying lupus.
Our studies also suggest that Aurora‐A may be a key regulator of PLK1 in murine lupus. During cell cycle, the initial activation of Aurora‐A in late G2 phase is crucial to recruit cyclin B1‐CDK1 complex to centrosomes, whose activation is required for the commitment of cells to mitosis. 72 Major mitotic regulators, including cyclin B1‐CDK1, PLK1 and Aurora‐A, accumulate at the centrosomes during G2‐M progression. 73 , 74 The balance of phosphorylation and dephosphorylation controls the mitotic activity of Aurora‐A and PLK1 kinases in a temporal and spatial manner. Aurora‐A phosphorylates and activates Thr 210 in PLK1 together with a PLK1‐interacting protein, Bora, at the G2‐M transition. 49 In previous studies, active Aurora‐A phosphorylated at Thr288 was detected before the emergence of PLK1 phosphorylation at T210, while depletion of Aurora‐A prevented the phosphorylation of PLK1‐T210 and delayed mitotic entry. Thus, Aurora‐A was implicated as an upstream regulator of PLK1, where Aurora‐A‐PLK1 activity may depend on a coiled‐coil centrosomal protein, Cep192. 49 , 75 We documented the increased phosphorylation of both Aurora‐A and PLK1‐T210 in lupus‐prone mice, suggesting that Aurora‐A is likely a regulator of PLK1 activation in SLE. Inhibition of Aurora‐A or PLK1 was demonstrated as a potential approach to treat T‐cell acute lymphoblastic leukaemia, while the PLK1 inhibitor alone or the combination of PLK1 and mTORC1 inhibitor could induce significant cytotoxicity in proliferating cells. 15 Finally, mTOR signalling was demonstrated to be linked to Aurora‐A and PLK1 through a Mio‐dependent process, where Mio is a highly conserved member of the SEACAT/GATOR2 complex necessary for the activation of mTORC1 kinase, to regulate mitotic progression. 76
Interestingly, phosphorylation of PLK1(T210) was not reduced in total splenic lymphocytes as well as in various cell subsets after treatment with NMS‐P937 (Supplementary figure 5). This is consistent with a previous study, where increased dosage of NMS‐P937 did not reduce the phosphorylation of PLK1 on Thr210 in cancer cells. 77 These findings may be a consequence of attempted override of drug‐induced PLK1 inhibition through a feedback mechanism involving phosphorylation of increased levels of PLK1, instead of a decrease in phosphorylation, as suggested. 77 Nevertheless, the exact mechanism needs to be further investigated.
Our studies underscore the critical importance of the Aurora‐A → PLK1 → mTOR signalling axis in lupus pathogenesis and highlight this as a potential therapeutic target. Thus far, there are no reports that examine the role of Aurora‐A or PLK1 in murine lupus or human SLE. In contrast, the inhibition of mTOR attenuates lupus or lupus nephritis in various lupus mouse models including MRL.lpr, 78 B6.Sle1.Sle3 69 and NZB/NZW F1. 79 , 80 Treatment with mTOR inhibitor sirolimus significantly attenuates lupus nephritis in the MRL/lpr and NZB × NZW F1 mouse models, 80 while lowered baseline calcium levels and decreased calcium influx following TCR stimulation were shown in SLE patients treated with the mTOR‐specific inhibitor rapamycin. 68 Indeed, mTOR plays an important role in the proliferation and activation of immune cells including B cells, 69 T cells 81 , 82 , 83 and macrophages. 84 Fas mutation causes systemic autoimmunity manifested by lupus‐like phenotypes in MRL.lpr mice. The interaction of Fas with its ligand allows the formation of a death‐inducing signalling complex that includes Fas‐associated death domain protein (FADD), caspase‐8 and caspase‐10. The autoproteolytic processing of the caspases in the complex triggers a downstream caspase cascade and leads to apoptosis. 85 A recent study suggested that phosphorylation by PLK1 may induce the tumor‐suppressing activity of FADD. 86 However, whether and how Fas may directly activate PLK1 is yet to be determined. Whether these mechanisms are relevant to the mode of action of the PLK1 inhibitor in MRL.lpr mice are also unknown.
In summary, we identified PLK1 as a novel signalling molecule in murine lupus using an activity‐based kinome screen. Importantly, blockade of PLK1 mitigated autoantibody production via suppression of antibody‐secreting B cells and ameliorated inflammation via an Aurora‐A/PLK1/mTOR signalling pathway in immune cells. Future studies ought to evaluate the efficacy of this therapeutic approach in reversing advanced lupus nephritis and extend these findings to human SLE.
Methods
Animals
Female C57BL/6J (B6), B6.MRL.lpr and MRL.lpr mice at the age of 6 weeks were purchased from The Jackson Laboratory (Bar Harbor, ME, USA) and housed in a 12‐h light, 12‐h dark cycle climate‐controlled room. B6.Sle1.Sle3 mice were bred as described previously. 87 B6 mice serve as controls for the lupus‐prone mouse strains. Mice were given ad libitum access to food and water. These three lupus‐prone mouse strains share common characteristics with regard to the production of autoantibodies against dsDNA and other nuclear components, but display different degrees of disease severity because of the differences in the lupus‐related genetic susceptibility loci and/or their genetic background. 88 A 24‐h urine collection using metabolic cages was conducted for all mice. Blood samples were collected through the tail vein. All animal experiments were conducted following approved protocols from the Institutional Animal Care and Use Committee (IACUC) at the University of Houston.
Assessment of renal pathology
Renal tissue was processed for histology as described previously. 89 , 90 The glomerular and tubular histological disease scores of each mouse were blindly assessed as follows. The severity of glomerulonephritis (GN) was graded on a 0–4 scale, where 0 = normal; 1 = mild increase in mesangial cellularity and matrix; 2 = moderate increase in mesangial cellularity and matrix, with thickening of the GBM; 3 = focal endocapillary hypercellularity with obliteration of capillary lumina and a substantial increase in the thickness and irregularity of the GBM; and 4 = diffuse endocapillary hypercellularity, segmental necrosis, crescents and hyalinised end‐stage glomeruli. 24‐h proteinuria was measured using a Pierce™ Coomassie (Bradford) Protein Assay Kit (Catalog #23200) from Thermo Scientific (Hanover Park, IL, USA) following the manufacturer’s instructions.
PLK1 inhibitor treatment
NMS‐P937 has been documented to be a highly selective inhibitor of PLK1 when tested on a panel of 63 protein kinases representative of the human kinome superfamily in a previous study. 77 In the in vivo study, MRL.lpr mice were aged to 10 weeks, at which point they began receiving treatment with either the PLK1 inhibitor or vehicle control. For NMS‐P937 (Calbiochem, San Diego, CA, USA), the dosage, administration route and treatment duration were determined based on previous report 77 with some modifications: for the treatment study, the mice were aged to 10 weeks old and then treated with the PLK1 inhibitor or vehicle control (methocel suspension) for a total of 65 days to study the effect of the PLK1 inhibitor after long‐term intervention (n = 10 per group); for the prevention study, the PLK1 inhibitor or vehicle control was administered to the mice at a dose of 40 mg kg−1 via oral gavage twice per week for a total of 4 weeks (n = 10 per group). The mice were sacrificed immediately after treatment. Urine and sera were collected at the initiation and completion of treatment. Age‐matched C57BL/6 mice were also treated with the PLK1 inhibitor NMS‐P937 for 4 weeks (n = 4) or vehicle control (n = 3), and splenic cells were harvested for flow cytometry analysis. For in vitro PLK1 inhibition, splenocytes were pre‐stimulated with LPS (1 µg mL−1) for 1 h, following which the PLK1 inhibitor NMS‐P937 (0.2 µm) was added before subjecting the cells to flow cytometric analysis.
Activity‐based kinome screen (ABKS)
Spleens were harvested from 2‐ to 3‐month‐old B6 and lupus‐prone strains, B6.Sle1.Sle3 and MRL.lpr, and whole spleen protein extracts were obtained. The derived protein lysates were labelled with acyl phosphate‐containing nucleotide probes (ActivX Biosciences, Inc., La Jolla, CA, USA), which react selectively and covalently at the ATP or ADP binding sites of 196 protein kinases. Biotinylated peptide fragments from the labelled proteomes were captured and then sequenced and identified using a mass spectrometry‐based analysis platform to determine the kinases present and their relative levels, as described previously. 39 Mouse spleen kinome data were imported into R with ggplot2 package to generate the heatmap.
Cell culture and stimulation
Splenocytes were isolated and cultured in 96‐well flat‐bottom plates (1 × 10⁷ mL−1) in 100 µL RPMI 1640 medium per well, supplemented with 1 mm sodium pyruvate, 100 U mL−1 penicillin/streptomycin, 5.5 × 10⁻⁵ m β‐mercaptoethanol and 10% foetal bovine serum at 37°C and 5% CO2 constantly. To assess the activation status of PLK1 in vitro, splenocytes were treated with various stimuli separately, including TLR4 agonist LPS (Catalog #L9143) from Sigma‐Aldrich (St. Louis, MO, USA), TLR7 agonist CL264 (Catalog #tlrl‐c264e) and TLR9 agonist ODN1585 (Catalog #tlrl‐1585) from InvivoGen (San Diego, CA, USA), anti‐Mouse IgM F(ab')2 fragment (Catalog #115‐006‐020) from Jackson ImmunoResearch (West Grove, PA, USA) or CD40 ligand (Catalog #CRC803A) from Cell Sciences (Newburyport, MA, USA) for 30 min, and processed for flow cytometry. The level of phospho‐PLK1(Thr210) expression in splenic cell subsets was examined, including B‐cell subsets, namely CD21intCD23+ follicular B cells, CD21+CD23− marginal zone B cells, CD23−CD93+ T1 B cells and CD23+CD93+ T2 B cells, as well as in myeloid cell subsets, namely CD11c+ CD11b+ dendritic cells, CD11b+CD11c− myeloid cells and F4/80+CD11b+ macrophages.
Flow cytometry
Single‐cell suspensions were stained and analysed on a multicolor BD LSR II cell analyzer (BD Biosciences, San Jose, CA, USA). FITC‐, PE‐, PerCP‐, PE/Cy7‐, APC‐ and APC/Cy7‐labelled antibodies against B220 (Clone RA3‐6B2, Catalog #103222), CD3 (Clone 17A2, Catalog #100204), CD4 (Clone GK1.5, Catalog #100408), CD8a (Clone 53‐6.7, Catalog #100732), CD11b (Clone M1/70, Catalog #101206), CD11c (Clone N418, Catalog #117324), CD19 (Clone 6D5, Catalog #115506), GL7 (Clone GL7, Catalog #144610), I‐Ab (Clone AF6‐120.1, Catalog #116419) and F4/80 (Clone BM8, Catalog #123110) were purchased from Biolegend (San Diego, CA, USA). Mouse antibodies to PLK1 (pT210) Alexa 647 (Clone K50‐483, Catalog #558447) and mTOR (pS2448) Alexa 647 (Clone O21‐404, Catalog #564242) were purchased from BD Biosciences. For intracellular staining of PLK1 and mTOR, treated and untreated cells were fixed by adding an equal volume of pre‐warmed Fixation Buffer (Catalog #420801; Biolegend) directly into the culture medium and then incubated at 37°C for 15 min to ensure the cells were well fixed. Cells were centrifuged at 350 g for 5 min at room temperature and then washed with Cell Staining Buffer (Catalog #420201; Biolegend) twice. Cells were resuspended using any residual volume before adding pre‐chilled Perm Buffer III (Catalog #558050; BD Biosciences) and permeabilised at −20°C for 60 min. The cells were next centrifuged, washed and resuspended in Cell Staining Buffer at a concentration of 1 × 10⁷ cells mL−1. Antibody cocktails were added, mixed and incubated for 30 min at room temperature in the dark. Cells were then centrifuged, washed and resuspended in 100 μL of Cell Staining Buffer for analysis on a flow cytometer. Fluorescence Minus One (FMO) controls were included in the assessment of phospho‐PLK1. The data were acquired and analysed using FlowJo software.
Enzyme‐linked immunosorbent assay
Splenocytes were resuspended and embedded into 96‐well plates at a concentration of 1 × 10⁶ cells per well, then treated with anti‐mouse IgM F(ab’)2 fragment or anti‐mouse CD40 monoclonal antibody (Clone HM40‐3, Catalog #102907; Biolegend) for 0.5 or 24 h at 10 µg mL−1 for both stimuli. The supernatant from each well was collected for enzyme‐linked immunosorbent assay (ELISA) analysis. Duoset ELISA Kits from R&D Systems (Minneapolis, MN, USA), including IFNγ (Catalog #DY485), IL‐1β (Catalog #DY401), TNFα (Catalog #DY410), IL‐6 (Catalog #DY406) and IL‐10 (Catalog #DY417), were used to measure cytokine production according to the manufacturer’s instructions. For detection of total immunoglobulin, flat‐bottom 96‐well plates (Catalog #442404; Thermo Fisher) were coated with 2 µg mL−1 goat anti‐mouse IgG (Catalog #1015‐01) from Southern Biotech (Birmingham, AL, USA) or goat anti‐mouse IgM (Catalog #115‐006‐020; Jackson ImmunoResearch) and blocked with 1% BSA in borate‐buffered saline (BBS). After plates were incubated overnight at 4°C, serial dilutions of immunoglobulin (Ig) standards, including mouse IgM (Catalog #010‐0107) from Rockland (Limerick, PA, USA), IgG (Catalog #I5381; Sigma‐Aldrich) or serum samples (serum dilution factor for IgG, 1:40 000, and IgM, 1:10 000) were added in duplicate and incubated for 2 h at room temperature. Bound Igs were detected with alkaline phosphatase‐conjugated goat anti‐mouse IgG (Catalog #2040‐04; Southern Biotech) or goat anti‐mouse IgM (Catalog #626822) from Invitrogen (Carlsbad, CA, USA), and the absorbance at 405 nm was read for quantification.
Western blotting
Cells were lysed with M‐PER™ Mammalian Protein Extraction Reagent (Catalog #78503; Thermo Fisher) on ice for 30 min with vortexing and then sonicated with Q125 Sonicator from Qsonica (Newtown, CT, USA). Lysates were centrifuged at 18,407 g for 15 min at 4°C, and the protein concentration was measured using a BCA kit (Catalog #23225; Thermo Scientific). The cell lysates were adjusted to 5 mg mL−1 to run on SDS‐PAGE. Following electrophoresis, proteins were transferred onto PVDF membranes and incubated with rabbit monoclonal antibodies against Aurora‐A, Phospho‐Aurora‐A, PLK1, Phospho‐PLK1 (Thr210), mTOR or Phospho‐mTOR (Ser2448) from Cell Signaling Technology (Danvers, MA, USA), or with monoclonal antibodies against 4E‐BP1 or Phospho‐4E‐BP1 from Santa Cruz Biotechnology (Dallas, TX, USA). ECL kit (Catalog #1705061) and the Gel Doc™ XR+ System from Bio‐Rad (Hercules, CA, USA) were used to develop and acquire Western blot images. Band intensity was analysed using the ImageJ software (NIH) and normalised by loading control β‐actin levels.
Statistics
Statistical comparisons were performed using the unpaired Student's t‐test for two groups and one‐way ANOVA for multiple groups with Prism 6.0 (GraphPad, San Diego, CA, USA). For all experiments, mean ± SEM is depicted. A P‐value of less than 0.05 was considered significant.
Conflict of interest
The authors declare no conflict of interest.
Author contributions
Yaxi Li (PhD), Hongting Wang (PhD), Zijing Zhang (PhD) and Xinjin Zhou (MD, PhD) carried out experiments. Tianfu Wu (PhD) and Chandra Mohan (MD, PhD) designed the study. Tianfu Wu and Chandra Mohan reviewed the work and manuscript. Yaxi Li, Hongting Wang, Zijing Zhan, Chenling Tang (MSc), Xinjin Zhou and Tianfu Wu analysed the data. Yaxi Li, Tianfu Wu and Chandra Mohan wrote the paper. All authors read and approved the paper.
Ethical approval
All animal experiments were conducted following approved protocols from the Institutional Animal Care and Use Committee (IACUC) at the University of Houston.
Supporting information
Acknowledgments
This work was supported by the Lupus Research Alliance (C110273) to TW, and it was partly supported by an NIH grant R01AG062987 to TW.
Contributor Information
Chandra Mohan, Email: cmohan@central.uh.edu.
Tianfu Wu, Email: twu13@central.uh.edu.
Data availability statement
All data relevant to the study are included in the article or uploaded as supplementary information.
References
- 1. Lipsky PE. Systemic lupus erythematosus: an autoimmune disease of B cell hyperactivity. Nat Immunol 2001; 2: 764–766. [DOI] [PubMed] [Google Scholar]
- 2. Apostolidis SA, Lieberman LA, Kis‐Toth K, Crispin JC, Tsokos GC. The dysregulation of cytokine networks in systemic lupus erythematosus. J Interferon Cytokine Res 2011; 31: 769–779. [DOI] [PMC free article] [PubMed] [Google Scholar]
- 3. Lu R, Munroe ME, Guthridge JM et al. Dysregulation of innate and adaptive serum mediators precedes systemic lupus erythematosus classification and improves prognostic accuracy of autoantibodies. J Autoimmun 2016; 74: 182–193. [DOI] [PMC free article] [PubMed] [Google Scholar]
- 4. Morand EF, Mosca M. Treat to target, remission and low disease activity in SLE. Best Pract Res Clin Rheumatol 2017; 31: 342–350. [DOI] [PubMed] [Google Scholar]
- 5. Cassia M, Alberici F, Gallieni M, Jayne D. Lupus nephritis and B‐cell targeting therapy. Expert Rev Clin Immunol 2017; 13: 951–962. [DOI] [PubMed] [Google Scholar]
- 6. Li Y, Wu T. Proteomic approaches for novel systemic lupus erythematosus (SLE) drug discovery. Expert Opin Drug Discov 2018; 13: 765–777. [DOI] [PubMed] [Google Scholar]
- 7. Schneider M. Target therapy in SLE. Autoimmun Rev 2019; 18: 21–24. [DOI] [PubMed] [Google Scholar]
- 8. Stohl W, Hilbert DM. The discovery and development of belimumab: the anti‐BLyS–lupus connection. Nat Biotechnol 2012; 30: 69–77. [DOI] [PMC free article] [PubMed] [Google Scholar]
- 9. Lamore R III, Parmar S, Patel K, Hilas O. Belimumab (benlysta): a breakthrough therapy for systemic lupus erythematosus. Pharm Ther 2012; 37: 212. [PMC free article] [PubMed] [Google Scholar]
- 10. Stohl W, Hiepe F, Latinis KM et al. Belimumab reduces autoantibodies, normalizes low complement levels, and reduces select B cell populations in patients with systemic lupus erythematosus. Arthritis Rheum 2012; 64: 2328–2337. [DOI] [PMC free article] [PubMed] [Google Scholar]
- 11. Barr FA, Silljé HH, Nigg EA. Polo‐like kinases and the orchestration of cell division. Nat Rev Mol Cell Biol 2004; 5: 429. [DOI] [PubMed] [Google Scholar]
- 12. Lei M, Erikson R. Plk1 depletion in nontransformed diploid cells activates the DNA‐damage checkpoint. Oncogene 2008; 27: 3935. [DOI] [PubMed] [Google Scholar]
- 13. Shi J, Lasky K, Shinde V et al. MLN0905, a small molecule PLK1 inhibitor, induces anti‐tumor responses in human models of diffuse large B‐cell lymphoma. Mol Cancer Ther 2012; 11: 2045–2053. [DOI] [PubMed] [Google Scholar]
- 14. Liu L, Zhang M, Zou P. Expression of PLK1 and survivin in non‐Hodgkin's lymphoma treated with CHOP. Acta Pharmacol Sin 2008; 29: 371–375. [DOI] [PubMed] [Google Scholar]
- 15. Spartà AM, Bressanin D, Chiarini F et al. Therapeutic targeting of Polo‐like kinase‐1 and Aurora kinases in T‐cell acute lymphoblastic leukemia. Cell Cycle 2014; 13: 2237–2247. [DOI] [PMC free article] [PubMed] [Google Scholar]
- 16. Nihal M, Stutz N, Schmit T, Ahmad N, Wood GS. Polo‐like kinase 1 (Plk1) is expressed by cutaneous T‐cell lymphomas (CTCLs), and its downregulation promotes cell cycle arrest and apoptosis. Cell Cycle 2011; 10: 1303–1311. [DOI] [PubMed] [Google Scholar]
- 17. Didier C, Cavelier C, Quaranta M, Demur C, Ducommun B. Evaluation of polo‐like kinase 1 inhibition on the G2/M checkpoint in acute myelocytic leukaemia. Eur J Pharmacol 2008; 591: 102–105. [DOI] [PubMed] [Google Scholar]
- 18. Renner AG, Dos Santos C, Recher C et al. Polo‐like kinase 1 is overexpressed in acute myeloid leukemia and its inhibition preferentially targets the proliferation of leukemic cells. Blood 2009; 114: 659–662. [DOI] [PubMed] [Google Scholar]
- 19. Gleixner KV, Ferenc V, Peter B et al. Polo‐like kinase 1 (Plk1) as a novel drug target in chronic myeloid leukemia: overriding imatinib resistance with the Plk1 inhibitor BI 2536. Cancer Res 2010; 70: 1513–1523. [DOI] [PubMed] [Google Scholar]
- 20. Kelm O, Wind M, Lehmann WD, Nigg EA. Cell cycle‐regulated phosphorylation of the XenopusPolo‐like kinase Plx1. J Biol Chem 2002; 277: 25247–25256. [DOI] [PubMed] [Google Scholar]
- 21. Jang Y‐J, Ma S, Terada Y, Erikson RL. Phosphorylation of threonine 210 and the role of serine 137 in the regulation of mammalian polo‐like kinase. J Biol Chem 2002; 277: 44115–44120. [DOI] [PubMed] [Google Scholar]
- 22. Jang Y‐J, Lin C‐Y, Ma S, Erikson RL. Functional studies on the role of the C‐terminal domain of mammalian polo‐like kinase. Proc Natl Acad Sci USA 2002; 99: 1984–1989. [DOI] [PMC free article] [PubMed] [Google Scholar]
- 23. Elia AEH, Rellos P, Haire LF et al. The molecular basis for phosphodependent substrate targeting and regulation of Plks by the Polo‐box domain. Cell 2003; 115: 83–95. [DOI] [PubMed] [Google Scholar]
- 24. Craig SN, Wyatt MD, McInnes C. Current assessment of polo‐like kinases as anti‐tumor drug targets. Expert Opin Drug Discov 2014; 9: 773–789. [DOI] [PubMed] [Google Scholar]
- 25. Eckerdt F, Yuan J, Strebhardt K. Polo‐like kinases and oncogenesis. Oncogene 2005; 24: 267. [DOI] [PubMed] [Google Scholar]
- 26. Takai N, Hamanaka R, Yoshimatsu J, Miyakawa I. Polo‐like kinases (Plks) and cancer. Oncogene 2005; 24: 287. [DOI] [PubMed] [Google Scholar]
- 27. Strebhardt K, Ullrich A. Targeting polo‐like kinase 1 for cancer therapy. Nat Rev Cancer 2006; 6: 321. [DOI] [PubMed] [Google Scholar]
- 28. Li M, Liu Z, Wang X. Exploration of the combination of PLK1 inhibition with immunotherapy in cancer treatment. J Oncol 2018; 2018: 1–13. [DOI] [PMC free article] [PubMed] [Google Scholar]
- 29. La Cava A, Fang CJ, Singh RP, Ebling F, Hahn BH. Manipulation of immune regulation in systemic lupus erythematosus. Autoimmun Rev 2005; 4: 515–519. [DOI] [PubMed] [Google Scholar]
- 30. Chan O, Shlomchik MJ. A new role for B cells in systemic autoimmunity: B cells promote spontaneous T cell activation in MRL‐lpr/lpr mice. J Immunol 1998; 160: 51–59. [PubMed] [Google Scholar]
- 31. Tsokos GC, Wong HK, Enyedy EJ, Nambiar MP. Immune cell signaling in lupus. Curr Opin Rheumatol 2000; 12: 355–363. [DOI] [PubMed] [Google Scholar]
- 32. Moulton VR, Tsokos GC. Abnormalities of T cell signaling in systemic lupus erythematosus. Arthritis Res Ther 2011; 13: 207. [DOI] [PMC free article] [PubMed] [Google Scholar]
- 33. Choi BH, Pagano M, Dai W. Plk1 protein phosphorylates phosphatase and tensin homolog (PTEN) and regulates its mitotic activity during the cell cycle. J Biol Chem 2014; 289: 14066–14074. [DOI] [PMC free article] [PubMed] [Google Scholar]
- 34. Renner AG, Créancier L, Dos Santos C et al. A functional link between polo‐like kinase 1 and the mammalian target‐of‐rapamycin pathway? Cell Cycle 2010; 9: 1690–1696. [DOI] [PubMed] [Google Scholar]
- 35. Kreis N‐N, Sommer K, Sanhaji M et al. Long‐term downregulation of Polo‐like kinase 1 increases the cyclin‐dependent kinase inhibitor p21WAF1/CIP1. Cell Cycle 2009; 8: 460–472. [DOI] [PubMed] [Google Scholar]
- 36. El Maadidi S, Weber ANR, Motshwene P et al. Putative link between Polo‐like kinases (PLKs) and Toll‐like receptor (TLR) signaling in transformed and primary human immune cells. Sci Rep 2019; 9: 1316. [DOI] [PMC free article] [PubMed] [Google Scholar]
- 37. Hu J, Wang G, Liu X, Zhou L, Jiang M, Yang L. Polo‐like kinase 1 (PLK1) is involved in toll‐like receptor (TLR)‐mediated TNF‐α production in monocytic THP‐1 cells. PLoS One 2013; 8: e78832. [DOI] [PMC free article] [PubMed] [Google Scholar]
- 38. Der E, Suryawanshi H, Morozov P et al. Tubular cell and keratinocyte single‐cell transcriptomics applied to lupus nephritis reveal type I IFN and fibrosis relevant pathways. Nat Immunol 2019; 20: 915. [DOI] [PMC free article] [PubMed] [Google Scholar]
- 39. Patricelli MP, Szardenings AK, Liyanage M et al. Functional interrogation of the kinome using nucleotide acyl phosphates. Biochemistry 2007; 46: 350–358. [DOI] [PubMed] [Google Scholar]
- 40. Suárez‐Fueyo A, Rojas JM, Cariaga AE et al. Inhibition of PI3Kδ reduces kidney infiltration by macrophages and ameliorates systemic lupus in the mouse. J Immunol 2014; 193: 544–554. [DOI] [PubMed] [Google Scholar]
- 41. Barber DF, Bartolomé A, Hernandez C et al. PI3Kγ inhibition blocks glomerulonephritis and extends lifespan in a mouse model of systemic lupus. Nat Med 2005; 11: 933–935. [DOI] [PubMed] [Google Scholar]
- 42. Ikeda K, Hayakawa K, Fujishiro M et al. JAK inhibitor has the amelioration effect in lupus‐prone mice: the involvement of IFN signature gene downregulation. BMC Immunol 2017; 18: 41. [DOI] [PMC free article] [PubMed] [Google Scholar]
- 43. Furumoto Y, Smith CK, Blanco L et al. Tofacitinib ameliorates murine lupus and its associated vascular dysfunction. Arthritis Rheumatol 2017; 69: 148–160. [DOI] [PMC free article] [PubMed] [Google Scholar]
- 44. Grolleau A, Kaplan MJ, Hanash SM, Beretta L, Richardson B. Impaired translational response and increased protein kinase PKR expression in T cells from lupus patients. J Clin Invest 2000; 106: 1561–1568. [DOI] [PMC free article] [PubMed] [Google Scholar]
- 45. Corradetti C, Jog NR, Gallucci S, Madaio M, Balachandran S, Caricchio R. Immune‐mediated nephropathy and systemic autoimmunity in mice does not require receptor interacting protein kinase 3 (RIPK3). PLoS One 2016; 11: e0163611. [DOI] [PMC free article] [PubMed] [Google Scholar]
- 46. Griger Z, Tóth BI, Baráth S et al. Different effects of Bortezomib on the expressions of various protein kinase C isoenzymes in T cells of patients with systemic lupus erythematosus and in Jurkat cells. Scand J Immunol 2012; 75: 243–248. [DOI] [PubMed] [Google Scholar]
- 47. Gorelik G, Fang JY, Wu A, Sawalha AH, Richardson B. Impaired T cell protein kinase Cδ activation decreases ERK pathway signaling in idiopathic and hydralazine‐induced lupus. J Immunol 2007; 179: 5553–5563. [DOI] [PubMed] [Google Scholar]
- 48. Taylor S, Peters J‐M. Polo and Aurora kinases—lessons derived from chemical biology. Curr Opin Cell Biol 2008; 20: 77–84. [DOI] [PubMed] [Google Scholar]
- 49. Seki A, Coppinger JA, Jang C‐Y, Yates JR, Fang G. Bora and the kinase Aurora a cooperatively activate the kinase Plk1 and control mitotic entry. Science 2008; 320: 1655–1658. [DOI] [PMC free article] [PubMed] [Google Scholar]
- 50. Huck S, Corre RL, Youinou P, Zouali M. Expression of B cell receptor‐associated signaling molecules in human lupus. Autoimmunity 2001; 33: 213–224. [DOI] [PubMed] [Google Scholar]
- 51. Fu B, Zhao M, Wang L et al. RNAi screen and proteomics reveal NXF1 as a novel regulator of IRF5 signaling. Sci Rep 2017; 7: 2683. [DOI] [PMC free article] [PubMed] [Google Scholar]
- 52. An J, Durcan L, Karr RM et al. Expression of cyclic GMP‐AMP synthase in patients with systemic lupus erythematosus. Arthritis Rheumatol 2017; 69: 800–807. [DOI] [PubMed] [Google Scholar]
- 53. Taher TE, Parikh K, Flores‐Borja F et al. Protein phosphorylation and kinome profiling reveal altered regulation of multiple signaling pathways in B lymphocytes from patients with systemic lupus erythematosus. Arthritis Rheum 2010; 62: 2412–2423. [DOI] [PubMed] [Google Scholar]
- 54. Sui W, Hou X, Che W, Yang M, Dai Y. The applied basic research of systemic lupus erythematosus based on the biological omics. Genes Immun 2013; 14: 133–146. [DOI] [PubMed] [Google Scholar]
- 55. Errico A, Deshmukh K, Tanaka Y, Pozniakovsky A, Hunt T. Identification of substrates for cyclin dependent kinases. Adv Enzyme Regul 2010; 50: 375–399. [DOI] [PubMed] [Google Scholar]
- 56. Liu X, Erikson RL. Polo‐like kinase (Plk) 1 depletion induces apoptosis in cancer cells. Proc Natl Acad Sci USA 2003; 100: 5789–5794. [DOI] [PMC free article] [PubMed] [Google Scholar]
- 57. Lénárt P, Petronczki M, Steegmaier M et al. The small‐molecule inhibitor BI 2536 reveals novel insights into mitotic roles of polo‐like kinase 1. Curr Biol 2007; 17: 304–315. [DOI] [PubMed] [Google Scholar]
- 58. Ren Y, Bi C, Zhao X et al. PLK1 stabilizes a MYC‐dependent kinase network in aggressive B cell lymphomas. J Clin Invest 2018; 128: 5517–5530. [DOI] [PMC free article] [PubMed] [Google Scholar]
- 59. Ruf S, Heberle AM, Langelaar‐Makkinje M et al. PLK1 (polo like kinase 1) inhibits MTOR complex 1 and promotes autophagy. Autophagy 2017; 13: 486–505. [DOI] [PMC free article] [PubMed] [Google Scholar]
- 60. Bethunaickan R, Berthier CC, Ramanujam M et al. A unique hybrid renal mononuclear phagocyte activation phenotype in murine systemic lupus erythematosus nephritis. J Immunol 2011; 186: 4994–5003. [DOI] [PMC free article] [PubMed] [Google Scholar]
- 61. Harris TE, Lawrence JC. TOR signaling. Sci STKE 2003; 2003: re15. [DOI] [PubMed] [Google Scholar]
- 62. Jacinto E, Hall MN. Tor signalling in bugs, brain and brawn. Nat Rev Mol Cell Biol 2003; 4: 117. [DOI] [PubMed] [Google Scholar]
- 63. Wullschleger S, Loewith R, Hall MN. TOR signaling in growth and metabolism. Cell 2006; 124: 471–484. [DOI] [PubMed] [Google Scholar]
- 64. Guertin DA, Sabatini DM. Defining the role of mTOR in cancer. Cancer Cell 2007; 12: 9–22. [DOI] [PubMed] [Google Scholar]
- 65. Loewith R, Jacinto E, Wullschleger S et al. Two TOR complexes, only one of which is rapamycin sensitive, have distinct roles in cell growth control. Mol Cell 2002; 10: 457–468. [DOI] [PubMed] [Google Scholar]
- 66. Jacinto E, Loewith R, Schmidt A et al. Mammalian TOR complex 2 controls the actin cytoskeleton and is rapamycin insensitive. Nat Cell Biol 2004; 6: 1122. [DOI] [PubMed] [Google Scholar]
- 67. Xie C, Patel R, Wu T et al. PI3K/AKT/mTOR hypersignaling in autoimmune lymphoproliferative disease engendered by the epistatic interplay of Sle1b and FASlpr. Int Immunol 2007; 19: 509–522. [DOI] [PubMed] [Google Scholar]
- 68. Fernandez D, Perl A. mTOR signaling: a central pathway to pathogenesis in systemic lupus erythematosus? Discov Med 2010; 9: 173. [PMC free article] [PubMed] [Google Scholar]
- 69. Wu T, Qin X, Kurepa Z et al. Shared signaling networks active in B cells isolated from genetically distinct mouse models of lupus. J Clin Invest 2007; 117: 2186–2196. [DOI] [PMC free article] [PubMed] [Google Scholar]
- 70. Grammer A, Dorner T, Lipsky P. Abnormalities in B cell activity and the immunoglobulin repertoire in human systemic lupus erythematosus. Mol Pathol Autoimmune Dis 2001; 2: 282–318. [Google Scholar]
- 71. Shlomchik MJ, Madaio MP, Ni D, Trounstein M, Huszar D. The role of B cells in lpr/lpr‐induced autoimmunity. J Exp Med 1994; 180: 1295–1306. [DOI] [PMC free article] [PubMed] [Google Scholar]
- 72. Hirota T, Kunitoku N, Sasayama T et al. Aurora‐A and an interacting activator, the LIM protein Ajuba, are required for mitotic commitment in human cells. Cell 2003; 114: 585–598. [DOI] [PubMed] [Google Scholar]
- 73. Jackman M, Lindon C, Nigg EA, Pines J. Active cyclin B1–Cdk1 first appears on centrosomes in prophase. Nat Cell Biol 2003; 5: 143. [DOI] [PubMed] [Google Scholar]
- 74. Lane HA, Nigg EA. Antibody microinjection reveals an essential role for human polo‐like kinase 1 (Plk1) in the functional maturation of mitotic centrosomes. J Cell Biol 1996; 135: 1701–1713. [DOI] [PMC free article] [PubMed] [Google Scholar]
- 75. Joukov V, Walter JC, De Nicolo A. The Cep192‐organized aurora A‐Plk1 cascade is essential for centrosome cycle and bipolar spindle assembly. Mol Cell 2014; 55: 578–591. [DOI] [PMC free article] [PubMed] [Google Scholar]
- 76. Platani M, Trinkle‐Mulcahy L, Porter M, Jeyaprakash AA, Earnshaw WC. Mio depletion links mTOR regulation to Aurora A and Plk1 activation at mitotic centrosomes. J Cell Biol 2015; 210: 45–62. [DOI] [PMC free article] [PubMed] [Google Scholar]
- 77. Valsasina B, Beria I, Alli C et al. NMS‐P937, an orally available, specific small‐molecule polo‐like kinase 1 inhibitor with antitumor activity in solid and hematologic malignancies. Mol Cancer Ther 2012; 11: 1006–1016. [DOI] [PubMed] [Google Scholar]
- 78. Warner LM, Adams L, Sehgal S. Rapamycin prolongs survival and arrests pathophysiologic changes in murine systemic lupus erythematosus. Arthritis Rheum 1994; 37: 289–297. [DOI] [PubMed] [Google Scholar]
- 79. Stylianou K, Petrakis I, Mavroeidi V et al. The PI3K/Akt/mTOR pathway is activated in murine lupus nephritis and downregulated by rapamycin. Nephrol Dial Transplant 2011; 26: 498–508. [DOI] [PubMed] [Google Scholar]
- 80. Reddy PS, Legault HM, Sypek JP et al. Mapping similarities in mTOR pathway perturbations in mouse lupus nephritis models and human lupus nephritis. Arthritis Res Ther 2008; 10: R127. [DOI] [PMC free article] [PubMed] [Google Scholar]
- 81. Kato H, Perl A. Blockade of Treg cell differentiation and function by the interleukin‐21–mechanistic target of rapamycin axis via suppression of autophagy in patients with systemic lupus erythematosus. Arthritis Rheumatol 2018; 70: 427–438. [DOI] [PMC free article] [PubMed] [Google Scholar]
- 82. Fernandez D, Bonilla E, Mirza N, Niland B, Perl A. Rapamycin reduces disease activity and normalizes T cell activation–induced calcium fluxing in patients with systemic lupus erythematosus. Arthritis Rheum 2006; 54: 2983–2988. [DOI] [PMC free article] [PubMed] [Google Scholar]
- 83. Lai ZW, Hanczko R, Bonilla E et al. N‐acetylcysteine reduces disease activity by blocking mammalian target of rapamycin in T cells from systemic lupus erythematosus patients: a randomized, double‐blind, placebo‐controlled trial. Arthritis Rheum 2012; 64: 2937–2946. [DOI] [PMC free article] [PubMed] [Google Scholar]
- 84. Shi G, Li D, Li X et al. mTOR inhibitor INK128 attenuates systemic lupus erythematosus by regulating inflammation‐induced CD11b+ Gr1+ cells. Biochim Biophys Acta Mol Basis Dis 2019; 1865: 1–13. [DOI] [PubMed] [Google Scholar]
- 85. Micheau O, Thome M, Schneider P et al. The long form of FLIP is an activator of caspase‐8 at the Fas death‐inducing signaling complex. J Biol Chem 2002; 277: 45162–45171. [DOI] [PubMed] [Google Scholar]
- 86. Jang M, Lee S, Kim C, Lee C, Kim E. Phosphorylation by polo‐like kinase 1 induces the tumor‐suppressing activity of FADD. Oncogene 2011; 30: 471–481. [DOI] [PubMed] [Google Scholar]
- 87. Mohan C, Morel L, Yang P et al. Genetic dissection of lupus pathogenesis: a recipe for nephrophilic autoantibodies. J Clin Invest 1999; 103: 1685–1695. [DOI] [PMC free article] [PubMed] [Google Scholar]
- 88. Dai R, Zhang Y, Khan D et al. Identification of a common lupus disease‐associated microRNA expression pattern in three different murine models of lupus. PLoS One 2010; 5: e14302. [DOI] [PMC free article] [PubMed] [Google Scholar]
- 89. Wu T, Xie C, Bhaskarabhatla M et al. Excreted urinary mediators in an animal model of experimental immune nephritis with potential pathogenic significance. Arthritis Rheum 2007; 56: 949–959. [DOI] [PubMed] [Google Scholar]
- 90. Wu T, Fu Y, Brekken D et al. Urine proteome scans uncover total urinary protease, prostaglandin D synthase, serum amyloid P, and superoxide dismutase as potential markers of lupus nephritis. J Immunol 2010; 184: 2183–2193. [DOI] [PMC free article] [PubMed] [Google Scholar]
Associated Data
This section collects any data citations, data availability statements, or supplementary materials included in this article.
Supplementary Materials
Data Availability Statement
All data relevant to the study are included in the article or uploaded as supplementary information.