Abstract
Background: Defects in methylenetetrahydrofolate dehydrogenase 1-like (MTHFD1L) expression have earlier been examined in only a few human cancers. Objectives: Multi-omics profiling of MTHFD1L as a shared biomarker in distinct subtypes of human cancers. Methods: In the current study, for the multi-omics analysis of MTHFD1L in 24 major subtypes of human cancers, a comprehensive in silico approach was adopted to mine different open access online databases including UALCAN, Kaplan–Meier (KM) plotter, LOGpc, GEPIA, Human Protein Atlas (HPA), Gene Expression across Normal and Tumor tissue (GENT2), MEXPRESS, cBioportal, STRING, DAVID, TIMER, and Comparative Toxicogenomics Database (CTD). Results: We noticed that the expression of MTHFD1L was significantly higher in all the analyzed 24 subtypes of human cancers as compared with the normal controls. Moreover, MTHDF1L overexpression was also found to be significantly associated with the reduced overall survival (OS) duration of Bladder urothelial cancer (BLCA), Head and neck cancer (HNSC), Kidney renal papillary cell carcinoma (KIRP), Lung adenocarcinoma (LUAD), and Uterine corpus endometrial carcinoma (UCEC). This implies that MTHFD1L plays a significant role in the development and progression of these cancers. We further noticed that MTHFD1L was also overexpressed in BLCA, HNSC, KIRP, LUAD, and UCEC patients of different clinicopathological features. Pathways enrichment analysis revealed the involvement of MTHFD1L-associated genes in five diverse pathways. We also explored few interesting correlations between MTHFD1L expression and its promoter methylation, genetic alterations, CNVs, and between CD8+ T immune cells level. Conclusion: In conclusion, our results elucidated that MTHFD1L can serve as a shared diagnostic and prognostic biomarker in BLCA, HNSC, KIRP, LUAD, and UCEC patients of different clinicopathological features.
Keywords: Biomarker, Cancer, Expression variations, MTHFD1L
Introduction
Cancer is the second most common cause of mortality behind cardiovascular diseases worldwide [1]. Despite improvements in cancer detection and treatment methods, cancer incidence continues to rise rapidly, resulting in huge economic losses and premature deaths throughout the world [2]. In accordance with the World Health Organization (WHO) Cancer Stats 2020, approximately 18 million new cancer cases and 9.6 million deaths were estimated around the globe [3].
Many well-known cancer-causing risk factors include tobacco smoking, alcohol consumption, hepatitis B or C infection, diabetes, and obesity [2,4,5]. When someone tests positive for cancer, its prognosis mainly depends on the stage of the tumor at the time of detection. The early diagnosis of cancer is useful to obtain the more appropriate treatment options [6]. However, prior to our knowledge, there is a dearth of effective cancer-associated biomarkers that could commonly use to detect multiple cancer subtypes together as a shared biomarker and aid in the targeted therapy.
Metabolic disorders are one of the key cancer hallmarks because of their involvement in tumor growth and invasion [7]. Mainly, cancerous cells depend upon the folate cycle to grow further. The folate cycle is responsible for fulfilling numerous cancer-associated nutritional requirements. A cytoplasmic enzyme, known as Methylenetetrahydrofolate dehydrogenase 1-like (MTHFD1L) participates in the formation of tetrahydrofolate (THF) within mitochondria [8], which is further involved in the folic acid cycle to synthesize formate [9]. Folic acid deficiency can lead to a variety of diseases including immune system dysfunction and cancer [10]. In 1949, Farber and Farber were the first to observe the tumor-associated role of folic acid in leukemic cells [11]. Their keen observation of folate’s cancer-associated role has laid the foundation of chemotherapeutic agents development as a single or in combination with treatment options for cancer patients [11]. A recent report revealed that MTHFD1L plays a vital role in bladder cancer by increasing cell proliferation, invasion and metastasis [12], however, their results were not validated further. Another study has also reported the role of MTHFD1L in colorectal cancer (CRC) development and progression. In view of the results of this study, MTHFD1L expression blocking reduces the CRC cells growth and development, thus providing MTHFD1L as a new avenue in CRC treatment to be targeted with different inhibitors [9]. Furthermore, MTHFD1L was also found to be associated with esophageal squamous cell carcinoma (ESCA) [13] and tongue squamous cell carcinoma [14]. Despite the significance of MTHFD1L in bladder cancer, CRC, ESCA and squamous cell carcinoma, knowledge regarding its role in other subtypes of human cancer is still unknown.
In the present work, to uncover the MTHFD1L expression variations across different cancers, we analyzed a large tumor sample size paired with controls from different reliable online databases through a comprehensive bioinformatics approach. The findings of the present study have helped us to evaluate the crucial role of MTHFD1L as a shared biomarker in predicting the prognosis, performing the diagnosis, and initiating the development of Bladder urothelial cancer (BLCA), Head and neck cancer (HNSC), Kidney renal papillary cell carcinoma (KIRP), Lung adenocarcinoma (LUAD), and Uterine corpus endometrial carcinoma (UCEC).
Methods
UALCAN
UALCAN (http://ualcan.path.uab.edu) is an effective online tool for multi-omics data analysis of any gene(s) of interest across 31 cancer subtypes. This tool obtained multi-omics data from the TCGA projects [15] and also provide correlations between gene expression and different relevant clinicopathological features. In our study, this tool was selected to determine the differential expression of MTHFD1L in various cancer subtypes relative to normal controls. For this purpose, we initially entered MTHFDL1 gene name in the search box of UALCAN, then chose the pan-cancer analysis option to obtain the graph illustrating MTHFDL1 expression across multiple cancers in the form of box plots. In the obtained graph, the transcription expression level of MTHFD1L was quantified as transcript per million (TPM) reads, and a cutoff of P-value was selected as <0.05 in the Student’s t test.
Kaplan–Meier plotter, GEPIA, UALCAN, and LOGpc tools
The prognostic values (OS duration) of MTHFD1L across different cancers was analyzed via Kaplan–Meier (KM) plotter (https://kmplot.com/analysis/) and GEPIA (http://gepia.cancer-pku.cn/) tools [16,17]. Moreover, UALCAN (http://ualcan.path.uab.edu) [15] was used to evaluate MTHFD1L prognostic values in cancer patients of different stages, races and genders, while LOGpc (https://bio.tools) [18] has helped to explore MTHFD1L prognostic values in cancer patients of different age groups. To do so, we entered the name of the MTHFDL1 gene into the search boxes of each tool, then adjusted the survival analysis type to OS and clinical parameters to cancer stage, race, gender in case of UALCAN, while age in the case of LOGpc. We then plotted the KM curves using default settings. During the analysis, cancer specimens were categorized into two groups by median expression level (high v/s low expression level) and a P-value was selected as <0.05.
Gene Expression across Normal and Tumor tissue database
For further validating the MTHFD1L transcription expression in tumor tissues, we analyzed NCBI GEO datasets of independent cohorts of distinct cancer patients using Gene Expression across Normal and Tumor tissue (GENT2) database with default settings (http://gent2.appex.kr/) [19]. In the analysis, a cutoff of P-value was selected as <0.05 in the Student’s t test.
Data mining through Human Protein Atlas database
The Human Protein Atlas (HPA) database (http://www.proteinatlas.org) provides immunohistochemistry (IHC)-based proteomics expression data for any gene(s) of interest across more than 20 major subtypes of human cancers [20]. Via this database, researchers can easily identify the differentially expressed protein in the tissues of a specific cancer relative to controls. In this work, the IHC images of MTHFD1L proteomics expression in distinct human cancer tissues relative to normal tissues were visualized via HPA. The observed protein expression level was graded as not detected, low, medium and high, based on the intensity of staining and fraction of the stained cells. A P-value of <0.05 was chosen as significant.
MEXPRESS
MEXPRESS (https://mexpress.be/) web tool is designed for TCGA gene expression, promoter methylation, and a Pearson correlation analysis between these parameters for any gene(s) of interest in distinct cancer subtypes [21]. In our study, we used this tool to find out the correlation among expression and promoter methylation level of MTHFD1L in distinct cancer subtypes with default settings. A cutoff of P-value was selected as <0.05 in the Pearson correlation test.
The cBioportal database
The cBio000Portal (http://cbioportal.org) open-access database is dedicated to analyzing multi-omics cancer data from TCGA projects, which collectively includes more than 715 datasets and 86733 cancer samples [22]. In this study, different TCGA PanCancer Atlas datasets were chosen to examine MTHFD1L genomic alterations (mutations and copy number variations) across distinct human cancer subtypes. The search terms included mutations and putative copy number for MTHFD1L. The OncoPrint tab on the cBioPortal results interface has provided the overview of genetic mutations and CNVs above every sample bar.
Predicted protein–protein interaction network and pathways of MTHFD1L
In the current study, STRING tool (https://string-db.org/cgi/input?sessionId=befKymonvu2t&input_page_show_search=on) [23], which is dedicated to predicting protein–protein interactions (PPIs) of any gene(s) of interest, was used to obtain the PPI network of MTHFD1L-associated genes with default settings. Later, for the pathway enrichment of MTHFD1L-enriched genes, DAVID (http://david.ncifcrf.gov/summary.jsp) [24] was utilized with the default settings. A P-value of <0.05 was considered as significant in the analysis.
Infiltrating level of CD8+ T in relationship with MTHFD1L across different human cancers
TIMER database (https://cistrome.shinyapps.io/timer/) systematically used microarray-based expression values for computing a Pearson correlation between immune cell infiltrates and the expression level of any gene(s) of interest across diverse cancer subtypes from TCGA data (10897 samples across 32 cancer types) [25]. In our study, CD8+ T immune cell infiltrates of MTHFD1L in different cancers were calculated using TIMER, and a P-value of <0.05 was considered as significant in the Pearson correlation test.
Chemotherapeutic drugs associated with MTHFD1L
MTHFD1L-associated chemotherapeutic drugs were obtained from the Comparative Toxicogenomics Database (CTD) [26] database for constructing a gene–drug interaction network via Cytoscape. This database can also be used to analyze gene–chemistry, gene–disease, and chemical–disease interaction networks. In our study, a constructed MTHFD1L gene–drug interaction network includes information on chemotherapeutic drugs that can reduce or enhance the expression level of MTHFD1L.
Results
MTHFD1L expression in human cancers and normal tissues
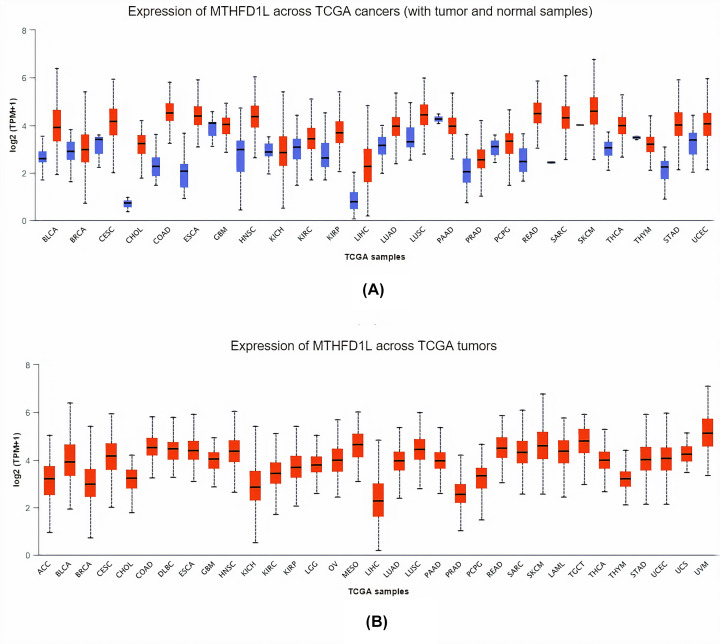
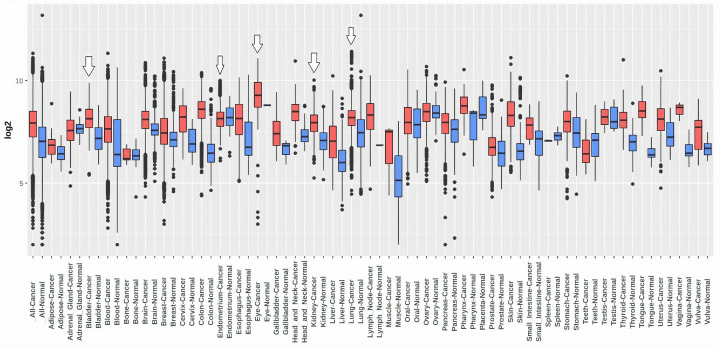
To explore the MTHFD1L mRNA expression levels in 24 major subtypes of human cancer tissues paired with normal control, TCGA expression data were analyzed using pan-cancer analysis via UALCAN platform. Results of the analysis showed a significant (P<0.05) up-regulation of MTHFD1L in all 24 major cancer tissues relative to controls (Figure 1).
Figure 1. The analysis of difference in transcription level of MTHFD1L in different human cancer tissues paired with normal controls.
(A) Transcription level analysis of MTHFD1L across cancerous samples paired with normal controls, and (B) transcription level analysis of MTHFD1L across cancerous samples only without relating to normal controls. Blue color represents the normal samples, while red color indicates the cancer samples. A P-value (<0.05) was considered as statistically significant.
The prognostic values of MTHFD1L in human cancers calculated via KM plotter and GEPIA
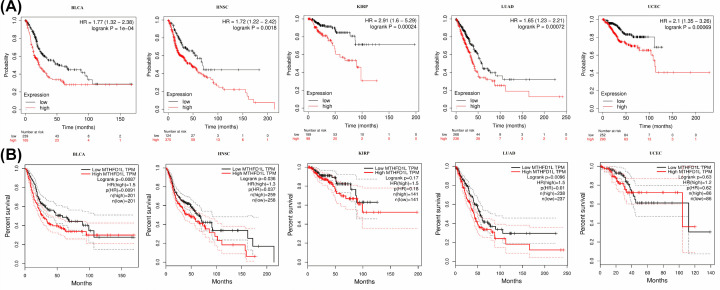
Next, to check whether MTHFD1L higher expression has any effect on the overall survival (OS) duration of the 24 types of cancer patients or not, we used KM plotter and GEPIA tools for OS analysis. In view of both resources collective results, a higher MTHFD1L expression was found to be associated with the reduced OS duration of the BLCA, ESCA, HNSC, KIRP, LUAD, and UCEC patients only and not with any other subtype (Figure 2). Altogether, our data suggested that MTHFD1L might have a significant contribution to the development and progression of BLCA, HNSC, KIRP, LUAD, and UCEC, thus the next part of our study will mainly focus on the unique role of MTHFD1L in these five types of human cancers.
Figure 2. UALCAN and GEPIA-based correlation analysis of MTHFD1L overexpression with the OS of distinct cancer patients.
(A) UALCAN-based correlation analysis of MTHFD1L overexpression with the OS of BLCA, HNSC, KIRP, LUAD, and UCEC patients, and (B) GEPIA-based correlation analysis of MTHFD1L overexpression with the OS of BLCA, HNSC, KIRP, LUAD, and UCEC patients. A P-value (<0.05) was considered as statistically significant.
Clinicopathological feature-specific mRNA expression of MTHFD1L
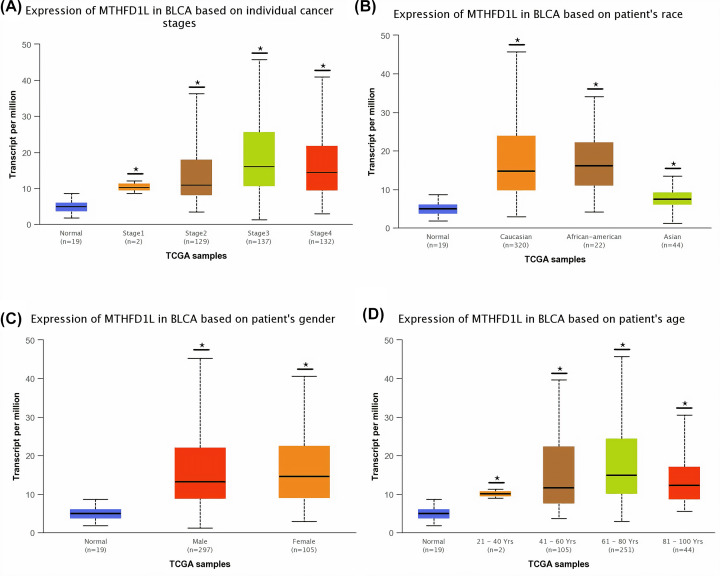
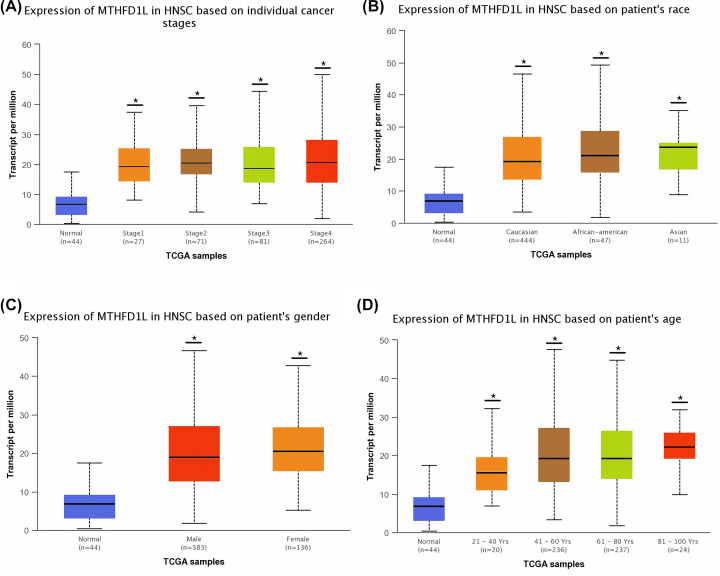
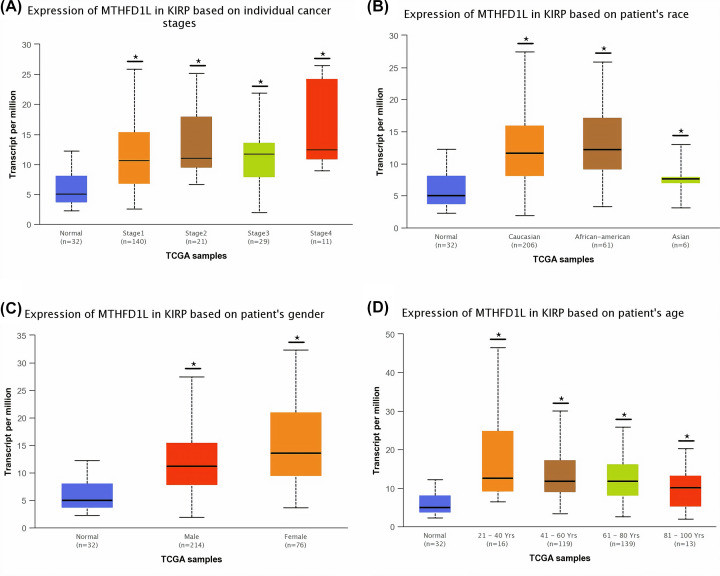
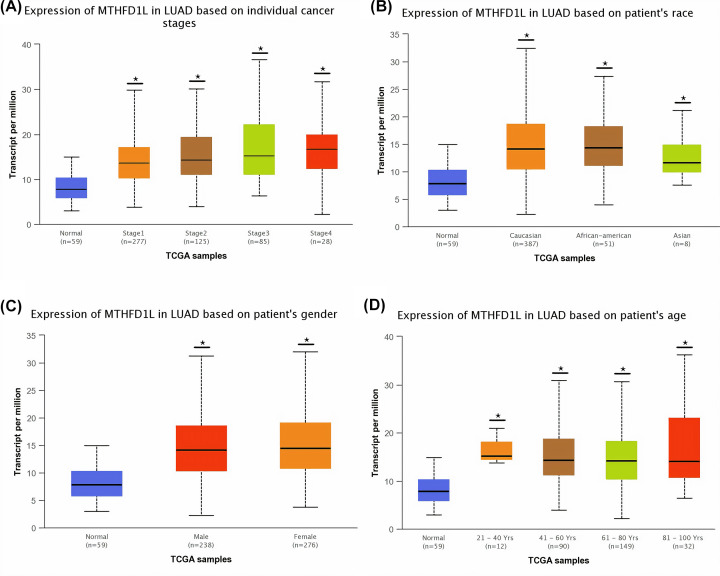
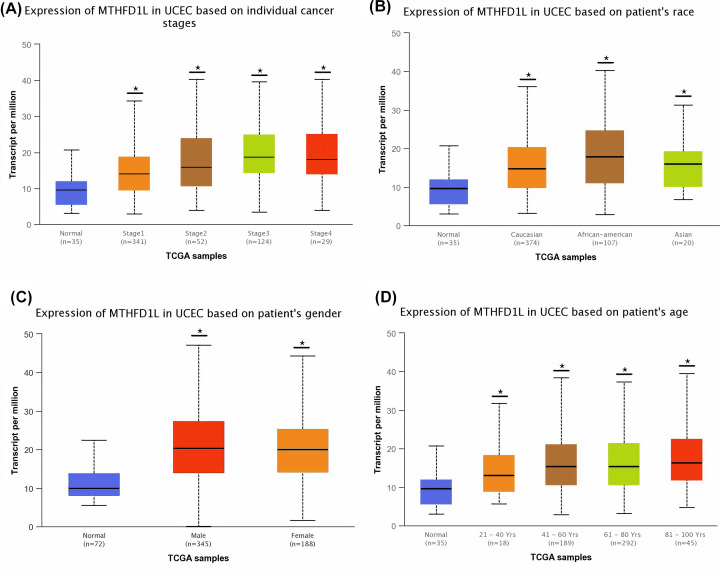
To detect the clinicopathological feature-specific expression of MTHFD1L in BLCA, HNSC, KIRP, LUAD, and UCEC, we used the UALCAN platform. In view of the results of our analysis, a significant (P<0.05) overexpression of MTHFD1L was also observed in BLCA, HNSC, KIRP, LUAD, and UCEC patients of different clinicopathological features including different cancer stages, race, gender, and age (Figures 3-7). A clinical parameter-wise classification of the BLCA, HNSC, KIRP, LUAD, and UCEC cohorts can be seen in Tables 1-3.
Figure 3. The relationship of MTHFD1L expression with different clinicopathological features of BLCA.
(A) Expression of MTHFD1L in different cancer stages of BLCA patients, (B) expression of MTHFD1L in different races of BLCA patients, (C) expression of MTHFD1L in different genders of BLCA patients, and (D) expression of MTHFD1L in different age groups of BLCA patients. *P<0.05.
Figure 4. The relationship of MTHFD1L expression with different clinicopathological features of HNSC.
(A) Expression of MTHFD1L in different cancer stages of HNSC patients, (B) expression of MTHFD1L in different races of HNSC patients, (C) expression of MTHFD1L in different genders of HNSC patients, and (D) expression of MTHFD1L in different age groups of HNSC patients. *P<0.05.
Figure 5. The relationship of MTHFD1L expression with different clinicopathological features of KIRP.
(A) Expression of MTHFD1L in different cancer stages of KIRP patients, (B) expression of MTHFD1L in different races of KIRP patients, (C) expression of MTHFD1L in different genders of KIRP patients, and (D) expression of MTHFD1L in different age groups of KIRP patients. *P<0.05.
Figure 6. The relationship of MTHFD1L expression with different clinicopathological features of LUAD.
(A) Expression of MTHFD1L in different cancer stages of LUAD patients, (B) expression of MTHFD1L in different races of LUAD patients, (C) expression of MTHFD1L in different genders of LUAD patients, and (D) expression of MTHFD1L in different age groups of LUAD patients. *P<0.05.
Figure 7. The relationship of MTHFD1L expression with different clinicopathological features of UCEC.
(A) Expression of MTHFD1L in different cancer stages of UCEC patients, (B) expression of MTHFD1L in different races of UCEC patients, (C) expression of MTHFD1L in different genders of UCEC patients, and (D) expression of MTHFD1L in different age groups of UCEC patients. *P<0.05.
Table 1. Details of the clinicopathological feature-based classification of BLCA and HNSC samples analyzed in the current study.
| Sr. No. | Clinicopathological feature | Sample count | Total sample count | Sample count with missing information | Total final sample count undertaken in analysis |
|---|---|---|---|---|---|
| Clinicopathological feature-based classification of BLCA samples | |||||
| 1 | Cancer stage distribution | 408 | |||
| Stage 1 | 02 | ||||
| Stage 2 | 129 | 08 | 400 | ||
| Stage 3 | 137 | ||||
| Stage 4 | 132 | ||||
| 2 | Geographical distribution | ||||
| Caucasian | 320 | ||||
| African-American | 22 | 22 | 386 | ||
| Asian | 44 | ||||
| 3 | Gender distribution | ||||
| Male | 297 | 06 | 402 | ||
| Female | 105 | ||||
| 4 | Age distribution | ||||
| 21–40 years | 02 | ||||
| 41–60 years | 105 | 06 | 402 | ||
| 61–80 years | 251 | ||||
| 81–100 years | 44 | ||||
| Clinicopathological feature-based classification of HNSC samples | |||||
| 1 | Cancer stage distribution | 520 | |||
| Stage 1 | 27 | ||||
| Stage 2 | 71 | 77 | 443 | ||
| Stage 3 | 81 | ||||
| Stage 4 | 264 | ||||
| 2 | Geographical distribution | ||||
| Caucasian | 444 | ||||
| African-American | 47 | 18 | 502 | ||
| Asian | 11 | ||||
| 3 | Gender distribution | ||||
| Male | 383 | 01 | 519 | ||
| Female | 136 | ||||
| 4 | Age distribution | ||||
| 21–40 years | 20 | ||||
| 41–60 years | 236 | 03 | 517 | ||
| 61–80 years | 237 | ||||
| 81–100 years | 24 | ||||
Table 2. Details of the clinicopathological feature-based classification of KIRP and LUAD samples analyzed in the current study.
| Sr. No. | Clinicopathological feature | Sample count | Total sample count | Sample count with missing information | Total final sample count undertaken in analysis |
|---|---|---|---|---|---|
| Clinicopathological feature-based classification of KIRP samples | |||||
| 1 | Cancer stage distribution | 290 | |||
| Stage 1 | 140 | ||||
| Stage 2 | 21 | 89 | 201 | ||
| Stage 3 | 29 | ||||
| Stage 4 | 11 | ||||
| 2 | Geographical distribution | ||||
| Caucasian | 206 | ||||
| African-American | 61 | 17 | 273 | ||
| Asian | 06 | ||||
| 3 | Gender distribution | ||||
| Male | 214 | 00 | 290 | ||
| Female | 76 | ||||
| 4 | Age distribution | ||||
| 21–40 years | 16 | ||||
| 41–60 years | 119 | 03 | 287 | ||
| 61–80 years | 139 | ||||
| 81–100 years | 13 | ||||
| Clinicopathological feature-based classification of LUAD samples | |||||
| 1 | Cancer stage distribution | 515 | |||
| Stage 1 | 277 | ||||
| Stage 2 | 125 | 0 | 515 | ||
| Stage 3 | 96 | ||||
| Stage 4 | 28 | ||||
| 2 | Geographical distribution | ||||
| Caucasian | 387 | ||||
| African-American | 51 | 69 | 446 | ||
| Asian | 08 | ||||
| 3 | Gender distribution | ||||
| Male | 238 | 01 | 514 | ||
| Female | 276 | ||||
| 4 | Age distribution | ||||
| 21–40 years | 12 | ||||
| 41–60 years | 90 | 277 | 283 | ||
| 61–80 years | 149 | ||||
| 81–100 years | 32 | ||||
Table 3. Details of the clinicopathological feature-based classification of UCEC samples analyzed in the current study.
| Sr. No. | Clinicopathological feature | Sample count | Total sample count | Sample count with missing information | Total final sample count undertaken in analysis |
|---|---|---|---|---|---|
| Clinicopathological feature-based classification of UCEC samples | |||||
| 1 | Cancer stage distribution | 546 | |||
| Stage 1 | 341 | ||||
| Stage 2 | 52 | 0 | 546 | ||
| Stage 3 | 124 | ||||
| Stage 4 | 29 | ||||
| 2 | Geographical distribution | ||||
| Caucasian | 374 | ||||
| African-American | 107 | 45 | 501 | ||
| Asian | 20 | ||||
| 3 | Gender distribution | ||||
| Male | 348 | 10 | 536 | ||
| Female | 188 | ||||
| 4 | Age distribution | ||||
| 21–40 years | 18 | ||||
| 41–60 years | 189 | 02 | 544 | ||
| 61–80 years | 292 | ||||
| 81–100 years | 45 | ||||
MTHFD1L has good prognostic significance in BLCA, HNSC, KIRP, LUAD, and UCEC patients regardless of different clinicopathological features
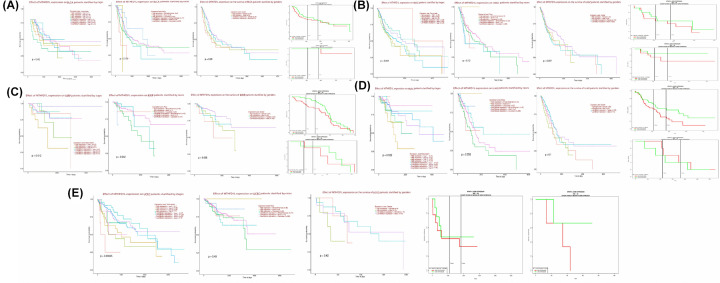
Via OS analysis using KM plotter and LOGpc databases, as shown in Figure 8, MTHFD1L up-regulation was also found to be associated with reduced OS of the BLCA, HNSC, KIRP, LUAD, and UCEC patients of different clinicopathological features including different cancer stages, races, genders and ages, however, most of the correlations were insignificant due to the small sample size used in the analysis. All in all, MTHFD1L overexpression is prognostically relevant to BLCA, HNSC, KIRP, LUAD, and UCEC patients regardless of different clinicopathological features, and can be a promising marker gene for predicting their OS, however, additional experiments are required to be done before clinical application.
Figure 8. UALCAN and LOGpc-based prognostic significance of MTHFD1L overexpression in BLCA, HNSC, KIRP, LUAD, and UCEC patients of different clinicopathological features.
(A) UALCAN and LOGpc-based MTHFD1L prognostic significance in BLCA patients of different cancer stages, races, genders, and ages. (B) UALCAN and LOGpc-based MTHFD1L prognostic significance in HNSC patients of different cancer stages, races, genders, and ages. (C) UALCAN and LOGpc-based MTHFD1L prognostic significance in KIRP patients of different cancer stages, races, genders, and ages. (D) UALCAN and LOGpc-based MTHFD1L prognostic significance in LUAD patients of different cancer stages, races, genders, and ages. (E) UALCAN and LOGpc-based MTHFD1L prognostic significance in UCEC patients of different cancer stages, races, genders, and ages. *P<0.05.
Validating MTHFD1L overexpression using new cohorts
We re-analyzed the MTDHFD1L expression using new cohorts of BLCA, HNSC, KIRP, LUAD, and UCEC via GENT2 platform. Results of the analysis were in agreement with the previous results and also further verified the significant (P>0.05) overexpression of MTHFD1L in BLCA, HNSC, KIRP, LUAD, and UCEC patients relative to controls (Figure 9). Information on the BLCA, HNSC, KIRP, LUAD, and UCEC datasets utilized in this analysis is given in Table 4.
Figure 9. GENT2-based validation of MTHFD1L at transcription level in new BLCA, HNSC, KIRP, LUAD, and UCEC cohorts.
Blue color represents the normal samples, while red color indicates the cancer samples. A P-value (<0.05) was considered as statistically significant.
Table 4. Information from the BLCA, HNSC, KIRP, LUAD, and UCEC datasets used for the validation of MTHFD1L expression via GENT2.
| Sr. No. | Cancer | Datasets | Source |
|---|---|---|---|
| 1 | BLCA | GSE2109, GSE31684, GSE7476, GSE7476, GSE30522, GSE31189, GSE43346, GSE7307, GSE11783, and GSE30522 | Affymetrix U133A and U133 Plus2 microarray platforms |
| 2 | HNSC | GSE6791, GSE6791, GSE10300, GSE29330, GSE3292, GSE31287, and GSE29330 | |
| 3 | KIRP | GSE12606, GSE2109, GSE46699, GSE47352, GSE53224, GSE53757, GSE46699, GSE7023, GSE68629, GSE7392, GSE8271, GSE11024, GSE11151, GSE12090, GSE19982, GSE22541, GSE36895, GSE46699, GSE53757, GSE7023, and GSE7307 | |
| 4 | LUAD | GSE10445, GSE40791, GSE37745, GSE2109, GSE43346, GSE43580, GSE50081, GSE30219, GSE63074, GSE64766, GSE77803, GSE19188, GSE27262, GSE33532, GSE40791, GSE5058, and GSE7307 | |
| 5 | UCEC | GSE7307, GSE2109, GSE19959, GSE4888, GSE6364, and GSE7307 |
Protein expression level validation of MTHFD1L in BLCA, HNSC, KIRP, LUAD, and UCEC
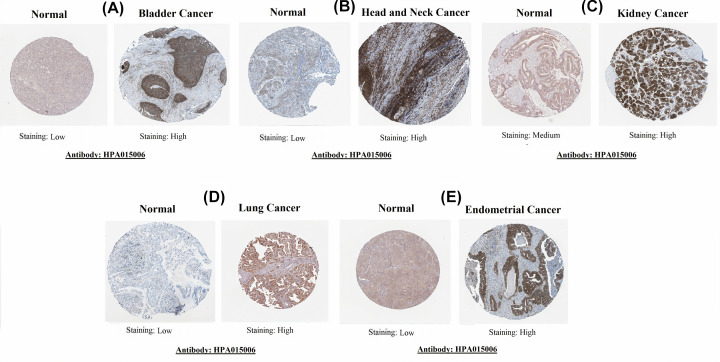
Next, for protein level expression validation of MTHFD1L, we analyzed IHC results of MTHFD1L through the HPA database. The obtained immunohistochemical images have shown the significant (P>0.05) higher expression of MTHFD1L protein in BLCA, HNSC, KIRP, LUAD, and UCEC specimens relative to the normal bladder, head and neck, kidney, lung, and endometrial tissues, which have shown either low (in case of bladder, head and neck, lung, and endometrial tissues) or medium expression (in case of normal kidney tissues) of MTHFD1L (Figure 10). Collectively, our results confirmed that MTHFD1L also overexpressed at the protein level in BLCA, HNSC, KIRP, LUAD, and UCEC as compared with the normal controls.
Figure 10. HPA-based validation of MTHFD1L at translational level (×200).
(A) In bladder cancer, (B) in head and neck cancer, (C) in kidney cancer, (D) in lung cancer, and (E) in endometrial cancer.
Exploring promoter methylation of MTHFD1L
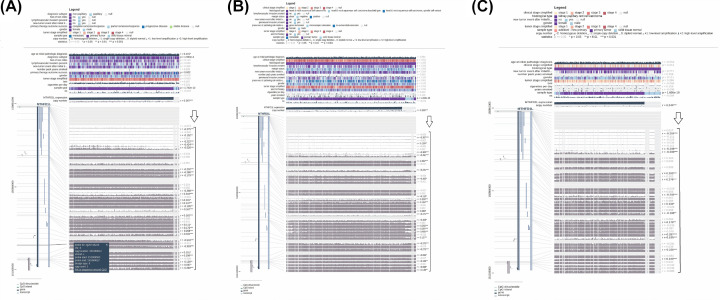
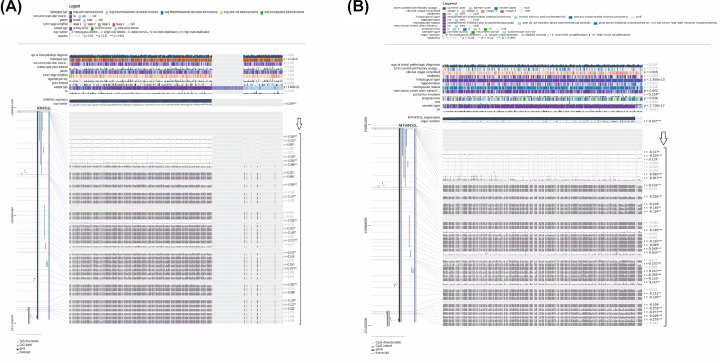
It is earlier known that the dysregulation of different tumor suppressor genes due to aberrant methylation of promoter regions leads to cancer development [27]. To find whether promoter methylation has any impact on MTHFD1L expression or not in BLCA, HNSC, KIRP, LUAD, and UCEC, we have analyzed the Pearson correlation between its promoter methylation and mRNA expression level in BLCA, HNSC, KIRP, LUAD, and UCEC using MEXPRESS. In view of our results, the mRNA expression level of MTHFDL1 was significantly (P>0.05) negatively correlated with its promoter methylation (Figures 11 and 12). Taken together, these results highlighted that promoter hypomethylation can affect the expression regulation of MTHFDL1 in BLCA, HNSC, KIRP, LUAD, and UCEC significantly.
Figure 11. Evaluation of correlation between expression and promoter methylation level of MTFD1L in BLCA, HNSC, and KIRP.
(A) In BLCA, (B) in HNSC, and (C) in KIRP. A negative sign indicates the negative correlation between MTHFD1L expression and its promoter methylation using a specific probe at a specific CpG island. A P-value (<0.05) was considered as statistically significant.
Figure 12. Evaluation of correlation between expression and promoter methylation level of MTFD1L in LUAD and UCEC.
(A) In LUAD and (B) in UCEC. A negative sign indicates the negative correlation between MTHFD1L expression and its promoter methylation using a specific probe at a specific CpG island. A P-value (<0.05) was considered as statistically significant.
Genetic alteration analysis of MTHFD1L in BLCA, HNSC, KIRP, LUAD, and UCEC
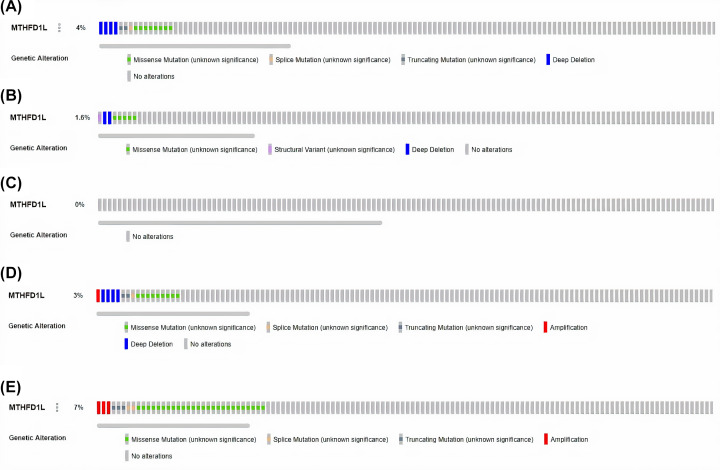
Genetic mutations and CNVs also play major roles in gene expression regulation. We next also explored whether MTHFD1L expression was regulated by these factors or not via cBioportal using TCGA PanCancer Atlas BLCA, HNSC, KIRP, LUAD, and UCEC datasets. No MTHFD1L-associated genetic alterations were observed in KIRP cases, while missense mutations were observed as the most frequent alterations in very small proportions of the analyzed BLCA, HNSC, HNSC, and UCEC cases (Figure 13). Taken together, it is speculated that low percentages of observed genetic alterations in BLCA (4%), HNSC (1.6%), KIRP (0%), LUAD (3%), and UCEC (7%) samples have the least participation in the expression regulation of MTHFD1L.
Figure 13. OncoPrint of MTHFDL1 genomic alterations in TCGA BLCA, HNSC, KIRP, LUAD, and UCEC.
(A) In BLCA, (B) in HNSC, (C) in KIRP, (D) in LUAD, and (E) in UCEC.
Predicted PPI network and pathways of MTHFD1L
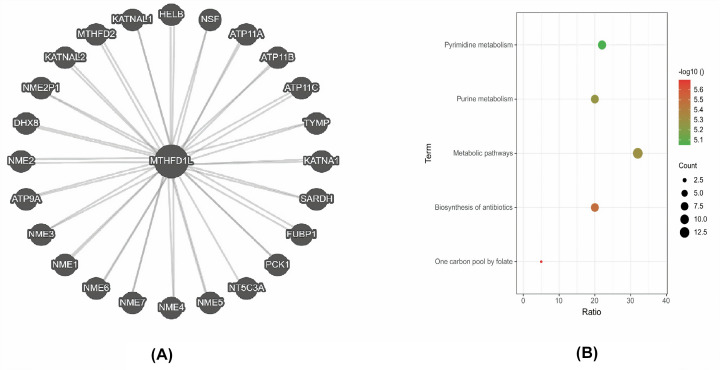
STRING was used in our study to identify the MTHFD1L-enriched genes. The resultant PPI network has highlighted that MTHFD1L was linked with 25 other genes (Figure 13A). All these genes were further subjected to pathway enrichment using the DAVID tool. In view of the analysis results, it was observed that few MTHFD1L-associated genes were significantly (P>0.05) involved in five diverse pathways including Pyrimidine metabolism, Purine metabolism, Metabolic Pathways, Biosynthesis of antibiotics, and One carbon pool by folate (Figure 14; Table 5).
Figure 14. PPI network and KEGG annotation of MTHFD1L-enriched genes.
(A) A PPI network of MTHFD1L-enriched genes and (B) KEGG pathway analysis of the MTHFD1L-enriched genes. A P-value of <0.05 was considered as significant.
Table 5. Predicted pathways of MTHFD1L-enriched genes.
| Pathway | Description | Enriched genes | Gene count | P-value |
|---|---|---|---|---|
| hsa00240 | Pyrimidine metabolism | NT5C3A, NME6, NME7, NME2, NME3, NME4, NME5, TYMP, NME1 | 9 | <0.05 |
| hsa00230 | Purine metabolism | NT5C3A, NME6, NME7, NME2, NME3, NME4, NME5, NME1 | 8 | <0.05 |
| hsa01100 | Metabolic pathways | NME2, NME3, NME4, NME5, TYMP, NME1, NT5C3A, MTHFD1L, NME6, NME7, MTHFD2, SARDH, PCK1 | 13 | <0.05 |
| hsa01130 | Biosynthesis of antibiotics | NME6, NME7, NME2, NME3, NME4, NME5, PCK1, NME1 | 8 | <0.05 |
| hsa00670 | One carbon pool by folate | MTHFD1L, MTHFD2 | 2 | <0.05 |
MTHFD1L overexpression and infiltrating levels of CD8+ T cells in BLCA, HNSC, KIRP, LUAD, and UCEC patients
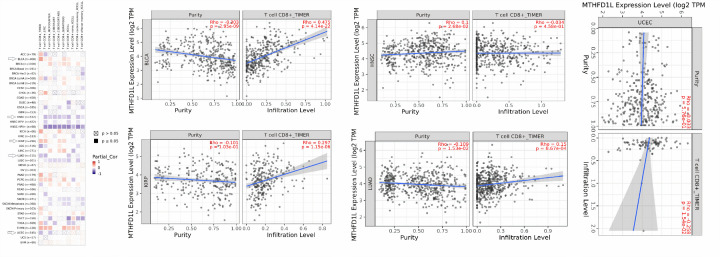
CD8+ T immune cells play a key role in treating cancer patients through immunotherapy [28]. To further analyze whether the change in MTHFD1L expression exerts any effect on CD8+ T immune infiltration or not, we investigated the correlation of MTHFD1L expression with infiltration levels of CD8+ T immune cells in BLCA, HNSC, KIRP, LUAD, and UCEC using the TIMER database. As a result, we observed that MTHFD1L expression has shown a significant (P>0.05) negative correlation with CD8+ T immune cells level in BLCA, HNSC, KIRP, LUAD, and UCEC (Figure 15). Collectively, these findings suggested MTHFDL1 as a possible regulator of CD8+ T immune cells level in BLCA, HNSC, KIRP, LUAD, and UCEC.
Figure 15. Evaluation of correlations between MTHFD1L expression and CD8+ T immune cells infiltration levels in BLCA, HNSC, KIRP, LUAD, and UCEC via TIMER database.
A P-value (<0.05) was considered as statistically significant.
Chemotherapeutic drugs associated with MTHFD1L
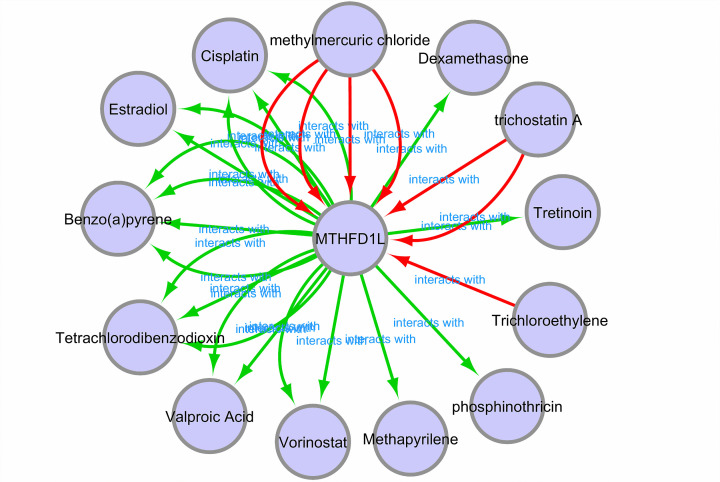
Different experimentally validated chemotherapeutic drugs associated with MTHFD1L expression were obtained from the CTD database to develop a gene–drug interaction network. Through the constructed network, it was observed that MTHFD1L expression can be regulated by a variety of drugs, such as, cisplatin and vorinostat can up-regulated the expression level of MTHFD1L while tretinon and methylmercuric chloride can suppress MTHFD1L expression level (Figure 16).
Figure 16. A gene–drug interaction network highlighting MTHFD1L-associated chemotherapeutic drugs.
Red arrows: chemotherapeutic drugs that can increase the expression of MTHFD1L; green arrows: chemotherapeutic drugs that can suppress the expression of MTHFD1L. A count of arrows between drug and gene in the network represent the supported numbers of studies by the literature.
Discussion
Cancer is one of the most killer malignancies in the world that kill millions each year [29]. A lot of literature has confirmed several molecular biomarkers for detection, prediction of prognosis, and treatment of cancer patients [30]. However, still, these biomarkers are not efficient and have various limitations. Thus, there is an urgent need to identify shared biomarkers of cancer that could be used for detection, prediction of prognosis, and treatment of cancer patients without any serious complications.
Earlier studies have reported that MTHFD1L plays a key role in tumor development by dysregulating the folic acid cycle [31,32]. The higher expression of MTHFD1L has been noted in multiple cancers including CRC [9], ESCA [13], and tongue squamous cell carcinoma [14]. In the current study, we explored MTHFD1L expression as a shared potential cancer biomarker in 24 major human cancer subtypes.
We detected the remarkably higher MTHFD1L overexpression in 24 major subtypes of human cancers matched with controls. Also, MTHFD1L overexpression was found to remarkably influence (decrease) the OS duration of BLCA, HNSC, KIRP, LUAD, and UCEC patients only. Collectively, these findings highlighted that MTHFD1L overexpression is involved in the initiation and progression of BLCA, HNSC, KIRP, LUAD, and UCEC; therefore, current research is mainly focusing on these five cancer subtypes. Next, we also re-examined MTHFD1L expression individually in BLCA, HNSC, KIRP, LUAD, and UCEC patients stratified by different clinicopathological parameters. As a result, a significant up-regulation in MTHFD1L expression was also detected in BLCA, HNSC, KIRP, LUAD, and UCEC patients stratified by different cancer stages, races, genders, and ages. Therefore, it is speculated that MTHFD1L might up-regulate in BLCA, HNSC, KIRP, LUAD, and UCEC patients regardless of heterogeneity-barrier.
In terms of promoter methylation impact of MTHFD1L expression, our research has explored the significant negative correlation among expression and promoter methylation levels of the MTHFD1L in BLCA, HNSC, KIRP, LUAD, and UCEC patients. Therefore, ultimately, we speculated that promoter hypomethylation of MTHFD1L may be one of the key factors of its overexpression in BLCA, HNSC, KIRP, LUAD, and UCEC.
Genomic alterations (mutations and CNVs) are known as the key regulator of gene expression dysregulation in cancers [33,34]. Here in this research, we noticed very small percentages of the MTHFD1L genomic abnormalities and CNVs (4, 1.6, 0.3, and 7%) in the analyzed BLCA, HNSC, LUAD, and UCEC samples, respectively. While no MTHFD1L-associated genetic alterations and CNV were found in KIRP. All in all, these findings highlighted that genomic abnormalities have the least involvement in the dysregulation of MTHFD1L, however, further detailed work is required to confirm these results.
Recently, different studies have been conducted worldwide to identify reliable biomarkers for BLCA, HNSC, KIRP, LUAD, and UCEC diagnosis and predict prognosis including significantly dysregulated genes, such as ASPM, CDC20, CENPF, CCNB2, CEP55, KIF20A, NCAPG, HJURP, NUSAP1, TOP2A, TRIP13, TROAP, SPAG5, and TTK in BLCA [35,36]; GPR18, RSPH4A, ULBP2, CNR2, TEX101, CCR8, CCDC39, STC2, MSLN, CHGB, and CNTN5 in HNSC [37,38], LAMC2, CCT3/4/5/6/7/8, and FGFR1-4 in HNSC [39–41]; GATM, MMP1, ARHGEF26, POU2F3, MMP10, PTHLH, and GATA3 in KIRP [42,43]; CDH1, PECAM1, SPP1, IL6, THBS1, SNCA, HGF, CAV1, DLC1, and CDH5 in LUAD [44,45]; TXN, KDM4B, SLC5A1, TXNDC11, COX16, MGAT4A, HSDL2, DAGLA, THRB, PCOLCE2, and ELOVL7 in UCEC [46]. However, to the best of our knowledge, none of these or any other biomarkers have been generalized so far in BLCA, HNSC, KIRP, LUAD, and UCEC patients of different clinicopathological features. Via current research, we have noted the remarkable up-regulation of MTHFD1L in BLCA, HNSC, KIRP, LUAD, and UCEC patients of different clinicopathological features (different cancer stages, patients races, genders, and age groups). Furthermore, MTHFD1L effect on the OS of BLCA, HNSC, KIRP, LUAD, and UCEC patients and its hypomethylation have also confirmed MTHFD1L usefulness as a novel potential biomarker of these cancers. Prior to our knowledge, this research is the first to report a shared biomarker role of MTHFD1L in BLCA, HNSC, KIRP, LUAD, and UCEC, suggesting it as a potential therapeutic candidate in the treatment of cancer.
According to the latest research, the dysregulation of a few important genes may abnormally regulate the tumor microenvironment by altering the immune cells infiltration [47,48]. Keeping this in view, we carried out the correlation analysis among MTHFD1L expression and CD8+ T immune cells infiltration in BLCA, HNSC, KIRP, LUAD, and UCEC. Results highlighted that there is a significant positive correlation between MTHFD1L expression and CD8+ T immune cells level in BLCA and KIRP while a significant negative correlation in HNSC, LUAD, and UCEC. Collectively, this scenario indicates that CD8+ T immune cells may also exert a significant effect on BLCA, HNSC, KIRP, LUAD, and UCEC tumorigenesis via MTHFD1L, however, this role of MTHFD1L ought to be investigated further.
The PPI network of MTHFD1L revealed that it directly interacts with the 25 different genes and a few of them were involved in five diverse pathways including Pyrimidine metabolism, Purine metabolism, Metabolic Pathways, Biosynthesis of antibiotics, and One carbon pool by folate (Table 5). Additionally, we also identified a few potential drugs that could be useful in the treatment of BLCA, HNSC, KIRP, LUAD, and UCEC by regulating the MTHFD1L expression (Figure 16).
Conclusion
Overexpression of MTHFD1L is associated with tumorigenesis and poor survival in BLCA, HNSC, KIRP, LUAD, and UCEC patients of different clinical parameters. Modulating MTHFD1L expression using different chemotherapeutic drugs may be a promising future treatment option for these cancer patients. However, additional work needed to be done on a large scale prior to clinical implications.
Abbreviations
- BLCA
bladder urothelial cancer
- CNV
copy number variation
- CRC
colorectal cancer
- CTD
Comparative Toxicogenomics Database
- ESCA
esophageal squamous cell carcinoma
- GENT2
Gene Expression across Normal and Tumor tissue
- HPA
Human Protein Atlas
- IHC
immunohistochemistry
- KIRP
kidney renal papillary cell carcinoma
- KM
Kaplan–Meier
- LUAD
lung adenocarcinoma
- MTHFD1L
methylenetetrahydrofolate dehydrogenase 1-like
- OS
overall survival
- PPI
protein–protein interaction
- TCGA
The Cancer Genome Atlas
- UCEC
uterine corpus endometrial carcinoma
Data Availability
The datasets analyzed in the current study are available at: http://ualcan.path.uab.edu/cgi-bin/ualcan-res.pl.
Competing Interests
The authors declare that there are no competing interests associated with the manuscript.
Funding
The authors declare that there are no sources of funding to be acknowledged.
CRediT Author Contribution
Nuzhat Sial: Software, Validation, Investigation. Jalil Ur Rehman: Conceptualization, Software, Formal analysis, Validation, Methodology. Saba Saeed: Conceptualization, Software, Validation, Visualization, Methodology. Mukhtiar Ahmad: Data curation, Software, Validation, Investigation, Visualization, Methodology. Yasir Hameed: Conceptualization, Data curation, Software, Formal analysis, Supervision, Validation, Investigation, Visualization, Methodology, Writing—original draft, Writing—review & editing. Muhammad Atif: Data curation, Validation, Investigation, Methodology, Writing—original draft, Writing—review & editing. Abdul Rehman: Investigation, Writing—original draft, Writing—review & editing. Rizwan Asif: Investigation, Writing—original draft, Writing—review & editing. Hamad Ahmed: Investigation, Methodology, Writing—original draft, Writing—review & editing. Muhammad Safdar Hussain: Investigation, Methodology, Writing—original draft, Writing—review & editing. Muhammad Rashid Khan: Investigation, Methodology, Writing—original draft, Writing—review & editing. Atifa Ambreen: Methodology, Writing—original draft, Writing—review & editing. Ayesha Ambreen: Methodology, Writing—original draft, Writing—review & editing.
References
- 1.Oh C.-M., Lee D., Kong H.-J., Lee S., Won Y.-J., Jung K.-W.et al. (2020) Causes of death among cancer patients in the era of cancer survivorship in Korea: attention to the suicide and cardiovascular mortality. Cancer Med. 9, 1741–1752 10.1002/cam4.2813 [DOI] [PMC free article] [PubMed] [Google Scholar]
- 2.Yang J.D., Hainaut P., Gores G.J., Amadou A., Plymoth A. and Roberts L.R. (2019) A global view of hepatocellular carcinoma: trends, risk, prevention and management. Nat. Rev. Gastroenterol. Hepatol. 16, 589–604 10.1038/s41575-019-0186-y [DOI] [PMC free article] [PubMed] [Google Scholar]
- 3.Laversanne M., Soerjomataram I., Jemal A. and Bray F. (2021) Global Cancer Statistics 2020: GLOBOCAN Estimates of Incidence and Mortality Worldwide for 36 Cancers in 185 Countries. Cancer J. Clin. 71, 209–249 10.3322/caac.21660 [DOI] [PubMed] [Google Scholar]
- 4.Stockdale A.J., Chaponda M., Beloukas A., Phillips R.O., Matthews P.C., Papadimitropoulos A.et al. (2017) Prevalence of hepatitis D virus infection in sub-Saharan Africa: a systematic review and meta-analysis. Lancet Glob. Health 5, e992–e1003 10.1016/S2214-109X(17)30298-X [DOI] [PMC free article] [PubMed] [Google Scholar]
- 5.Marengo A., Rosso C. and Bugianesi E. (2016) Liver cancer: connections with obesity, fatty liver, and cirrhosis. Annu. Rev. Med. 67, 103–117 10.1146/annurev-med-090514-013832 [DOI] [PubMed] [Google Scholar]
- 6.Gupta M., Gabriel H. and Miller F.H. (2018) Role of imaging in surveillance and diagnosis of hepatocellular carcinoma. Gastroenterol. Clin. 47, 585–602 10.1016/j.gtc.2018.04.013 [DOI] [PubMed] [Google Scholar]
- 7.Pavlova N.N. and Thompson C.B. (2016) The emerging hallmarks of cancer metabolism. Cell Metab. 23, 27–47 10.1016/j.cmet.2015.12.006 [DOI] [PMC free article] [PubMed] [Google Scholar]
- 8.Christensen K.E., Patel H., Kuzmanov U., Mejia N.R. and MacKenzie R.E. (2005) Disruption of the mthfd1 gene reveals a monofunctional 10-formyltetrahydrofolate synthetase in mammalian mitochondria. J. Biol. Chem. 280, 7597–7602 10.1074/jbc.M409380200 [DOI] [PubMed] [Google Scholar]
- 9.Agarwal S., Behring M., Hale K., Al Diffalha S., Wang K., Manne U.et al. (2019) MTHFD1L, a folate cycle enzyme, is involved in progression of colorectal cancer. Transl. Oncol. 12, 1461–1467 10.1016/j.tranon.2019.07.011 [DOI] [PMC free article] [PubMed] [Google Scholar]
- 10.Henry C.J., Nemkov T., Casás-Selves M., Bilousova G., Zaberezhnyy V., Higa K.C.et al. (2017) Folate dietary insufficiency and folic acid supplementation similarly impair metabolism and compromise hematopoiesis. Haematologica 102, 1985 10.3324/haematol.2017.171074 [DOI] [PMC free article] [PubMed] [Google Scholar]
- 11.Farber S. and Farber S. (1949) Some observations on the effect of folic acid antagonists on acute leukemia and other forms of incurable cancer. Blood 4, 160–167, Blood. 2016;127:271 10.1182/blood.V4.2.160.160 [DOI] [PubMed] [Google Scholar]
- 12.Eich M.-L., Pena M.D.C.R., Chandrashekar D.S., Chaux A., Agarwal S., Gordetsky J.B.et al. (2019) Expression and role of methylenetetrahydrofolate dehydrogenase 1 like (MTHFD1L) in bladder cancer. Transl. Oncol. 12, 1416–1424 10.1016/j.tranon.2019.07.012 [DOI] [PMC free article] [PubMed] [Google Scholar]
- 13.Yang Y.-S., Yuan Y., Hu W.-P., Shang Q.-X. and Chen L.-Q. (2018) The role of mitochondrial folate enzyme MTHFD1L in esophageal squamous cell carcinoma. Scand. J. Gastroenterol. 53, 533–540 10.1080/00365521.2017.1407440 [DOI] [PubMed] [Google Scholar]
- 14.Li H., Fu X., Yao F., Tian T., Wang C. and Yang A. (2019) MTHFD1L-mediated redox homeostasis promotes tumor progression in tongue squamous cell carcinoma. Front. Oncol. 9, 1278 10.3389/fonc.2019.01278 [DOI] [PMC free article] [PubMed] [Google Scholar]
- 15.Chandrashekar D.S., Bashel B., Balasubramanya S.A.H., Creighton C.J., Ponce-Rodriguez I., Chakravarthi B.et al. (2017) UALCAN: a portal for facilitating tumor subgroup gene expression and survival analyses. Neoplasia 19, 649–658 10.1016/j.neo.2017.05.002 [DOI] [PMC free article] [PubMed] [Google Scholar]
- 16.Chen C., Wang X., Huang S., Wang L., Han L. and Yu S. (2017) Prognostic roles of Notch receptor mRNA expression in human ovarian cancer. Oncotarget 8, 32731–32740 10.18632/oncotarget.16387 [DOI] [PMC free article] [PubMed] [Google Scholar]
- 17.Tang Z., Li C., Kang B., Gao G., Li C. and Zhang Z. (2017) GEPIA: a web server for cancer and normal gene expression profiling and interactive analyses. Nucleic Acids Res. 45, W98–W102 10.1093/nar/gkx247 [DOI] [PMC free article] [PubMed] [Google Scholar]
- 18.Zheng H., Zhang G., Zhang L., Wang Q., Li H., Han Y.et al. (2020) Comprehensive review of web servers and bioinformatics tools for cancer prognosis analysis. Front. Oncol. 10, 68–75 10.3389/fonc.2020.00068 [DOI] [PMC free article] [PubMed] [Google Scholar]
- 19.Park S.-J., Yoon B.-H., Kim S.-K. and Kim S.-Y. (2019) GENT2: an updated gene expression database for normal and tumor tissues. BMC Med. Genet. 12, 101 10.1186/s12920-019-0514-7 [DOI] [PMC free article] [PubMed] [Google Scholar]
- 20.Uhlén M., Fagerberg L., Hallström B.M., Lindskog C., Oksvold P., Mardinoglu A.et al. (2015) Tissue-based map of the human proteome. Science 23, 347 10.1126/science.1260419 [DOI] [PubMed] [Google Scholar]
- 21.Koch A., De Meyer T., Jeschke J. and Van Criekinge W. (2015) MEXPRESS: visualizing expression, DNA methylation and clinical TCGA data. BMC Genomics 16, 636 10.1186/s12864-015-1847-z [DOI] [PMC free article] [PubMed] [Google Scholar]
- 22.Cerami E., Gao J., Dogrusoz U., Gross B.E., Sumer S.O., Aksoy B.A.et al. (2012) The cBio cancer genomics portal: an open platform for exploring multidimensional cancer genomics data. Cancer Discov. 2, 401–404 10.1158/2159-8290.CD-12-0095 [DOI] [PMC free article] [PubMed] [Google Scholar]
- 23.von Mering C., Huynen M., Jaeggi D., Schmidt S., Bork P. and Snel B. (2003) STRING: a database of predicted functional associations between proteins. Nucleic Acids Res. 31, 258–261 10.1093/nar/gkg034 [DOI] [PMC free article] [PubMed] [Google Scholar]
- 24.Huang D.W., Sherman B.T., Tan Q., Collins J.R., Alvord W.G., Roayaei J.et al. (2007) The DAVID Gene Functional Classification Tool: a novel biological module-centric algorithm to functionally analyze large gene lists. Genome Biol. 8, R183 10.1186/gb-2007-8-9-r183 [DOI] [PMC free article] [PubMed] [Google Scholar]
- 25.Li T., Fu J., Zeng Z., Cohen D., Li J., Chen Q.et al. (2020) TIMER2.0 for analysis of tumor-infiltrating immune cells. Nucleic Acids Res. 48, W509–W514 10.1093/nar/gkaa407 [DOI] [PMC free article] [PubMed] [Google Scholar]
- 26.Mattingly C.J., Colby G.T., Forrest J.N. and Boyer J.L. (2003) The Comparative Toxicogenomics Database (CTD). Environ. Health Perspect. 111, 793–795 10.1289/ehp.6028 [DOI] [PMC free article] [PubMed] [Google Scholar]
- 27.Luczak M.W. and Jagodziński P.P. (2006) The role of DNA methylation in cancer development. Folia Histochem. Cytobiol. 44, 143–154 [PubMed] [Google Scholar]
- 28.Farhood B., Najafi M. and Mortezaee K. (2019) CD8(+) cytotoxic T lymphocytes in cancer immunotherapy: a review. J. Cell Physiol. 234, 8509–8521 10.1002/jcp.27782 [DOI] [PubMed] [Google Scholar]
- 29.Ma X. and Yu H. (2006) Global burden of cancer. Yale J. Biol. Med. 79, 85–94 [PMC free article] [PubMed] [Google Scholar]
- 30.Costantini S. and Budillon A. (2020) New prognostic and predictive markers in cancer progression. Int. J. Mol. Sci. 21, 8667 10.3390/ijms21228667 [DOI] [PMC free article] [PubMed] [Google Scholar]
- 31.Wang L., Yang Y., Wang X.M., Wang C.Q., Zhang Y.M. and Li B.L. (2020) MTHFD1L as a folate cycle enzyme correlates with prognostic outcome and its knockdown impairs cell invasive behaviors in osteosarcoma via mediating the AKT/mTOR pathway. J. Recept. Signal Transduct. Res. 40, 584–590 10.1080/10799893.2020.1769658 [DOI] [PubMed] [Google Scholar]
- 32.Sen N., Cross A.M., Lorenzi P.L., Khan J., Gryder B.E., Kim S.et al. (2018) EWS-FLI1 reprograms the metabolism of Ewing sarcoma cells via positive regulation of glutamine import and serine-glycine biosynthesis. 57, 1342–1357 10.1002/mc.22849 [DOI] [PMC free article] [PubMed] [Google Scholar]
- 33.Knuutila S., Björkqvist A.-M., Autio K., Tarkkanen M., Wolf M., Monni O.et al. (1998) DNA copy number amplifications in human neoplasms: review of comparative genomic hybridization studies. Am. J. Pathol. 152, 1107. [PMC free article] [PubMed] [Google Scholar]
- 34.Brison O. (1993) Gene amplification and tumor progression. Biochim. Biophys. Acta Rev. Cancer 1155, 25–41 10.1016/0304-419X(93)90020-D [DOI] [PubMed] [Google Scholar]
- 35.Xu Y., Wu G., Li J., Li J., Ruan N., Ma L.et al. (2020) Screening and identification of key biomarkers for bladder cancer: a study based on TCGA and GEO data. BioMed Res. Int. 2020, 8283401 10.1155/2020/8283401 [DOI] [PMC free article] [PubMed] [Google Scholar]
- 36.Brüning-Richardson A., Bond J., Alsiary R., Richardson J., Cairns D., McCormack L.et al. (2011) ASPM and microcephalin expression in epithelial ovarian cancer correlates with tumour grade and survival. Br. J. Cancer 104, 1602–1610 10.1038/bjc.2011.117 [DOI] [PMC free article] [PubMed] [Google Scholar]
- 37.Sun Y., Zhang Q., Yao L., Wang S. and Zhang Z. (2020) Comprehensive analysis reveals novel gene signature in head and neck squamous cell carcinoma: predicting is associated with poor prognosis in patients. Transl. Cancer Res. 9, 5882–5892 10.21037/tcr-20-805 [DOI] [PMC free article] [PubMed] [Google Scholar]
- 38.Hong Y., Park C., Kim N., Cho J., Moon S.U., Kim J.et al. (2018) QSurface: fast identification of surface expression markers in cancers. BMC Syst. Biol. 12, 1–8 10.1186/s12918-018-0541-6 [DOI] [PMC free article] [PubMed] [Google Scholar]
- 39.Jiang P., He S., Li Y. and Xu Z. (2020) Identification of therapeutic and prognostic biomarkers of Lamin C (LAMC) family members in head and neck squamous cell carcinoma. Med. Sci. Monit. 26, e925735 10.12659/MSM.925735 [DOI] [PMC free article] [PubMed] [Google Scholar]
- 40.Dong Y., Lu S., Wang Z. and Liu L. (2020) CCTs as new biomarkers for the prognosis of head and neck squamous cancer. Open Med. 15, 672–688 10.1515/med-2020-0114 [DOI] [PMC free article] [PubMed] [Google Scholar]
- 41.Li Y., Wu L., Tao W., Wu D., Ma F. and Li N. (2020) Expression atlas of FGF and FGFR genes in pancancer uncovered predictive biomarkers for clinical trials of selective FGFR inhibitors. BioMed Res. Int. 2020, 5658904 10.1155/2020/5658904 [DOI] [PMC free article] [PubMed] [Google Scholar]
- 42.Chen H., Yang J. and Wu W. (2021) Seven key hub genes identified by gene co-expression network in cutaneous squamous cell carcinoma. BMC Cancer 21, 852 10.1186/s12885-021-08604-y [DOI] [PMC free article] [PubMed] [Google Scholar]
- 43.Sangoi A.R., Shrestha B., Yang G., Mego O. and Beck A.H. (2016) The novel marker GATA3 is significantly more sensitive than traditional markers mammaglobin and GCDFP15 for identifying breast cancer in surgical and cytology specimens of metastatic and matched primary tumors. Appl. Immunohistochem. Mol. Morphol. 24, 229–237 10.1097/PAI.0000000000000186 [DOI] [PMC free article] [PubMed] [Google Scholar]
- 44.Luo X., Feng L., Xu W., Bai X. and Wu M. (2021) Weighted gene co-expression network analysis of hub genes in lung adenocarcinoma. Evol. Bioinform. Online 17, 11769343211009898 10.1177/11769343211009898 [DOI] [PMC free article] [PubMed] [Google Scholar]
- 45.Niu N., Ma X., Liu H., Zhao J., Lu C., Yang F.et al. (2021) DLC1 inhibits lung adenocarcinoma cell proliferation, migration and invasion via regulating MAPK signaling pathway. Exp. Lung Res. 47, 173–182 10.1080/01902148.2021.1885524 [DOI] [PubMed] [Google Scholar]
- 46.Zhang X. and Wang Y. (2019) Identification of hub genes and key pathways associated with the progression of gynecological cancer. Oncol. Lett. 18, 6516–6524 10.3892/ol.2019.11004 [DOI] [PMC free article] [PubMed] [Google Scholar]
- 47.Casey S.C., Baylot V. and Felsher D.W. (2018) The MYC oncogene is a global regulator of the immune response. Blood 131, 2007–2015 10.1182/blood-2017-11-742577 [DOI] [PMC free article] [PubMed] [Google Scholar]
- 48.Ghatalia P., Gordetsky J., Kuo F., Dulaimi E., Cai K.Q., Devarajan K.et al. (2019) Correction to: Prognostic impact of immune gene expression signature and tumor infiltrating immune cells in localized clear cell renal cell carcinoma. J. Immunother. Cancer 7, 273 10.1186/s40425-019-0735-5 [DOI] [PMC free article] [PubMed] [Google Scholar]
Associated Data
This section collects any data citations, data availability statements, or supplementary materials included in this article.
Data Availability Statement
The datasets analyzed in the current study are available at: http://ualcan.path.uab.edu/cgi-bin/ualcan-res.pl.


