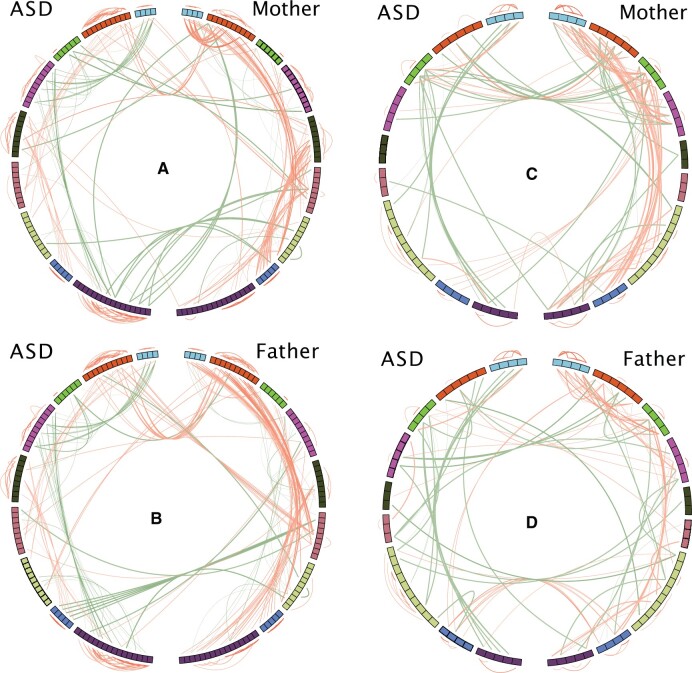
Figure 3.
Correlation globe showing the correlation patterns in the shared environment. (A) and (B): HILIC platform; (C) and (D) RPLC platform. Using the HILIC platform as an example, we estimated the Spearman’s rank correlations of 79 ASD correlating features shared in ASD families (RPLC: 45 shared features). To facilitate visual inspection of the patterns, we assigned the features in ASD, mother, and father into nine feature groups based on the results from hierarchical clustering on ASD cases. Each correlation globe is showing the correlations within ASD, within parents (mother or father), and between ASD and parents (mother or father). Features are arranged as a circular track. Left and right halves of the globe represent features in ASD and parent (mother or father), respectively. Only Spearman’s rank correlations greater than 0.5 and smaller than −0.5 are shown as connections in the globe. Red line denotes positive correlation, and dark green line denotes a negative one. Color intensity and line width are proportional to the size of the correlation. Within-group and between-group correlations are shown outside and inside of the track, respectively. Correlations between ASD and parent are indicated by the lines linking across the vertical half of the globe.

