

Abstract
Aim:
The aim of this work is to utilize a gene expression procedure to safely express systemic IL-12 and evaluate its effects in mouse tumor models.
Materials & methods:
Secondary lymphoid organs and tumors from EL4 and B16 tumor-bearing mice were analyzed by supervised and unsupervised methods.
Results:
IL-12 cDNA induced systemic IL-12 protein levels lower than the tolerated dose in patients. Control of tumor growth was observed in subcutaneous B16 and EL4 tumors. Systemic IL-12 expression induced a higher frequency of both total tumor-infiltrated CD45+ cells and proliferative IFN-γ+CD8+ T cells along with a lower frequency of CD4+FOXP3+ and CD11b+Gr-1+ cells.
Conclusion:
This approach characterizes the systemic effects of IL-12, helping to improve treatment of metastases or solid tumors.
Keywords: : B16, cancer, CD8+ T cells, EL4, hydrodynamic injection, IFN-γ, immunotherapy, secondary lymphoid organs, systemic IL-12, tumor microenvironment
Lay abstract
IL-12 has emerged as a potent cytokine in mediating antitumor activity in preclinical models of cancer. However, this antitumor response has not yet been translated into the clinic because of toxic side effects. The aim of our work is to analyze the effects of IL-12 in mouse tumor models. We demonstrate that one injection of IL-12 cDNA can induce systemic IL-12 levels in serum even lower than the tolerated dose in patients. At this dose, an efficient control of tumor growth can be observed. We found a higher frequency of both total tumor-infiltrated leukocytes and IFN-γ-producing CD8+ T cells along with a lower frequency of regulatory CD4+FOXP3+ and CD11b+Gr1+ cells. Our work demonstrates that IL-12 cDNA can safely be used to treat cancer.
The use of cytokines for the treatment of cancer is a rapidly evolving field. One of the cytokines with the most promise has been IL-12, a cytokine that has shown exceptional antitumor effects in animal models [1,2].
Administration of recombinant IL-12, alone or in combination with other drugs, has been extensively tested both in tumor-bearing mice and in several clinical trials [1,2]. However, the strong antitumor response exerted by IL-12 has not yet been successfully translated into the clinic, mainly because the majority of clinical trials that involve treatment with IL-12 failed to show sustained antitumor responses and were associated with toxic side effects [2].
Several antitumor mechanisms exerted by IL-12 have been postulated, especially the cytotoxic and antiangiogenic effect mediated by IFN-γ [3,4]. However, a better understanding of how IL-12 mediates tumor protection in different types of tumors needs to be developed. Furthermore, investigations that optimize new therapeutic schedules to deliver the cytokine and minimize or reduce its toxic side effects still remain unexplored. This has led to the question: what are the steps necessary to achieve an antitumor response with IL-12 without the toxicity seen in its clinical use?
In our previous work we have demonstrated that the toxicity elicited by systemic administration of IL-12 can be significantly diminished when it is co-administered with IL-18 via hydrodynamic injection of their cDNAs [5]. Moreover, we have also demonstrated that under this IL-12 gene expression system, TNF-α but not IFN-γ (as previously postulated in other models) [6,7] is responsible for the toxic side effects, and co-administration of IL-18 cDNA greatly diminished TNF-α serum levels without affecting the IL-12 antitumor effect [8]. Given that systemic administration of IL-12 has been avoided in clinical trials because of its toxic side effects, we have previously proposed the use of systemic IL-12 expression along with a monoclonal TNF-α-neutralizing antibody – either an antagonist already used in the clinic, like infliximab and adalimumab, or their new US FDA-approved biosimilar antibodies (PF-06438179/GP1111 and FKB327, respectively) [9,10].
Moreover, most clinical trials that use IL-12 involve testing on patients with accessible tumors such as melanoma or ovarian cancer, where the cytokine is administrated intratumorally or intraperitoneally, respectively [2,11–13]. However, its enormous potential cannot be taken advantage of with tumors that are difficult to reach or metastases, for which a systemic administration strategy could be extremely beneficial; for example, systemic IL-12 has been successfully used for patients with non-Hodgkin’s lymphoma, cutaneous T-cell lymphoma and Kaposi sarcoma [14–16].
The success of a cancer therapy is largely associated with a positive balance between effector versus regulatory leukocyte subsets. Indeed, immunotherapies that lead to increased T-cell recruitment into the tumors and disable immunosuppression, especially of T cells, have largely demonstrated great success in cancer patients, as in the case of PD-1 and CTL-4 anti-checkpoint treatments [17]. In this work we aimed to evaluate the effect of systemic IL-12 treatment on effector versus regulatory leukocyte frequencies and distribution in subcutaneous B16 tumors and in secondary lymphoid organs (SLOs) from the most distal site (spleen and non-tumor-draining lymph nodes [ndLNs]) to a site proximal to the tumors. Moreover, we further evaluated those populations by supervised and unsupervised flow cytometry analysis and obtained interesting data confirming that important changes occur in SLOs and tumor after systemic expression of IL-12 which result in a strong antitumor phenotype. Furthermore, in our murine models, we demonstrated that upon administrating five-times lower amounts of IL-12 cDNA than in our previous work [5], mortality is completely abolished without affecting the cytotoxic antitumor ability of the treatment. Interestingly, we demonstrate that at this dose, IL-12 still exerts functions compatible with antiangiogenic effects, along with a differential effector versus regulatory cells leukocyte distribution ratio. As a consequence, the tumor microenvironment is modified, allowing T cells to increase their number, viability and functional properties.
Materials & methods
Mice & cell lines
C57BL/6 (wild-type) and transgenic Foxp3-EGFP (C57BL/6 background) mice, 6–7 weeks of age, were used and maintained under specific pathogen-free conditions. Animal care was provided in accordance with the procedures outlined in the Guide for the Care and Use of Laboratory Animals (NIH publication no. 86-23, 1985). The experimental protocols were approved by the Institutional Animal Care and Use Committee of Centro de Investigaciones en Bioquímica Clínica e Inmunología, Consejo Nacional de Investigaciones Científicas y Técnicas. Our animal facility has obtained NIH animal welfare assurance (assurance no. A5802-01, Office of Laboratory Animal Welfare; NIH, MD, USA).
B16-F10 melanoma, EL4 lymphoma and YAC-1 cells were obtained from American Type Culture Collection (VA, USA). Both cell lines were free of Mycoplasma infection and tested by PCR every 12 months. B16-F10 melanoma cells were cultured in Dulbecco’s modified Eagle medium (DMEM) and EL4 in RPMI 1640 medium, both containing 10% fetal bovine serum (FBS), 100 U/ml penicillin and 100 μg/ml streptomycin at 37°C and 5% CO2.
Hydrodynamic cDNA injections
The hydrodynamic gene transfer procedure was performed as described previously by our group [5,8,18–20]. The designated amount of each DNA was suspended in 1.6 ml of sterile 0.9% sodium chloride solution. Animals were injected in the tail vein with the cDNAs in less than 8 s and separated in the following groups: control, 1 or 15 μg of open reading frame empty vector cDNA; and IL-12, 1 or 5 μg of IL-12 cDNA (pscIL-12, p40-p35 fusion gene). All the expression plasmids utilize the human elongation 1-α promoter to drive transcription. Plasmids for IL-12 and IL-18 were donated by Morihiro Watanabe (Tokyo, Japan).
Liver, lymph node & spleen leukocyte suspensions
Hepatic mononuclear cells were isolated from the liver of control or IL-12 cDNA-treated mice. Briefly, livers were perfused with 20 ml of phosphate-buffered saline (PBS)/5% FBS, pressed through 200-gauge stainless steel mesh and resuspended in PBS/5% FBS. After being washed with PBS once and subjected to centrifugation, cell pellets were resuspended in 40% Percoll (GE Healthcare Life Sciences, NJ, USA) in complete RPMI 1640 medium. Cell suspensions were gently overlaid onto 80% Percoll and centrifuged for 20 min at 1000 × g, then hepatic mononuclear cells were collected from the interface. The cells were washed, resuspended in erythrocyte lysing solution (ACK lysis buffer; Gibco, NY, USA) washed twice in PBS, counted and diluted to the desired concentration in supplemented medium [21].
Spleens and inguinal and axillary lymph nodes were harvested, homogenized and depleted of red cells (spleen suspensions only) by incubation in ACK lysis buffer, then washed and resuspended in supplemented medium.
Subcutaneous tumor growth
Wild-type and FoxP3-EGFP C57BL/6 mice were shaved and injected subcutaneously in the left flank with 1 × 10⁶ B16-F10 melanoma or EL4 lymphoma cells in 100 μl of a sterile 0.9% sodium chloride solution. After 7–10 days, when solid tumors were visible (4–5 mm diameter), the mice were hydrodynamically injected with the designated cDNAs. Tumor growth was monitored with a caliper [5,8]. Day 0 corresponds to the day when cDNAs were administered. Tumor volume was calculated as ((d2)*D)/2, in which d corresponds to the lower diameter of the tumor and D to the longest one. Values (fold changes) were normalized to day 0. At day 7 post-hydrodynamic injection, tumors were obtained and weighted using an analytical scale.
In vitro tumor cell stimulation
For cytokine analysis of in vitro stimulated cells, B16 tumors were harvested, weighed, cut into small pieces, mechanically disrupted with a disposable mesh (FiltraBags, QC, Canada) and resuspended as 0.2 g of tumor per 5 ml of supplemented medium (RPMI 1640, 10% FBS, 2 mM l-glutamine, 100 U/ml penicillin, 100 μg/ml streptomycin). Then 50 μl of the cell suspension was seeded in a 96-well plate and cultured in supplemented medium for 5 h in an incubator at 37°C and 5% CO2 in the presence of phorbol 12-myristate 13-acetate (PMA; 50 ng/ml) and ionomycin (1 μg/ml). After the incubation time, supernatants were collected and frozen at -80°C for cytokine quantification by ELISA.
Cytokine assays
At 24 h post-hydrodynamic injection, animals were bled and sera obtained and frozen at -80°C until use. Sera or culture supernatants were assayed for cytokine production by ELISA according to the manufacturer’s instructions; the kits utilized were mIL-12 and mTGF-β (BD Bioscience, CA, USA).
Killing assay
Spleens and livers were obtained at the indicated time points after hydrodynamic injection of the cDNAs from both groups of mice (IL-12 and control), harvested and depleted of red cells by treatment with ACK lysis buffer. Cells were counted and co-cultured in round-bottom FACS tubes with target YAC-1 cells (previously stained with 5 μM carboxyfluorescein succinimidyl ester [CFSE; Thermo Fisher, MD, USA] dye for 15 min in the dark at room temperature) at a 1:1 ratio in supplemented media at 37°C and 5% CO2. After 30 min, cells were washed and stained with Annexin-V-phycoerythrin (PE) and 7-aminoactinomicina D (7AAD) and analyzed by flow cytometry. Details of the killing assay can be found in Supplementary Figure 1. Briefly, target and effector cells could be easily gated out, first on a forward scatter (FSC) versus side scatter (SSC) dot plot, because YAC-1 cells are much larger than leukocytes (Supplementary Figure 1A), and also based on CFSE expression (Supplementary Figure 1B). Cytotoxicity was calculated as the percentage of total YAC-1 AnnV+ cells (by adding AnnV+7AAD− and AnnV+7AAD+ cells) in each group of mice at the different time points. To check the levels of spontaneous target cell death, we first checked the percentage of YAC-1 AnnV+ cells within the well cultured with target cells alone. The data always indicated ∼2–4% spontaneous cell death (Supplementary Figure 1C).
To normalize the killing capacity of leukocytes from spleen and liver in the days post-treatments, data were expressed as a killing index, calculated by dividing each individual value from the IL-12 cDNA-treated mice by the average of the control group for every day tested, as indicated in the following formula:
Flow cytometry analysis
Phenotypic analysis of cells from spleen, tumor-draining lymph nodes (dLN) or ndLNs and tumor was performed by flow cytometry ex vivo or after cell culture. Splenocyte suspensions were depleted of red cells by treatment with ACK lysis buffer before staining. Tumors were mechanically disrupted and resuspended at 1 g of tumor per 7 ml of PBS + 2% FBS. Samples were first washed with PBS and stained with Zombie Aqua™ Fixable Viability Kit (Biolegend, CA, USA) for 15 min at room temperature for exclusion of dead cells. Expression of different markers was assessed by staining with appropriate combinations of the following monoclonal antibodies: CD45; CD8 and CD44 (Biolegend) and CD4, B220, NK1.1, NKp46, CD11b, Gr-1, F4/80, IFN-γ, Ki67 and CCR5 (BD Bioscience, CA, USA).
For Ki67 detection, 400 μl of tumor cells from a 0.2 g/5 ml suspension were surface stained, fixed and permeabilized with a FoxP3 staining kit (eBioscience, CA, USA) and incubated with a purified anti-Ki67 antibody or correspondent isotype control (BD Bioscience) for 30 min on ice, then washed and incubated with an anti-IgG Alexa Fluor® 546 (Invitrogen, MA, USA).
For intracellular IFN-γ detection in the tumor samples, 400 μl of total tumor B16 suspension was obtained (0.2 g tumor/5 ml of supplemented medium, as described above) and cultured in 24-well plates in the presence of PMA (50 ng/ml) and ionomycin (1 μg/ml). Then, 1 h after PMA/ionomycin addition, brefeldine A (5 μg/ml) and monensine (2 nM; Biolegend) were added and cells were incubated for an additional 4 h. Cells were harvested, surfaced stained, fixed and permeabilized with FoxP3 staining kit (eBioscience) and incubated with an anti-mouse, anti-IFN-γ or corresponding isotype control antibody. Due to possible internalization, CCR5 staining was performed on the surface as well as intracellularly. Cells were analyzed on a Fortessa™ flow cytometer (BD Biosciences).
Immunofluorescence staining
To visualize the presence of blood vessels by immunofluorescence, tumors were harvested, fixed with 4% paraformaldehyde (PFA), embedded in Cryoplast® (Biopack, Buenos Aires, Argentina) and cut into 10-μm thick sections using a Shandon Cryotome E cryostat (Thermo Scientific, FL, USA), then mounted on Starfrost® adhesive slides (Knittel Glass, Braunschweig, Germany). Sections were rehydrated with blocking buffer (10% bovine serum albumin, 0.3% Triton™ in tris-buffered saline [TBS]), rinsed with TBS (Gibco, NY, USA) and incubated overnight at 4°C with the corresponding dilutifiction of CD31 (clone M-20; Santa Cruz Biotechnology, TX, USA) in blocking buffer. After several rinses, sections were incubated with an anti-rat IgG Alexa Fluor 546 (Molecular Probes, MA, USA) antibody and counterstained with 4′,6-diamidino-2-phenylindole (DAPI). Slides were analyzed under a FV1200 laser scanning confocal fluorescence microscope (Olympus, Tokyo, Japan).
mRNA analysis
Total RNA was isolated using a single-step phenol/chloroform extraction procedure (TRIzol™; Invitrogen Life Technologies). For the RNase protection assay, 5 μg of total cytoplasmic RNA was analyzed using RiboQuant kits (BD Biosciences) and [33] PUTP-labeled riboprobes as described previously by ourselves and other laboratories [20,22].
Statistical analysis
Statistical analyses were performed using GraphPad Prism version 7.0 (GraphPad, CA, USA). Data was analyzed by means of a Student unpaired t-test (for comparison of two experimental groups) or two-way analysis of variance (for comparison of more than two variables). Results are expressed as means ± standard error of the mean and were considered to be statistically significant when p < 0.05.
Results
Previous studies in our group demonstrated that systemic expression of IL-12 induced by hydrodynamic injection of 5 μg of IL-12 cDNA was able to generate efficient in vivo control of B16 and 3LL tumor growth [5]. Here we demonstrate that these data correlate with an efficient killing capacity of YAC-1 cells by leukocytes obtained either from the liver or the spleen of IL-12 cDNA (5 μg)-treated mice up to 50 days post-cDNA administration (Figure 1).
Figure 1. . Increased killing capacity against YAC-1 cells of leukocytes obtained from liver or spleen from IL-12 mice.

Wild-type C57BL/6 mice were hydrodynamically injected with 5 μg of empty vector (control) or IL-12 cDNA and at different time points (days 1, 2, 3, 7, 10 and 50) livers and spleens were taken and leukocyte suspensions were generated. Cells were cocultured with CFSE+YAC-1 cells in a 1:1 ratio in supplemented RPMI 1640 medium for 30 min at 37°C and 5% CO2. Cells were washed, stained with 7AAD and annexin V and acquired by flow cytometry. (A) Representative histograms of YAC-1 cells from cocultures with splenocytes from a control or IL-12 mice. (B) Killing index was calculated for IL-12 cDNA-treated mice as (% of AnnV+CFSE+ cells) + (% of AnnV+ − 7AAD+CFSE+ cells) and normalized dividing each individual value from the IL-12 mice by the average of the control group for every day tested. Statistical analysis was performed with the Student t-test. Data represent the median of four independent experiments with three or four mice per group.
*Control versus IL-12, p < 0.05.
7AAD: 7-aminoactinomicina D.
We observed that when we reduced the doses of IL-12 cDNA from 5 to 1 μg, expression of this cytokine at 24 h post-injection dropped from around 4500 ng/ml [5] to 2500 pg/ml (Supplementary Figure 2A). Interestingly, at this lower dose the animals completely resisted the treatment with no toxicity observed (100% survival over 50 days post-IL-12 treatment, n = 6–8 mice per group; data not shown) compared with 10% survival at the same time point observed previously when 5 μg of IL-12 cDNA was used [5]. It is important to mention that we have chosen, as a control group for this study, an empty control plasmid to discriminate between the biological effects induced by the plasmid itself and the effects of cytokine expression. In our previous studies, we determined that the control plasmid was able to induce low levels of IL-12, TNF-α and IFN-γ compared with the high levels produced by the IL-12 cDNA [5,8]. Additionally, we also tried other control groups which only received the vehicle (sterile 0.9% sodium chloride solution, by hydrodynamic injection) and observed a similar cytokine pattern to the one obtained with the empty plasmid control. These results led us to conclude that the low and transitory levels of cytokine produced in both types of control mice were induced by the delivery procedure rather than by the plasmid itself. Based on these observations, we decided to use the empty plasmid group as our control, as we considered it to be more relevant than the vehicle alone.
We evaluated the impact of reducing the amounts of IL-12 cDNA on tumor growth control. We observed that both EL4 and B16 tumor sizes were significantly smaller in IL-12 (1 μg) cDNA-treated than control cDNA-treated mice (Figure 2A). In order to evaluate whether 1 μg of IL-12 cDNA affects the number of tumor blood vessels, we used subcutaneous EL4 and B16 tumor models. We observed that IL-12 cDNA treatment was able to reduce the visualization of blood vessels in EL4 tumors, as evidenced by whiter tumors (Figure 2A). The presence of blood vessels was also evaluated by platelet endothilial cell adhesion molecule (PECAM) staining in EL4 and B16 tumor slices (Figure 2B). We found a reduction in the presence of blood vessels in both in type of tumors, compatible with signs of antiangiogenesis as previously described [23,24], although the reduction was more notable in EL4 tumors (Figure 2B). However, in both tumor models, this observation correlates with significantly flattened growth curves (Figure 2C) and tumor weights (Figure 2D) in IL-12 cDNA-treated compared with control cDNA-treated mice. Moreover, we found greater leukocyte infiltration into the IL-12 cDNA-treated B16 mice (Figure 2B). Unfortunately, we could not perform the same analysis in EL4 tumors because they express several leukocyte and T-cell lineage markers that make it impossible to distinguish EL4 cells from infiltrating host cells (Supplementary Figure 3).
Figure 2. . Systemic IL-12 expression significantly reduces subcutaneous EL4 and B16 tumor growth and the number of blood vessels inside the tumors.

Wild-type C57BL/6 mice were subcutaneously inoculated with 1 × 10⁶ of either B16 or EL4 cells. When subcutaneous solid tumors were visible and palpable (4–5 mm), mice were hydrodynamically injected with 1 μg of an empty vector (control) or IL-12 cDNA. Then, 7 days after hydrodynamic injection, tumors were taken and processed according to each experiment. (A & B) EL4 or B16 tumors from control or IL-12 cDNA-treated mice were (A) macroscopically analyzed or (B) fixed, cut into 10-μm sections and incubated with a purified anti-PECAM antibody plus a secondary Alexa 546 antibody (EL4) or a purified anti-PECAM antibody plus a secondary Alexa 488 antibody + anti-CD45 Alexa 546 antibody (B16). Slides were analyzed under a FV1200 laser scanning confocal fluorescence microscope at 10× magnification, stained as follows: PECAM (red for EL4 and green for B16), CD45 (red only in B16) and 4′,6-diamidino-2-phenylindole (blue). (C) Tumor growth curves for EL4- and B16-bearing mice were evaluated until day 7 post-treatments and the results summarized as fold change. (D) On the day of euthanasia, subcutaneous EL4 and B16 tumors were removed and weighed using an analytical scale. (E) Individual values of tumor growth for each control or IL-12 cDNA-treated mouse. Data represent the median of two independent experiments with three or four mice per group. Statistical analysis was performed using the Student t-test.
**p < 0.01; ****p < 0.0001.
D: Day; PECAM: Platelet endothilial cell adhesion molecule.
Even though we observed differences in the IL-12 serum levels induced in each mouse after the same amount of administered cDNA, we wanted to determine whether this could affect the outcome of tumor growth. Interestingly, linear correlation analysis (r2) demonstrated a significant association between IL-12 expression and subcutaneous B16 tumor sizes (Supplementary Figure 2B), suggesting that even though the range of IL-12 expression was wide (1000–5000 pg/ml), the levels were totally effective to control tumor growth (compare IL-12 vs control mice in Figure 2C & D) but not high enough to induce toxicity.
Systemic expression of IL-12 induced significant splenomegaly compared with the spleen size of control mice (Figure 3A). This enlargement of the spleens correlated with an increase in total splenocyte numbers in IL-12 cDNA-treated mice (Supplementary Figure 4). Moreover, as shown in Figure 3B & Figure 4, IL-12 treatment is able to significantly alter normal cell distribution not only in the spleen but also in dLNs and ndLNs, as well as inside the tumors (Figure 5). Supervised flow cytometry analysis of cell distribution was performed in all tissues simultaneously and from the most distant to most proximal to the tumor (spleen >ndLN >dLN >tumors).
Figure 3. . Systemic IL-12 expression generates changes in spleen leukocyte distribution.

Foxp3-EGFP C57BL/6 mice were subcutaneously inoculated with 1 × 10⁶ B16 cells. When solid tumors were visible, the mice were hydrodynamically injected with 1 μg of an empty vector (control) or IL-12 cDNA. Then, 7 days after hydrodynamic injection, the spleens were harvested and (A) pictures were taken to visualized splenomegaly. (B) Single-cell suspensions were obtained and cells were stained with Zombie Aqua Dye, CD4, CD8, B220, CD11b and Gr1 antibodies for flow cytometry analysis. Foxp3 expression was analyzed in the CD4 population based on enhanced green fluorescent protein detection. Dot plots show frequencies of each subpopulation analyzed from a control or IL-12 representative sample. Data represent the pool of three independent experiments with three–five mice per group. Statistical analysis was performed using the Student t-test.
**p < 0.01; ***p < 0.001.
Figure 4. . Systemic IL-12 expression generates changes in leukocyte distribution in tumor-draining and non-draining lymph nodes.

Foxp3-EGFP C57BL/6 mice were subcutaneously inoculated with 1 × 10⁶ B16 cells. When solid tumors were visible, the mice were hydrodynamically injected with 1 μg of an empty vector (control) or IL-12 cDNA. Then, 7 days after hydrodynamic injection, both inguinal lymph nodes were taken, harvested, counted and stained with Zombie Aqua Dye, CD3, CD4, CD8, B220, CD11b and Gr1 antibodies for flow cytometry analysis. Foxp3 expression was analyzed in the CD4 population based on enhanced green fluorescent protein detection. Dot plots show frequencies of each subpopulation analyzed from a control or IL-12 representative sample. Data represent the pool of three independent experiments with three–five mice per group. Statistical analysis was performed using the Student t-test.
*p < 0.05; **p < 0.01 (the statistical difference between controls and IL-12-treated mice for each type of lymph node).
dLN: Draining lymph node; ndLN: Non-draining lymph node.
Figure 5. . Systemic IL-12 expression generates a differential distribution of tumor-infiltrating leukocytes.

Foxp3-EGFP C57BL/6 mice were subcutaneously inoculated with 1 × 10⁶ B16 cells. When solid tumors were visible, the mice were hydrodynamically injected with 1 μg of an empty vector (control) or IL-12 cDNA. Then, 7 days after hydrodynamic injection, B16 tumors were harvested and mechanically disrupted, and the resulting cell suspensions were stained with Zombie Aqua Dye, CD45, CD3, CD4, CD8, B220, CD11b and Gr1 antibodies for flow cytometry analysis. Foxp3 expression was analyzed in the CD4 population based on enhanced green fluorescent protein detection. Dot plots show frequencies of each subpopulation analyzed from a control or IL-12 representative sample. Data represent the pool of two independent experiments with three–five mice per group. Statistical analysis was performed using the Student t-test.
*p < 0.05; **p < 0.01; ***p < 0.001 (the statistical difference of each parameter analyzed between control and IL-12-treated mice).
Interestingly, systemic IL-12 cDNA treatment is able to induce significant changes in the percentages of different leukocyte populations in SLOs and tumors which depend on the tissue being evaluated. In the spleen, B cells, along with CD4+ and CD8+ T cells, diminished in percentage after IL-12 cDNA treatment (Figure 3B); however, only the absolute number of CD4+ T cells was significantly lower in the IL-12 cDNA-treated mice (Supplementary Figure 4). In contrast to the spleen, the frequency of B cells was highly increased both in ndLN and dLN after IL-12 cDNA expression, but the frequencies of CD4+ and CD8+ T cells were significantly diminished in the dLNs (Supplementary Figure 5). However, the absolute number was only significantly lower in CD4+ T cells from IL-12-treated mice in dLNs (Supplementary Figure 5), an effect similar to that seen in the spleen (Supplementary Figure 4).
Evaluation of populations with potential regulatory effects (CD11b+Gr1+ and CD4+FOXP3+ cells) surprisingly showed that the frequencies were augmented in all SLOs evaluated after systemic expression of IL-12 compared with control mice (Figures 3 & 4). Notably, these populations were also enriched in number in dLNs, especially the CD4+FOXP3+ T cells in IL-12 cDNA-treated mice (Supplementary Figure 5).
This heterogeneous response to IL-12 between the different SLOs encouraged us to evaluate the cell distribution inside the subcutaneous B16 tumors. First, we observed remarkable differences in the percentages of tumor-infiltrating leukocytes, where IL-12 systemic expression induced a fivefold increase in the percentage of total CD45+ cells compared with control mice (9.7 vs 2.1%; Figure 5). Importantly, these data correlated with the high number of leukocytes infiltrating B16 tumors in IL-12 cDNA-treated mice (Figure 2B).
While CD4+ T cells showed a similar frequency, CD8+ T cells were enriched in the tumors of IL-12-cDNA-treated mice (Figure 5). Interestingly, this effect was accompanied by a reduction in the proportion of both CD11b+Gr1+ and CD4+FOXP3+ cells in the IL-12 group (Figure 5). These data are quite interesting; as mentioned above, these regulatory populations are increased in SLOs of IL-12 cDNA-treated mice (Figures 3 & 4). Even though the cell frequencies and distribution differed between SLOs, the CD8/CD4 ratio was always significantly higher in the three SLOs while the CD8/Treg ratio was significantly lower in ndLNs and dLNs of IL-12 cDNA-treated mice (Supplementary Figure 6), demonstrating a positive effector-versus-regulatory ratio after systemic expression of IL-12. An additional interesting finding is the comparison between dLNs and ndLNs after IL-12 treatment. First, we observed a significant increase in the total cell numbers in dLNs versus ndLNs that was not changed by the IL-12 treatment (Figure 6A). When we analyzed viability by Zombie Aqua staining, we found that cells were less viable in dLNs versus ndLNs of control mice; however, this effect was not observed in the IL-12 cDNA-treated mice (Figure 6B).
Figure 6. . Differences in total cell numbers and cell survival between tumor draining and non-draining lymph nodes.

Wild-type C57BL/6 and Foxp3-EGFP C57BL/6 mice were subcutaneously inoculated with 1 × 10⁶ B16 cells. When solid tumors were visible, the mice were hydrodynamically injected with 1 μg of an empty vector (control) or IL-12 cDNA. Then, 7 days after hydrodynamic injection, both inguinal lymph nodes were taken, harvested, counted and stained with Zombie Aqua. (A) Total cell number and (B) percentage of living cells (Zombieneg cells) for each sample and group are shown. (C) Representative dot plot of Zombie Aqua staining of the bulk of cells from the draining and non-draining lymph nodes of a control mouse. Statistical analysis was performed using the Student t-test. Data represent the pool of two independent experiments with three–five mice per group.
dLN: Draining lymph node; ndLN: Non-draining lymph node; SSC: Side scatter.
To further examine cell populations in SLOs, we performed a unsupervised flow cytometry analysis by T-distributed stochastic neighbor embedding (tSNE) and phenograph clustering (Supplementary Figure 7). According to what we observed in the supervised analysis, the frequencies of B cells and CD4+ and CD8+ T cells were significantly diminished in spleen (red arrows), while the non-B cell/non-T cell area (yellow rectangles) was increased and showed enrichment of different clusters (yellow arrows) between control and IL-12 groups based on the phonograph map in Supplementary Figure 7A. Then we decided to further analyze those clusters (orange, red and yellow; Supplementary Figure 7B) by comparing lineage markers on an overlapped histogram plot (Supplementary Figure 8C). We found that the yellow population enriched in control mice are small nongranular cells that seem not to express any of the B cell, T cell or myeloid cell markers included in this panel (Supplementary Figure 8C). The red cluster is more abundant in IL-12 cDNA-treated mice and comprises large granular cells that partially express CD11b and intermediate CD44. The orange subset, enriched in control mice, are also large and granular cells that express high levels of CD44, CD11b and Gr1, compatible with a suppressor myeloid phenotype (Supplementary Figure 8C). The latter data surprised us, as this type of cell showed higher numbers in the spleens of IL-12-treated mice upon supervised analysis (Figure 3).
The unsupervised analysis of lymph nodes also showed changes in cell frequency between ndLNs and dLNs or between control and IL-12-treated groups, as exemplified in the yellow, orange, red, brown and blue circles in Supplementary Figure 9D. We next performed individual expression analysis on the clusters that corresponded to each of those specific circles (Supplementary Figure 9). We found that in the CD8 cluster, cells with a memory/activated phenotype (CD44hi cells) can be preferentially present after IL-12 treatment in both types of lymph node (orange circles; Supplementary Figure 9C). Instead, and surprisingly, cells with a naive phenotype were more enriched in the dLNs compared with the ndLNs (red circles; Supplementary Figure 9C). In the CD4 subset, we could detect a population that was almost absent in the ndLNs (yellow circles, Supplementary Figure 9D). This population expresses lower levels of CD4 compared with the rest of the clusters (Supplementary Figure 9D). We hypothesized that this could be a myeloid population, especially monocytes, because they could express CD4. However, they do not express either CD11b or Gr1 (Supplementary Figure 9E).
Finally, in the non-T cell, non-B cell area we detected two clusters that were highly represented in the ndLNs compared with dLNs in control mice (black circles; Supplementary Figure 9F). None of the clusters expressed CD11b, and while the gray population is small, the light blue cells are larger and express some level of CD44 (black circles; Supplementary Figure 9F).
When we performed unsupervised analysis in the tumors, we found that, as seen in the supervised analysis (Figure 5), CD8+ T cells were enriched (green circles) in mice that received systemic IL-12 cDNA treatment, while CD4+ T cells (green circles) showed a similar frequency between the two groups of mice (Supplementary Figure 10C). Interestingly, we observed that two different clusters (orange and light blue rectangles) were highly diminished in CD45+ cells from IL-12-treated mice (Supplementary Figure 10C). We performed further analysis of those clusters and found that they showed quite different characteristics based on size and granularity (FSC vs SSC) and marker expression. Cells in the orange clusters were small with low granularity, did not express lineage markers for B cells or T cells and did not express CD44 or CD11b, but they did express high levels of F4/80 (a macrophage linage marker). The light blue clusters are large granular cells which did not express lineage markers for B cells or T cells but did express CD44, F4/80 and CD11b and had high expression of Gr-1, a phenotype compatible with myeloid suppressor cells. Interestingly, this population represents an important fraction of tumor-infiltrating leukocytes and was quite reduced in the IL-12-treated mice (Supplementary Figure 10C).
Even though very interesting data can be extracted from the unsupervised analysis, multiple marker analysis is needed that could help to further characterize these populations and determine whether they play a role in the control of tumor growth.
Altogether, these data demonstrate that a single administration of 1 μg of IL-12 cDNA is able to induce: tolerated levels of systemic IL-12 (compared with the use of 5 μg of IL-12 cDNA); signs of a strong tumor antiangiogenic effect; a more protective environment for cell survival in the dLNs; and an increased percentage of cytotoxic CD8+ T cells along with a lower proportion of cells with a potential regulatory function inside the tumors. All these effects in combination could explain the significantly higher control of tumor growth in IL-12-treated versus control mice, as evaluated in two different murine tumor models (EL4 and B16).
IFN-γ is a cytokine that can exert an antiangiogenic effect which severely affects tumor growth [25]. We have previously reported high IFN-γ systemic levels after hydrodynamic injection of 5 μg of IL-12 cDNA [5]. In the present work, we wanted to compare the production of this cytokine by EL4 and B16 tumor-infiltrating CD8+ T cells in both groups. In Figure 7A & B, we compared the percentages of IFN-γ+ cells in the CD8+ T cells versus the natural killer (NK)/NKT cell subsets present in B16 tumors. As reported by other laboratories [26–28] and our group (Figure 7C), activation of NK cells by different stimuli, including IL-12, induces a noticeable reduction in the expression of different lineage markers. This is the main reason why we could not analyze this population in the cell distribution data discussed earlier, because it could generate inaccurate information about their real number. However, in the case of IFN-γ production, we did not need the real numbers to demonstrate the cells’ functional capacity. We gated on NK1.1+ cells and could detect those cells in the IL-12-treated mice and analyze their IFN-γ production. We observed an increase in the number of IFN-γ+ cells in both subsets in B16 tumors of IL-12-treated mice compared with control mice, although this difference was larger and significant only in CD8+ T cells (Figure 7D). Although we could not detect a clear number of NK cells infiltrating the EL4 tumors, we found an increase in the percentage of both total CD8+ cells and IFN-γ+CD8+ cells inside the tumors, indicating similar results to those obtained in the B16 model (Supplementary Figure 11B & C, respectively).
Figure 7. . IL-12 systemic expression does not affect the number of CCR5+CD8+ T cells but induces an increase in the percentage of IFN-γ+CD8+ T cells in B16 tumors.

Wild-type C57BL/6 mice were subcutaneously inoculated with 1 × 10⁶ B16 cells. When solid tumors were visible, the mice were hydrodynamically injected with 1 μg of an empty vector (control) or IL-12 cDNA. Then, 7 days after hydrodynamic injection, B16 tumors were removed, mechanically disrupted and resuspended as 0.2 g of tumor/5 ml of supplemented medium, and (A, B & D) 600 μl of the suspension were seeded into a 96-well plate and cultured in supplemented media for 5 h in the presence of (A) phorbol-12-myristate-13-acetate/ionomycin, Brefeldin A and Monensin. Cells were surface stained with anti-CD45, CD3, CD4, CD8, CCR5 antibodies (or isotype control), washed, fixed, permeabilized and stained with an anti-IFN-γ and anti-CCR5 antobodies (or isotype control). (C) Splenocytes from control or IL-12 cDNA-treated mice were labeled with NK1.1 and NKp46 antibodies. (A & B) R.epresentative dot plots of IFN-γ production on CD8+ and NK cells (respectively). (E) CCR5+CD8+ T cells from control or IL-12 cDNA-treated mice; the mean + standard error of the mean of a pool of two independent experiments with four or five mice per group is displayed. (D) Represents the mean + standard error of the percentage of IFN-γ+CD8+ T cells or IFN-γ+NK cells. Statistical analysis was performed using the Student t-test.
IC: Isotype control; NK: Natural killer.
Tumor antigen-specific T helper 1 lymphocytes produce IFN-γ in the tumor microenvironment, leading to the expression of cytotoxic T lymphocytes and chemoattractants including CXCL9, CXCL10, CCL2, CCL3 and CCL5 [29]. Accordingly, a role for CCR5 in T-cell migration into the tumor has been documented, and local production of CCL5 induces selective recruitment of CD8 T cells and cytotoxic T lymphocyte-dependent tumor suppression in mouse models [30]. In our model we observed a large proportion of CCR5+CD8+ T cells inside the tumor in both control and IL-12 cDNA-treated mice; however, no significant differences between the groups were detected (Figure 7E).
We speculated that the enrichment of CD8+ T cells in the tumors of IL-12 cDNA-treated mice could be the result of high proliferation in the tumor site. To test this hypothesis, we stained CD8+ T cells with an anti-Ki67 antibody [31]. Ki67 is expressed in the nucleus during the whole cell cycle except for the G0 phase, and the magnitude of its expression is an indicator of the proliferative capacity of a cell [31]. We observed that the percentage of Ki67+ CD8+ T cells in B16 tumors was quite low in control mice but significantly increased in IL-12-treated mice (Figure 8A & B). Moreover, Ki67 mean fluorescence intensity (MFI) expression was significantly higher in CD8+ T cells from IL-12-treated mice than in those from control mice (Figure 8C). Next, we evaluated the TGF-β levels present in cultures of B16 tumors, because this cytokine negatively affects T cells’ proliferative capacity [32,33]. Accordingly, we observed that supernatants obtained from tumors of IL-12-treated mice expressed significantly lower levels of TGF-β compared with control mice (Figure 8D).
Figure 8. . CD8+ T cell proliferation in IL-12 cDNA-treated mice correlates with lower tumor TGF-β production.
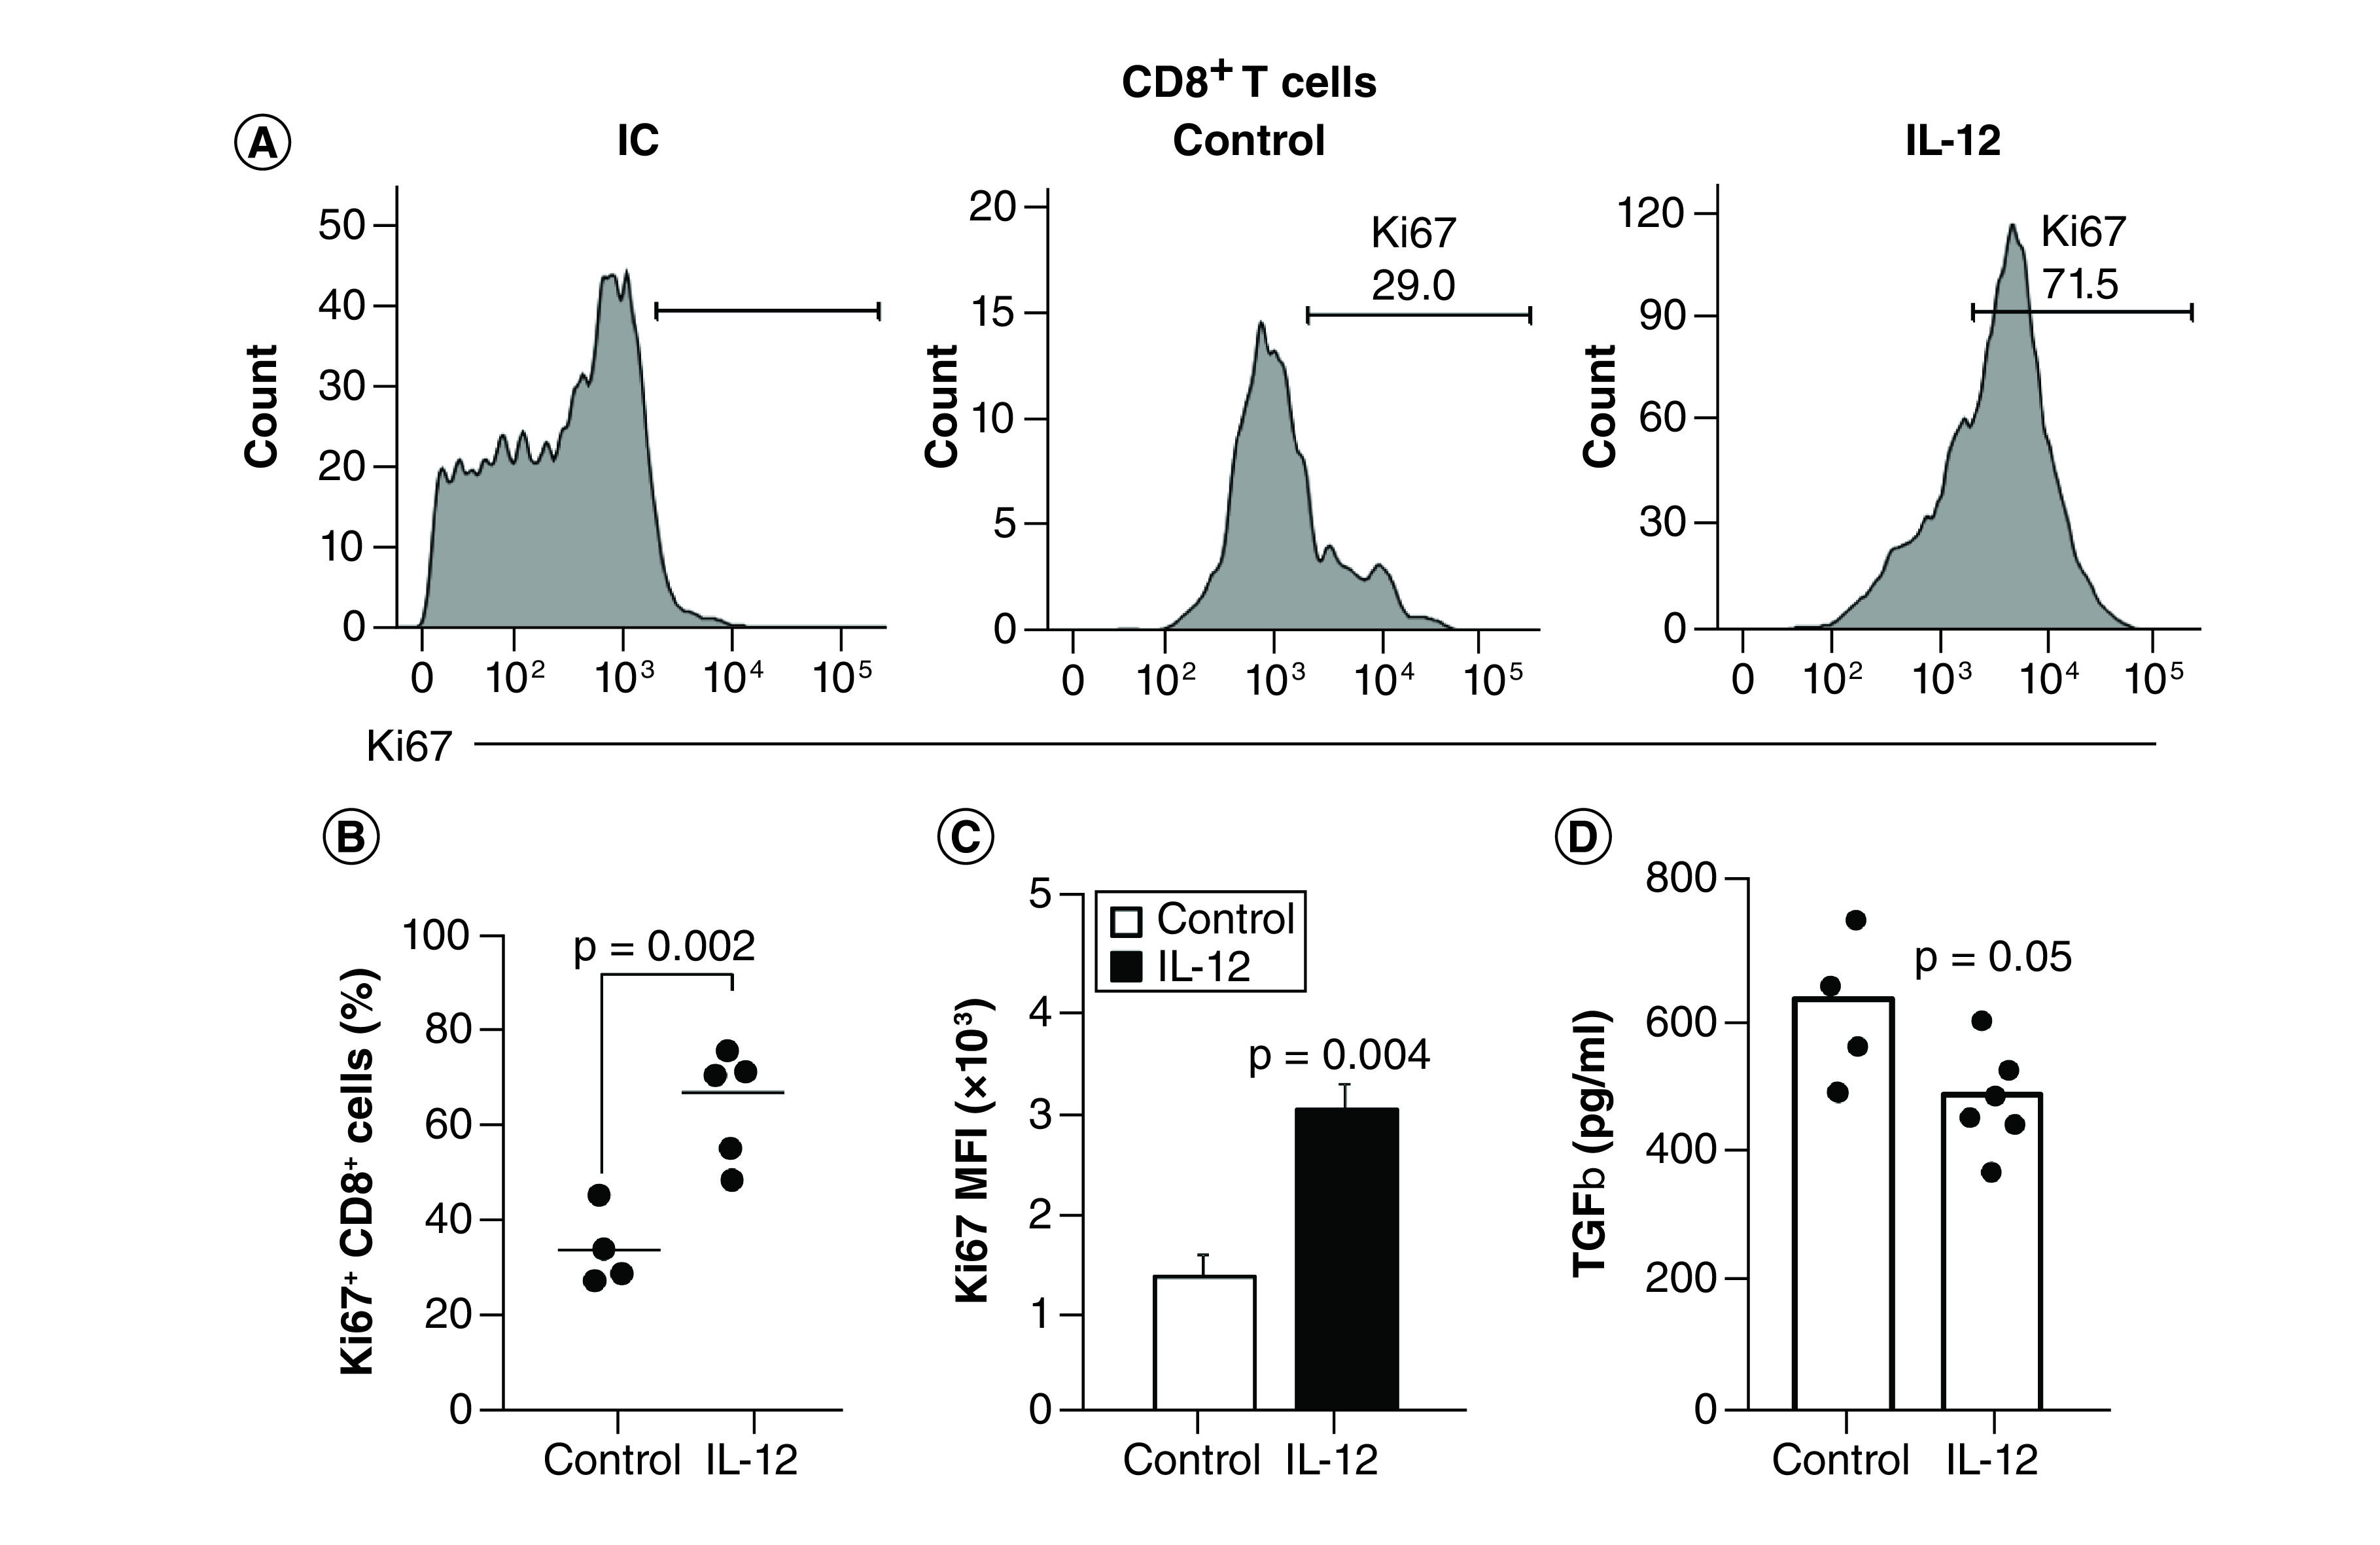
Wild-type C57BL/6 mice were subcutaneously inoculated with 1 × 10⁶ B16 cells. When solid tumors were visible, the mice were hydrodynamically injected with 1 μg of an empty vector (control) or IL-12 cDNA. Then, 7 days after hydrodynamic injection, B16 tumors were harvested, mechanically disrupted and cell suspensions were surface stained with (A) CD45, (B) CD3 and (C) CD8 antibodies, fixed, permeabilized and stained with an anti-Ki67 antibody (or IC), or (D) seeded into a 96-well plate and cultured in supplemented media for 5 h in an incubator at 37°C and 5% CO2 in the presence of phorbol-12-myristate-13-acetate/ionomycin. After the incubation time, supernatants were collected and frozen at -80°C for cytokine quantification by ELISA. (A) Representative histograms of isotype control or Ki67 expression in tumor-infiltrating CD8+ T cells. (B) Percentage or (C) mean fluorescence intensity expression of Ki67+ on CD8+ cells for each group. (D) TGF-β levels were determined by ELISA in culture supernatants. Statistical analysis was performed using the Student t-test. Data represent the pool of two independent experiments with three–five mice per group.
IC: Isotype control.
Discussion
It has been reported that mice deficient for the IL-12 Rβ2 chain have an increased frequency of spontaneous tumors and also increased growth of transplantable tumors [34]. Interestingly, in humans a correlation has also been reported in subjects with certain IL-12 polymorphisms that lead to decreased IL-12 production; these individuals show an increased susceptibility to the development of gliomas [35]. These findings demonstrate the importance of endogenous IL-12 in the control of spontaneous tumor appearance both in mice and humans, and support the use of this cytokine in the treatment of different types of cancers. Due to its ability to stimulate immunity and inhibit tumor angiogenesis, IL-12 has been identified as one of the most potent antitumor candidates [36], although IL-12 demonstrated undesirable side effects after systemic administration of IL-12 recombinant protein in several clinical trials [16,37,38]. The reasons for that observed toxicity are still being debated in the oncology field, albeit without any investigation on how to mitigate those side effects. As a result, current studies on the use of IL-12 in cancer treatments have been redirected to the development of new strategies that induce the cytokine at the tumor level or involve the administration of lower doses as an adjuvant in combination with other drugs/treatments [2,6,36]. Although local tumor control is important, it requires an accessible tumor for injection (if a noninvasive procedure is desired) and the treatment cannot be utilized for metastatic disease, which is present in many cancer patients. In this context, reduction of the toxic side effects of systemic IL-12 delivery still deserves further investigation.
Currently, a number of original therapeutic approaches involving systemic IL-12 using different delivery systems with low toxicities are being undertaken. First, Mansurovet et al. performed intravenous administration of a collagen-binding domain fused to IL-12 (CBD–IL-12) in mice bearing aggressive tumors; the hybrid molecule accumulates in their stroma due to exposed collagen in the disordered tumor vasculature [39]. Second, as focused ultrasound has been confirmed to temporally and locally open the blood–brain barrier, Chen et al. explored the possibility of combining focused ultrasound-induced blood–brain barrier opening with IL-12 systemic delivery to enhance the anticancer immunological response for glioma treatment [40]. Third, a study by Zhang et al. demonstrated that murine IL-12 can be systemically delivered and reach hypoxic sites in solid tumors when coinjected with Clostridium sporogenes, producing a clear delay in tumor growth and a 14.3% cure rate in a mouse tumor model [41]. Fourth, Tevz et al. demonstrated the effectiveness of systemic IL-12 gene therapy in murine sarcoma models by a controlled release of IL-12 after intramuscular gene electrotransfer into the tibialis cranialis; the authors demonstrated success in controlling growth of local and distal (lung metastasis) subcutaneous SA-1 and LPB tumors after IL-12 gene electrotransfer, either alone or in combination with local tumor or lung irradiation [42]. Furthermore, additional creative approaches using systemic IL-12 have been reported in mice and in cancer patients [43–48].
In our previous model a single injection of 5 μg of IL-12 cDNA was sufficient to reach high and persistent systemic serum levels of the cytokine compared with clinical trials that use multiple administrations of recombinant IL-12 [49]. However, as previously described by other investigators, both in murine cancer models and in several clinical trials, systemic IL-12 is associated with undesired toxic side effects [1,2] which in our case could lead to the death of 80–90% of the mice over 50 days post-treatment [5].
Interestingly, we have previously demonstrated that coinjection of IL-12 (5 μg) and IL-18 (10 μg) cDNAs was able to significantly ameliorate survival by rapidly increasing serum levels of IL-10 protein compared with IL-12 (5 μg) cDNA treatment alone [5]. This result is quite interesting, taking into account that coadministration of recombinant IL-12 + IL-18 proteins has been described to lead to fatal toxicity in mouse models [7,50]. Moreover, in a clinical trial using rpIL-12 in cancer patients, not only did several cycles need to be administered weekly but also IL-10 induction driven by repeated delivery of IL-12 contributed to increasing the immunosuppressive properties of the tumor [49,51].
In the present work we used a single injection of 1 μg of IL-12 cDNA in order to: avoid repeated administration of IL-12; generate nontoxic levels of the cytokine; induce a reduction in the number of tumor blood vessels; and increase leukocyte functionality at the tumor site. So far, our data reported here demonstrate that we were able to accomplish those goals. Moreover, by utilizing a single administration of 1 μg of IL-12 cDNA (which is also less expensive than recombinant protein), IL-12 levels detected in serum at the peak (24 h post-injection) of treated mice were below the range induced by the maximum tolerated dose (500 ng/kg) in humans who were administered rpIL-12 systemically (6000–20,000 pg/ml) [52,53].
Even though hydrodynamic shear is still not developed for human use, recent publications demonstrate that some laboratories have achieved great advances in alternative ways to adjust this methodology for clinical utilization [54–56]. Encouragingly, two clinical studies were performed in young adults with muscular dystrophy with no significant side effects or major pain being reported [57,58].
Moreover, hydrodynamic injection represents a powerful experimental tool to study systemic IL-12 expression in mice. The aim and the strength of this manuscript is to show that systemic expression of IL-12 might still be possible as a cancer therapeutic approach when protocols that regulate and control its expression are developed. For instance, we have previously demonstrated that systemic expression of both IL-12 and IL18 could be lethal after recombinant protein administration [7,50] but is highly tolerated when cDNA is used, even at higher serum levels of the cytokines than those induced by recombinant proteins [8,20]. Therefore our data demonstrate that IL-12-related adverse effects are not purely dependent on the cytokine itself, because the administration strategies selected could lead to totally different outcomes.
One concern about the use of cDNA as a treatment is that foreign DNA in the cytosol of cells could activate DNA sensors and trigger an immune response [59]. In our study and as mentioned above, the control group injected with the empty vector expressed very low levels of IL-12, TNF-α and IFN-γ [5,8] which were due to the hydrodynamic procedure rather than being induced by the cDNA itself. Moreover, the percentages of different leukocyte subsets in the spleen were similar throughout the days post-cDNA injection up to day 50 in the control mice [5]. Additionally, we have previously evaluated ALT and AST levels and performed histopathological examination of livers and a complete organ examination, and found no pathological effects (only a minimal lymphoid hyperplasia in lymph nodes) in the control group [5,8]. Moreover, we have unpublished data showing that type I interferons (as suggested by Semenova et al. [59]) were not induced in the control group injected with the empty plasmid, demonstrating that in our model the plasmids we used seem not to activate DNA sensors and that the immune effects we observed are due to the systemic expression of the cytokines. Furthermore, given that the plasmids were obtained from bacteria, we also checked for possible lipopolysaccharide contamination even when we used an endo-free kit for the DNA extraction. In that study we demonstrated that the biological effects observed in wild-type or Tlr4 knockout mice are similar [8], thus ruling out lipopolysaccharide contamination of the plasmids.
Tumor-specific immune responses are the focal point of immunotherapy; however, the vasculature structures of tumors can define their developmental status. Importantly, IL-12 overexpression in B16 tumors has been shown to regulate the tumor vasculature, either by facilitating leukocyte recruitment through the upregulation of adhesion molecules or by inhibiting angiogenesis via IFN-γ [3,4]. In our work we show that after systemic expression of a single dose of 1 μg of IL-12 cDNA, both B16 and EL4 tumors show flattened growth curves that correlate with reduced tumor size at 7 days post-treatment. Moreover, for both types of tumors, the number of blood vessels as evaluated by PECAM staining was significantly diminished. This is likely due to high expression of IFN-γ+ by CD8+ T and NK cells infiltrating the tumors, although proof that this effect is an IFN-γ-dependent mechanism requires further studies.
By evaluating leukocyte traffic/distribution, as part of the systemic effects of IL-12, we were able to show by both supervised and unsupervised flow cytometry analysis that particular changes occur in different SLOs from distal to proximal tumor sites. So far, we have described the appearance or disappearance of different populations of leukocytes in SLOs and tumors after IL-12 treatment and also between dLNs and ndLNs. Such analysis, to our knowledge, has not previously been performed to evaluate the systemic effects of IL-12. Even though we have not analyzed the significance of changes of leukocyte populations in SLOs, we are interested in understanding the reasons for the differential cell distributions in different SLOs after systemic IL-12 cDNA treatment. Investigation of the basis for such an effect is currently underway in our laboratory and will form part of a future publication.
Our data also demonstrate that systemic expression of IL-12 cDNA induced substantial benefits in the tumor microenvironment of B16- and EL4-bearing mice that comprised enrichment of CD8+ T cells and high IFN-γ production along with a reduction (in the B16 model) in cell types with regulatory/inhibitory properties. Moreover, inside B16 tumors, CD8+ T cells are higher IFN-γ producers than NK cells, contrary to what has been reported by other groups after systemic or local IL-12 administration [2,55].
The potent antitumor activity exerted by IL-12 makes it an ideal candidate for cancer treatment, especially in the worse scenarios at the latest stages of the disease. In this context, current efforts focused on finding new strategies for systemic administration of IL-12 which can reach inaccessible locations are needed in order to bring IL-12 back to clinical relevance. The purpose of this paper is to demonstrate that under the right conditions, IL-12 can be utilized as an effective treatment for cancer, despite the fact that it is currently being largely ignored due to systemic toxicity. We hope that our studies could interest translational and clinical scientists in designing trials that will take advantage of the use of low-dose IL-12 cDNA.
Conclusion
The greatest contribution of this manuscript is the demonstration that IL-12, a cytokine long discarded as a systemic treatment against cancer, can be re-evaluated as cancer therapy as long as the necessary strategies are designed for its safe and effective use in cancer patients.
Future perspective
More than 2 decades ago, when the hydrodynamic administration of cDNAs emerged, it was not possible to visualize the great advances that were happening with the improvement of this therapeutic strategy. If we combine this approach with the creative and ingenious methodologies that continue to appear in the use of the systemic expression of IL-12 in the treatment against different types of cancer, the expectation of achieving an effective treatment in advanced cancer patients in the coming years in very encouraging.
Summary points.
A single injection of 1 μg of IL-12 cDNA delivered by hydrodynamic shear is sufficient to generate safe systemic levels of the cytokine with strong antitumor activity in B16 and EL4 murine tumor models.
A profound evaluation of the effects of systemic IL-12 in secondary lymphoid organs and tumors, as analyzed by supervised and unsupervised flow cytometry methods, is provided.
IL-12 systemic expression induced a significant reduction in the size and growth curves of subcutaneous B16 and EL4 tumor cells.
A reduction in the number of blood vessels in B16 and EL4 tumors correlated with antiangiogenic effects.
A large number of IFN-γ+CD8+ T cells was observed in B16 and EL4 tumors after systemic expression of IL-12 cDNA.
Systemic expression of 1 μg of IL-12 cDNA induced a beneficial balance between effector and regulatory immune cell populations inside B16 tumors.
Lower levels of TGF-β correlated with highly proliferative CD8+ T cells in B16 tumors.
Our work demonstrates that safe levels of systemic IL-12 induced beneficial changes in the tumor microenvironment with no notable side effects, thus allowing a re-evaluation of the potential clinical use of this powerful cytokine.
Supplementary Material
Footnotes
Supplementary data
To view the supplementary data that accompany this paper please visit the journal website at: www.futuremedicine.com/doi/suppl/10.2217/imt-2021-0080
Financial & competing interests disclosure
This project has been funded in whole or in part with Federal funds directly from the intramural research programs of the National Cancer Institute, CCR, LCIM under Contract no. HHSN261200800001E. Fundación para el Progreso de la Medicina GC N°1, Secretaria de Ciencia y Tecnología de la UNC (SeCyT-UNC). This project has been funded in part with federal funds from the Intramural Research Program of the Center for Cancer Research, National Cancer Institute (NCI): ZIA BC 009283. The authors have no other relevant affiliations or financial involvement with any organization or entity with a financial interest in or financial conflict with the subject matter or materials discussed in the manuscript apart from those disclosed.
No writing assistance was utilized in the production of this manuscript.
Disclaimer
The content of this publication does not necessarily reflect the views or policies of the Department of Health and Human Services, nor does mention of trade names, commercial products or organizations imply endorsement by the US Government.
Ethical conduct of research
Animal care was provided in accordance with the procedures outlined in the Guide for the Care and Use of Laboratory Animals (NIH publication no. 86-23, 1985). The experimental protocols were approved by the Institutional Animal Care and Use Committee of Centro de Investigaciones en Bioquímica Clínica e Inmunología, Consejo Nacional de Investigaciones Científicas y Técnicas. Our animal facility has obtained NIH animal welfare assurance (assurance no. A5802-01, Office of Laboratory Animal Welfare, NIH, Bethesda, MD, USA).
References
- 1.Lasek W, Zagożdżon R, Jakobisiak M. Interleukin 12: still a promising candidate for tumor immunotherapy? Cancer Immunol. Immunother. 63(5), 419–435 (2014). [DOI] [PMC free article] [PubMed] [Google Scholar]
- 2.Tugues S, Burkhard SH, Ohs I et al. New insights into IL-12-mediated tumor suppression. Cell Death Differ. 22(2), 237–246 (2015). [DOI] [PMC free article] [PubMed] [Google Scholar]
- 3.Gerber SA, Moran JP, Frelinger JG, Frelinger JA, Fenton BM, Lord EM. Mechanism of IL-12 mediated alterations in tumour blood vessel morphology: analysis using whole-tissue mounts. Br. J. Cancer 88(9), 1453–1461 (2003). [DOI] [PMC free article] [PubMed] [Google Scholar]
- 4.Sorensen EW, Gerber SA, Frelinger JG, Lord EM. IL-12 suppresses vascular endothelial growth factor receptor 3 expression on tumor vessels by two distinct IFN-gamma-dependent mechanisms. J. Immunol. 184(4), 1858–1866 (2010). [DOI] [PMC free article] [PubMed] [Google Scholar]
- 5.Rodriguez-Galan MC, Reynolds D, Correa SG, Iribarren P, Watanabe M, Young HA. Coexpression of IL-18 strongly attenuates IL-12-induced systemic toxicity through a rapid induction of IL-10 without affecting its antitumor capacity. J. Immunol. 183(1), 740–748 (2009). [DOI] [PMC free article] [PubMed] [Google Scholar]
- 6.Mazzolini G, Prieto J, Melero I. Gene therapy of cancer with interleukin-12. Curr. Pharm. Des. 9(24), 1981–1991 (2003). [DOI] [PubMed] [Google Scholar]
- 7.Nakamura S, Otani T, Ijiri Y, Motoda R, Kurimoto M, Orita K. IFN-gamma-dependent and -independent mechanisms in adverse effects caused by concomitant administration of IL-18 and IL-12. J. Immunol. 164(6), 3330–3336 (2000). [DOI] [PubMed] [Google Scholar]
- 8.Barrios B, Baez NS, Reynolds D et al. Abrogation of TNFalpha production during cancer immunotherapy is crucial for suppressing side effects due to the systemic expression of IL-12. PLoS ONE 9(2), e90116 (2014). [DOI] [PMC free article] [PubMed] [Google Scholar]
- 9.Al-Salama ZT. PF-06438179/GP1111: an infliximab biosimilar. BioDrugs 32(6), 639–642 (2018). [DOI] [PMC free article] [PubMed] [Google Scholar]
- 10.Al-Salama ZT. FKB327: an adalimumab biosimilar. BioDrugs 33(1), 113–116 (2019). [DOI] [PubMed] [Google Scholar]
- 11.Anwer K, Barnes MN, Fewell J, Lewis DH, Alvarez RD. Phase-I clinical trial of IL-12 plasmid/lipopolymer complexes for the treatment of recurrent ovarian cancer. Gene Ther. 17(3), 360–369 (2010). [DOI] [PubMed] [Google Scholar]
- 12.Lenzi R, Edwards R, June C et al. Phase II study of intraperitoneal recombinant interleukin-12 (rhIL-12) in patients with peritoneal carcinomatosis (residual disease <1 cm) associated with ovarian cancer or primary peritoneal carcinoma. J. Transl. Med. 5, 66 (2007). [DOI] [PMC free article] [PubMed] [Google Scholar]
- 13.Daud AI, DeConti RC, Andrews S et al. Phase I trial of interleukin-12 plasmid electroporation in patients with metastatic melanoma. J. Clin. Oncol. 26(36), 5896–5903 (2008). [DOI] [PMC free article] [PubMed] [Google Scholar]
- 14.Little RF, Pluda JM, Wyvill KM et al. Activity of subcutaneous interleukin-12 in AIDS-related Kaposi sarcoma. Blood 107(12), 4650–4657 (2006). [DOI] [PMC free article] [PubMed] [Google Scholar]
- 15.Rook AH, Wood GS, Yoo EK et al. Interleukin-12 therapy of cutaneous T-cell lymphoma induces lesion regression and cytotoxic T-cell responses. Blood 94(3), 902–908 (1999). [PubMed] [Google Scholar]
- 16.Younes A, Pro B, Robertson MJ et al. Phase II clinical trial of interleukin-12 in patients with relapsed and refractory non-Hodgkin’s lymphoma and Hodgkin’s disease. Clin. Cancer Res. 10(16), 5432–5438 (2004). [DOI] [PubMed] [Google Scholar]
- 17.Doroshow DB, Bhalla S, Beasley MB et al. PD-L1 as a biomarker of response to immune-checkpoint inhibitors. Nat. Rev. Clin. Oncol. 18(6), 345–362 (2021). [DOI] [PubMed] [Google Scholar]
- 18.Baez NS, Cerban F, Savid-Frontera C et al. Thymic expression of IL-4 and IL-15 after systemic inflammatory or infectious Th1 disease processes induce the acquisition of ‘innate’ characteristics during CD8+ T cell development. PLoS Pathog. 15(1), e1007456 (2019). [DOI] [PMC free article] [PubMed] [Google Scholar]
- 19.Hodge DL, Reynolds D, Cerban FM et al. MCP-1/CCR2 interactions direct migration of peripheral B and T lymphocytes to the thymus during acute infectious/inflammatory processes. Eur. J. Immunol. 42(10), 2644–2654 (2012). [DOI] [PMC free article] [PubMed] [Google Scholar]
- 20.Rodriguez-Galan MC, Bream JH, Farr A, Young HA. Synergistic effect of IL-2, IL-12, and IL-18 on thymocyte apoptosis and Th1/Th2 cytokine expression. J. Immunol. 174(5), 2796–2804 (2005). [DOI] [PubMed] [Google Scholar]
- 21.Pyz E, Naidenko O, Miyake S et al. The complementarity determining region 2 of BV8S2 (V beta 8.2) contributes to antigen recognition by rat invariant NKT cell TCR. J. Immunol. 176(12), 7447–7455 (2006). [DOI] [PubMed] [Google Scholar]
- 22.Müller K, Ehlers S, Solbach W, Laskay T. Novel multi-probe RNase protection assay (RPA) sets for the detection of murine chemokine gene expression. J. Immunol. Methods 249(1–2), 155–165 (2001). [DOI] [PubMed] [Google Scholar]
- 23.Lee Y, Kim SJ, Choo J et al. miR-23a-3p is a key regulator of IL-17C-induced tumor angiogenesis in colorectal cancer. Cells 9(6), 1363 (2020). [DOI] [PMC free article] [PubMed] [Google Scholar]
- 24.Li Y, Acharya G, Elahy M, Xin H, Khachigian LM. The anthelmintic flubendazole blocks human melanoma growth and metastasis and suppresses programmed cell death protein-1 and myeloid-derived suppressor cell accumulation. Cancer Lett. 459, 268–276 (2019). [DOI] [PubMed] [Google Scholar]
- 25.Li T, Kang G, Wang T, Huang H. Tumor angiogenesis and anti-angiogenic gene therapy for cancer. Oncol. Lett. 16(1), 687–702 (2018). [DOI] [PMC free article] [PubMed] [Google Scholar]
- 26.Chen H, Huang H, Paul WE. NK1.1+ CD4+ T cells lose NK1.1 expression upon in vitro activation. J. Immunol. 158(11), 5112–5119 (1997). [PubMed] [Google Scholar]
- 27.Habu Y, Uchida T, Inui T, Nakashima H, Fukasawa M, Seki S. Enhancement of the synthetic ligand-mediated function of liver NK1.1Ag+ T cells in mice by interleukin-12 pretreatment. Immunology 113(1), 35–43 (2004). [DOI] [PMC free article] [PubMed] [Google Scholar]
- 28.Wilson MT, Johansson C, Olivares-Villagómez D et al. The response of natural killer T cells to glycolipid antigens is characterized by surface receptor down-modulation and expansion. Proc. Natl Acad. Sci. USA 100(19), 10913–10918 (2003). [DOI] [PMC free article] [PubMed] [Google Scholar]
- 29.Bos R, Sherman LA. CD4+ T-cell help in the tumor milieu is required for recruitment and cytolytic function of CD8+ T lymphocytes. Cancer Res. 70(21), 8368–8377 (2010). [DOI] [PMC free article] [PubMed] [Google Scholar]
- 30.Jöhrer K, Pleyer L, Olivier A, Maizner E, Zelle-Rieser C, Greil R. Tumour–immune cell interactions modulated by chemokines. Expert Opin. Biol. Ther. 8(3), 269–290 (2008). [DOI] [PubMed] [Google Scholar]
- 31.Graefe C, Eichhorn L, Wurst P et al. Optimized Ki-67 staining in murine cells: a tool to determine cell proliferation. Mol. Biol. Rep. 46(4), 4631–4643 (2019). [DOI] [PubMed] [Google Scholar]
- 32.Gao J, Ye J, Ying Y, Lin H, Luo Z. Negative regulation of TGF-β by AMPK and implications in the treatment of associated disorders. Acta Biochim. Biophys. Sin. (Shanghai) 50(6), 523–531 (2018). [DOI] [PubMed] [Google Scholar]
- 33.Morikawa M, Derynck R, Miyazono K. TGF-β and the TGF-β family: context-dependent roles in cell and tissue physiology. Cold Spring Harb. Perspect. Biol. 8(5), a021873 (2016). [DOI] [PMC free article] [PubMed] [Google Scholar]
- 34.Airoldi I, Di Carlo E, Cocco C et al. Lack of Il12rb2 signaling predisposes to spontaneous autoimmunity and malignancy. Blood 106(12), 3846–3853 (2005). [DOI] [PubMed] [Google Scholar]
- 35.Zhao B, Meng LQ, Huang HN, Pan Y, Xu QQ. A novel functional polymorphism, 16974 A/C, in the interleukin-12-3′ untranslated region is associated with risk of glioma. DNA Cell Biol. 28(7), 335–341 (2009). [DOI] [PubMed] [Google Scholar]
- 36.Akiyama Y, Maruyama K, Watanabe M, Yamaguchi K. Retroviral-mediated IL-12 gene transduction into human CD34+ cell-derived dendritic cells. Int. J. Oncol. 21(3), 509–514 (2002). [PubMed] [Google Scholar]
- 37.Robertson MJ, Cameron C, Atkins MB et al. Immunological effects of interleukin 12 administered by bolus intravenous injection to patients with cancer. Clin. Cancer Res. 5(1), 9–16 (1999). [PubMed] [Google Scholar]
- 38.Robertson MJ, Pelloso D, Abonour R et al. Interleukin 12 immunotherapy after autologous stem cell transplantation for hematological malignancies. Clin. Cancer Res. 8(11), 3383–3393 (2002). [PubMed] [Google Scholar]
- 39.Mansurov A, Ishihara J, Hosseinchi P et al. Collagen-binding IL-12 enhances tumour inflammation and drives the complete remission of established immunologically cold mouse tumours. Nat. Biomed. Eng. 4(5), 531–543 (2020). [DOI] [PMC free article] [PubMed] [Google Scholar]
- 40.Chen PY, Hsieh HY, Huang CY, Lin CY, Wei KC, Liu HL. Focused ultrasound-induced blood–brain barrier opening to enhance interleukin-12 delivery for brain tumor immunotherapy: a preclinical feasibility study. J. Transl. Med. 13, 93 (2015). [DOI] [PMC free article] [PubMed] [Google Scholar]
- 41.Zhang YL, Lü R, Chang ZS et al. Clostridium sporogenes delivers interleukin-12 to hypoxic tumours, producing antitumour activity without significant toxicity. Lett. Appl. Microbiol. 59(6), 580–586 (2014). [DOI] [PubMed] [Google Scholar]
- 42.Tevz G, Kranjc S, Cemazar M et al. Controlled systemic release of interleukin-12 after gene electrotransfer to muscle for cancer gene therapy alone or in combination with ionizing radiation in murine sarcomas. J. Gene Med. 11(12), 1125–1137 (2009). [DOI] [PubMed] [Google Scholar]
- 43.Charoensit P, Kawakami S, Higuchi Y, Yamashita F, Hashida M. Enhanced growth inhibition of metastatic lung tumors by intravenous injection of ATRA–cationic liposome/IL-12 pDNA complexes in mice. Cancer Gene Ther. 17(7), 512–522 (2010). [DOI] [PubMed] [Google Scholar]
- 44.Gasparri AM, Sacchi A, Basso V et al. Boosting interleukin-12 antitumor activity and synergism with immunotherapy by targeted delivery with isoDGR-tagged nanogold. Small 15(45), e1903462 (2019). [DOI] [PubMed] [Google Scholar]
- 45.Ji Y, Liu X, Huang M et al. Development of self-assembled multi-arm polyrotaxanes nanocarriers for systemic plasmid delivery in vivo. Biomaterials 192, 416–428 (2019). [DOI] [PMC free article] [PubMed] [Google Scholar]
- 46.Thaker PH, Brady WE, Lankes HA et al. A Phase I trial of intraperitoneal GEN-1, an IL-12 plasmid formulated with PEG-PEI-cholesterol lipopolymer, administered with PEGylated liposomal doxorubicin in patients with recurrent or persistent epithelial ovarian, fallopian tube or primary peritoneal cancers: an NRG Oncology/Gynecologic Oncology Group study. Gynecol. Oncol. 147(2), 283–290 (2017). [DOI] [PMC free article] [PubMed] [Google Scholar]
- 47.Wang P, Li X, Wang J et al. Re-designing interleukin-12 to enhance its safety and potential as an anti-tumor immunotherapeutic agent. Nat. Commun. 8(1), 1395 (2017). [DOI] [PMC free article] [PubMed] [Google Scholar]
- 48.Zhu S, Lee DA, Li S. IL-12 and IL-27 sequential gene therapy via intramuscular electroporation delivery for eliminating distal aggressive tumors. J. Immunol. 184(5), 2348–2354 (2010). [DOI] [PMC free article] [PubMed] [Google Scholar]
- 49.Portielje JE, Lamers CH, Kruit WH et al. Repeated administrations of interleukin (IL)-12 are associated with persistently elevated plasma levels of IL-10 and declining IFN-gamma, tumor necrosis factor-alpha, IL-6, and IL-8 responses. Clin. Cancer Res. 9(1), 76–83 (2003). [PubMed] [Google Scholar]
- 50.Carson WE, Dierksheide JE, Jabbour S et al. Coadministration of interleukin-18 and interleukin-12 induces a fatal inflammatory response in mice: critical role of natural killer cell interferon-gamma production and STAT-mediated signal transduction. Blood 96(4), 1465–1473 (2000). [PubMed] [Google Scholar]
- 51.Meyaard L, Hovenkamp E, Otto SA, Miedema F. IL-12-induced IL-10 production by human T cells as a negative feedback for IL-12-induced immune responses. J. Immunol. 156(8), 2776–2782 (1996). [PubMed] [Google Scholar]
- 52.Atkins MB, Robertson MJ, Gordon M et al. Phase I evaluation of intravenous recombinant human interleukin 12 in patients with advanced malignancies. Clin. Cancer Res. 3(3), 409–417 (1997). [PubMed] [Google Scholar]
- 53.Leonard JP, Sherman ML, Fisher GL et al. Effects of single-dose interleukin-12 exposure on interleukin-12-associated toxicity and interferon-gamma production. Blood 90(7), 2541–2548 (1997). [PubMed] [Google Scholar]
- 54.Kumbhari V, Li L, Piontek K et al. Successful liver-directed gene delivery by ERCP-guided hydrodynamic injection (with videos). Gastrointest. Endosc. 88(4), 755–763.e5 (2018). [DOI] [PMC free article] [PubMed] [Google Scholar]
- 55.Le Guen YT, Le Gall T, Midoux P, Guégan P, Braun S, Montier T. Gene transfer to skeletal muscle using hydrodynamic limb vein injection: current applications, hurdles and possible optimizations. J. Gene Med. 22(2), e3150 (2020). [DOI] [PubMed] [Google Scholar]
- 56.Sendra L, Herrero MJ, Aliño SF. Translational advances of hydrofection by hydrodynamic injection. Genes (Basel) 9(3), 136 (2018). [DOI] [PMC free article] [PubMed] [Google Scholar]
- 57.Fan Z, Kocis K, Valley R et al. Safety and feasibility of high-pressure transvenous limb perfusion with 0.9% saline in human muscular dystrophy. Mol. Ther. 20(2), 456–461 (2012). [DOI] [PMC free article] [PubMed] [Google Scholar]
- 58.Fan Z, Kocis K, Valley R et al. High-Pressure transvenous perfusion of the upper extremity in human muscular dystrophy: a safety study with 0.9% saline. Hum. Gene Ther. 26(9), 614–621 (2015). [DOI] [PMC free article] [PubMed] [Google Scholar]
- 59.Semenova N, Bosnjak M, Markelc B, Znidar K, Cemazar M, Heller L. Multiple cytosolic DNA sensors bind plasmid DNA after transfection. Nucleic Acids Res. 47(19), 10235–10246 (2019). [DOI] [PMC free article] [PubMed] [Google Scholar]
Associated Data
This section collects any data citations, data availability statements, or supplementary materials included in this article.