

Abstract
Background
Persistent cognitive symptoms have been reported following COVID-19 hospitalization. We investigated the relationship between demographics, social determinants of health (SDOH) and cognitive outcomes 6-months after hospitalization for COVID-19.
Methods
We analyzed 6-month follow-up data collected from a multi-center, prospective study of hospitalized COVID-19 patients. Demographic and SDOH variables (age, race/ethnicity, education, employment, health insurance status, median income, primary language, living arrangements, and pre-COVID disability) were compared between patients with normal versus abnormal telephone Montreal Cognitive Assessments (t-MOCA; scores<18/22). Multivariable logistic regression models were constructed to evaluate predictors of t-MoCA.
Results
Of 382 patients available for 6-month follow-up, 215 (56%) completed the t-MoCA (n = 109/215 [51%] had normal and n = 106/215 [49%] abnormal results). 14/215 (7%) patients had a prior history of dementia/cognitive impairment. Significant univariate predictors of abnormal t-MoCA included older age, ≤12 years of education, unemployment pre-COVID, Black race, and a pre-COVID history of cognitive impairment (all p < 0.05). In multivariable analyses, education ≤12 years (adjusted OR 5.21, 95%CI 2.25–12.09), Black race (aOR 5.54, 95%CI 2.25–13.66), and the interaction of baseline functional status and unemployment prior to hospitalization (aOR 3.98, 95%CI 1.23–12.92) were significantly associated with abnormal t-MoCA scores after adjusting for age, history of dementia, language, neurological complications, income and discharge disposition.
Conclusions
Fewer years of education, Black race and unemployment with baseline disability were associated with abnormal t-MoCA scores 6-months post-hospitalization for COVID-19. These associations may be due to undiagnosed baseline cognitive dysfunction, implicit biases of the t-MoCA, other unmeasured SDOH or biological effects of SARS-CoV-2.
Keywords: Cognitive, Cognition, Memory, Brain fog, MOCA, COVID-19, Long-hauler, Long-COVID, SARS-CoV-2, Post-acute sequelae of COVID
1. Introducion
Cognitive dysfunction following COVID-19 infection has been described in both the acute and post-acute phases of illness [[1], [2], [3], [4], [5], [6], [7], [8], [9], [10], [11], [12], [13], [14], [15], [16]], and constitutes an important component of the Post-Acute Sequelae of SARS-CoV-2 Infection (PASC) syndrome. Several potential mechanisms related to secondary effects of SARS-CoV-2 infection may contribute to cognitive impairment, such as hypoxia, hyperinflammation, hypercoagulability, blood brain barrier disruption, uremia, septic encephalopathy or autoimmune mechanisms [17]. Beyond these biological effects, extensive literature also suggests a role for sociodemographic factors—including race, ethnicity, education, healthcare access and economic environment—in modulating cognitive outcomes and recovery following hospitalization [[18], [19], [20], [21]]. Additionally, pandemic-related lockdowns, school closures and economic stressors appear to contribute to both mental health and cognitive sequelae [22,23]. In the context of COVID-19, racial/ethnic disparities and other social determinants of health (SDOH) have been linked to higher rates of SARS-CoV-2 infection, severity of illness and mortality rates [[24], [25], [26]]. However, the role that SDOH may play in the development of PASC-related cognitive dysfunction has not been addressed.
In this study, we evaluated the relationship between demographics, SDOH and cognitive outcomes 6-months after index COVID-19 hospitalization. We further characterized the subdomains of cognitive dysfunction within this patient cohort. We hypothesized that racial/ethnic minority groups, patients with less access to the health care system, and those with lower education levels would have higher rates of cognitive deficits following severe COVID-19.
2. Methods
2.1. Study design
We conducted a retrospective analysis of COVID-19 patients who were prospectively enrolled in the Study of Neurologic and Psychiatric Events in Acute COVID-19 (SNaP Acute COVID) [27] and who underwent follow-up interviews 6-months post-hospitalization [27].
2.2. Participants
Consecutive COVID-19 patients hospitalized in the New York City metropolitan area between March 10, 2020 and May 20, 2020 were prospectively screened for new neurological events by a team of neurologists [16,27]. We then conducted 6-month telephone follow-up interviews in patient populations with and without new neurological events during hospitalization. Patients underwent batteries which included cognitive, functional and neuropsychiatric assessments.
2.3. Inclusion and exclusion criteria
Inclusion criteria were: age ≥ 18 years, hospital admission for COVID-19 illness, reverse-transcriptase-polymerase-chain-reaction (RT-PCR) positive SARS-CoV-2 infection from nasopharyngeal sampling, and consent to participate in a follow-up interview. Exclusion criteria were: negative or missing SARS-CoV-2 RT-PCR test, in-hospital death outpatient or emergency department encounter only or inability to complete the t-MOCA assessment. Detailed screening and data acquisition protocols have been reported previously [16,27]. Patients were characterized as having a new neurological complication during hospitalization following acute SARS-CoV-2 infection (excluding recrudescence of prior neurological symptoms) based on evaluation of a board-certified neurologist. Neurological diagnoses – including toxic-metabolic encephalopathy, hypoxic-ischemic encephalopathy, stroke (ischemic or hemorrhagic), seizure, neuropathy, myopathy, movement disorder, encephalitis/meningitis, myelopathy, myelitis—followed established criteria [[28], [29], [30], [31], [32], [33], [34], [35], [36], [37]].
Telephone interviews were conducted to obtain longitudinal 6-month follow-up assessments, as previously described [16]. Contact was attempted at 6-months (±1 month) from COVID-19 diagnosis. Three attempts at contact were required before patients/surrogates were coded as “unreachable”.
2.4. Data collection
Demographic variables included: age, sex, race, ethnicity and zip code. SDOH variables included: health insurance status, median income, education level, non-fluency in English, employment status, living arrangements, disability status (as measured by the mRS) and marital status. Demographics, past medical history, hospital course, and discharge disposition were collected through review of medical records. Race, ethnicity, education, employment, primary language and non-fluency in the dominant language of the region, marital status and living arrangements (alone, with family, nursing home, rehabilitation center or other institution) were reported by the patient or their surrogate. A past history of dementia was coded for patients with pre-existing diagnoses of mild cognitive impairment, Alzheimer's type dementia, vascular dementia, Lewy body/Parkinson's related dementia, progressive supranuclear palsy, multiple system atrophy, corticobasal degeneration, frontal-temporal dementia, normal pressure hydrocephalus or Creutzfeld-Jakob disease. Pre-morbid baseline modified Rankin scale scores (mRS scores [38]) were collected based on patient/surrogate report at the 6-month interview [16]. Pre-COVID-19 employment status was categorized as: retired, part-time employment, full-time employment, not employed, student or other. Unemployment pre-COVID was coded only for subjects who described themselves as “not employed”, excluding retired subjects and students. Median income was determined by zip code and obtained from online databases for New York City [39,40] and Nassau counties [41].
2.5. Study outcomes
We administered the Telephone/Blind Montreal Cognitive Assessment [42] (t-MoCA: 22 = perfect score; <18 = cutoff for cognitive impairment) in the primary language for each patient using standardized forms (English, Spanish, Chinese, and Russian). Interviews were conducted over the phone by trained physicians and medical students who were native speakers or trained translators of the patient's primary language. Patients were required to complete all components of the t-MoCA for scoring, and incomplete assessments or surrogate responses were excluded from analyses. Patients were required to complete the t-MoCA by themselves without surrogate assistance.
The t-MoCA consists of 22 items divided into the domains of attention (6 points, 3 items: digits forwards and backwards, identifying a target in a series, and serial subtraction), language (2 points, 1 item: sentence repetition), memory (5 points, 3-trial recall of 5 items with short-term uncued delayed recall), executive function (3 points, 2 items: verbal abstraction, categorical verbal fluency) and orientation (6 points, assessment of orientation to time and place) [43]. The score is total points earned plus an additional point given for those with ≤12 years of education [44]. Anxiety and depression symptoms were measured to assess for confounding of cognitive outcomes due to psychiatric comorbidities with the Quality of Life in Neurological Disorders [45] (Neuro-QoL) short form self-reported health measures of depression and anxiety. Neuro-QoL raw scores were converted into T-scores with a mean of 50 and standard deviation of 10 in a reference population (U.S. general population or clinical sample); T-scores ≥60 were considered abnormal (mean + 1SD). Higher T-scores indicate worse self-reported depression or anxiety.
2.6. Standard protocol approvals and patient consents
This study was approved by the NYU Grossman School of Medicine Institutional Review Board. All patients or their surrogates provided consent for participation.
2.7. Statistical analyses
Impaired t-MoCA scores were defined as <18 points based on published criteria [42]. Patients were grouped as with or without t-MoCA impairment and compared according to demographic variables, SDoH, premorbid medical comorbidities, clinical data, peri-COVID neurological complications, medical complications, medications administered during hospitalization, and in-hospital outcomes using the Mann-Whitney U test for non-normally distributed continuous variables and Chi-squared or Fisher's exact test, as appropriate, for categorical values. Multivariable, backward, step-wise logistic regression models were constructed to identify independent predictors of t-MoCA impairment 6-months post hospitalization utilizing univariate variables associated with p values<0.100. Patients with a baseline history of dementia or cognitive abnormality were excluded from multivariable analysis. All interactions were tested.
Domains of cognitive dysfunction were compared between patients with and without neurological complications during index hospitalization and among subgroups with significantly higher rates of t-MoCA impairment using Mann-Whitney U tests.
Correlation of t-MoCA scores and NeuroQoL depression and anxiety scores was assessed using Spearman's correlation coefficients. Statistical significance was set at P < 0.05. All analyses were conducted using IBM SPSS Statistics for Mac version 25 (IBM Corp., Armonk, NY).
3. Results
Of 382 patients/surrogates who consented to 6-month follow-up, 215 (56%) completed the t-MOCA (Fig. 1 ). Nearly half of the sample had t-MoCA scores <18 (106/215 or 49% impaired, vs 109/215 or 51% not impaired). Impairment in t-MoCA scores was significantly associated with older age, Black race, ≤12 years of education, worse baseline mRS scores, unemployment prior to hospitalization, and a history of cognitive impairment (all P < 0.05, Table 1 ). There was a trend toward higher rates of t-MoCA impairment among lower income and non-English speaking patients. There were no differences in NeuroQoL anxiety or depression scores at 6-months between those with or without abnormal t-MoCA scores.
Fig. 1.
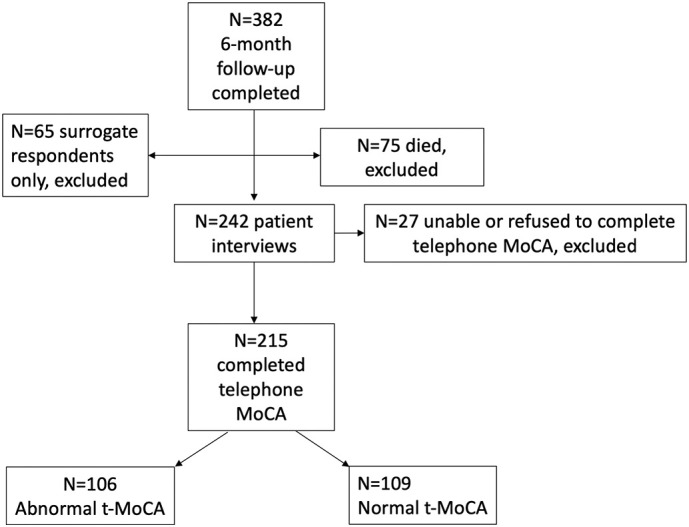
Flow diagram of inclusion and exclusion for 6-month telephone Montreal Cognitive Assessment (MoCA) testing.
Table 1.
Demographic and clinical factors associated with telephone MoCA scores 6-months after COVID-19 hospitalization.
| Characteristic | Normal t-MoCA (N = 109) | Abnormal t-MoCA (N = 106) | P |
|---|---|---|---|
| Demographics and Social Determinants | |||
| Median Age (IQR)-yr | 62 (51–69) | 68 (57–77) | 0.004 |
| Male sex-no./total no. (%) | 72/109 (66%) | 67/106 (63%) | 0.662 |
| Body Mass Index-median (IQR) | 27 (23−33) | 27 (25–33) | 0.457 |
| Years of education (≤12 years) | 14/109 (13%) | 30/106 (28%) | 0.005 |
| Unemployed prior to COVID hospitalization | 7/109 (6%) | 17/106 (16%) | 0.025 |
| Median household income by zip code (IQR) | $75,009 ($58,603–$99,193) | $70,089 ($53,669–$87,892) | 0.078 |
| Health Insurance Status | |||
| Uninsured vs other | 4/109 (4%) | 2/106 (2%) | 0.427 |
| Uninsured or Medicaid vs other | 8/109 (7%) | 9/106 (9%) | 0.754 |
| Commercial Insurance vs other | 67/109 (62%) | 63/106 (59%) | 0.760 |
| Government insurance (Medicare or Medicaid) vs. other | 38/109 (35%) | 40/106 (38%) | 0.661 |
| Not fluent in English | 22/109 (20%) | 32/106 (30%) | 0.091 |
| Married (vs unmarried) | 74/108 (69%) | 65/106 (61%) | 0.270 |
| Lives alone | 19/108 (18%) | 19/100 (19%) | 0.793 |
| Race- no./total no. (%) | 0.014 | ||
| White | 64/109 (59%) | 45/106 (43%) | |
| Black | 8/109 (7%) | 26/106 (25%) | |
| Asian | 12/109 (11%) | 8/106 (8%) | |
| Native Hawaiian/Pacific Islander | 1/109 (1%) | 0 | |
| American Indian | 1/109 (1%) | 0 | |
| Other | 23/109 (20%) | 27/106 (25%) | |
| Ethnicity- no./total no. (%) | 0.372 | ||
| Latinx | 27/108 (25%) | 32/105 (31%) | |
| Non-Latinx | 81/108 (75%) | 73/105 (70%) | |
| Past Medical History Prior to COVID- no./total no. (%) | |||
| Dementia | 3/109 (3%) | 11/106 (10%) | 0.023 |
| Psychiatric Illness | 10/108 (9%) | 9/106 (9%) | 0.843 |
| Stroke (ischemic or hemorrhagic) | 9/109 (8%) | 11/106 (10%) | 0.593 |
| Seizure | 7/109 (6%) | 8/106 (8%) | 0.746 |
| Movement Disorder | 1/109 (1%) | 0 | 0.323 |
| Multiple sclerosis/demyelinating disease | 2/109 (2%) | 0 | 0.161 |
| Chronic kidney disease | 10/109 (9%) | 14/106 (13%) | 0.348 |
| Hypertension | 47/109 (43%) | 38/106 (36%) | 0.276 |
| Diabetes | 26/109 (24%) | 29/106 (27%) | 0.556 |
| Coronary artery disease | 15/109 (14%) | 12/106 (11%) | 0.589 |
| COPD/Asthma | 11/109 (10%) | 11/106 (10%) | 0.945 |
| Atrial Fibrillation | 7/108 (7%) | 11/106 (10%) | 0.305 |
| Baseline modified Rankin scale score-median (range) | 0 (0) | 0 (0–1) | 0.024 |
| 6-month Depression Neuro-QoL T-scores scores-median (IQR) | 43 (37–48) | 45 (37–51) | 0.252 |
| Abnormal depression scores (T-score ≥ 60)- no./total no. (%) | 3/108 (3%) | 1/102 (1%) | |
| 6-month Anxiety Neuro-QoL T-scores scores-median (IQR) | 48 (42–54) | 48 (36–54) | 0.995 |
| Abnormal anxiety scores (T-score ≥ 60)no./total no. (%) | 46/108 (43%) | 48/103 (47%) | |
| Hospital Course | |||
| Date of Index COVID-19 Admission -median (IQR) | April 3, 2020 (Mar 26-Apr 9) | April 4, 2020 (Mar 27-Apr 12) |
0.759 |
| Intubation- no./total no. (%) | 41/109 (38%) | 33/106 (31%) | 0.317 |
| Worst SOFA score- median (IQR) | 4 (3–8) | 4 (3–7) | 0.663 |
| Lowest Oxygen saturation (%), median (IQR) | 86% (77–90%) | 88% (77–92%) | 0.277 |
| Lowest Mean Arterial Pressure (mmHg), median (IQR) | 64 (55–72) | 67 (53–74) | 0.335 |
| Acute renal failure- no./total no. (%) | 15/109 (24%) | 16/106 (15%) | 0.781 |
| Hypotension requiring vasopressors- no./total no. (%) | 33/109 (30%) | 27/106 (26%) | 0.432 |
| Neurological Disorders during Hospitalization | |||
| Any neurological event during index hospitalization | 63/109 (58%) | 51/106 (45%) | 0.155 |
| Toxic/Metabolic Encephalopathy- no./total no. (%) | 19/109 (17%) | 28/106 (26%) | 0.111 |
| Stroke (any type) - no./total no. (%) | 5/109 (5%) | 4/106 (4%) | 0.766 |
| Ischemic/TIA | 4/109 (4%) | 4/106 (4%) | 0.968 |
| Intracerebral/Intraventricular hemorrhage | 1/109 (1%) | 1/106 (1%) | 0.984 |
| Spontaneous Subarachnoid hemorrhage | 0 | 0 | – |
| Seizure (clinical or electrographic) - no./total no. (%) | 5/109 (5%) | 4/106 (4%) | 0.766 |
| Hypoxic/ischemic brain injury- no./total no. (%) | 9/109 (8%) | 10/106 (9%) | 0.761 |
| Movement Disorder- no./total no. (%) | 8/109 (7%) | 2/106 (2%) | 0.058 |
| Neuropathy- no./total no. (%) | 5/109 (5%) | 6/106 (6%) | 0.721 |
| Myopathy- no./total no. (%) | 5/109 (5%) | 2/106 (2%) | 0.265 |
| Guillain Barre Syndrome- no./total no. (%) | 1/109 (1%) | 1/106 (1%) | 0.984 |
| Encephalitis/meningitis- no./total no. (%) | 0 | 0 | – |
| Myelopathy/Myelitis- no./total no. (%) | 0 | 0 | – |
| Medications during Hospitalization | |||
| Corticosteroids- no./total no. (%) | 31/109 (28%) | 30/106 (28%) | 0.982 |
| Hydroxychloroquine- no./total no. (%) | 86/109 (79%) | 74/106 (70%) | 0.127 |
| Azithromycin- no./total no. (%) | 80/109 (73%) | 69/106 (65%) | 0.187 |
| Remdesivir- no./total no. (%) | 0 | 0 | – |
| Therapeutic anticoagulation- no./total no. (%) | 38/109 (35%) | 37/106 (35%) | 0.995 |
| Tocilizumab- no./total no. (%) | 0 | 0 | – |
| Inflammatory Markers at Hospital Admission | |||
| Admission IL-6 (pg/mL) - median (IQR) | 40 (15–73) | 25 (13–51) | 0.220 |
| Admission D-Dimer (ng/mL)- median (IQR) | 454 (254–685) | 431 (264–926) | 0.902 |
| Admission ferritin (ng/mL)- median (IQR) | 905 (329–1530) | 625 (252–1221) | 0.111 |
| Admission CRP (mg/L)- median (IQR) | 109 (35–183) | 128 (47–187) | 0.411 |
| Hospital Outcomes | |||
| Home- no./total no. (%) | 76/106 (72%) | 70/102 (69%) | 0.628 |
| Acute rehabilitation facility- no./total no. (%) | 16/106 (15%) | 8/104 (8%) | 0.092 |
| Nursing home - no./total no. (%) | 11/106 (10%) | 20/104 (19%) | 0.071 |
| LTAC- no./total no. (%) | 2/106 (2%) | 4/104 (4%) | 0.394 |
| Length of Stay- median (IQR) | 11 (5–31) | 8 (3−22) | 0.133 |
| Ventilator Days- median (IQR) | 11 (2−20) | 12 (7–27) | 0.180 |
Abnormal MoCA<18/22.
Comparing Black to non-Black patients, there were no significant differences in age, sex, health insurance status, rates of employment pre-COVID, baseline mRS score, education level, past medical history of diabetes, hypertension, COPD/asthma, chronic kidney disease, dementia, smoking, or coronary artery disease, severity of COVID-19 illness (SOFA scores or ventilator requirement) or discharge disposition. However, median household income was significantly lower in Black compared to non-Black patients ($65,112 [IQR $53,660–$75, 008] vs. $77,056 [IQR $54,646-93,488], P = 0.011). Rates of past psychiatric history were lower in Black than non-Black patients (0% vs. 12.5%, P = 0.035), however, NeuroQoL T-scores for self-reported depression and anxiety did not differ between Black patients versus patients of other races at 6-month follow-up.
Notably, we did not detect a relationship between cognitive outcomes and any hospital metric, including severity of illness as measured by ventilation status or Sequential Organ Failure Assessment (SOFA) scores [[46], [47], [48]], inpatient medications, medical or neurological complications or discharge disposition (Table 1). Though t-MoCA scores were significantly worse among patients with neurological complications during hospitalization (median scores of 17 [IQR 13–19] versus 18 [IQR 15–19], P = 0.036), the percentage of patients who scored in the impaired range (t-MoCA<18/22) did not differ between those with and without neurological complications (55% of patients with neurological events had abnormal 6-month t-MoCA versus 45% without neurological events, p = 0.155). There was no significant correlation between t-MoCA scores and NeuroQoL depression (Spearman's rho = −0.82, p = 0.240) or anxiety (Spearman's rho = −0.001, p = 0.988) scores measured 6-months post discharge.
In multivariable logistic regression analysis, excluding patients with a pre-COVID history of dementia and after adjusting for univariate predictors of 6-month t-MoCA impairment (Table 1) including age, Black race, years of education, pre-hospitalization employment status, primary language other than English, median household income, baseline mRS, movement disorder diagnosed during hospitalization, any neurological event during index COVID-19 hospitalization, discharge to nursing home, discharge to acute rehabilitation center and relevant interactions, significant, independent predictors of 6-month t-MoCA impairment were Black race (adjusted OR 5.54, 95% CI 2.25–13.66), ≤12 years of education (adjusted OR 5.21, 95% CI 2.25–12.09), and the interaction of baseline mRS score and unemployment prior to COVID-19 hospitalization (adjusted OR 3.98, 95% CI 1.23–12.92); Table 2 , AUC 0.744 [95% CI 0.674–0.814]). The interactions of Black race with age, baseline mRS, education≥12 years, median household income and unemployment pre-COVID did not significantly predict abnormal t-MoCA scores.
Table 2.
Multivariable predictors of abnormal telephone MoCA at 6-months post-hospitalization.
| Variable | Adjusted Odds Ratio (95% CI) | P |
|---|---|---|
| Education≤12 years | 5.21 (2.25–12.09) | <0.001 |
| Black race | 5.54 (2.25–13.66) | <0.001 |
| Interaction of baseline mRS and unemployment pre-COVID hospitalization | 3.98 (1.23–12.92) | 0.021 |
mRS = modified Rankin Score.
All univariate variables with P < 0.100 pushed into backward stepwise logistic regression analysis. Variables not in final model: age, history of dementia/cognitive impairment, baseline mRS, movement disorder diagnosed during hospitalization, any neurological event during index COVID-19 hospitalization, discharge to nursing home, primary language non-English, median household income, discharge to acute rehabilitation center.
We next evaluated individual t-MoCA cognitive domains (Table 3, Table 4 ). Overall, memory was the area of weakest performance, with only 14% of respondents achieving the maximum possible score, but without significant difference between those patients with and without neurological complications during hospitalization. However, those with neurological complications scored significantly worse than those without in the domains of attention and language (Table 3). Comparing Black respondents to other races, scores in the domains of attention, memory and executive functioning were significantly lower, while those with lower levels of education scored lower in these domains as well as the language domain (Table 4). Patients who were unemployed prior to COVID hospitalization demonstrated abnormalities across all domains of attention, language, memory, executive function and orientation (Table 4).
Table 3.
Domains of t-MoCA compared between patients with and without neurological complications during hospitalization for COVID-19.
| t-MoCA Domain | Overall | Neuro Event | No Neuro Event | P |
|---|---|---|---|---|
| Attention (max 6 points), | ||||
| Median (range) | 5 (1–6) | 5 (1–6) | 5 (1–6) | 0.003 |
| N (%) with maximum score | 87/223 (39%) | 32/105 (31%) | 55/118 (47%) | |
| Language (max 2 points) | ||||
| Median (range) | 2 (0–2) | 2 (0–2) | 2 (0–2) | 0.039 |
| N (%) with maximum score | 134/223 (60%) | 56/105 (53%) | 78/118 (66%) | |
| Memory (max 5 points) | ||||
| Median (range) | 3 (0–5) | 3 (0–5) | 3 (0–5) | 0.790 |
| N (%) with maximum score | 30/223 (14%) | 17/105 (16%) | 13/118 (11%) | |
| Executive Function (max 3 points) | ||||
| Median (range) | 2 (0–3) | 2 (0–3) | 2 (0–3) | 0.108 |
| N (%) with maximum score | 86/221 (39%) | 37/105 (35%) | 49/116 (42%) | |
| Orientation (max 6 points) | ||||
| Median (range) | 6 (3–6) | 6 (3–6) | 6 (3–6) | 0.967 |
| N (%) with maximum score | 190/222 (86%) | 89/104 (86%) | 101/118 (86%) | |
| Total Score (max 22 points) | ||||
| Median (range) | 18 (7–22) | 17 (7–22) | 18 (8–22) | 0.036 |
| N (%) with normal score (≥18) | 109/215 (51%) | 46/101 (46%) | 63/114 (55%) |
Patients were included in domain-specific analyses if all components of the domain were completed; Total score only calculated if all domains completed; P represents Mann-Whitney U for continuous variable.
Table 4.
Domains of cognitive dysfunction in groups that were independently associated with abnormal t-MoCA scores in multivariable analyses.
| t-MoCA Domain | Overall | Black | Other Races | P | Education >12 years |
Education ≤12 years |
P | Employed Pre-COVID | Unemployed Pre-COVID | P |
|---|---|---|---|---|---|---|---|---|---|---|
| Attention (max 6 points) | 0.012 | <0.001 | <0.001 | |||||||
| Median (range) | 5 (1–6) | 4 (1–6) | 5 (1–6) | 5 (1–6) | 4 (1–6) | 5.5 (1–6) | 4 (1–6) | |||
| N (%) with max score | 87/223 (39%) | 7/36 (19%) | 79/185 (43%) | 79/174 (45%) | 6/46 (13%) | 62/124 (50%) | 25/99 (25%) | |||
| Language (max 2 points) | 0.155 | 0.030 | 0.014 | |||||||
| Median (range) | 2 (0–2) | 1.5 (0–2) | 2 (0–2) | 2 (0–2) | 1 (0–2) | 2 (0–2) | 2 (0–2) | |||
| N (%) with max score | 134/223 (60%) | 18/36 (38%) | 115/185 (62%) | 109/174 (63%) | 22/46 (48%) | 82/124 (66%) | 52/99 (53%) | |||
| Memory (max 5 points) | 0.016 | <0.001 | <0.001 | |||||||
| Median (range) | 3 (0–5) | 2 (0–5) | 3 (0–5) | 3 (0–5) | 2 (0–5) | 3 (0–5) | 2 (0–5) | |||
| N (%) with max score | 30/223 (14%) | 1/36 (3%) | 28/185 (15%) | 26/174 (15%) | 3/46 (7%) | 22/124 (18%) | 8/99 (8%) | |||
| Executive Function (max 3 points) | 0.025 | <0.001 | <0.001 | |||||||
| Median (range) | 2 (0–3) | 2 (0–3) | 2 (0–3) | 2 (0–3) | 1 (0–3) | 2 (0–3) | 2 (0–3) | |||
| N (%) with max score | 86/221 (39%) | 9/36 (25%) | 77/183 (42%) | 75/173 (43%) | 8/45 (18%) | 61/124 (49%) | 25/97 (26%) | |||
| Orientation (max 6 points) | 0.343 | 0.566 | 0.005 | |||||||
| Median (range) | 6 (3–6) | 6 (4–6) | 6 (3–6) | 6 (4–6) | 6 (3–6) | 6 (5–6) | 6 (3–6) | |||
| N (%) with max score | 190/222 (86%) | 28/35 (80%) | 160/185 (87%) | 148/174 (85%) | 40/45 (89%) | 114/125 (91%) | 76/97 (78%) | |||
| Total Score (max 22 points) | 0.001 | 0.002 | <0.001 | |||||||
| Median (range) | 18 (7–22) | 15 (9-22) | 18 (7–22) | 18 (8–22) | 16 (7–22) | 18 (8–22) | 16 (7–21) | |||
| N (%) with normal score (≥18) | 109/215 (51%) | 8/34 (24%) | 100/179 (56%) | 95/171 (56%) | 14/44 (32%) | 76/121 (63%) | 33/94 (35%) |
Patients were included in domain-specific analyses if all components of the domain were completed; Total score only calculated if all domains completed; P represents Mann-Whitney U for continuous variable.
4. Discussion
In this study, we found that Black race, fewer years of formal education, and pre-hospitalization unemployment in the context of disability may be significant predictors of cognitive dysfunction as measured by the t-MoCA 6-months after hospitalization for COVID-19, even after adjusting for other factors. Contrary to our expectation, we found that cognitive impairment was independent of any hospital metric or recorded measure of illness severity including ventilator status, Sequential Organ Failure Assessment (SOFA) scores [[46], [47], [48]], inpatient medications, inflammatory markers, medical or neurological complications, and discharge disposition. This may be because the most severely ill patients either died in-hospital or were too impaired to complete the 6-month the t-MoCA assessment. Strengths of our study include its prospective ascertainment of data, self-reported race/ethnicity and employment status, a large sample size, initial neurological diagnoses by board-certified neurologists, adjustment for multiple possible confounders of cognitive dysfunction, and assessment of alterations in cognition that could be due to depression or anxiety.
Health disparities, including increased rates of SARS-CoV-2 infection, increased severity of illness and increased mortality have been reported among racial/ethnic minority groups, particularly among Black and Latinx populations [25,49]. Traditionally, racial health disparities for general medical conditions have been ascribed to differences in rates of chronic medical conditions, such as diabetes, hypertension, chronic kidney disease or smoking. However, we found that worse cognitive scores were independent of premorbid conditions that are found at higher rates in Black and Latinx populations, including hypertension, diabetes, obesity and chronic kidney disease. Furthermore, we did not detect any differences in baseline demographics, education, health insurance status, or employment status between Black and non-Black patients, apart from income level as estimated by zip code. This finding is important because it not only implies the significant role that financial status may play in health outcomes, but also suggests regional community variability in health outcomes. However, in multivariable analysis, even after controlling for household income/zip code, Black patients still had worse cognitive outcomes than other race groups, suggesting that additional unmeasured factors are at play. Previous studies have shown an increased risk of testing positive for COVID-19 among Black and Latinx patients compared with White patients [25]. This suggests that differences in exposure to SARS-CoV-2 and access to outpatient care post hospitalization between race groups may also impact cognitive outcomes. For example, we did not collect data on certain SDOH such as access to outpatient care post-hospitalization, which may impact cognitive outcomes.
Studies have found that lower MOCA cut-points among Black and Latinx patients compared to non-Latinx White patients have better positive and negative predictive value for the clinical diagnoses of mild cognitive impairment and Alzheimer's Disease [50]. Therefore, it is also possible that there are biases intrinsic to the t-MOCA test that could unfairly impact different race/ethnic groups. Compared to the full MOCA, the shorter t-MOCA has been found to have reasonable, albeit less sensitive and specific, discriminative ability for detecting mild cognitive impairment or dementia across demographically diverse racial/ethnic populations independent of age, education level, depressive symptoms, and/or issues with telephone administration [51]. However, since the standard MOCA has been found to have varying levels of discrimination between mild cognitive impairment (MCI), normal aging, and dementia in Black and Latinx populations [52], it is possible that our results are affected by unmeasured testing biases that are specific to Black populations.
Another possible explanation may be that the biological effects of COVID-19 differ based upon genetic differences encountered in different racial/ethnic groups [53,54]. For example, genes regulating SARS-CoV-2 uptake, endosomal trafficking and cytokine signaling are differentially expressed in Black Americans compared to European White Americans with COVID-19 [55], which may contribute to more severe COVID-19 symptoms and worse cognitive outcomes among Black patients. However, we did not detect any differences in severity of COVID-19 illness (e.g. intubation status, oxygen or blood pressure nadirs, or SOFA scores) between patients with or without abnormal 6-month t-MoCA scores or between Black and non-Black patients. This suggests that the genetic differences that have been identified, thus far [55], may not be clinically significant and that biological effects may not be the primary drivers of the observed differences in cognitive performance by race. Rather, social and economic disparities, nutritional variability [56], and systematic discriminatory environments may be contributing to observed cognitive differences. Apart from COVID-19, it is notable that the incidence of dementia, in general, in the U.S. is highest in Black Americans and Native Americans/Native Alaskans, intermediate in White, Latinx and Pacific IslanderAmericans and lowest among Asian Americans, after adjusting for age, sex, medical utilization and comorbidities [57]. Current literature suggests that this increased risk of dementia among Black individuals is more likely attributed to pervasive social inequities and racially related life-course factors, such as differences in education attainment, access to material and social resources, exposure to discrimination, and exposure to neurotoxins, rather than genetic predisposition [58].
The higher likelihood of cognitive impairment among patients with fewer years of formal education in our study was expected, given the well-established relationship between low education attainment and cognitive impairment [59]. This may be because individuals with more education possess a greater cognitive reserve and capacity to recruit eloquent brain regions, which allows them to sustain a larger degree of brain pathology before clinical impairment becomes apparent [59]. Though we adjusted for education level, there is no validated way to adjust for quality of education, which varies widely across metropolitan NYC [60]. Additionally, the role of education in moderating decline or promoting recovery after infection with SARS-CoV-2 remains unclear. In our cohort, patients with less education achieved lower scores in the domains of attention, memory, and executive function, and performed similarly in the domains of language and orientation compared with patients with more education. Previous studies have found similar patterns in patients with COVID-19 [[61], [62], [63], [64]] and post sepsis [65]. Long-term monitoring of trajectories of cognition will be needed to determine the likelihood that this profile could progress to other neurocognitive disorders such as Alzheimer's disease (AD).
This study has limitations. First, we excluded patients with mild COVID-19 disease that was not severe enough to warrant hospitalization, which limits the generalizability of our findings to patients with mild COVID-19. Conversely, the most severely affected patients with profound deficits in cognition or level of alertness were unable to complete the t-MOCA, so we likely have underestimated the percentage of hospital survivors with abnormal cognition. Deficits in attention may also affect patients' ability to complete the t-MOCA, resulting in lower scores in all other cognitive domains. Though we accounted for baseline history of dementia and baseline mRS, it is possible that some patients had undiagnosed cognitive disorders. Indeed, patients who had worse baseline mRS and were unemployed before hospitalization for COVID-19 were also more likely to score poorly on the t-MOCA. It is possible that the underlying disability (as measured by the mRS), which was severe enough to preclude employment, also contributed to undiagnosed pre-COVID cognitive dysfunction. Despite this, the estimated prevalence of mild cognitive impairment in the general community among patients aged 65–69 years (the median age of our population) is only 8.4% [66] and the prevalence of dementia is <1% [67], suggesting that undiagnosed cognitive impairment is likely uncommon. Although our cohort derives from a large, diverse catchment area, it may not be representative of observations made in other parts of the country. Our screening for depression and anxiety with the Neuro-QoL batteries did not indicate that emotional distress contributed to the current findings. However, our study was limited by the use of this brief self-reported screening measure. We note also that rates of reported psychiatric history among Black patients in our sample were lower than would be expected. Underreporting of psychiatric illness, as well as concerns about prejudice and discrimination related to psychiatric diagnoses, have been shown to vary by race/ethnicity and gender [[68], [69], [70]]. Given the emotional distress that can occur with COVID-19 illness, future studies should include a more comprehensive measurement of emotional health. Finally, lack of a SARS-CoV-2 negative control group in our study limits our ability to determine if cognitive deficits are a direct consequence of SARS-CoV-2 infection. Despite this limitation, we did adjust for confounders and serious abnormalities were identified in patients with no history of cognitive impairment, suggesting that either SARS-CoV-2 or its secondary complications may be implicated in the development of abnormal cognition.
5. Conclusions
Our study suggests that Black race, fewer years of education, and pre-hospitalization unemployment in the context of disability may predict worse cognitive performance, as measured by the t-MOCA, 6 months after hospitalization with COVID-19. To better characterize the nature and implications of these findings, future studies utilizing more extensive cognitive batteries in diverse populations with and without COVID-19 are needed. Such studies may guide future interventions and treatments to improve cognitive outcomes following hospitalization with COVID-19.
Funding
This research did not receive any specific grant from funding agencies in the public, commercial, or not-for-profit sectors.
References
- 1.Alemanno F., Houdayer E., Parma A., et al. COVID-19 cognitive deficits after respiratory assistance in the subacute phase: a COVID-rehabilitation unit experience. PLoS One. 2021;16 doi: 10.1371/journal.pone.0246590. [DOI] [PMC free article] [PubMed] [Google Scholar]
- 2.Almeria M., Cejudo J.C., Sotoca J., Deus J., Krupinski J. Cognitive profile following COVID-19 infection: clinical predictors leading to neuropsychological impairment. Brain Behav. Immun. Health. 2020;9 doi: 10.1016/j.bbih.2020.100163. [DOI] [PMC free article] [PubMed] [Google Scholar]
- 3.Amalakanti S., Arepalli K.V.R., Jillella J.P. Cognitive assessment in asymptomatic COVID-19 subjects. Virusdisease. 2021:1–4. doi: 10.1007/s13337-021-00663-w. [DOI] [PMC free article] [PubMed] [Google Scholar]
- 4.Beaud V., Crottaz-Herbette S., Dunet V., et al. Pattern of cognitive deficits in severe COVID-19. J. Neurol. Neurosurg. Psychiatry. 2021;92:567–568. doi: 10.1136/jnnp-2020-325173. [DOI] [PMC free article] [PubMed] [Google Scholar]
- 5.Del Brutto O.H., Wu S., Mera R.M., Costa A.F., Recalde B.Y., Issa N.P. Cognitive decline among individuals with history of mild symptomatic SARS-CoV-2 infection: a longitudinal prospective study nested to a population cohort. Eur. J. Neurol. 2021;28(10):3245–3253. doi: 10.1111/ene.14775. [DOI] [PMC free article] [PubMed] [Google Scholar]
- 6.Groiss S.J., Balloff C., Elben S., et al. Prolonged neuropsychological deficits, central nervous system involvement, and brain stem affection after COVID-19-a case series. Front. Neurol. 2020;11 doi: 10.3389/fneur.2020.574004. [DOI] [PMC free article] [PubMed] [Google Scholar]
- 7.Hellmuth J., Barnett T.A., Asken B.M., et al. Persistent COVID-19-associated neurocognitive symptoms in non-hospitalized patients. J. Neuro-Oncol. 2021;27:191–195. doi: 10.1007/s13365-021-00954-4. [DOI] [PMC free article] [PubMed] [Google Scholar]
- 8.Hosp J.A., Dressing A., Blazhenets G., et al. Cognitive impairment and altered cerebral glucose metabolism in the subacute stage of COVID-19. Brain. 2021;144:1263–1276. doi: 10.1093/brain/awab009. [DOI] [PMC free article] [PubMed] [Google Scholar]
- 9.Miskowiak K.W., Johnsen S., Sattler S.M., et al. Cognitive impairments four months after COVID-19 hospital discharge: pattern, severity and association with illness variables. Eur. Neuropsychopharmacol. 2021;46:39–48. doi: 10.1016/j.euroneuro.2021.03.019. [DOI] [PMC free article] [PubMed] [Google Scholar]
- 10.Negrini F., Ferrario I., Mazziotti D., et al. Neuropsychological features of severe hospitalized coronavirus disease 2019 patients at clinical stability and clues for postacute rehabilitation. Arch. Phys. Med. Rehabil. 2021;102:155–158. doi: 10.1016/j.apmr.2020.09.376. [DOI] [PMC free article] [PubMed] [Google Scholar]
- 11.Whiteside D.M., Oleynick V., Holker E., Waldron E.J., Porter J., Kasprzak M. Neurocognitive deficits in severe COVID-19 infection: case series and proposed model. Clin. Neuropsychol. 2021:1–20. doi: 10.1080/13854046.2021.1874056. [DOI] [PubMed] [Google Scholar]
- 12.Woo M.S., Malsy J., Pottgen J., et al. Frequent neurocognitive deficits after recovery from mild COVID-19. Brain Commun. 2020;2 doi: 10.1093/braincomms/fcaa205. (fcaa205) [DOI] [PMC free article] [PubMed] [Google Scholar]
- 13.Ortelli P., Ferrazzoli D., Sebastianelli L., et al. Neuropsychological and neurophysiological correlates of fatigue in post-acute patients with neurological manifestations of COVID-19: insights into a challenging symptom. J. Neurol. Sci. 2021;420 doi: 10.1016/j.jns.2020.117271. [DOI] [PMC free article] [PubMed] [Google Scholar]
- 14.Raman B., Cassar M.P., Tunnicliffe E.M., et al. Medium-term effects of SARS-CoV-2 infection on multiple vital organs, exercise capacity, cognition, quality of life and mental health, post-hospital discharge. EClinicalMedicine. 2021;31 doi: 10.1016/j.eclinm.2020.100683. [DOI] [PMC free article] [PubMed] [Google Scholar]
- 15.Frontera J.A., Yang D., Lewis A., et al. A prospective study of long-term outcomes among hospitalized COVID-19 patients with and without neurological complications. J. Neurol. Sci. 2021;426 doi: 10.1016/j.jns.2021.117486. Epub 2021 May 12. PMID: 34000678; PMCID: PMC8113108. [DOI] [PMC free article] [PubMed] [Google Scholar]
- 16.Frontera J.A., Yang D., Lewis A., et al. A prospective study of long-term outcomes among hospitalized COVID-19 patients with and without neurological complications. J. Neurol. Sci. 2021;426 doi: 10.1016/j.jns.2021.117486. [DOI] [PMC free article] [PubMed] [Google Scholar]
- 17.Frontera J.A., Melmed K., Fang T., et al. Toxic metabolic encephalopathy in hospitalized patients with COVID-19. Neurocrit. Care. 2021;35(3):693–705. doi: 10.1007/s12028-021-01220-5. [DOI] [PMC free article] [PubMed] [Google Scholar]
- 18.Sterling M.R., Ringel J.B., Pinheiro L.C., et al. Social determinants of health and 90-day mortality after hospitalization for heart failure in the REGARDS study. J. Am. Heart Assoc. 2020;9 doi: 10.1161/JAHA.119.014836. [DOI] [PMC free article] [PubMed] [Google Scholar]
- 19.Penman-Aguilar A., Talih M., Huang D., Moonesinghe R., Bouye K., Beckles G. Measurement of health disparities, health inequities, and social determinants of health to support the advancement of health equity. J. Public Health Manag. Pract. 2016;22(Suppl. 1):S33–S42. doi: 10.1097/PHH.0000000000000373. [DOI] [PMC free article] [PubMed] [Google Scholar]
- 20.Majoka M.A., Schimming C. Effect of social determinants of health on cognition and risk of Alzheimer disease and related dementias. Clin. Ther. 2021;43(6):922–929. doi: 10.1016/j.clinthera.2021.05.005. [DOI] [PubMed] [Google Scholar]
- 21.Zhang Y., Zhang Y., Sholle E., et al. Assessing the impact of social determinants of health on predictive models for potentially avoidable 30-day readmission or death. PLoS One. 2020;15 doi: 10.1371/journal.pone.0235064. [DOI] [PMC free article] [PubMed] [Google Scholar]
- 22.Frontera J.A., Lewis A., Melmed K., et al. Prevalence and predictors of prolonged cognitive and psychological symptoms following COVID-19 in the United States. Front. Aging Neurosci. 2021;13 doi: 10.3389/fnagi.2021.690383. [DOI] [PMC free article] [PubMed] [Google Scholar]
- 23.Valenzano A., Scarinci A., Monda V., et al. The social brain and emotional contagion: COVID-19 effects. Medicina (Kaunas) 2020;56 doi: 10.3390/medicina56120640. [DOI] [PMC free article] [PubMed] [Google Scholar]
- 24.Price-Haywood E.G., Burton J., Fort D., Seoane L. Hospitalization and mortality among black patients and white patients with Covid-19. N. Engl. J. Med. 2020;382:2534–2543. doi: 10.1056/NEJMsa2011686. [DOI] [PMC free article] [PubMed] [Google Scholar]
- 25.Ogedegbe G., Ravenell J., Adhikari S., et al. Assessment of racial/ethnic disparities in hospitalization and mortality in patients with COVID-19 in new York City. JAMA Netw. Open. 2020;3 doi: 10.1001/jamanetworkopen.2020.26881. [DOI] [PMC free article] [PubMed] [Google Scholar]
- 26.Upshaw T.L., Brown C., Smith R., Perri M., Ziegler C., Pinto A.D. Social determinants of COVID-19 incidence and outcomes: a rapid review. PLoS One. 2021;16 doi: 10.1371/journal.pone.0248336. [DOI] [PMC free article] [PubMed] [Google Scholar]
- 27.Frontera J.A., Sabadia S., Lalchan R., et al. A prospective study of neurologic disorders in hospitalized patients with COVID-19 in new York City. Neurology. 2021;96:e575–e586. doi: 10.1212/WNL.0000000000010979. [DOI] [PMC free article] [PubMed] [Google Scholar]
- 28.Tunkel A.R., Glaser C.A., Bloch K.C., et al. The management of encephalitis: clinical practice guidelines by the Infectious Diseases Society of America. Clin. Infect. Dis. 2008;47:303–327. doi: 10.1086/589747. [DOI] [PubMed] [Google Scholar]
- 29.Tunkel A.R., Hartman B.J., Kaplan S.L., et al. Practice guidelines for the management of bacterial meningitis. Clin. Infect. Dis. 2004;39:1267–1284. doi: 10.1086/425368. [DOI] [PubMed] [Google Scholar]
- 30.Venkatesan A., Tunkel A.R., Bloch K.C., et al. Case definitions, diagnostic algorithms, and priorities in encephalitis: consensus statement of the international encephalitis consortium. Clin. Infect. Dis. 2013;57:1114–1128. doi: 10.1093/cid/cit458. [DOI] [PMC free article] [PubMed] [Google Scholar]
- 31.Tunkel A.R., Hasbun R., Bhimraj A., et al. 2017 Infectious Diseases Society of America’s clinical practice guidelines for healthcare-associated ventriculitis and meningitis. Clin. Infect. Dis. 2017;64:e34–e65. doi: 10.1093/cid/ciw861. [DOI] [PMC free article] [PubMed] [Google Scholar]
- 32.Scott T.F., Frohman E.M., De Seze J., et al. Evidence-based guideline: clinical evaluation and treatment of transverse myelitis: report of the therapeutics and technology assessment Subcommittee of the American Academy of neurology. Neurology. 2011;77:2128–2134. doi: 10.1212/WNL.0b013e31823dc535. [DOI] [PubMed] [Google Scholar]
- 33.Sacco R.L., Kasner S.E., Broderick J.P., et al. An updated definition of stroke for the 21st century: a statement for healthcare professionals from the American Heart Association/American Stroke Association. Stroke. 2013;44:2064–2089. doi: 10.1161/STR.0b013e318296aeca. [DOI] [PMC free article] [PubMed] [Google Scholar]
- 34.Fokke C., van den Berg B., Drenthen J., Walgaard C., van Doorn P.A., Jacobs B.C. Diagnosis of Guillain-Barre syndrome and validation of Brighton criteria. Brain. 2014;137:33–43. doi: 10.1093/brain/awt285. [DOI] [PubMed] [Google Scholar]
- 35.Kalita J., Misra U.K., Das M. Neurophysiological criteria in the diagnosis of different clinical types of Guillain-Barre syndrome. J. Neurol. Neurosurg. Psychiatry. 2008;79:289–293. doi: 10.1136/jnnp.2007.118000. [DOI] [PubMed] [Google Scholar]
- 36.Sejvar J.J., Kohl K.S., Gidudu J., et al. Guillain-Barre syndrome and fisher syndrome: case definitions and guidelines for collection, analysis, and presentation of immunization safety data. Vaccine. 2011;29:599–612. doi: 10.1016/j.vaccine.2010.06.003. [DOI] [PubMed] [Google Scholar]
- 37.Frontera J., Mainali S., Fink E.L., et al. Global consortium study of neurological dysfunction in COVID-19 (GCS-NeuroCOVID): study design and rationale. Neurocrit. Care. 2020;33:25–34. doi: 10.1007/s12028-020-00995-3. [DOI] [PMC free article] [PubMed] [Google Scholar]
- 38.van Swieten J.C., Koudstaal P.J., Visser M.C., Schouten H.J., van Gijn J. Interobserver agreement for the assessment of handicap in stroke patients. Stroke. 1988;19:604–607. doi: 10.1161/01.str.19.5.604. [DOI] [PubMed] [Google Scholar]
- 39.York CCfCoN Median Incomes [online] 2021. https://data.cccnewyork.org/data/table/66/median-incomes#66/107/62/a/a Available at: Accessed Septebmer 2021.
- 40.Blum A.B., Egorova N.N., Sosunov E.A., et al. Impact of socioeconomic status measures on hospital profiling in new York City. Circ. Cardiovasc. Qual. Outcomes. 2014;7:391–397. doi: 10.1161/CIRCOUTCOMES.113.000520. [DOI] [PMC free article] [PubMed] [Google Scholar]
- 41.UnitedStatesZipCodes.org Household Income [online] 2021. https://www.unitedstateszipcodes.org/11550/ Available at. Accessed Septebmer 2021.
- 42.Pendlebury S.T., Welch S.J., Cuthbertson F.C., Mariz J., Mehta Z., Rothwell P.M. Telephone assessment of cognition after transient ischemic attack and stroke: modified telephone interview of cognitive status and telephone Montreal cognitive assessment versus face-to-face Montreal cognitive assessment and neuropsychological battery. Stroke. 2013;44:227–229. doi: 10.1161/STROKEAHA.112.673384. [DOI] [PMC free article] [PubMed] [Google Scholar]
- 43.Nasreddine Z.S., Phillips N.A., Bedirian V., et al. The Montreal cognitive assessment, MoCA: a brief screening tool for mild cognitive impairment. J. Am. Geriatr. Soc. 2005;53:695–699. doi: 10.1111/j.1532-5415.2005.53221.x. [DOI] [PubMed] [Google Scholar]
- 44.Rossetti H.C., Lacritz L.H., Cullum C.M., Weiner M.F. Normative data for the Montreal cognitive assessment (MoCA) in a population-based sample. Neurology. 2011;77:1272–1275. doi: 10.1212/WNL.0b013e318230208a. [DOI] [PubMed] [Google Scholar]
- 45.Cella D., Lai J.S., Nowinski C.J., et al. Neuro-QOL: brief measures of health-related quality of life for clinical research in neurology. Neurology. 2012;78:1860–1867. doi: 10.1212/WNL.0b013e318258f744. [DOI] [PMC free article] [PubMed] [Google Scholar]
- 46.Ferreira F.L., Bota D.P., Bross A., Melot C., Vincent J.L. Serial evaluation of the SOFA score to predict outcome in critically ill patients. JAMA. 2001;286:1754–1758. doi: 10.1001/jama.286.14.1754. [DOI] [PubMed] [Google Scholar]
- 47.Vincent J.L., Moreno R., Takala J., et al. The SOFA (Sepsis-related organ failure assessment) score to describe organ dysfunction/failure. On behalf of the working group on Sepsis-related problems of the European Society of Intensive Care Medicine. Intensive Care Med. 1996;22:707–710. doi: 10.1007/BF01709751. [DOI] [PubMed] [Google Scholar]
- 48.Vincent J.L., de Mendonca A., Cantraine F., et al. Use of the SOFA score to assess the incidence of organ dysfunction/failure in intensive care units: results of a multicenter, prospective study. Working group on “sepsis-related problems” of the European Society of Intensive Care Medicine. Crit. Care Med. 1998;26:1793–1800. doi: 10.1097/00003246-199811000-00016. [DOI] [PubMed] [Google Scholar]
- 49.Webb Hooper M., Napoles A.M., Perez-Stable E.J. COVID-19 and racial/ethnic disparities. JAMA. 2020;323:2466–2467. doi: 10.1001/jama.2020.8598. [DOI] [PMC free article] [PubMed] [Google Scholar]
- 50.Milani S.A., Marsiske M., Cottler L.B., Chen X., Striley C.W. Optimal cutoffs for the Montreal cognitive assessment vary by race and ethnicity. Alzheimers Dement. (Amst.) 2018;10:773–781. doi: 10.1016/j.dadm.2018.09.003. [DOI] [PMC free article] [PubMed] [Google Scholar]
- 51.Katz M.J., Wang C., Nester C.O., et al. T-MoCA: a valid phone screen for cognitive impairment in diverse community samples. Alzheimers Dement. (Amst.) 2021;13 doi: 10.1002/dad2.12144. [DOI] [PMC free article] [PubMed] [Google Scholar]
- 52.Milani S.A., Marsiske M., Striley C.W. Discriminative ability of Montreal cognitive assessment subtests and items in racial and ethnic minority groups. Alzheimer Dis. Assoc. Disord. 2019;33:226–232. doi: 10.1097/WAD.0000000000000310. [DOI] [PMC free article] [PubMed] [Google Scholar]
- 53.Fricke-Galindo I., Falfan-Valencia R. Genetics insight for COVID-19 susceptibility and severity: a review. Front. Immunol. 2021;12 doi: 10.3389/fimmu.2021.622176. [DOI] [PMC free article] [PubMed] [Google Scholar]
- 54.Phillips N., Park I.W., Robinson J.R., Jones H.P. The perfect storm: COVID-19 health disparities in US blacks. J. Racial Ethn. Health Disparities. 2021;8(5):1153–1160. doi: 10.1007/s40615-020-00871-y. [DOI] [PMC free article] [PubMed] [Google Scholar]
- 55.Singh U., Hernandez K.M., Aronow B.J., Wurtele E.S. African Americans and European Americans exhibit distinct gene expression patterns across tissues and tumors associated with immunologic functions and environmental exposures. Sci. Rep. 2021;11:9905. doi: 10.1038/s41598-021-89224-1. [DOI] [PMC free article] [PubMed] [Google Scholar]
- 56.Moscatelli F., Sessa F., Valenzano A., et al. COVID-19: role of nutrition and supplementation. Nutrients. 2021;13 doi: 10.3390/nu13030976. [DOI] [PMC free article] [PubMed] [Google Scholar]
- 57.Mayeda E.R., Glymour M.M., Quesenberry C.P., Whitmer R.A. Inequalities in dementia incidence between six racial and ethnic groups over 14 years. Alzheimers Dement. 2016;12:216–224. doi: 10.1016/j.jalz.2015.12.007. [DOI] [PMC free article] [PubMed] [Google Scholar]
- 58.Weuve J., Barnes L.L., Mendes de Leon C.F., et al. Cognitive aging in black and white Americans: cognition, cognitive decline, and incidence of Alzheimer disease dementia. Epidemiology. 2018;29:151–159. doi: 10.1097/EDE.0000000000000747. [DOI] [PMC free article] [PubMed] [Google Scholar]
- 59.Lenehan M.E., Summers M.J., Saunders N.L., Summers J.J., Vickers J.C. Relationship between education and age-related cognitive decline: a review of recent research. Psychogeriatrics. 2015;15:154–162. doi: 10.1111/psyg.12083. [DOI] [PubMed] [Google Scholar]
- 60.NYC DoE School Quality Reports and Resources [online] 2021. https://infohub.nyced.org/reports/school-quality/school-quality-reports-and-resources Available at. (Accessed 7/26), Accessed Septebmer 2021.
- 61.Lambert N. Indiana University School of Medicine; Indianapolis, IN: 2020. COVID 19 "Long Hauler" Symptoms Survey Report. [Google Scholar]
- 62.Raman R., Rajalakshmi R., Surya J., et al. Impact on health and provision of healthcare services during the COVID-19 lockdown in India: a multicentre cross-sectional study. BMJ Open. 2021;11 doi: 10.1136/bmjopen-2020-043590. [DOI] [PMC free article] [PubMed] [Google Scholar]
- 63.Zhou H., Lu S., Chen J., et al. The landscape of cognitive function in recovered COVID-19 patients. J. Psychiatr. Res. 2020;129:98–102. doi: 10.1016/j.jpsychires.2020.06.022. [DOI] [PMC free article] [PubMed] [Google Scholar]
- 64.Adam Hampshire W.T., Chamberlain Samuel R., Jolly Amy, Grant Jon E., Patrick Fiona, Mazibuko Ndaba, Williams Steve, Barnby Joseph M., Hellyer Peter, Mehta Mitul A. Cognitive deficits in people who have recovered from COVID-19 relative to controls: An N=84,285 online study. MedRxiv. 2021;39:101044. doi: 10.1016/j.eclinm.2021.101044. [DOI] [PMC free article] [PubMed] [Google Scholar]
- 65.Brown S.M., Collingridge D.S., Wilson E.L., et al. Preliminary validation of the Montreal cognitive assessment tool among sepsis survivors: a prospective pilot study. Ann. Am. Thorac. Soc. 2018;15:1108–1110. doi: 10.1513/AnnalsATS.201804-233OC. [DOI] [PubMed] [Google Scholar]
- 66.Petersen R.C., Lopez O., Armstrong M.J., et al. Practice guideline update summary: mild cognitive impairment: report of the guideline development, dissemination, and implementation Subcommittee of the American Academy of neurology. Neurology. 2018;90:126–135. doi: 10.1212/WNL.0000000000004826. [DOI] [PMC free article] [PubMed] [Google Scholar]
- 67.van der Flier W.M., Scheltens P. Epidemiology and risk factors of dementia. J. Neurol. Neurosurg. Psychiatry. 2005;76(Suppl. 5):v2–v7. doi: 10.1136/jnnp.2005.082867. [DOI] [PMC free article] [PubMed] [Google Scholar]
- 68.Manuel J.I. Racial/ethnic and gender disparities in health care use and access. Health Serv. Res. 2018;53:1407–1429. doi: 10.1111/1475-6773.12705. [DOI] [PMC free article] [PubMed] [Google Scholar]
- 69.Cook B.L., Trinh N.H., Li Z., Hou S.S., Progovac A.M. Trends in racial-ethnic disparities in access to mental health care, 2004-2012. Psychiatr. Serv. 2017;68:9–16. doi: 10.1176/appi.ps.201500453. [DOI] [PMC free article] [PubMed] [Google Scholar]
- 70.Gary F.A. Stigma: barrier to mental health care among ethnic minorities. Issues Ment. Health Nurs. 2005;26:979–999. doi: 10.1080/01612840500280638. [DOI] [PubMed] [Google Scholar]