Abstract
Background
Rubus is the largest genus of the family Rosaceae and is valued as medicinal, edible, and ornamental plants. Here, we sequenced and assembled eight chloroplast (cp) genomes of Rubus from the Dabie Mountains in Central China. Fifty-one Rubus species were comparatively analyzed for the cp genomes including the eight newly discovered genomes and forty-three previously reported in GenBank database (NCBI).
Results
The eight newly obtained cp genomes had the same quadripartite structure as the other cp genomes in Rubus. The length of the eight plastomes ranged from 155,546 bp to 156,321 bp with similar GC content (37.0 to 37.3%). The results indicated 133–134 genes were annotated for the Rubus plastomes, which contained 88 or 89 protein coding genes (PCGs), 37 transfer RNA genes (tRNAs), and eight ribosomal RNA genes (rRNAs). Among them, 16 (or 18) of the genes were duplicated in the IR region. Structural comparative analysis results showed that the gene content and order were relatively preserved. Nucleotide variability analysis identified nine hotspot regions for genomic divergence and multiple simple sequences repeats (SSRs), which may be used as markers for genetic diversity and phylogenetic analysis. Phylogenetic relationships were highly supported within the family Rosaceae, as evidenced by sub-clade taxa cp genome sequences.
Conclusion
Thus, the whole plastome may be used as a super-marker in phylogenetic studies of this genus.
Supplementary Information
The online version contains supplementary material available at 10.1186/s12864-021-08225-6.
Keywords: Rubus, Chloroplast genome, Compare analysis, Phylogeny
Background
Rubus is the largest genus in the family Rosaceae, with approximately 700 species. Plants are widely distributed in the temperate and sub-tropical regions of the Northern Hemisphere, with only a few species found in the Southern Hemisphere. There are more than 208 species found in China, 139 of which are endemic [1]. There is a growing interest in the abundance of regional taxonomic treatments, new species, and new accounts of the genus Rubus in China [2–12].
Rubus has been used in traditional Chinese medicine since ancient times. The fruits are well-known in Asia, Europe, and North America and have a long history of usefulness in these regions, especially in some European countries. Some natural species, such as R. corchorifolius, are widely cultivated for their medicinal, edible, and ornamental value.
Rubus is well-known for its diversity, leaf shape, inflorescence architecture, reproductive pattern, and other features. The plant is typically armed with bristles, prickles, or glandular hairs; the leaf exhibits simple, palmate, or pinnate shapes; flowers are pentamerous and mostly bisexual; achenes are drupelets or drupaceous and are aggregated on a penduncle as semispherical, conical, or cylindrical fruits [1]. Rubus is one of the most difficult taxa of flowering plants to classify due to its highly variable morphologies, and its complicated apomixis, polyploidy, and hybridization [13, 14]. Therefore, it is essential to construct a phylogeny tree using molecular evidence to better understand the relationships between species and improve the development and utilization of wild germplasm resources.
The most widely-accepted taxonomic system of the genus Rubus was built by Focke [15–17]. According to Focke, Rubus was separated into 12 subgenera, the largest being Rubus (132 species), Idaeobatus (117 species), and Malachobatus (115 species). Rubus is found mainly in Europe and North America, according to Flora of China (FOC), while Malachobatus and Idaeobatus are typically found throughout Asia, especially China [1].
Several molecular phylogenetic studies have tried to resolve the genetic relationships of Rubus [13, 18–22]. Wang et al. (2016) selected three chloroplasts (rbcL, rpl20-rps12, and trnG-trnS) and three nuclear genetic markers (nrITS, GBSSI-2, and PEPC) to resolve the phylogenetic relationships of 142 Chinese Rubus species, in which the phylogeny showed a certain degree of inadequacy between the chloroplast and nuclear markers.
There are few reports on the chloroplast genomes of Rubus to date [23–30]. Recently, a comparative analysis of the characteristics of the Rubus cp genome was reported, and together with about other ten species was used to construct a phylogenetic tree, but the mainly species was distributed in Taiwan [31]. Here, we sequenced and assembled eight cp genomes of Rubus and comparatively analyzed. And together with previously reported 38 cp genomes downloaded from the organelle genome database at National Center for Biotechnology Information (https://www.ncbi.nlm.nih.gov) [32], phylogenetic analysis was also performed. Our results, including gene content, size, nucleotide variable sites, identified SSRs, and phylogeny analysis, may improve our understanding of the cp genomes structure of genus Rubus and provide resources for genetic diversity and phylogenetic analyses in future studies.
Results and discussion
General features of Rubus chloroplast genomes
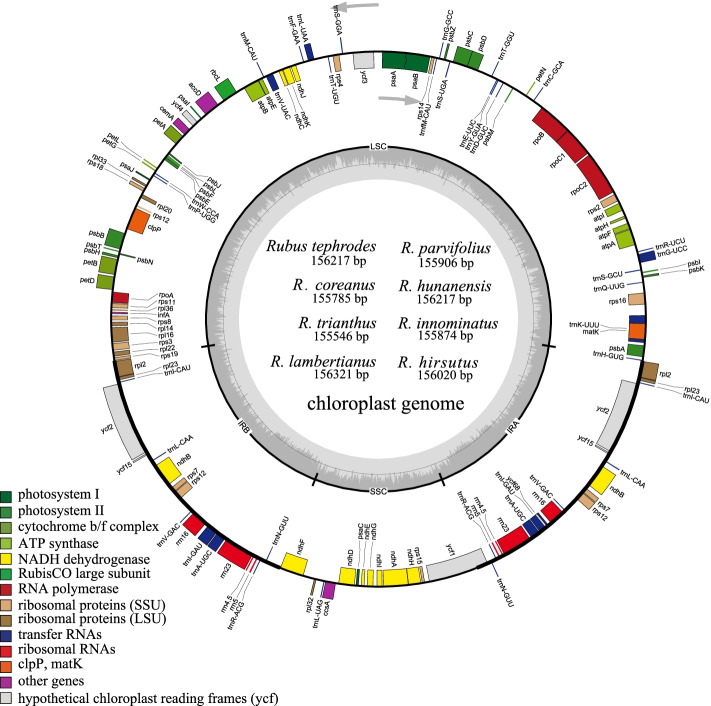
For the eight newly sequenced species, Illumina PE sequencing generated 3,408,285,600 (R. innominatus) to 9,832,178,700 (R. trianthus) clean reads, with mean coverage from 831 (X) in R. innominatus to 1229 (X) in R. trianthus. The newly assembled plastome of the eight Rubus samples had a quadripartite structure forming a circular molecule ranging from 155,546 bp (R. trianthus) to 156,321 bp (R. lambertianus) in length (Table 1). The eight cp genomes comprised a large single copy (LSC) region (85,028–85,883 bp) and a small single copy (SSC) region (18,710–18,874 bp), divided by two copies of inverted repeats (IRs) (25,761–25,994 bp) (Fig. 1, Table 1). The guanine-cytosine (GC) content of the eight cp genomes differed slightly, from 37.0% (R. trianthus and R. innominatus) to 37.3% (R. coreanus, R. hirsutus and R. parvifolius) (Table 1). The GC content of the coding sequence (CDS) ranged from 37.8 to 38.0%. Same as previously reported GC content of Rubus in Taiwan, the GC content of IR regions (42.8–42.9%) was higher than LSC (34.8–35.2%) and SSC regions (30.9–31.4%) [31].
Table 1.
Accession numbers and features of the eight Rubus plastomes in the present study
| Species | Accession no. | Clean reads | Reads used in assembly | Mean coverage of base (X) | Complete | LSC | SSC | IR | CDS | |||||
|---|---|---|---|---|---|---|---|---|---|---|---|---|---|---|
| Length (bp) | GC (%) | Length (bp) | GC (%) | Length (bp) | GC (%) | Length (bp) | GC (%) | Length (bp) | GC (%) | |||||
| Rubus tephrodes | MT478113 | 8,969,158,800 | 8,367,934 | 600 | 156,217 | 37.2 | 85,805 | 35.1 | 18,830 | 31.2 | 25,791 | 42.8 | 78,876 | 38 |
| R. coreanus | MT478114 | 8,545,216,200 | 8,077,463 | 620 | 155,785 | 37.3 | 85,028 | 35.2 | 18,769 | 31.3 | 25,994 | 42.8 | 77,404 | 38 |
| R. trianthus | MT478115 | 9,832,178,700 | 7,522,556 | 1229 | 155,546 | 37.0 | 85,305 | 34.9 | 18,719 | 30.9 | 25,761 | 42.8 | 78,838 | 37.8 |
| R. lambertianus | OK127886 | 3,497,807,100 | 20,149,705 | 914 | 156,321 | 37.2 | 85,883 | 35.1 | 18,874 | 31.2 | 25,782 | 42.8 | 78,870 | 38 |
| R. hirsutus | OK127882 | 3,625,125,600 | 13,222,835 | 823 | 156,020 | 37.3 | 85,784 | 34.8 | 18,710 | 31 | 25,763 | 42.9 | 79,212 | 37.8 |
| R. parvifolius | OK127884 | 3,611,559,900 | 11,723,986 | 915 | 155,906 | 37.3 | 85,125 | 35.2 | 18,749 | 31.4 | 26,016 | 42.8 | 78,960 | 38 |
| R. hunanensis | OK127885 | 3,521,878,500 | 8,434,742 | 865 | 156,217 | 37.2 | 85,806 | 35.1 | 18,831 | 31.2 | 25,790 | 42.8 | 78,369 | 38 |
| R. innominatus | OK127883 | 3,408,285,600 | 12,384,841 | 831 | 155,874 | 37.0 | 85,094 | 35.2 | 18,795 | 31.3 | 25,993 | 42.8 | 78,966 | 38 |
Note: GC guanine-cytosine, LSC large single copy, SSC small single copy, IR inverted repeat, CDS coding sequence
Fig. 1.
Gene maps of the complete cp genome of eight species of Rubus. Genes on the inside of the circle are transcribed clockwise, while that outside are transcribed counter clockwise. Genes were colored according to their functional groups. The darker gray in the inner circle corresponds to GC content, whereas the lighter gray corresponds to AT content
Totally, 134 genes were annotated in plastomes of Rubus tephrodes, R. coreanus, R. trianthus and R. hirsutus, included 89 CDS, 37 transfer RNA genes (tRNAs), and eight ribosomal RNA (rRNAs). Because infA gene were not annotated, four other Rubus species (R. lambertianus, R. parvifolius, R. innominatus and R. hunanensis) contained 133 genes, including 88 protein-coding genes, eight rRNAs, and 37 tRNAs. Among all, 16 or 18 genes had a double copy in the IR region: seven or five protein-coding genes, seven tRNAs and four rRNAs (Table 1 and Table 2); 17 genes contained one intron (rps16, rpoC1, petB, petD, rpl16, rpl22, rpl2, ndhA, ndhB, and eight tRNA genes) and two genes had two introns (clpP and ycf3) (Table S1). The trnK-UUU gene had the longest intron of 2488–2518 bp in the eight Rubus plastomes.
Table 2.
Gene contents in the cp genomes of Rubus species
| No. | Group of Genes | Genes Names | Amount |
|---|---|---|---|
| 1 | Photosystems I | psaA, psaB, psaC, psaI, psaJ | 5 |
| 2 | Photosystems II | psbA, psbB, psbC, psbD, psbE, psbF, psbH, psbI, psbJ, psbK, psbL, psbM, psbN, psbT, psbZ, ycf3 ** | 16 |
| 3 | Cytochrome b/f complex | petA, petB *, petD *, petG, petL, petN | 6 |
| 4 | ATP synthase | atpA, atpB, atpE, atpF, atpH, atpI | 6 |
| 5 | NADH dehydrogenase | ndhA *, ndhB *(×2), ndhC, ndhD, ndhE, ndhF, ndhG, ndhH, ndhI, ndhJ, ndhK | 12 |
| 6 | Rubisco large subunit | rbcL | 1 |
| 7 | RNA polymerase | rpoA, rpoB, rpoC1 *, rpoC2 | 4 |
| 8 | Ribosomal proteins (SSU) | rps2, rps3, rps4, rps7(×2), rps8, rps11, rps12 (×3), rps14, rps15, rps16 *, rps18, rps19 | 15 |
| 9 | Ribosomal proteins (LSU) | rpl2 *(×2), rpl14, rpl16 *, rpl20, rpl22 *, rpl23(× 2), rpl32, rpl33, rpl36 | 11 |
| 10 | Assembly/stability of photosystem I | ycf4 | 1 |
| 11 | Transfer RNAs | 37 tRNAs (6contain an intron, 7 in the IRs) | 37 |
| 12 | Ribosomal RNAs | rrn4.5(×2), rrn5(×2), rrn16(× 2), rrn23(× 2) | 8 |
| 13 | RNA processing | matK | 1 |
| 14 | Carbon metabolism | cemA | 1 |
| 15 | Cytochrome c synthesis | ccsA | 1 |
| 16 | Proteins of unknown function | ycf1 *, ycf2(×2), ycf15(× 2), ycf68 | 6 |
| 17 | Other genes | accD, clpP **, infA | 3 |
Note: * Gene contains one intron; ** gene contains two introns; (×2) indicates the number of the repeat unit is 2; (×3) indicates the number of the repeat unit is 3. infA were only annotated in Rubus tephrodes, R. coreanus, R. trianthus, R. hirsutus
IR contraction and expansion
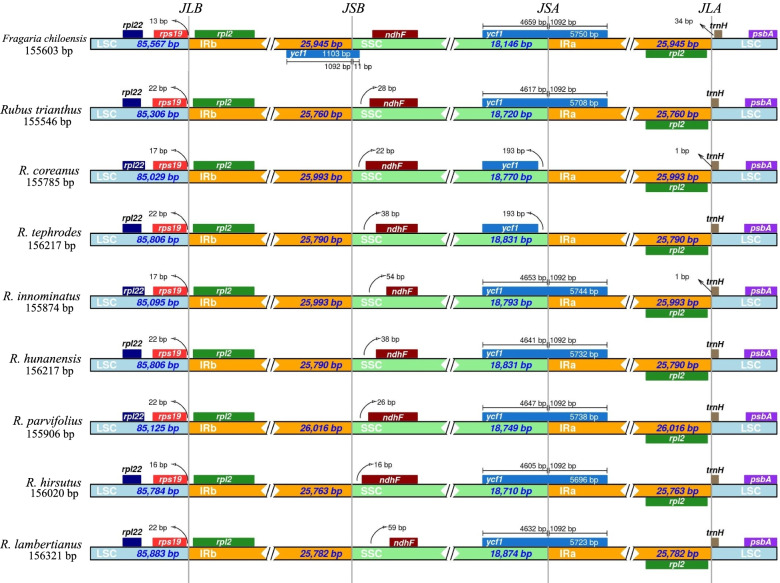
Chloroplast genome structures, including the gene content and order, were compared, and analyzed among the eight Rubus species (Table 2 and Table S1). The results showed that the eight newly assembled chloroplasts was relatively conserved when concerned in four regions (LSC, SSC and two IRs) boundary (Fig. 2). The lengths of the IR region of the 46 Rubus ranged from 25,758–25,993 bp versus 26,238 bp in Fragaria (Fig. S1). The LSC-IRb border was located between the genes rps19 and rpl2 for ten chroroplast genomes, within the rps19 gene for Rubus niveus, and between the genes trnH and rpl2 for R. leucanthus. Three types of SSC-IRa borders were detected among the twelve plastomes. In R. corchorifolius and R. boninensis the ycf1 gene was situated in the IRa region, 191 bp and 2 bp apart from the SSC-IRa region, respectively. In R. tephrodes, R. niveus and R. coreanus, the ycf1 gene was found entirely in the SSC region and was 0–192 bp away from the SSC-IRa region. For the other seven plastomes, the SSC-IRa border located in the coding region of ycf1. The length of the ycf1 gene range from 4437 bp to 5750 bp and was typically found in the SSC region. The ndhF gene located in the SSC region at the SSC-IRb border for all but two species (R. takesimensis and Fragria chiloensis). The LSC-IRa border was between the rpl2 and trnH genes. The trnH gene was found in the LSC region, which has also been reported in dicots [33, 34].
Fig. 2.
The comparison of four regions (LSC, SSC and two IRs) among twelve cp genome. Numbers above or near the colored genes indicated distances between the gene and the edge of borders. The figure is not in scale for length
Comparative Plastome sequence divergence and hotspots regions
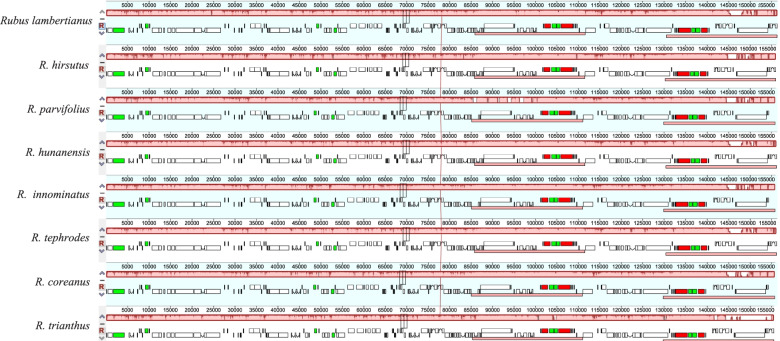
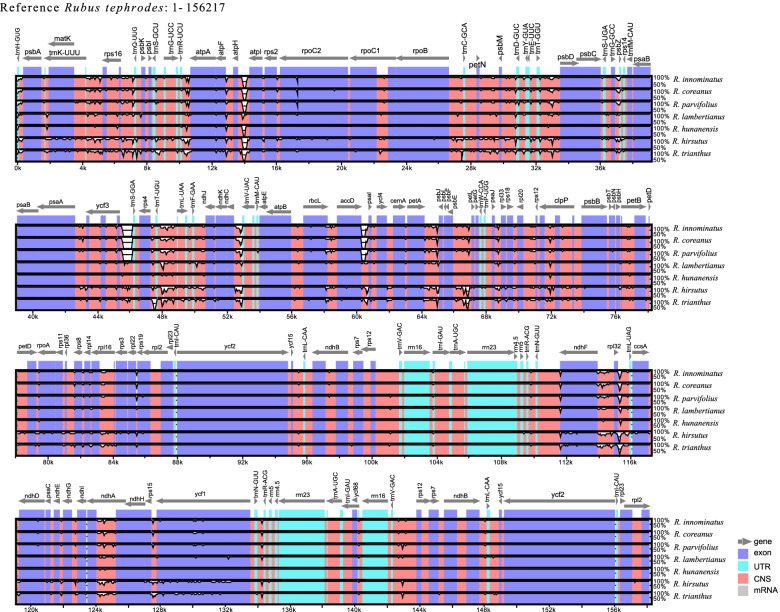
Collinearity detection was carried out to analyze and compare the chloroplast genomes. Mauve aligment of plastomes showed that no gene rearrangements within the chloroplast genomes of the eight Rubus (Fig. 3). The eight newly assembled chloroplast genomes were compared using the annotated R. tephrodes as the reference cp sequence (Fig. 4) to determine interspecific divergence using mVISTA software. The results show that the inverted repeat regions were more stable than the single copy region, and are consistent with those of other studies [25, 35, 36]. The most diverse regions were the intergenic spacers, including rps16-trnQ, trnL-trnT, and rpl32-trnL-ccsA.
Fig. 3.
Mauve alignment of eight Rubus cp genome revealing no interspecific rearrangements
Fig. 4.
Visualized alignment of the Rubus cp genome sequences with annotated R. tephorodes as reference, using mVISTA. The x-axis represents the base sequence of the alignment and the y-axis represents the pairwise percent identity within 50–100%. Grey arrows represent positions and directions of the genes
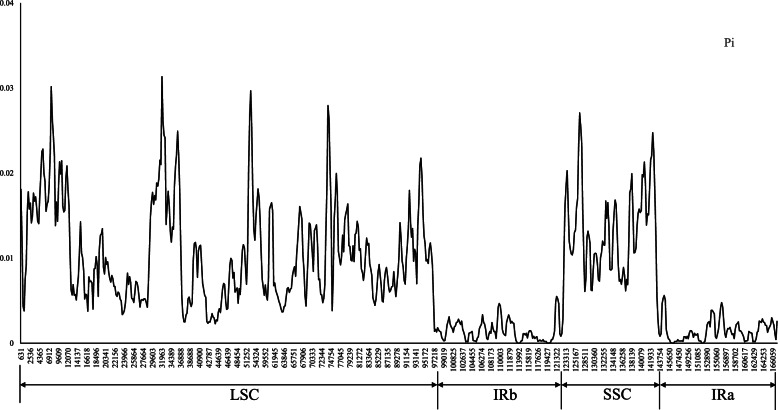
The nucleotide variability (Pi) was calculated with the resulting average value of 0.008, and a range of 0 to 0.0313. SSC and LSC were highly variable and IR was relatively conserved (Fig. 5). Nine intergenic regions (trnK-rps16, rps16-psbK, psbI-trnS-trnG, trnG-atpA, petN-psbM-trnD, trnE-psbD, rps4-trnL, petA-psbF, rpl16-rps3, ndhF, rpl32-trnL-ccsA and ycf1) were found to be higher variable with Pi values > 0.02, and the first nine fragments were located in the LSC region, while the rest two located in the SSC region. Only two highly variable trnS-trnG and ndhF region (other region used in reference: rpl16, trnL-trnF, rbcL, rpl20-rps12) has been used to reconstruct the phylogeny of genus Rubus to date [18, 19, 21, 22, 37–39]. The highly variable regions detected by comparing entire chloroplast genomes may be useful markers for further phylogenetic study.
Fig. 5.
Sliding window analysis of the entire cp genome of eleven Rubus species (window length: 600 bp; step size: 200 bp). X-axis: position of the midpoint of a window; Y-axis: nucleotide diversity of each window
Synonymous (Ks) and nonsynonymous (Ka) substitution rate analysis
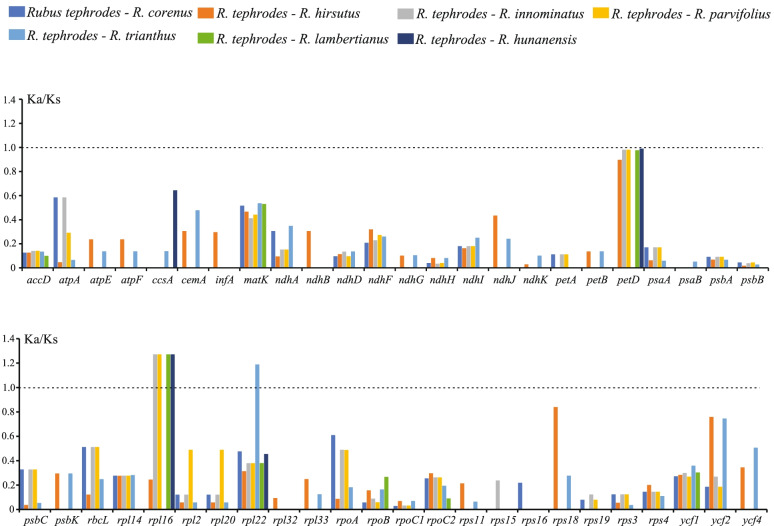
The ratios of nonsynonymous (Ka) vs synonymous (Ks) substitutions were calculated for shared unique protein coding genes (PCGs) in the eight Rubus cp genome, with R. tephrodes as the reference (Fig. 6, Table S2). Among 79 shared genes, 31 genes could not be calculated because no variation for identical sequences or without nonsyonymous or synonymous nucleotide substitution. Most of the Ka/Ks ratios were less than one, except rpl22 in R. trianthus (1.1892), rpl16 in R. innominatus (1.27177), R. parvifolius (1.27177), R. lambertianus (1.27177) and R. hunanensis (1.27177). The results consisted with expected for common sense that the Ka/Ks ratio of most gene is less than one [40]. The above results also indicated the two except genes (rpl16 and rpl22) are undergoing positive selection and some of mutation of the two genes in these species must be advantageous.
Fig. 6.
Ka/Ks values of protein-coding genes of the seven comparative combinations. Ka, nonsynonymous; Ks, synonymous
SSR polymorphisms and long repeat structure
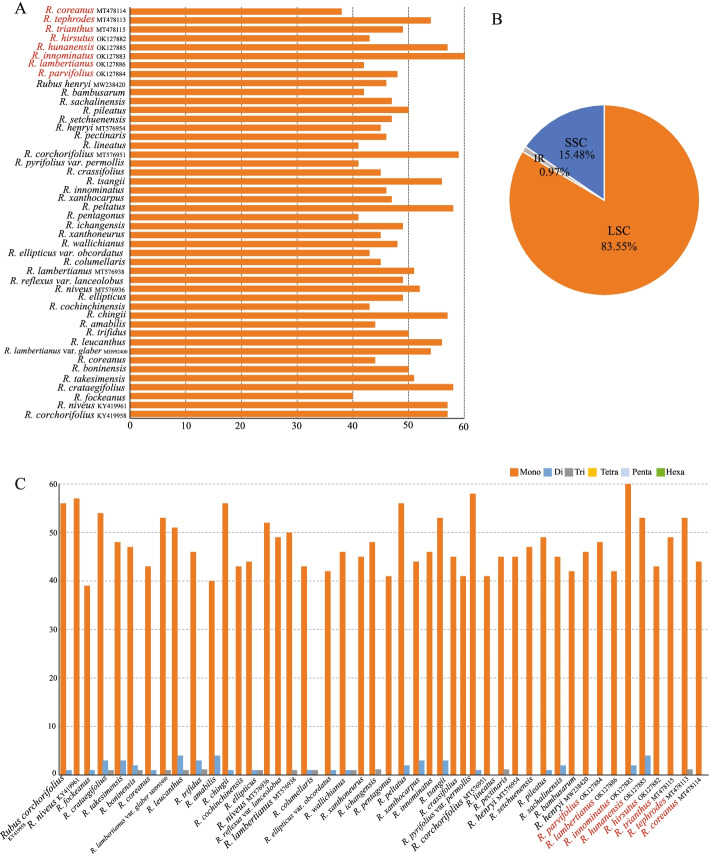
MISA was used to detect the total number of simple sequence repeats (SSRs) in totally 46 Rubus plastomes (Fig. 7, Table S3). Totally, 2243 SSRs were found in the 46 plastomes of Rubus, of which 3621 SSRs (83.55%) located in the LSC region, 671 SSRs (15.48%) were in the SSC region, and 42 SSRs (.097%) were in the IR region. The number of SSRs detected among the 46 species ranged from 38 (R. parvifolius) to 63 (R. trianthus) (Table S4). The mononucleotide repeat units were the most identified SSRs. A/T were the most abundant repeats, while AT/TA and AAT/TAA repeats were most found in the dinucleotide and trinucleotide types, respectively. The SSR results showed that A/T repeats were common in the cp genomes, and are consistent with the results of previous studies [35, 41–43]. The SSRs may be potential specific molecular markers to use in genetic diversity and phylogenetic studies for Rubus and its related species.
Fig. 7.
Number and type of simple sequence repeats in the 46 Rubus cp genome. A, Total number of SSRs detected in each species. B, Frequencies of identified SSRs in the large single-copy (LSC), small single-copy (SSC), and inverted repeat (IR) regions. C, Numbers and types of SSRs detected in each species
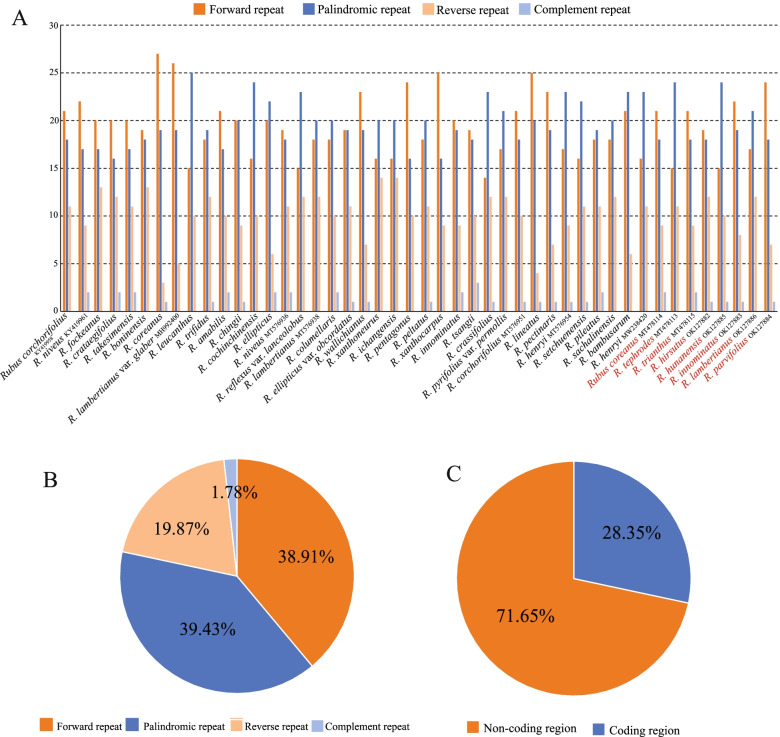
In total, 2300 long repeat structures were identified in the 46 plastomes (Fig. 8, Table S5), which including 895 (38.91%) forward repeats, 907 (39.43%) palindromic repeats, 457 (19.87%) reverse repeats and 41 (1.78%) complement repeats, respectively. Most of these repeats (1648, 71.65%) were distributed in the non-coding regions.
Fig. 8.
Number and type of long repeat sequences in the 46 Rubus cp genome. A, Numbers and types of longer repeats in each species. B, Frequency of each repeat type. C, Presence of longer repeats in coding regions and non-coding regions
Phylogenetic analyses
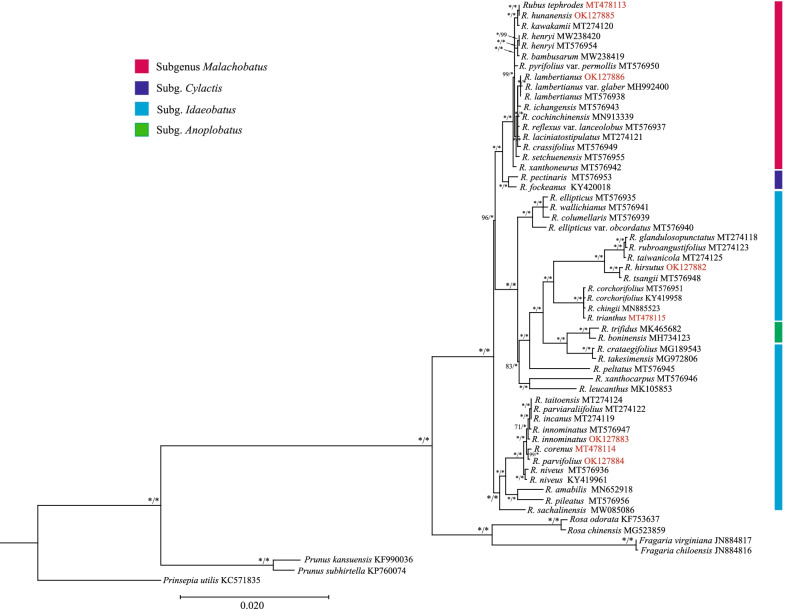
Fifty-one Rubus chloroplast genome and other seven plastomes of Rosaceae were used to examine the usability of the chloroplast genome in phylogeny analysis. The maximum likelihood (ML) tree constructed with RaxML and Bayesian inference (BI) tree contructed by MrBayes was topologically congruent and highly supported (Fig. 9). The relationship of the tribe below Rosaceae was congruent with previously reported results [25]. The tree also strongly supported the monophyly of the genus Rubus. The Rubus clade showed that some species of Idaeobatus were likely the original taxa and the polyploidy group may have originated from those primitive species. Other sections of the tree may have evolved from these taxa via different evolutionary events. The main objective of our study was to test the discriminatory power of the chloroplast genome sequences in genus Rubus. Additional studies with broader sampling strategies are needed to test the efficiency of the regions identified by our study to clarify the phylogeny of genus Rubus.
Fig. 9.
The maximum likelihood (ML) and Bayesian inference (BI) phylogenetic tree based on whole chloroplast genome data. The support values (bootstrap value [BS]/posterior probability [PP]) are indicated at the branches. BS and PP of 100% are indicated by an asterisk
Materials and methods
Material sampling, DNA isolation, and sequencing
Here, eight species, Rubus tephrodes, R. coreanus, R. trianthus, R. lambertianus, R. hirsutus, R. parvifolius, R. hunanensis and R. innominatus were chosen for sequencing based on their special taxonomic status, their absence or not well assembled in the NCBI. Young, disease-free leaves of wild seedlings were collected and quickly dried with silica gel (Table 3). Voucher specimens were collected for each species and deposited in the herbarium of Huanggang Normal University (formerly, Herbarium of Biology Department of Huanggang Teachers College, HGTC). The specimens were identified by prof. Hongjin Dong (Huanggang Normal University) before deposited. The total genomic DNA was extracted from the leaf tissues using the CTAB method [44] with minor modifications and stored at − 80 °C. The total genomic DNA were sheared into fragments of about 300 bp to construct libraries according to manufacturer’s instructions (Illumina, Hayward, CACA, USA). Sequencing was performed on the Illumina HiSeq 2500 Sequencing System at BGI-Wuhan.
Table 3.
Sampled species and their voucher specimens used in this study
| Species | Voucher Specimen | Coordinate | Location |
|---|---|---|---|
| Rubus tephrodes Hance |
HGTC HGNU-0024 |
E 115°47′55.77″, N 31°05′32.68″ |
China, Hubei, Yingshan |
| R. coreanus Miq. |
HGTC HGNU-0194 |
E 114°47′05.06″, N 29°58′58.17″ |
China, Hubei, Daye |
| R. trianthus Focke |
HGTC HGNU-0301 |
E 115°51′09.30″, N 30°14′10.36″ |
China, Hubei, Huangmei |
| R. lambertianus Ser. |
HGTC HJD1379 |
E 115°48′59.05″, N 31°6′54.67″ |
China, Hubei, Yingshan |
| R. hirsutus Thunb. |
HGTC HJD1113 |
E 114°36′51.64″, N 31°34′16.25” |
China, Hubei, Hong’an |
| R. parvifolius L. |
HGTC HJD1006 |
E 115°4′52.01″, N 30°29′46.26” |
China, Hubei, Xishui |
| R. hunanensis Hand. - Mazz. |
HGTC HJD1069 |
E 116°1′7.42″, N 30°57′51.44” |
China, Hubei, Yingshan |
| R. innominatus S. Moore |
HGTC HJD1054 |
E 116°2′52.85″, N 30°58′20.62” |
China, Hubei, Yingshan |
Chloroplast genome assembly and annotation
Raw data with adapter sequences or low-quality sequences was filtered by SOAPnuke software developed by BGI [45]. Then, the high-quality PE reads were used for subsequent analyses. The chloroplast genome was de novo assembled in the GetOrganelle pipeline (http://github.com/Kinggerm/GetOrganelle; [46]). The output graphs file “gfa” was checked in Bandage v. 0.8.1 [47] and the finally sequence paths were selected when the minimum depth of contigs above 100 × and the minimum length > 300 bp. To validate the assembled cp sequence error, raw sequencing reads were mapped to the assembled plastomes using the Bowite2 [48] plug-in in Geneious ver 8.0.2 [48]. The assembled cp genome sequence of the eight Rubus samples was annotated using Perl script of PGA [49]. The annotated results were summarized and the final annotations were manually checked using Geneious ver.8.0.2 [48]. The assembly and annotation were completed by mapping the reported plastomes of other well-annotated Rubus species. The whole cp sequence with annotated information was submitted to GenBank with accession numbers MT478113-MT478115 and OK127882- OK127886. The physical map of the annotated cp genomes was drawn using the online program OGDRAW [50].
Comparative Plastome sequence divergence analysis
Gene order comparison of newly-assembled Rubus plastomes were performed using the Mauve v.1.0.0 [51] plugin in Geneious v.8.0.2 [48]. We compared the completed plastomes of the eight Rubus using mVISTA in Shuffle-LAGAN mode [52] with R. tephrodes as the reference. In order to compare the inverted repeated region (IR) contraction or expansion, the detailed information of the boundaries between IR and single copy region (SC) regions were manually obtained in Geneious [48]. The chloroplast genome sequence data sets used for final analysis were aligned using the Windows version of MAFFT [53]. The output data matrix was visualized and manually edited using Geneious [48] or BioEdit [54]. The nucleotide diversity (Pi) of the plastome sequence was calculated using DnaSP v. 6.10 [55], with respect to the whole cp genomes. We used a step size of 200 bp and window length of 800 bp for sliding window analysis.
Gene selective pressure analysis of eight Rubus cp PCGs
To analysis variation in the evolutionary rates of chloroplast genes, the the Ka_Ks Calculator program Caculator 2.0 was used to calculate the nonsynonymous substitution rates (Ka), synonymous rates (Ks), and their ratios (Ka/Ks). Before calculating, the shared unique protein coding gene sequences (PCGs) was aligned in MEGA [56] (version 10.1.6) by mode of MUSCLE (codons). The gene data matrix was then saved as Clustal (.aln) or Phylip (.phy) format.
Simple sequence repeats and repeat structure analysis
The Perl script MISA [57] was used to identify microsatellites (mono-, di-, tri-, tetra-, penta-, hexanucleotide repeats), with the following parameters (unit size, min repeats): 10 for mononucleotide, 5 for dinucleotide, 4 for trinucleotide, and 3 for tetra-, penta-, and hexanucleotide. The online REPuter program was used to detect four types of long repeat sequences (forward, reverse, palindromic and complement) in Rubus plastomes with a hamming distance of 3 and a minimum repeat size of 30 bp [58].
Phylogenetic analyses
The newly assembled cp genome of Rubus and relative taxa were downloaded from NCBI and then aligned with MAFFT for phylogenetic analysis [53]. Finally, fifty-eight plastomes were used to construct the phylogeny tree (Table S3). RAxML (Version 8 for Windows) was used to run maximum likelihood (ML) analysis [59] with a bootstrap value of 1000. The general time-reversible (GTR) model with a gamma model was used at normal settings to determine the rate of heterogeneity. The Bayesian inference (BI) tree was generated in MrBayes version 3.2 [60] as implemented on the Cyberinfrastructure for Phylogenetic Research (CIPRES) Science Gateway (http://www.phylo.org/, [61]) using the default settings. The best model was determined for each sequence partition, after comparisons among 24 models of nucleotide substitution using jModeltest v.2.1.10 [62]. Figtree v1.4 [63] was used to visualize and adjust the ML trees. The graph generated from Figtree was further revised with Adobe Illustrator (Adobe Systems, Mountain View, CA, USA).
Conclusions
The complete chloroplast sequences of Rubus tephrodes, R. coreanus, and R. trianthus, R. lambertianus, R. hirsutus, R. parvifolius, R. hunanensis and R. innominatus of the section Lampobatus, and Idaeobatus were reported in this study. The comparison analysis of fouty-six Rubus plastomes indicated that the structure was relatively conserved. However, the SSC-IR and LSC-IR edges were variable among the chloroplast genomes and the IR region was less varied than the SC region. We identified the location of the SSR sites and highly changeable regions, which may be used as markers in future studies of the Rubus species. The ML and BI phylogenetic tree constructed from whole chloroplast sequences illustrated the phylogenetic relationship and was consistent with the results of previous studies. Our results indicate that the whole plastome may be used as a reliable marker in phylogenetic studies of this genus.
Supplementary Information
Additional file 1: Table S1. Genes with introns in the cp genomes of Rubus as well as the lengths of the exons and introns.
Additional file 2: Table S2. Synonymous (Ks) and nonsynonymous (Ka) analysis of the eight species based on shared unique CDS genes, with Rubus tephrodes as the reference.
Additional file 3: Table S3. Taxonomic and accession information for samples used in the study.
Additional file 4: Table S4. Statistics of simple sequence repeats in each species of Rubus. (XLSX 116 kb)
Additional file 5: Table S5. Statistics of longer repeats in each species of Rubus. (XLSX 94 kb)
Additional file 6: Figure S1. The comparison of four regions (LSC, SSC and two IRs) among twelve cp genome.
Acknowledgments
We would like to thank the editors and reviewers for their comments and suggestions.
Authors’ contributions
Conceptualization, J.Y. and J.D.; methodology, J.Y.; software, J.Y.; validation and formal analysis, J.Y. and J.D.; investigation and resources, J.F., Y.F., J.X. and J.D.; data curation, J.Y. and J.F.; writing—original draft preparation, J.Y. and J.D.; writing—review and editing, J.Y., Y.F. and J.D.; supervision, J.Y. and J.D.; project administration, J.Y. and J.D.; funding acquisition, J.D.. All authors read and approved the final manuscript.
Funding
This research was funded by the National Science and Technology Fundamental Resources Investigation Program of China, grant number 2019FY101809.
Availability of data and materials
The complete chloroplast genome sequences for the newly assembled eight Rubus species are available at GenBank: MT478113-MT478115 and OK127882- OK127886. Raw sequencing reads used in this study were deposited in the GenBank database of Sequence Read Archive (Detailed information was listed in Table S2).
Declarations
Ethics approval and consent to participate
Not applicable. No specific permits were required for the collection of specimens for this study. This research was carried out in compliance with the relevant laws of China.
Consent for publication
Not applicable.
Competing interests
The authors declare no conflict of interest.
Footnotes
Publisher’s Note
Springer Nature remains neutral with regard to jurisdictional claims in published maps and institutional affiliations.
References
- 1.Lu LD, Boufford D. Rubus Linnaeus, Sp. P1. 1:492. 1753. Flora of China. 2003;9:195–285. [Google Scholar]
- 2.Zhang SD. Notes on Rubus subsect. Lineati from China. Plant Sci J. 2012;30(3):301–304. [Google Scholar]
- 3.Zhang YJ, Qiao D, Ma JX, Wang HC. Two newly recorded species of Rubus (Rosaceae) from China. Acta Botan Boreali-Occiden Sin. 2017;37(4):805–808. [Google Scholar]
- 4.Wang HC, Ma JX, He ZR. Rubus pseudoswinhoei (Rosaceae), a distinct new species from Yunnan, Southwest China. Phytotaxa. 2016;261(2):147–156. [Google Scholar]
- 5.Wang HC, Zhang RZ, Liang ZL, He ZR. A new species and two new synonyms in Chinese Rubus (Rosaceae) Ann Bot Fenn. 2017;54(1–3):105–109. [Google Scholar]
- 6.Xiong XH, Ju WB, Zhang C, Li JC, Gao XF. Rubus huagaoxiensis and R. lingtianus (Rosaceae), two new species from Sichuan, China. Phytotaxa. 2019;400(1):14–22. [Google Scholar]
- 7.Huang JY, Hu JM. Revision of Rubus (Rosaceae) in Taiwan. Taiwania. 2009;54(4):285–310. [Google Scholar]
- 8.Sun Y, Boufford DE. Rubus naruhashii (Rosaceae), a new name for R. clivicola E. Walker. J Japanese Bot. 2012;87:135–136. [Google Scholar]
- 9.Wang HC, He ZR, Sun H. Rediscoveries of two species of Rubus (Rosaceae) in China. Guihaia. 2012;32(3):315–317. [Google Scholar]
- 10.Wang HC, Wang YH, Sun H. Nomenclatural changes in Rubus (Rosaceae) mostly from China. Phytotaxa. 2013;114:58–60. [Google Scholar]
- 11.Wang HC, Sun H. Rubus tetsunii, a replacement name for the Chinese R. lobatus T. T. Yu & L. T. Lu (Rosaceae) Phytotaxa. 2013;79:63–64. [Google Scholar]
- 12.Wang HC. Two replacement names in Asian Rubus (Rosaceae) Phytotaxa. 2014;172:293–296. [Google Scholar]
- 13.Alice L, Campbell C. Phylogeny of Rubus (Rosaceae) based on nuclear ribosomal DNA internal transcribed spacer region sequences. Am J Bot. 1999;86(1):81–97. [PubMed] [Google Scholar]
- 14.Thompson MM. Survey of chromosome numbers in Rubus (Rosaceae: Rosoideae) Ann Mo Bot Gard. 1997;84(1):128–164. [Google Scholar]
- 15.Focke WO. Monographiae Generis Rubi Prodromus part I. New York: NY: Stuttgart,E. Schweizerbart; 1910. Species Ruborum; pp. 1–120. [Google Scholar]
- 16.Focke WO. Monographiae Generis Rubi Prodromus part II. New York: NY: Stuttgart,E. Schweizerbart; 1911. Species Ruborum; pp. 121–223. [Google Scholar]
- 17.Focke WO. Monographiae Generis Rubi Prodromus part III. New York: NY: Stuttgart,E. Schweizerbart; 1914. Species Ruborum; pp. 224–498. [Google Scholar]
- 18.Yang JY, Pak JH. Phylogeny of korean Rubus (rosaceae) based on ITS (nrDNA) and trnL/F intergenic region (cpDNA) J Plant Biol. 2006;49(1):44–54. [Google Scholar]
- 19.Alice LA, Dodson TM, Sutherland BL. Diversity and relationships of Bhutanese Rubus (Rosaceae) Acta Hortic. 2008;777(777):63–70. [Google Scholar]
- 20.Sochor M, Vašut RJ, Sharbel TF, Trávnícek B. How just a few makes a lot: speciation via reticulation and apomixis on example of European brambles (Rubus subgen. Rubus, Rosaceae) Mol Phylogenet Evol. 2015;89:13–27. doi: 10.1016/j.ympev.2015.04.007. [DOI] [PubMed] [Google Scholar]
- 21.Li Z, Wang Y, Chen Q, Luo Y, Zhang Y, Tang HR, Wang XR, University SA Phylogenetic utility of Chinese Rubus (Rosaceae) based on ndhF sequence. Acta Horticulturae Sinica. 2015;42(1):19–30. [Google Scholar]
- 22.Morden CW, Gardner DE, Weniger DA. Phylogeny and biogeography of pacific Rubus subgenus Idaeobatus (Rosaceae) species: investigating the origin of the endemic Hawaiian raspberry R. macraei. Pac Sci. 2003;57(2):181–197. [Google Scholar]
- 23.Yang JY, Pak JH, Kim SC. The complete chloroplast genome sequence of Korean raspberry Rubus crataegifolius (Rosaceae) Mitochondrial DNA Part B. 2017;2(2):793–794. doi: 10.1080/23802359.2017.1398621. [DOI] [PMC free article] [PubMed] [Google Scholar]
- 24.Chen Q, Wang Y, Sun B, Chen T, Luo Y, Zhang Y, Wang XR, Tang HR. The complete chloroplast genome sequence of Rubus coreanus, an excellent diseases-resistant resource. Mitochondrial DNA Part B. 2019;4(1):216–217. [Google Scholar]
- 25.Guo W, Chen YZ, Deng L, Wu W. The complete chloroplast genome sequence of Rubus leucanthus Hance (Rosaceae) Mitochondrial DNA Part B. 2019;4(1):376–377. [Google Scholar]
- 26.Chen Q, Wang Y, Wang XR, Tang HR. The complete chloroplast genome sequence of Rubus lambertianus var. glaber: sequence divergence and phylogenetic application. Mitochondrial DNA Part B. 2020;5(2):1261–1262. [Google Scholar]
- 27.Chen Y, Guo W, Wang LY, Wu W, Li YQ. The complete chloroplast genome sequence of Rubus cochinchinensis. Mitochondrial DNA Part B. 2020;5:1636–1637. [Google Scholar]
- 28.Wang QR, Yu SS, Gao CS, Ge YQ, Cheng RB. The complete chloroplast genome sequence and phylogenetic analysis of the medicinal plant Rubus chingii Hu. Mitochondrial DNA Part B. 2020;5(2):1307–1308. [Google Scholar]
- 29.Yang F, Zhang ZH, Tong L. The complete chloroplast genome sequence of Rubus amabilis Focke. Mitochondrial DNA Part B. 2020;5(2):1975–1976. doi: 10.1080/23802359.2023.2168113. [DOI] [PMC free article] [PubMed] [Google Scholar]
- 30.Yang JY, Pak JH, Kim SC. The complete plastome sequence of Rubus takesimensis endemic to Ulleung Island, Korea: insights into molecular evolution of anagenetically derived species in Rubus (Rosaceae) Gene. 2018;668:221–228. doi: 10.1016/j.gene.2018.05.071. [DOI] [PubMed] [Google Scholar]
- 31.Yang JY, Chiang YC, Hsu TW, Kim SH, Pak JH, Kim SC. Characterization and comparative analysis among plastome sequences of eight endemic Rubus (Rosaceae) species in Taiwan. Sci Rep. 2021;11(1):1152. doi: 10.1038/s41598-020-80143-1. [DOI] [PMC free article] [PubMed] [Google Scholar]
- 32.Genome [ https://www.ncbi.nlm.nih.gov/].
- 33.Asano T, Tsudzuki T, Takahashi S, Shimada H, Kadowaki K-I. Complete nucleotide sequence of the sugarcane ( Saccharum Officinarum ) chloroplast genome: a comparative analysis of four monocot chloroplast genomes. DNA Res. 2004;11(2):93–99. doi: 10.1093/dnares/11.2.93. [DOI] [PubMed] [Google Scholar]
- 34.Souza U, Nunes R, Targueta C, Diniz-Filho JA, Telles M. The complete chloroplast genome of Stryphnodendron adstringens (Leguminosae - Caesalpinioideae): comparative analysis with related Mimosoid species. Sci Rep. 2019;9:14206. doi: 10.1038/s41598-019-50620-3. [DOI] [PMC free article] [PubMed] [Google Scholar]
- 35.Jeon JH, Kim SC. Comparative analysis of the complete chloroplast genome sequences of three closely related east-Asian wild roses (Rosa sect. Synstylae; Rosaceae) Genes. 2019;10(1):23. doi: 10.3390/genes10010023. [DOI] [PMC free article] [PubMed] [Google Scholar]
- 36.Zhang SD, Jin JJ, Chen SY, Chase MW, Soltis DE, Li HT, Yang JB, Li DZ, Yi TS. Diversification of Rosaceae since the late cretaceous based on plastid phylogenomics. New Phytol. 2017;214(3):1355–1367. doi: 10.1111/nph.14461. [DOI] [PubMed] [Google Scholar]
- 37.Wang Y, Chen Q, Chen T, Tang HR, Liu L, Wang XR. Phylogenetic insights into Chinese Rubus (Rosaceae) from multiple chloroplast and nuclear DNAs. Front Plant Sci. 2016;7(6):968. doi: 10.3389/fpls.2016.00968. [DOI] [PMC free article] [PubMed] [Google Scholar]
- 38.Imanishi H, Tsuyuzaki H, Nakahara K. Genetic relationships among native and introduced Rubus species in Japan based on rbcL sequence. Acta Hortic. 2008;769(769):195–199. [Google Scholar]
- 39.Michael K. Clarification of basal relationships in Rubus (Rosaceae) and the origin of Rubus chamaemorus. BowlingGreen: WesternKentuckyUniversity; 2020. [Google Scholar]
- 40.Makalowski W, Boguski MS. Evolutionary parameters of the transcribed mammalian genome: an analysis of 2,820 orthologous. Proc Natl Acad Sci U S A. 1998;95(16):9407–9412. doi: 10.1073/pnas.95.16.9407. [DOI] [PMC free article] [PubMed] [Google Scholar]
- 41.Somaratne Y, Guan DL, Wang WQ, Zhao L, Xu SQ. Complete chloroplast genome sequence of Xanthium sibiricum provides useful DNA barcodes for future species identification and phylogeny. Plant Syst Evol. 2019;305(10):949–60.
- 42.Li XQ, Zuo YJ, Zhu XX, Liao S, Ma JS. Complete chloroplast genomes and comparative analysis of sequences evolution among seven Aristolochia (Aristolochiaceae) medicinal species. Int J Mol Sci. 2019;20(5):1045. doi: 10.3390/ijms20051045. [DOI] [PMC free article] [PubMed] [Google Scholar]
- 43.Gao BM, Yuan L, Tang TL, Hou J, Pan K, Wei N. The complete chloroplast genome sequence of Alpinia oxyphylla Miq. And comparison analysis within the Zingiberaceae family. PLoS One. 2019;14(6):e0218817. doi: 10.1371/journal.pone.0218817. [DOI] [PMC free article] [PubMed] [Google Scholar]
- 44.Doyle JJ, Doyle JL. A rapid DNA isolation procedure for small quantities of fresh leaf tissue. Phytochemical Bull. 1987;19(1):11–15. [Google Scholar]
- 45.Chen Y, Chen Y, Shi C, Huang Z, Zhang Y, Li S, Li Y, Ye J, Yu C, Li Z. SOAPnuke: a MapReduce acceleration-supported software for integrated quality control and preprocessing of high-throughput sequencing data. Gigascience. 2018;7(1):1–6. doi: 10.1093/gigascience/gix120. [DOI] [PMC free article] [PubMed] [Google Scholar]
- 46.Jin JJ, Yu WB, Yang JB, Song Y, dePamphilis C, Yi TS, Li DZ. GetOrganelle: a fast and versatile toolkit for accurate de novo assembly of organelle genomes. Genome Biol. 2020;21(1):241. doi: 10.1186/s13059-020-02154-5. [DOI] [PMC free article] [PubMed] [Google Scholar]
- 47.Langmead B, Salzberg SL. Fast gapped-read alignment with bowtie 2. Nat Methods. 2012;9(4):357–359. doi: 10.1038/nmeth.1923. [DOI] [PMC free article] [PubMed] [Google Scholar]
- 48.Matthew K, Richard M, Amy W, Steven SH, Matthew C, Shane S, Simon B, Alex C, Sidney M, Chris D. Geneious basic: an integrated and extendable desktop software platform for the organization and analysis of sequence data. Bioinformatics. 2012;28(12):1647–1649. doi: 10.1093/bioinformatics/bts199. [DOI] [PMC free article] [PubMed] [Google Scholar]
- 49.Qu XJ, Moore MJ, Li DZ, Yi TS. PGA: a software package for rapid, accurate, and flexible batch annotation of plastomes. Plant Methods. 2019;15(1):1–12. doi: 10.1186/s13007-019-0435-7. [DOI] [PMC free article] [PubMed] [Google Scholar]
- 50.Marc L, Oliver D, Sabine K, Ralph B. OrganellarGenomeDRAW--a suite of tools for generating physical maps of plastid and mitochondrial genomes and visualizing expression data sets. Nucleic Acids Res. 2013;41:575–581. doi: 10.1093/nar/gkt289. [DOI] [PMC free article] [PubMed] [Google Scholar]
- 51.Darling ACE, Blattner FR, Perna NT. Mauve: multiple alignment of conserved genomic sequence with rearrangements. Genome Res. 2004;14(7):1394–1403. doi: 10.1101/gr.2289704. [DOI] [PMC free article] [PubMed] [Google Scholar]
- 52.Frazer KA, Pachter L, Poliakov A, Rubin EM, Dubchak I. VISTA: computational tools for comparative genomics. Nucleic Acids Res. 2004;32(suppl_2):W273–W279. doi: 10.1093/nar/gkh458. [DOI] [PMC free article] [PubMed] [Google Scholar]
- 53.Kazutaka K, Standley DM. MAFFT multiple sequence alignment software version 7: improvements in performance and usability. Mol Biol Evol. 2013;30(4):772–780. doi: 10.1093/molbev/mst010. [DOI] [PMC free article] [PubMed] [Google Scholar]
- 54.Hall TA. BioEdit: a user-friendly biological sequence alignment editor and analysis program for windows 95/98/NT. Nucleic Acids Symp Ser. 1999;41:95–98. [Google Scholar]
- 55.Rozas J, Sánchez-DelBarrio JC, Messeguer X, Rozas R. DnaSP, DNA polymorphism analyses by the coalescent and other methods. Bioinformatics. 2003;19(18):2496–2497. doi: 10.1093/bioinformatics/btg359. [DOI] [PubMed] [Google Scholar]
- 56.Tamura K, Stecher G, Peterson D, Filipski A, SK MEGA6: molecular evolutionary genetics analysis version 6.0. Mol Biol Evol. 2013;30(12):2725–2729. doi: 10.1093/molbev/mst197. [DOI] [PMC free article] [PubMed] [Google Scholar]
- 57.Thiel T, Michalek W, Varshney RK, Graner A. Exploiting EST databases for the development and characterization of gene-derived SSR-markers in barley (Hordeum vulgare L.) Tag Theor Appl Genetics. 2003;106(3):411–422. doi: 10.1007/s00122-002-1031-0. [DOI] [PubMed] [Google Scholar]
- 58.Stefan K, Choudhuri J, Enno O, Schleiermacher C, Stoye J, Giegerich R. REPuter: the manifold applications of repeat analysis on a genomic scale. Nucleic Acids Res. 2001;29(22):4633–4642. doi: 10.1093/nar/29.22.4633. [DOI] [PMC free article] [PubMed] [Google Scholar]
- 59.Stamatakis A. RAxML version 8: a tool for phylogenetic analysis and post-analysis of large phylogenies. Bioinformatics. 2014;30(9):1312–1313. doi: 10.1093/bioinformatics/btu033. [DOI] [PMC free article] [PubMed] [Google Scholar]
- 60.Ronquist F, Teslenko M, van der Mark P, Ayres DL, Darling A, Höhna S, Larget B, Liu L, Suchard MA, Huelsenbeck JP. MrBayes 3.2: efficient Bayesian phylogenetic inference and model choice across a large model space. Syst Biol. 2012;61(3):539–542. doi: 10.1093/sysbio/sys029. [DOI] [PMC free article] [PubMed] [Google Scholar]
- 61.Miller MA, Pfeiffer WT, Schwartz T. Creating the CIPRES Science Gateway for Inference of Large Phylogenetic Trees. In: Gateway Computing Environments Workshop (GCE). New Orleans; 2010. p. 1–8. 10.1109/GCE.2010.5676129.
- 62.Darriba D, Taboada GL, Doallo R, Posada D. jModelTest 2: more models, new heuristics and parallel computing. Nat Methods. 2012;9(8):772. doi: 10.1038/nmeth.2109. [DOI] [PMC free article] [PubMed] [Google Scholar]
- 63.Rambaut A. Institute of Evolutionary Biology University of Edinburgh. 2009. FigTree, a graphical viewer of phylogenetic trees. [Google Scholar]
Associated Data
This section collects any data citations, data availability statements, or supplementary materials included in this article.
Supplementary Materials
Additional file 1: Table S1. Genes with introns in the cp genomes of Rubus as well as the lengths of the exons and introns.
Additional file 2: Table S2. Synonymous (Ks) and nonsynonymous (Ka) analysis of the eight species based on shared unique CDS genes, with Rubus tephrodes as the reference.
Additional file 3: Table S3. Taxonomic and accession information for samples used in the study.
Additional file 4: Table S4. Statistics of simple sequence repeats in each species of Rubus. (XLSX 116 kb)
Additional file 5: Table S5. Statistics of longer repeats in each species of Rubus. (XLSX 94 kb)
Additional file 6: Figure S1. The comparison of four regions (LSC, SSC and two IRs) among twelve cp genome.
Data Availability Statement
The complete chloroplast genome sequences for the newly assembled eight Rubus species are available at GenBank: MT478113-MT478115 and OK127882- OK127886. Raw sequencing reads used in this study were deposited in the GenBank database of Sequence Read Archive (Detailed information was listed in Table S2).


