

Abstract
OBJECTIVE
To evaluate whether prestroke glucose control is associated with functional outcomes in patients with acute large vessel occlusive stroke and diabetes who underwent intra-arterial thrombectomy (IAT).
RESEARCH DESIGN AND METHODS
From the Clinical Research Center for Stroke–Korea registry, we included patients with emergent large vessel occlusive stroke with diabetes who underwent IAT between January 2009 and March 2020. The association between the HbA1c level at admission and functional outcomes (modified Rankin Scale at 3 months after the index stroke) was assessed.
RESULTS
A total of 1,351 patients were analyzed. Early neurological deterioration was more common in patients with higher levels of HbA1c at admission (P = 0.02 according to HbA1c quintiles, P = 0.003 according to an HbA1c cutoff value of 7.0%) than in those with lower HbA1c levels. Higher HbA1c levels at admission were significantly associated with decreased odds of favorable functional outcomes at a threshold of 7.0–7.1%. The association was consistently observed in subgroups divided according to age, sex, stroke subtype, occlusion site, degree of recanalization, thrombolysis modalities, time from symptom onset to groin puncture, and treatment period.
CONCLUSIONS
Prestroke glucose control with a target HbA1c of ≤7.0% may be beneficial for neurological recovery in patients with diabetes undergoing IAT for large vessel occlusive stroke, regardless of stroke subtype, bridging intravenous thrombolysis, occlusion site, degree of recanalization, and treatment period.
Introduction
Hyperglycemia during the acute stroke period is associated with infarct progression, symptomatic hemorrhage, and decreased recanalization after recombinant tissue plasminogen activator administration and, thus, results in poor functional outcomes (1–3). Higher levels of glycated hemoglobin (HbA1c) increase the risk of neurological deterioration, mortality, and poor neurological recovery after ischemic stroke (4). In patients with emergent large vessel occlusive stroke treated with endovascular recanalization therapy, both acute hyperglycemia and higher levels of HbA1c were associated with decreased odds of favorable outcomes (5–8).
While these studies provided crucial information on the importance of glucose levels in stroke, most of the study populations consisted of patients without diabetes. As a result, the reference group in those studies consisted of a population without diabetes, and the effect of prestroke glucose control on clinical outcomes in patients with diabetes and ischemic stroke, especially in those with acute large vessel occlusive stroke, could not be properly evaluated.
The purpose of this study was to evaluate whether prestroke glucose control, measured by the level of HbA1c at admission, is associated with functional outcomes in patients with acute large vessel occlusive stroke and diabetes after undergoing intra-arterial thrombectomy (IAT). We also evaluated whether the association is different according to each prespecified subgroup.
Research Design and Methods
We analyzed the data of patients in the stroke registry of the Clinical Research Center for Stroke in Korea (CRCS-K). The CRCS-K is a prospective, web-based, multicenter registry of patients with stroke admitted to participating hospitals since 2008. The registry is used for the development of a stroke prevention strategy and stroke recurrence prediction model. Data regarding demographics, vascular risk factors, stroke location and angiographic findings, in-hospital management, etiology workup, laboratory results, and functional outcome were prospectively collected according to a standardized protocol (9). All participating centers obtained approval from their local institutional review boards for data collection.
We included patients with acute large vessel occlusive stroke and diabetes who underwent endovascular recanalization therapy in the participating centers between January 2009 and March 2020. Patients without information on HbA1c at admission and functional outcome at 3 months were excluded.
Postthrombectomy Management of Blood Pressure and Glucose
Treating physicians at the participating centers of the CRCS-K followed guideline recommendations and expert opinion in clinical practice (10,11). Blood pressure (BP) was controlled to be <180/105 mmHg for 24 h after intravenous thrombolysis (IVT). After successful recanalization (thrombolysis in cerebral infarction [TICI] ≥2b) postmechanical thrombectomy, maintaining systolic BP (SBP) <140 or 160 mmHg (this level was chosen per the treating physician’s discretion) was recommended to reduce the risk of reperfusion injury. Maintaining BP <180/105 mmHg was permitted in the event of a failed recanalization to maintain cerebral perfusion through collateral circulation. Blood glucose was controlled with a target between 140 and 180 mg/dL, and hypoglycemia was avoided (<60 mg/dL).
Covariates and Outcomes
The following data were obtained from the registry: 1) age, sex, initial stroke severity, and educational level; 2) vascular risk factors, including history of stroke, coronary heart disease, hypertension, smoking, and atrial fibrillation; 3) stroke subtype according to the Trial of ORG 10172 in Acute Stroke Treatment (TOAST) criteria; 4) laboratory data, including white blood cell (WBC) count, hemoglobin, platelet, total cholesterol, and BP; 5) prior medications, including antiplatelet, anticoagulant, antihypertensive, lipid-lowering, and antidiabetic medications; 6) treatment modalities (IAT alone vs. IAT + IVT), time from symptom onset to groin puncture, endovascular procedure time, and degree of recanalization; and 7) functional outcomes measured by modified Rankin Scale (mRS) score at 3 months and early neurological deterioration (END), including stroke progression and symptomatic hemorrhage. A favorable functional outcome was defined as an mRS of ≤1 (disability free) at 3 months after the index stroke. Various functional outcomes, including mRS of ≤2 (functional independence) and mRS at 3 months after the index stroke, were also used in the analysis. mRS ranges from 0 to 6, with 0 indicating a lack of symptoms, 1 disability free, 2 to 3 needing some help but able to do daily activities, 4 to 5 unable to walk, or bedridden, and 6 death. END was defined as any neurological worsening within 3 weeks of the index stroke. Neurological worsening was defined as 1) an increment of ≥1 on National Institutes of Health Stroke Scale (NIHSS) items 1 (level of consciousness), 5, or 6 (motor) or 2) an increment of ≥2 on the NIHSS total score. Possible causes of END included stroke recurrence, stroke progression, symptomatic hemorrhagic transformation, and other; the detailed definitions of each component are described in a previous publication (9).
The study patients were classified into either five groups according to quintiles of HbA1c at admission (1st quintile ≤6.1% [43 mmol/mol], 2nd quintile >6.1–6.6% [43–49 mmol/mol], 3rd quintile >6.6–7.1% [49–54 mmol/mol], 4th quintile >7.1–7.9% [54–63 mmol/mol], 5th quintile >7.9% [63 mmol/mol]) or two groups according to a prespecified HbA1c cutoff value of 7.0% (≤7.0 vs. >7.0% [53 mmol/mol]). The relationships between the levels of HbA1c and procedure-related outcomes (procedure time and degree of recanalization) or clinical outcomes were evaluated.
Statistical Analysis
For the comparison of baseline characteristics according to HbA1c levels, a χ2 test or Fisher exact test was used for categorical variables, and independent t test or Mann-Whitney U test was used for continuous variables. Multivariable logistic regression analysis was performed to estimate the odds ratios (ORs) and 95% CIs for the association between prestroke glucose control and favorable functional outcomes. HbA1c at admission was entered into the model in quintiles or as a binary variable with a threshold of 7.0% (53 mmol/mol).
A sequential regression multiple imputation method was used to impute missing values, assuming missing at random as the missing mechanism. The following were chosen as the variables affecting an occurrence of missingness: age, sex, initial NIHSS, education level, prior mRS, HbA1c, stroke subtype, smoking status, risk factors (history of stroke, history of hypertension, and history of atrial fibrillation), laboratory findings (WBC, hemoglobin, platelet, total cholesterol, LDL, HDL, triglycerides, fasting serum glucose, and blood urea nitrogen), initial BP (SBP and diastolic BP), prior medication (antithrombotics, antihypertensives, lipid-lowering agents, and antidiabetic medications), occlusion site, onset to groin puncture time, degree of recanalization, procedure time, treatment modalities, and mRS at the 3rd month. The results were obtained from imputed data with 10 iterations to achieve convergence. The goodness-of-fit was evaluated using the Hosmer-Lemeshow test. Multiplicative interaction analyses were performed to evaluate the heterogeneity of the HbA1c level with reference to functional outcomes between each prespecified subgroup; the subgroups included age (<80, ≥80 years), sex, stroke subtype (large artery atherosclerosis, cardioembolism, other), occlusion site (anterior circulation, posterior circulation), degree of recanalization (TICI ≤2a, TICI ≥2b), thrombolysis modalities (IAT only, IAT + IVT), time from symptom onset to groin puncture (≤360 min, >360 min), and treatment period (before 2015, after 2015). All statistical analyses were performed using Stata 13.0 software (StataCorp, College Station, TX). All tests were two-sided, and P < 0.05 was considered significant.
Results
Among 26,646 patients with acute ischemic stroke and diabetes who visited the participating centers, 1,534 (5.8%) underwent IAT; of these, 60 patients without data on HbA1c at admission and 123 without functional outcome data were excluded. As a result, 1,351 patients were included in the analysis. The median age of the patients was 72.0 years (65.0–78.0), and 777 (57.5%) were men. Overall, the patients had a median (interquartile range) NIHSS score of 14.0 (9.0–18.0), and the mean ± SD HbA1c was 7.1 ± 1.4. The proportions of patients with a current smoker, quitter, and nonsmoker status were 20.1%, 13.8%, and 66.1%, respectively. The proportion of patients with diabetes diagnosed at admission was 184 (13.6%). Table 1 summarizes the baseline characteristics and variables of the patients according to HbA1c levels at admission. Generally, patients with higher HbA1c levels at admission were significantly younger and included a lower proportion of men than those with lower levels of HbA1c. Atrial fibrillation and hypertension were less prevalent among patients with a high HbA1c level. Patients with higher HbA1c had a higher prevalence of large artery atherosclerosis and a lower prevalence of cardioembolism.
Table 1.
Baseline characteristics of the patients according to HbA1c quintiles and a cutoff value of 7.0%
| HbA1c quintile | HbA1c cutoff | |||||||||
|---|---|---|---|---|---|---|---|---|---|---|
| Total | 1st (≤6.1%) | 2nd (>6.1–6.6%) | 3rd (>6.6–7.1%) | 4th (>7.1–7.9%) | 5th (>7.9%) | P value | ≤7.0% | >7.0% | P value | |
| Patients, n | 1,351 | 305 | 281 | 244 | 259 | 262 | 796 | 555 | ||
| Age (years) | 72 (65–78) | 76 (67– 80) | 73 (66–78) | 72 (65–78) | 72 (65–77) | 68 (60–75) | <0.001 | 74 (66–79) | 70 (62–77) | <0.001 |
| Male sex | 777 (57.5) | 148 (48.5) | 168 (59.8) | 140 (57.4) | 156 (60.2) | 165 (63.0) | 0.005 | 434 (54.5) | 343 (61.8) | 0.008 |
| Initial NIHSS | 14 (9–18) | 14 (10–18) | 15 (10–19) | 14 (9–18) | 13 (8–18) | 13 (8–18) | 0.077 | 14 (10–18) | 13 (8–18) | <0.001 |
| Premorbid mRS 0–1 | 1,133 (83.9) | 240 (78.7) | 245 (87.2) | 211 (86.5) | 224 (86.5) | 213 (81.3) | 0.016 | 667 (83.8) | 466 (84.0) | 0.933 |
| Education level (years) | 0.034 | <0.001 | ||||||||
| 0 | 147 (10.9) | 44 (14.4) | 34 (12.1) | 34 (13.9) | 18 (6.9) | 17 (6.5) | 112 (14.1) | 35 (6.3) | ||
| ≤12 (high school) | 1,027 (76.0) | 223 (73.1) | 211 (75.1) | 178 (73.0) | 203 (78.4) | 212 (80.9) | 581 (73.0) | 446 (80.4) | ||
| >12 (university) | 177 (13.1) | 38 (12.5) | 36 (12.8) | 32 (13.1) | 38 (14.7) | 33 (12.6) | 103 (12.9) | 74 (13.3) | ||
| Risk factor | ||||||||||
| Previous stroke | 298 (22.1) | 77 (25.2) | 66 (23.5) | 56 (23.0) | 56 (21.6) | 43 (16.4) | 0.129 | 194 (24.4) | 104 (18.7) | 0.014 |
| Coronary heart disease | 212 (15.7) | 42 (13.8) | 52 (18.5) | 32 (13.1) | 45 (17.4) | 41 (15.6) | 0.365 | 123 (15.5) | 89 (16.0) | 0.772 |
| Hypertension | 1,070 (79.2) | 258 (84.6) | 230 (81.9) | 193 (79.1) | 199 (76.8) | 190 (72.5) | 0.006 | 656 (82.4) | 414 (74.6) | <0.001 |
| Smoking | 0.016 | <0.001 | ||||||||
| No | 893 (66.1) | 215 (70.5) | 188 (66.9) | 158 (64.8) | 161 (62.2) | 171 (65.3) | 543 (68.2) | 350 (63.1) | ||
| Current | 272 (20.1) | 42 (13.8) | 50 (17.8) | 50 (20.5) | 66 (25.5) | 64 (24.4) | 132 (16.6) | 140 (25.2) | ||
| Quit | 186 (13.8) | 48 (15.7) | 43 (15.3) | 36 (14.8) | 32 (12.4) | 27 (10.3) | 121 (15.2) | 65 (11.7) | ||
| Atrial fibrillation | 647 (47.9) | 152 (49.8) | 155 (55.2) | 124 (50.8) | 128 (49.4) | 88 (33.6) | <0.001 | 414 (52.0) | 233 (42.0) | <0.001 |
| Diabetes diagnosed at admission | 184 (13.6) | 32 (10.5) | 46 (16.4) | 44 (18.0) | 29 (11.2) | 33 (12.6) | 0.04 | 113 (14.2) | 71 (12.8) | 0.46 |
| Occlusion site | 0.151 | 0.046 | ||||||||
| Anterior circulation | 1,176 (87.0) | 271 (88.9) | 251 (89.3) | 215 (88.1) | 215 (83.0) | 224 (85.5) | 705 (88.6) | 471 (84.9) | ||
| Posterior circulation | 175 (13.0) | 34 (11.1) | 30 (10.7) | 29 (11.9) | 44 (17.0) | 38 (14.5) | 91 (11.4) | 84 (15.1) | ||
| TOAST criteria | 0.003 | 0.001 | ||||||||
| LAD | 383 (28.3) | 82 (26.9) | 68 (24.2) | 68 (27.9) | 68 (26.3) | 97 (37.0) | 210 (26.4) | 173 (31.2) | ||
| CE | 655 (48.5) | 158 (51.8) | 154 (54.8) | 124 (50.8) | 116 (44.8) | 103 (39.3) | 419 (52.6) | 236 (42.5) | ||
| Others | 313 (23.2) | 65 (21.3) | 59 (21.0) | 52 (21.3) | 75 (29.0) | 62 (23.7) | 167 (21.0) | 146 (26.3) | ||
| Laboratory findings | ||||||||||
| WBC count (×109/L) | 8 (7–11) | 8 (6–10) | 8 (6–10) | 9 (7–11) | 9 (7–11) | 9 (7–11) | <0.001 | 8 (6–10) | 9 (7–11) | <0.001 |
| Hemoglobin (mg/dL) | 13 (12–15) | 13 (12–14) | 13 (12–15) | 13 (12–15) | 13 (12–15) | 14 (13–15) | <0.001 | 13 (12–15) | 14 (12–15) | <0.001 |
| Platelets (×109/L) | 212 (172–258) | 211 (168–261) | 210 (172–249) | 211 (169–257) | 213 (167–263) | 216 (183–261) | 0.410 | 211 (169–254) | 214 (176–263) | 0.013 |
| Total cholesterol (mg/dL) | 151 (128–182) | 149 (124–179) | 148 (129–177) | 149 (123–176) | 152 (130–176) | 163 (131–204) | <0.001 | 149 (126–177) | 156 (131–192) | <0.001 |
| LDL (mg/dL) | 90 (69–116) | 87 (69–114) | 88 (68–113) | 87 (66–112) | 90 (69–109) | 99 (73–133) | <0.001 | 87 (68–112) | 95 (71–123) | <0.001 |
| HDL (mg/dL) | 42 (35–50) | 42 (36–51) | 43 (34–51) | 42 (35–49) | 43 (35–51) | 42 (35–49) | 0.699 | 42 (35–50) | 42 (35–50) | 0.938 |
| Triglycerides (mg/dL) | 102 (73–149) | 96 (69–131) | 101 (71–150) | 103 (75–145) | 102 (75–151) | 114 (83–172) | <0.001 | 97 (71–137) | 108 (80–162) | <0.001 |
| Fasting glucose (mg/dL) | 149 (119–193) | 123 (105–147) | 141 (116–172) | 148 (123–182) | 164 (127–207) | 203 (158–256) | <0.001 | 134 (112–165) | 182 (140–225) | <0.001 |
| Initial BP | ||||||||||
| SBP (mmHg) | 142 (127–161) | 140 (121–159) | 145 (127–163) | 145 (130–160) | 148 (128–163) | 144 (124–163) | 0.026 | 140 (125–160) | 146 (128–163) | 0.011 |
| DBP (mmHg) | 80 (70–90) | 80 (69–90) | 80 (70–90) | 80 (73–90) | 81 (73–96) | 81 (72–93) | 0.002 | 80 (70– 90) | 81 (72–94) | <0.001 |
| IVT + IAT | 628 (46.5) | 128 (42.0) | 131 (46.6) | 122 (50.0) | 128 (49.4) | 119 (45.4) | 0.316 | 362 (45.5) | 266 (47.9) | 0.374 |
| Time from symptom onset to groin puncture (min) | 275 (178–551) | 270 (165–550) | 260 (168–540) | 267 (177–560) | 287 (185–525) | 290 (185–604) | 0.631 | 265 (170–547) | 288 (187–570) | 0.011 |
| Prior medication | ||||||||||
| Antiplatelet | 445 (32.9) | 113 (37.0) | 92 (32.7) | 89 (36.5) | 79 (30.5) | 72 (27.5) | 0.093 | 285 (35.8) | 160 (28.8) | 0.007 |
| Anticoagulant | 160 (11.8) | 43 (14.1) | 41 (14.6) | 26 (10.7) | 24 (9.3) | 26 (9.9) | 0.170 | 107 (13.4) | 53 (9.5) | 0.029 |
| Antihypertension | 898 (66.5) | 223 (73.1) | 200 (71.2) | 159 (65.2) | 160 (61.8) | 156 (59.5) | 0.002 | 562 (70.6) | 336 (60.5) | <0.001 |
| Lipid-lowering agent | 440 (32.6) | 95 (31.2) | 107 (38.1) | 78 (32.0) | 93 (35.9) | 67 (25.6) | 0.023 | 273 (34.3) | 167 (30.1) | 0.105 |
| Antidiabetic | 929 (68.8) | 213 (69.8) | 178 (63.3) | 163 (66.8) | 189 (73.0) | 186 (71.0) | 0.127 | 536 (67.3) | 393 (70.8) | 0.175 |
Data are n (%) or median (interquartile range) unless otherwise indicated. P values by χ2 test, Kruskal-Wallis test, and Wilcoxon rank sum test. CE, cardioembolism; DBP, diastolic blood pressure; LAD, large artery disease.
Table 2 shows the prevalence of END and differences in functional outcomes according to HbA1c levels. END was more prevalent in patients with higher HbA1c levels (P = 0.02 according to quintiles, P = 0.003 according to the cutoff value). The proportion of patients with symptomatic hemorrhage was significantly higher in those with higher quintiles of HbA1c (P = 0.033), and stroke progression was more commonly found in patients with HbA1c >7.0% than in those with HbA1c ≤7.0% (20.2 vs. 15.5%, P = 0.029). The proportion of patients with mRS ≤1 was significantly lower among patients with higher HbA1c (P = 0.006 according to quintiles, P = 0.007 according to the cutoff value).
Table 2.
END occurrence and functional outcomes according to HbA1c quintiles and a cutoff value of 7.0%
| HbA1c quintiles | HbA1c cutoff | |||||||||
|---|---|---|---|---|---|---|---|---|---|---|
| Total | 1st (≤6.1%) | 2nd (>6.1–6.6%) | 3rd (>6.6–7.1%) | 4th (>7.1–7.9%) | 5th (>7.9%) | P value | ≤7.0% | >7.0% | P value | |
| Patients, n | 1,351 | 305 | 281 | 244 | 259 | 262 | 796 | 555 | ||
| END | 360 (26.6) | 61 (20.0) | 76 (27.0) | 63 (25.8) | 82 (31.7) | 78 (29.8) | 0.02 | 188 (23.6) | 172 (31.0) | 0.003 |
| Stroke progression | 235 (17.4) | 43 (14.1) | 43 (15.3) | 46 (18.9) | 56 (21.6) | 47 (17.9) | 0.15 | 123 (15.5) | 112 (20.2) | 0.029 |
| Symptomatic hemorrhage | 80 (5.9) | 9 (3.0) | 22 (7.8) | 11 (4.5) | 16 (6.2) | 22 (8.4) | 0.033 | 39 (4.9) | 41 (7.4) | 0.074 |
| mRS ≤1 | 288 (21.3) | 55 (18.0) | 77 (27.4) | 62 (25.4) | 44 (17.0) | 50 (19.1) | 0.006 | 190 (23.9) | 98 (17.7) | 0.007 |
| mRS ≤2 | 448 (33.2) | 95 (31.1) | 99 (35.2) | 90 (36.9) | 88 (34.0) | 76 (29.0) | 0.31 | 278 (34.9) | 170 (30.6) | 0.11 |
Data are n (%) unless otherwise indicated. P values by χ2 test.
Table 3 shows procedure-related outcomes according to HbA1c levels. While endovascular procedure time was longer in patients with higher HbA1c (P = 0.017 according to quintiles, P = 0.005 according to the cutoff value), the degree of recanalization was not significantly different according to the HbA1c level.
Table 3.
Procedure time and recanalization degree according to HbA1c quintiles and a cutoff value of 7.0%
| HbA1c quintiles | HbA1c cutoff | |||||||||
|---|---|---|---|---|---|---|---|---|---|---|
| Total | 1st (≤6.1%) | 2nd (>6.1–6.6%) | 3rd (>6.6–7.1%) | 4th (>7.1–7.9%) | 5th (>7.9%) | P value | ≤7.0% | >7.0% | P value | |
| Patients, n | 1,351 | 305 | 281 | 244 | 259 | 262 | 796 | 555 | ||
| Procedure time (min) | 45 (27–74) | 46.5 (28–80) | 40 (22–70) | 40.0 (26–8.5) | 51.0 (35–0) | 45 (28–4) | 0.017 | 43 (25–70.5) | 48 (30–8.0) | 0.005 |
| Successful recanalization (TICI ≥2b) | 1,064 (78.8) | 241 (79.0) | 225 (80.1) | 189 (77.5) | 199 (76.8) | 210 (80.2) | 0.840 | 630 (79.1) | 434 (78.2) | 0.675 |
| Incomplete | 287 (21.2) | 64 (21.0) | 56 (19.9) | 55 (22.5) | 60 (23.2) | 52 (19.8) | 0.833 | 166 (20.9) | 121 (21.8) | 0.731 |
| TICI 2b | 421 (31.2) | 104 (34.1) | 82 (29.2) | 70 (28.7) | 80 (30.9) | 85 (32.4) | 244 (30.7) | 177 (31.9) | ||
| TICI 3 | 643 (47.6) | 137 (44.9) | 143 (50.9) | 119 (48.8) | 119 (45.9) | 125 (47.7) | 386 (48.5) | 257 (46.3) | ||
Data are n (%) or median (interquartile range) unless otherwise indicated. P values by χ2 test, Kruskal-Wallis test, and Wilcoxon rank sum test.
Table 4 shows the associations between HbA1c levels at admission and functional outcomes at 3 months. Compared with those in the 2nd quintile (>6.1–6.6% [43–49 mmol/mol]), patients in the 4th quintile (>7.1–7.9% [54–63 mmol/mol]) and 5th quintile (>7.9% [63 mmol/mol]) had a significantly lower probability of achieving the favorable functional outcome of mRS ≤1 after multivariable adjustment (model 2: 4th quintile OR 0.40 [95% CI 0.26, 0.63], 5th quintile 0.43 [0.28, 0.68]; model 3: 4th quintile 0.43 [0.27, 0.68], 5th quintile 0.47 [0.29, 0.75]). The probability of achieving the favorable outcome of mRS ≤1 was also significantly lower in the 1st quintile group (model 2: 0.56 [0.37, 0.85]; model 3: 0.59 [0.38, 0.91]). When HbA1c was used as a binary variable, the probability of achieving a favorable outcome was also significantly lower in those with HbA1c >7.0% (53 mmol/mol) compared with those with HbA1c ≤7.0% (model 2: 0.51 [0.38, 0.69]; model 3: 0.53 [0.39, 0.72]). The analysis using patients with complete data is presented in Supplementary Table 1.
Table 4.
Associations between HbA1c levels at admission and functional outcome at 3 months
| OR (95% CI) | Common OR (95% CI) | ||||||||
|---|---|---|---|---|---|---|---|---|---|
| mRS 0–1 at 3 months | mRS 0–2 at 3 months | mRS at 3 months | |||||||
| HbA1c level | Model 1 | Model 2 | Model 3 | Model 1 | Model 2 | Model 3 | Model 1 | Model 2 | Model 3 |
| Quintile | |||||||||
| 1st (≤6.1%) | 0.58 (0.39, 0.86) | 0.56 (0.37, 0.85) | 0.59 (0.38, 0.91) | 0.83 (0.59, 1.17) | 0.83 (0.57, 1.21) | 0.87 (0.58, 1.29) | 0.86 (0.64, 1.14) | 0.86 (0.64, 1.15) | 0.91 (0.68, 1.23) |
| 2nd (>6.1–6.6%) | 1 (Ref) | 1 (Ref) | 1 (Ref) | 1 (Ref) | 1 (Ref) | 1 (Ref) | 1 (Ref) | 1 (Ref) | 1 (Ref) |
| 3rd (>6.6–7.1%) | 0.90 (0.61, 1.33) | 0.80 (0.52, 1.21) | 0.84 (0.54, 1.31) | 1.07 (0.75, 1.54) | 0.97 (0.65, 1.43) | 1.05 (0.69, 1.58) | 1.05 (0.78, 1.42) | 0.94 (0.69, 1.27) | 0.99 (0.73, 1.35) |
| 4th (>7.1–7.9%) | 0.54 (0.36, 0.82) | 0.40 (0.26, 0.63) | 0.43 (0.27, 0.68) | 0.95 (0.66, 1.35) | 0.73 (0.49, 1.08) | 0.81 (0.54, 1.22) | 0.82 (0.61, 1.11) | 0.63 (0.47, 0.85) | 0.67 (0.49, 0.91) |
| 5th (>7.9%) | 0.62 (0.42, 0.94) | 0.43 (0.28, 0.68) | 0.47 (0.29, 0.75) | 0.75 (0.52, 1.08) | 0.49 (0.33, 0.73) | 0.54 (0.35, 0.82) | 0.79 (0.59, 1.06) | 0.55 (0.41, 0.75) | 0.59 (0.43, 0.80) |
| P value for overall effect | 0.0069 | <0.0001 | 0.0007 | 0.3159 | 0.0049 | 0.0218 | 0.2674 | 0.0002 | 0.0008 |
| Cutoff | |||||||||
| ≤7.0% | 1 (Ref) | 1 (Ref) | 1 (Ref) | 1 (Ref) | 1 (Ref) | 1 (Ref) | 1 (Ref) | 1 (Ref) | 1 (Ref) |
| >7.0% | 0.68 (0.52, 0.90) | 0.51 (0.38, 0.69) | 0.53 (0.39, 0.72) | 0.82 (0.65, 1.04) | 0.60 (0.46, 0.77) | 0.63 (0.48, 0.83) | 0.82 (0.67, 0.99) | 0.62 (0.51, 0.75) | 0.63 (0.52, 0.78) |
| P value for overall effect | 0.0063 | <0.0001 | <0.0001 | 0.0993 | 0.0001 | 0.0008 | 0.0361 | <0.0001 | <0.0001 |
Model 1, unadjusted. Model 2, adjusted for age, sex, initial NIHSS, education level. Model 3, adjusted for age, sex, initial NIHSS, education level, ischemic stroke subtype, smoking status, history of hypertension, occlusion site, hemoglobin, total cholesterol, onset to groin puncture time, and degree of recanalization. Ref, reference.
The associations among HbA1c at admission, achievement of functional independence (mRS ≤2), and a favorable shift in mRS (ordinal) were also evaluated. Multivariable models 2 and 3 showed a significantly lower probability of achieving functional independence per mRS ≤2 in the 5th quintile (as quintiles) and HbA1c >7.0% (53 mmol/mol) (as a cutoff value). The probability of achieving a favorable shift in mRS was significantly lower in the 4th and 5th quintiles (as quintiles) and HbA1c >7.0% (53 mmol/mol) (as a cut-off value). Sensitivity analysis after excluding premorbid neurological disability (premorbid mRS >1) showed consistent results, with higher HbA1c levels being associated with poorer functional outcomes (Supplementary Table 2).
Figure 1 shows that the influence of prestroke glucose control (≤7.0 vs. >7.0% [53 mmol/mol]) on favorable functional outcomes was consistently observed according to prespecified subgroups, including age, sex, stroke subtype, occlusion site, degree of recanalization, thrombolysis modalities, time from symptom onset to groin puncture, and treatment period. According to the treatment modalities, such as whether bridging therapy with IVT was performed, there was no significant heterogeneity between higher HbA1c and decreased odds of favorable outcomes (IAT only: OR 0.56 [95% CI 0.36, 0.87]; IVT + IAT: 0.47 [0.31, 0.73]; P for interaction = 0.586). The subgroup analyses did not reveal any significant HbA1c effect modification of occlusion site (anterior circulation: 0.51 [0.37, 0.71]; posterior circulation: 0.67 [0.26, 1.73]; P for interaction = 0.594) and treatment period (before 2015: 0.37 [0.20, 0.69]; after 2015: 0.59 [0.41, 0.84]; P for interaction = 0.203). The association between prestroke glucose control and various neurological outcomes (mRS 0–2, ordinal mRS) was still consistent according to each prespecified subgroup (Supplementary Table 3).
Figure 1.
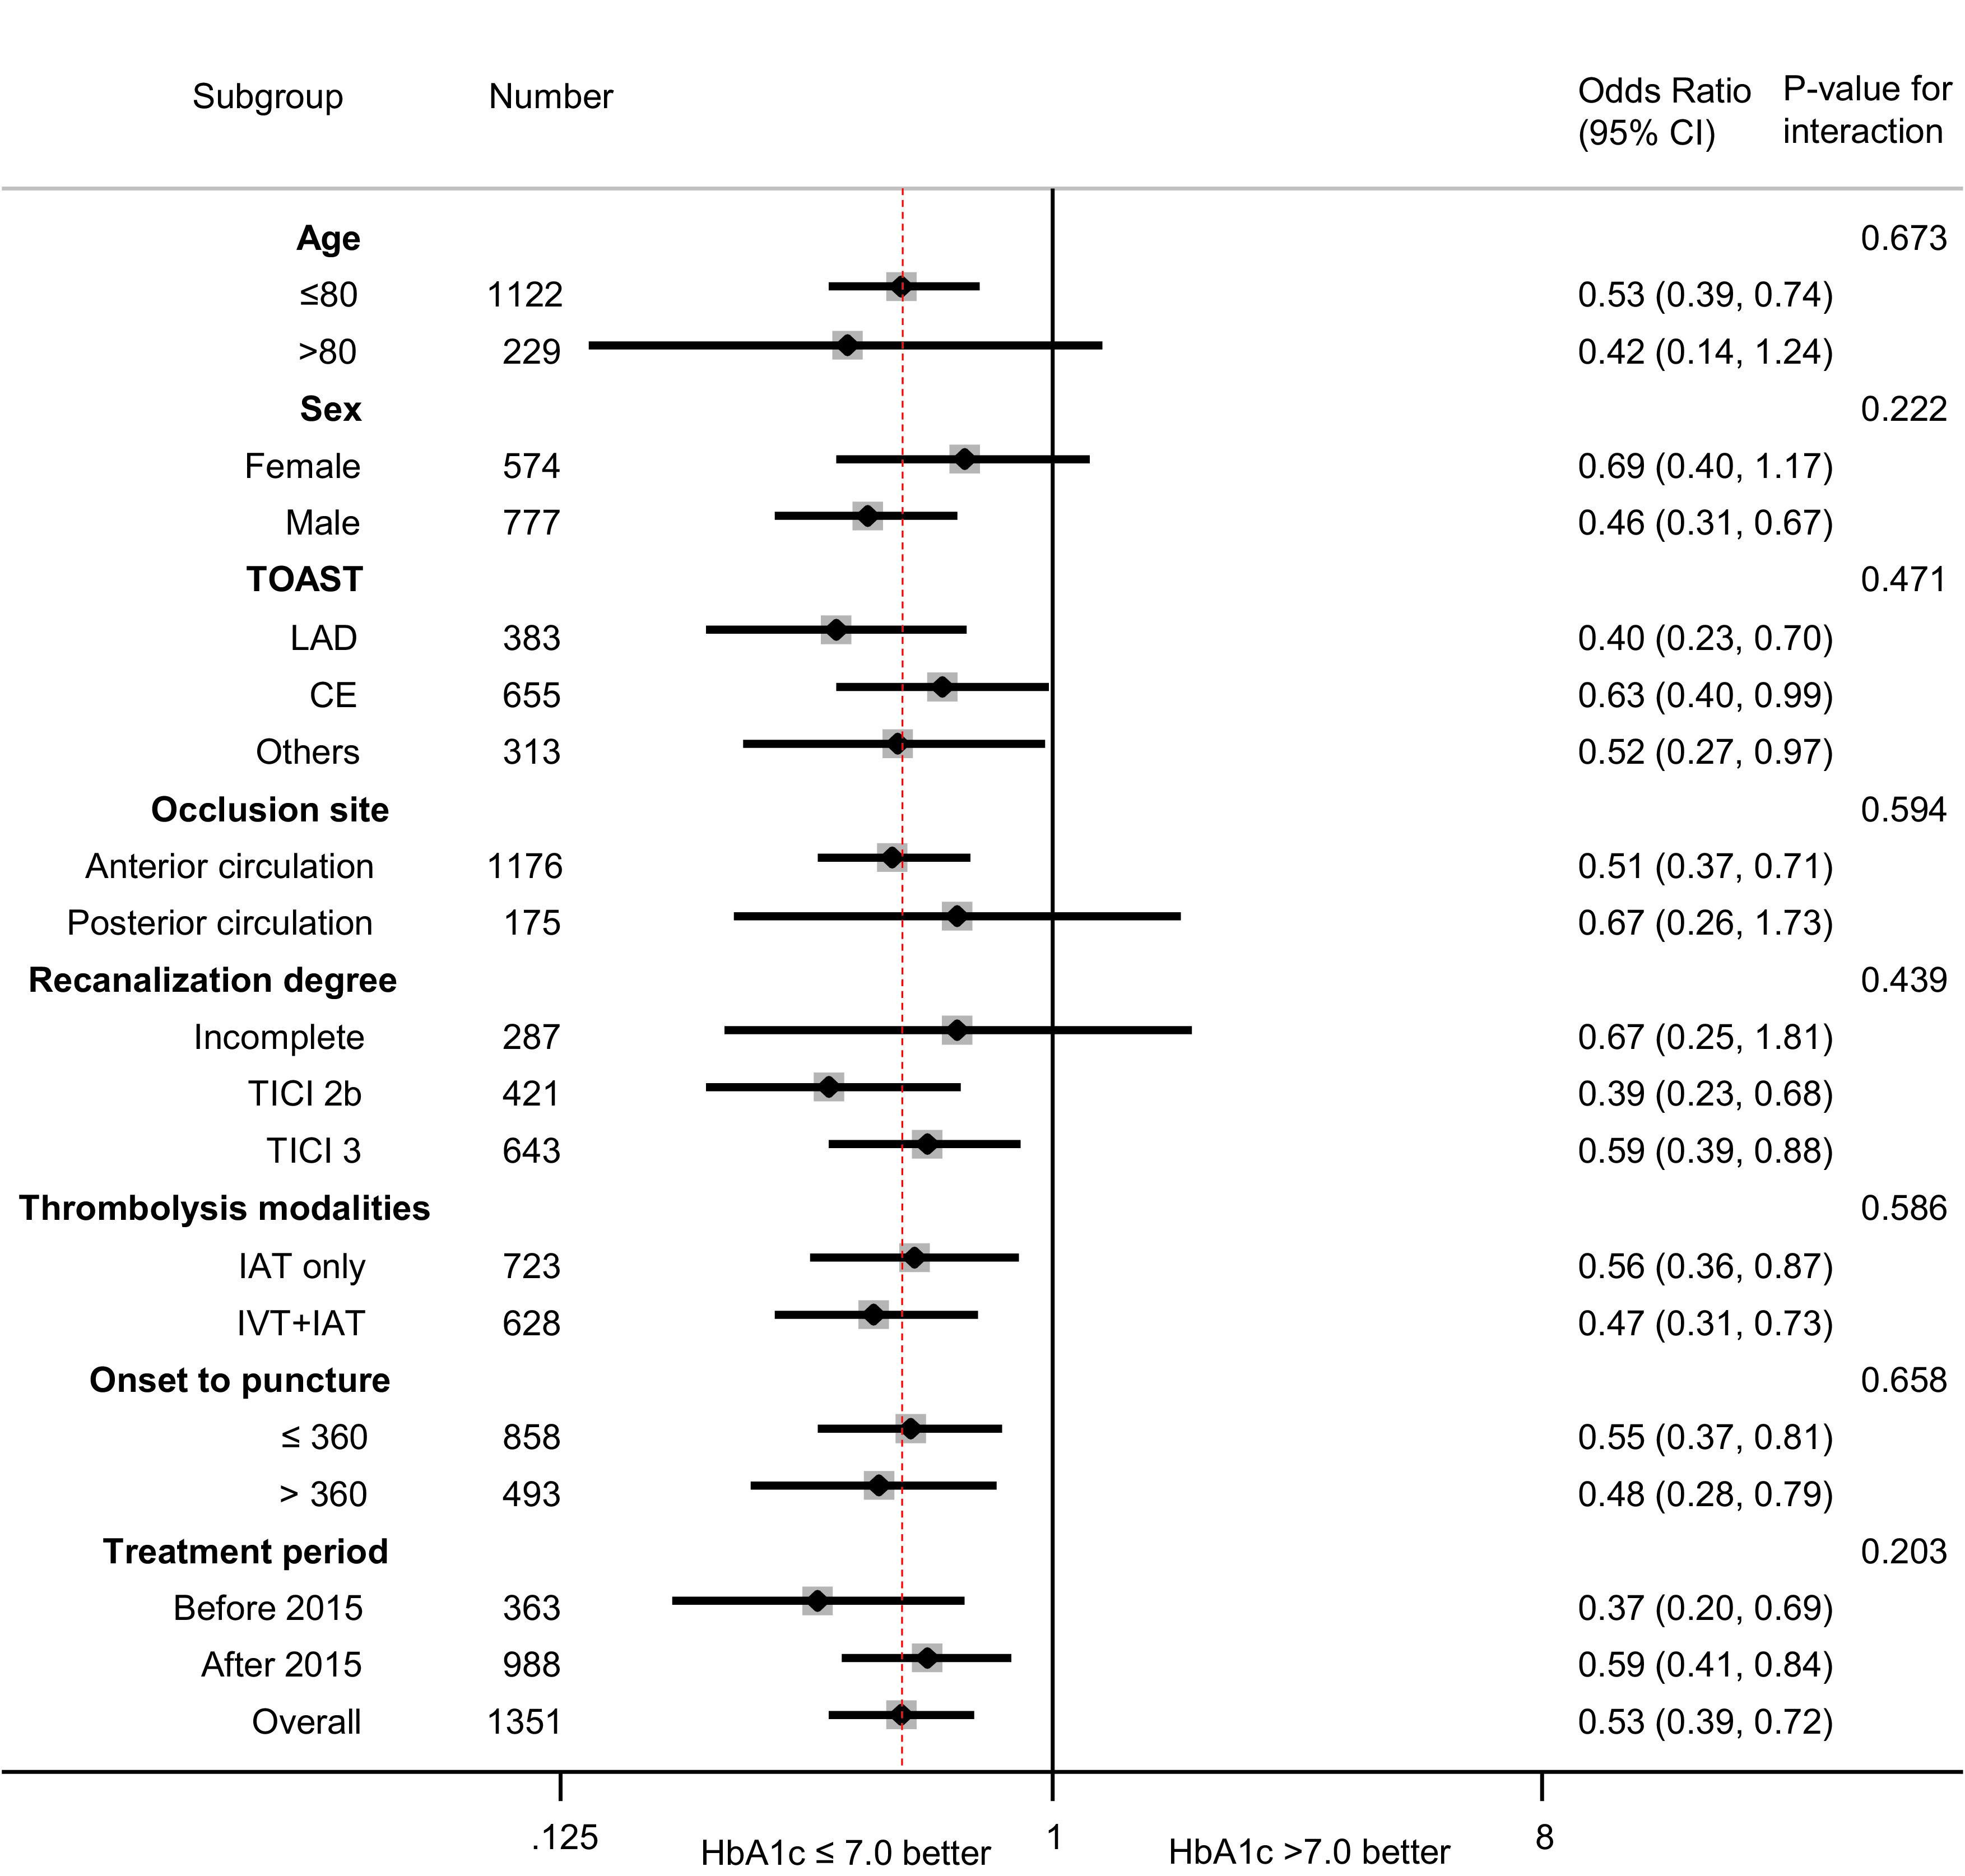
Influence of prestroke glucose control on neurological outcomes according to age, sex, stroke subtype, occlusion site, recanalization degree, thrombolysis modalities, time from symptom onset to groin puncture, and treatment period. CE, cardioembolism; LAD, large artery disease.
Conclusions
Our current study showed that prestroke glucose control was associated with functional outcomes in patients with emergent large vessel occlusive stroke and diabetes who underwent IAT. Specifically, high levels of HbA1c at admission were significantly associated with a decreased odds of good functional recovery regardless of the stroke subtype, occlusion site, degree of recanalization, thrombolysis modality, time from symptom onset to groin puncture, and treatment period. Prior studies reported the association between high HbA1c and poor functional outcomes in acute ischemic stroke after endovascular thrombectomy (7,8). However, patients without diabetes were more frequently included, and HbA1c levels were relatively lower in those studies. In the study by Choi et al. (7), the proportion of patients with diabetes was 37.7% with a mean HbA1c level of 6.2% (44 mmol/mol). According to the most recent study by Diprose et al. (8), the proportion of patients with diabetes was 21.1%, with a median HbA1c level of 5.7% (39 mmol/mol). Compared with prior studies, the current study had the highest mean HbA1c level of 7.1% (54 mmol/mol), a higher rate of symptomatic hemorrhage (5.9% in the current study, 5.4% reported by Choi et al., and 4.5% reported by Diprose et al.) and a lower proportion of subjects achieving mRS 0–1 (21.3% in the current study and 24.7% reported by Choi et al.) and mRS 0–2 (33.2% in the current study, 37.6% reported by Choi et al., and 59.2% reported by Diprose et al.) at 3 months. The strong point of the current study is that the study population was confined to patients with diabetes who were enrolled from multiple participating centers, which enabled the evaluation of prestroke glucose control on clinical outcomes.
Our current study showed that higher HbA1c at admission was associated with factors associated with poor clinical outcomes, such as the occurrence of END, longer procedure time, and high levels of serum cholesterol, LDL, and fasting glucose. END was more common in patients with poor prestroke glucose control. The causes of END in acute ischemic stroke include stroke progression, stroke recurrence, and reperfusion injury (12). Several mechanisms are suggested to explain the harmful effects of hyperglycemia on ischemic stroke outcomes via END. Hyperglycemia induces the evolution of an infarct by inhibiting vasodilation after recanalization therapy (13). Hyperglycemia stimulates the release of thromboxane A2 and inhibits the production of endothelium-derived nitric oxide, both of which result in vasoconstriction (14,15). Hyperglycemia aggravates reperfusion injuries by increasing the production of reactive oxygen species (ROS), proinflammatory cytokines, and lactic acid (13). ROS-related oxidative stress and proinflammatory cytokines promote inflammatory cell infiltration to the vascular endothelium and breakdown of the blood-brain barrier and lead to symptomatic intracerebral hemorrhage and cerebral edema in ischemic brain tissues (16,17). Anaerobic glycolysis increases intracellular lactate accumulation and acidosis (18). Endovascular procedure time was longer in patients with higher levels of HbA1c, which may have been related to the deleterious effect of hyperglycemia on the inhibition of recanalization via the stimulation of coagulation and a reduction in both endogenous fibrinolytic activity and the activity of the administered recombinant tissue plasminogen activator (19,20). Considering that intracranial atherosclerosis-related large vessel occlusion usually requires a longer procedure time and rescue therapy (21,22), the higher proportion of large artery atherosclerosis in the poor prestroke glucose control group may explain the longer procedure time. Patients with poor prestroke glucose control had significantly higher total cholesterol, LDL, and fasting glucose, and these metabolic derangements may also have deleterious effects on functional recovery.
Contrary to prior studies that reported that the influence of high HbA1c on functional recovery was more prominent among the subgroup of patients with complete recanalization (7), our study showed that such an effect of high HbA1c was consistent among all the patients, regardless of the degree of recanalization. Previous studies showed that hyperglycemia at admission is inversely correlated with neurological improvement only in the patients receiving early recanalization, which implies that the detrimental effect of glucose depends on the occurrence of recanalization and the extent of penumbra tissue (23,24). Neurotoxicity induced by hyperglycemia in the acute phase may exacerbate the reperfusion injury. However, the accumulation of microvascular damage, impaired oxygenation, lactate, and intracellular acidosis and the decrement of cerebrovascular blood flow induced by chronic hyperglycemia may make the brain more vulnerable to ischemic injury and delay neurological recovery, regardless of the recanalization status (25).
The results of several clinical trials (e.g., Action to Control Cardiovascular Risk in Diabetes, Action in Diabetes and Vascular Disease: Preterax and Diamicron MR Controlled Evaluation, and Veterans Affairs Diabetes Trial) showed that intensive glycemic control did not reduce cardiovascular or overall mortality and that achieving an HbA1c <7% (53 mmol/mol) is generally recommended (26–28). A more stringent HbA1c target of <6.5% (48 mmol/mol) might be appropriate among patients with a longer life expectancy, shorter duration of diabetes, and fewer comorbidities (29). The study by the Fukuoka Stroke Registry investigators revealed that poor prestroke glucose control (HbA1c ≥6.9% [52 mmol/mol]) was associated with more neurological deterioration, less neurological improvement, and poor functional outcome (30). A study that exclusively examined patients with acute large vessel occlusive stroke after IAT also reported that the probability of achieving good functional recovery was significantly lower in those with HbA1c >7.0% (53 mmol/mol) (7).
The results of our study are consistent with previous studies that prestroke glucose control with a target HbA1c ≤7.0% (53 mmol/mol) may confer a benefit on neurological recovery after stroke in patients who undergo IAT. However, it should be noted that the probability of achieving nondisabling functional recovery (mRS 0–1) was significantly lower in the 1st quintile of HbA1c (≤6.1% [43 mmol/mol]) compared with that in the 2nd quintile. The decreased probability of achieving a nondisabling outcome in this group was comparable with that in the higher quintile groups. The relationship between HbA1c and vascular events and mortality showed a U-shaped association in several previous cohort studies, which emphasizes the necessity of including a lower threshold of HbA1c (31,32). The possible causes for the lower level of HbA1c in patients with diabetes include excessive control of blood glucose, restriction or poor intake of food, low hemoglobin or hemoglobinopathies, etc. Because the mean level of hemoglobin was 12.6 ± 2.2 mg/dL in the 1st quintile group, the accumulation of chronic hypoglycemia caused by improper dosing of antidiabetic medications or excessive food restriction were presumed to be a reason for the lower HbA1c. Prolonged hypoglycemia could increase the risk of vascular complications by activating platelet aggregation and fibrinogen formation, increasing proinflammatory mediators (vascular cell adhesion molecule, ROS, inflammatory cytokines, and tumor necrosis factor-α), and inducing endothelial dysfunction (33). Patients with established vascular disease or arrhythmia are more susceptible to the adverse effects of hypoglycemia (34,35). In the current study, the proportion of stroke subtypes was as follows: large artery atherosclerosis, 28.3%; and cardioembolism, 48.5%. Patients with large artery atherosclerosis had preexisting significant intra- or extracranial atherosclerosis, which is equivalent to established vascular disease. Most of the patients with cardioembolism had atrial fibrillation.
Our study has several limitations. Because we could not assess the status of acute glucose control during hospitalization, the effect of glucose treatment after ischemic stroke could not be analyzed. The harmful effects of prior exposure to chronic hyperglycemia may persist through epigenetic modifications (36). This metabolic memory effect could have an influence on functional recovery after stroke despite adequate glucose management during and after admission. Owing to the retrospective, registry-based observational nature of the study, the type of diabetes could not be assessed, and discriminating type 1 from type 2 was not feasible. However, the proportion of type 1 diabetes was estimated to be <5% among the total number of patients with diabetes, and the prevalence of type 1 diabetes in the entire Korean population has been shown to be small, ranging between 0.017 and 0.021% (37,38). Therefore, most of the study patients were presumed to have had type 2 diabetes. Additionally, the effect of unmeasured confounders cannot be ignored. Various factors, including socioeconomic status, premorbid cognitive function, marital status, caregiver support, and poststroke depression, could not be measured in this registry-based study and may affect functional recovery (39). Education level, which may partially reflect premorbid cognitive function and socioeconomic status, was adjusted to overcome this limitation. Education level is more closely related to functional recovery than income (40). The single-ethnicity population (East Asian) included in the current study may limit the generalizability of the findings.
In conclusion, better prestroke glucose control was associated with disability-free functional recovery in patients with diabetes receiving endovascular therapy for large vessel occlusive stroke. Prestroke glucose control with a target HbA1c ≤7.0% (53 mmol/mol) may have beneficial effects on neurological recovery after stroke and subsequent IAT regardless of stroke subtype, bridging IVT, occlusion site, degree of recanalization, and treatment period. However, excessive glucose control with an HbA1c ≤6.1% (43 mmol/mol) may reduce the chance of neurologic recovery and, therefore, should be avoided. IAT for large vessel occlusive stroke is also beneficial in diabetes. The current study emphasizes the importance of optimal prestroke glucose management among patients with diabetes to maximize the benefits of IAT.
Article Information
Duality of Interest. No potential conflicts of interest relevant to this article were reported.
Author Contributions. J.Y.C. analyzed the data and drafted the manuscript. J.Y.C. and M.-K.H. designed the study. W.-J.K., J.H.K., B.J.K., J.-T.K., J.L., J.K.C., D.-H.K., Y.-J.C., K.-S.H., S.J.L., J.-M.P., B.-C.L., M.S.O., S.-H.L., C.K., D.-E.K., K.B.L., T.H.P., J.C.C., D.-I.S., S.-I.S., and J.-H.H. contributed to the acquisition of data. J.S.L. and M.-K.H. provided support on statistical analysis methods. H.-J.B. and M.-K.H. contributed to the interpretation of the study findings and critical revision of the manuscript. All authors read and approved the final manuscript. M.-K.H. is the guarantor of this work and, as such, had full access to all the data in the study and takes responsibility for the integrity of the data and the accuracy of the data analysis.
Footnotes
This article contains supplementary material online at https://doi.org/10.2337/figshare.14696136.
References
- 1. Parsons MW, Barber PA, Desmond PM, et al. Acute hyperglycemia adversely affects stroke outcome: a magnetic resonance imaging and spectroscopy study. Ann Neurol 2002;52:20–28 [DOI] [PubMed] [Google Scholar]
- 2. Bruno A, Levine SR, Frankel MR, et al.; NINDS rt-PA Stroke Study Group . Admission glucose level and clinical outcomes in the NINDS rt-PA Stroke Trial. Neurology 2002;59:669–674 [DOI] [PubMed] [Google Scholar]
- 3. Song TJ, Chang Y, Chun MY, et al. High dietary glycemic load is associated with poor functional outcome in patients with acute cerebral infarction. J Clin Neurol 2018;14:165–173 [DOI] [PMC free article] [PubMed] [Google Scholar]
- 4. Alvarez-Sabín J, Molina CA, Ribó M, et al. Impact of admission hyperglycemia on stroke outcome after thrombolysis: risk stratification in relation to time to reperfusion. Stroke 2004;35:2493–2498 [DOI] [PubMed] [Google Scholar]
- 5. Kim JT, Jahan R, Saver JL; SWIFT Investigators . Impact of glucose on outcomes in patients treated with mechanical thrombectomy: a post hoc analysis of the Solitaire Flow Restoration With the Intention for Thrombectomy Study. Stroke 2016;47:120–127 [DOI] [PubMed] [Google Scholar]
- 6. Goyal N, Tsivgoulis G, Pandhi A, et al. Admission hyperglycemia and outcomes in large vessel occlusion strokes treated with mechanical thrombectomy. J Neurointerv Surg 2018;10:112–117 [DOI] [PubMed] [Google Scholar]
- 7. Choi K-H, Kim J-H, Kang K-W, et al. HbA1c (glycated hemoglobin) levels and clinical outcome post-mechanical thrombectomy in patients with large vessel occlusion. Stroke 2019;50:119–126 [DOI] [PubMed] [Google Scholar]
- 8. Diprose WK, Wang MTM, McFetridge A, Sutcliffe J, Barber PA. Glycated hemoglobin (HbA1c) and outcome following endovascular thrombectomy for ischemic stroke. J Neurointerv Surg 2020;12:30–32 [DOI] [PubMed] [Google Scholar]
- 9. Kim BJ, Park JM, Kang K, et al. Case characteristics, hyperacute treatment, and outcome information from the Clinical Research Center for Stroke-Fifth Division Registry in South Korea. J Stroke 2015;17:38–53 [DOI] [PMC free article] [PubMed] [Google Scholar]
- 10. Powers WJ, Rabinstein AA, Ackerson T, et al. Guidelines for the early management of patients with acute ischemic stroke: 2019 update to the 2018 guidelines for the early management of acute ischemic stroke: a guideline for healthcare professionals from the American Heart Associ-ation/American Stroke Association. Stroke 2019;50:e344–e418 [DOI] [PubMed] [Google Scholar]
- 11. Jadhav AP, Molyneaux BJ, Hill MD, Jovin TG. Care of the post-thrombectomy patient. Stroke 2018;49:2801–2807 [DOI] [PubMed] [Google Scholar]
- 12. Thanvi B, Treadwell S, Robinson T. Early neurological deterioration in acute ischaemic stroke: predictors, mechanisms and management. Postgrad Med J 2008;84:412–417 [DOI] [PubMed] [Google Scholar]
- 13. Kruyt ND, Biessels GJ, Devries JH, Roos YB. Hyperglycemia in acute ischemic stroke: pathop-hysiology and clinical management. Nat Rev Neurol 2010;6:145–155 [DOI] [PubMed] [Google Scholar]
- 14. Jawerbaum A, Franchi AM, Gonzalez ET, Novaro V, de Gimeno MA. Hyperglycemia pro-motes elevated generation of TXA2 in isolated rat uteri. Prostaglandins 1995;50:47–56 [DOI] [PubMed] [Google Scholar]
- 15. Ding Y, Vaziri ND, Coulson R, Kamanna VS, Roh DD. Effects of simulated hyperglycemia, insulin, and glucagon on endothelial nitric oxide synthase expression. Am J Physiol Endocrinol Metab 2000;279:E11–E17 [DOI] [PubMed] [Google Scholar]
- 16. Bémeur C, Ste-Marie L, Montgomery J. Increased oxidative stress during hyperglycemic cerebral ischemia. Neurochem Int 2007;50:890–904 [DOI] [PubMed] [Google Scholar]
- 17. Martini SR, Kent TA. Hyperglycemia in acute ischemic stroke: a vascular perspective. J Cereb Blood Flow Metab 2007;27:435–451 [DOI] [PubMed] [Google Scholar]
- 18. Anderson RE, Tan WK, Martin HS, Meyer FB. Effects of glucose and PaO2 modulation on cortical intracellular acidosis, NADH redox state, and infarction in the ischemic penumbra. Stroke 1999;30:160–170 [DOI] [PubMed] [Google Scholar]
- 19. Stegenga ME, van der Crabben SN, Levi M, et al. Hyperglycemia stimulates coagulation, whereas hyperinsulinemia impairs fibrinolysis in healthy humans. Diabetes 2006;55:1807–1812 [DOI] [PubMed] [Google Scholar]
- 20. Ribo M, Molina C, Montaner J, et al. Acute hyperglycemia state is associated with lower tPA-induced recanalization rates in stroke patients. Stroke 2005;36:1705–1709 [DOI] [PubMed] [Google Scholar]
- 21. Tsang ACO, Orru E, Klostranec JM, et al. Thrombectomy outcomes of intracranial atheros-clerosis-related occlusions. Stroke 2019;50:1460–1466 [DOI] [PubMed] [Google Scholar]
- 22. Li H, Zhang Y, Zhang L, et al. Endovascular treatment of acute ischemic stroke due to intracranial atherosclerotic large vessel occlusion: a systematic review. Clin Neuroradiol 2020;30:777–787 [DOI] [PubMed] [Google Scholar]
- 23. Bruno A, Biller J, Adams HP Jr., et al.; Trial of ORG 10172 in Acute Stroke Treatment (TOAST) Investigators . Acute blood glucose level and outcome from ischemic stroke. Neurology 1999;52:280–284 [DOI] [PubMed] [Google Scholar]
- 24. Alvarez-Sabín J, Molina CA, Montaner J, et al. Effects of admission hyperglycemia on stroke outcome in reperfused tissue plasminogen activator-treated patients. Stroke 2003;34:1235–1241 [DOI] [PubMed] [Google Scholar]
- 25. Kuwashiro T, Sugimori H, Ago T, Kuroda J, Kamouchi M, Kitazono T. The impact of predisposing factors on long-term outcome after stroke in diabetic patients: the Fukuoka Stroke Registry. Eur J Neurol 2013;20:921–927 [DOI] [PubMed] [Google Scholar]
- 26. Ismail-Beigi F, Craven T, Banerji MA, et al.; ACCORD trial group . Effect of intensive treatment of hyperglycaemia on microvascular outcomes in type 2 diabetes: an analysis of the ACCORD randomised trial. Lancet 2010;376:419–430 [DOI] [PMC free article] [PubMed] [Google Scholar]
- 27. Patel A, MacMahon S, Chalmers J, et al.; ADVANCE Collaborative Group . Intensive blood glucose control and vascular outcomes in patients with type 2 diabetes. N Engl J Med 2008;358:2560–2572 [DOI] [PubMed] [Google Scholar]
- 28. Duckworth W, Abraira C, Moritz T, et al.; VADT Investigators . Glucose control and vascular complications in veterans with type 2 diabetes. N Engl J Med 2009;360:129–139 [DOI] [PubMed] [Google Scholar]
- 29. American Diabetes Association . 6. Glycemic targets: Standards of Medical Care in Diabetes—2020. Diabetes Care 2020;43(Suppl. 1):S66–S76 [DOI] [PubMed] [Google Scholar]
- 30. Kamouchi M, Matsuki T, Hata J, et al.; FSR Investigators . Prestroke glycemic control is associated with the functional outcome in acute ischemic stroke: the Fukuoka Stroke Registry. Stroke 2011;42:2788–2794 [DOI] [PubMed] [Google Scholar]
- 31. Currie CJ, Peters JR, Tynan A, et al. Survival as a function of HbA(1c) in people with type 2 diabetes: a retrospective cohort study. Lancet 2010;375:481–489 [DOI] [PubMed] [Google Scholar]
- 32. Huang ES, Liu JY, Moffet HH, John PM, Karter AJ. Glycemic control, complications, and death in older diabetic patients: the diabetes and aging study. Diabetes Care 2011;34:1329–1336 [DOI] [PMC free article] [PubMed] [Google Scholar]
- 33. Smith L, Chakraborty D, Bhattacharya P, Sarmah D, Koch S, Dave KR. Exposure to hypoglycemia and risk of stroke. Ann N Y Acad Sci 2018;1431:25–34 [DOI] [PMC free article] [PubMed] [Google Scholar]
- 34. Kranenburg G, van der Graaf Y, van der Leeuw J, et al.; SMART Study Group . The relation between HbA1c and cardiovascular events in patients with type 2 diabetes with and without vascular disease. Diabetes Care 2015;38:1930–1936 [DOI] [PubMed] [Google Scholar]
- 35. Chow E, Bernjak A, Williams S, et al. Risk of cardiac arrhythmias during hypoglycemia in patients with type 2 diabetes and cardiovascular risk. Diabetes 2014;63:1738–1747 [DOI] [PubMed] [Google Scholar]
- 36. Misra A, Bloomgarden Z. Metabolic memory: evolving concepts. J Diabetes 2018;10:186–187 [DOI] [PubMed] [Google Scholar]
- 37. DIAMOND Project Group . Incidence and trends of childhood type 1 diabetes worldwide 1990-1999. Diabet Med 2006;23:857–866 [DOI] [PubMed] [Google Scholar]
- 38. Song SO, Song YD, Nam JY, et al. Epidemiology of type 1 diabetes mellitus in Korea through an investigation of the National Registration Project of Type 1 Diabetes for the reimbursement of gluco-meter strips with additional analyses using claims data. Diabetes Metab J 2016;40:35–45 [DOI] [PMC free article] [PubMed] [Google Scholar]
- 39. Dušica SP, Devečerski GV, Jovićević MN, Platiša NM. Stroke rehabilitation: which factors influence the outcome? Ann Indian Acad Neurol 2015;18:484–487 [DOI] [PMC free article] [PubMed] [Google Scholar]
- 40. Putman K, De Wit L, Schoonacker M, et al. Effect of socioeconomic status on functional and motor recovery after stroke: a European mult-icentre study. J Neurol Neurosurg Psychiatry 2007;78:593–599 [DOI] [PMC free article] [PubMed] [Google Scholar]