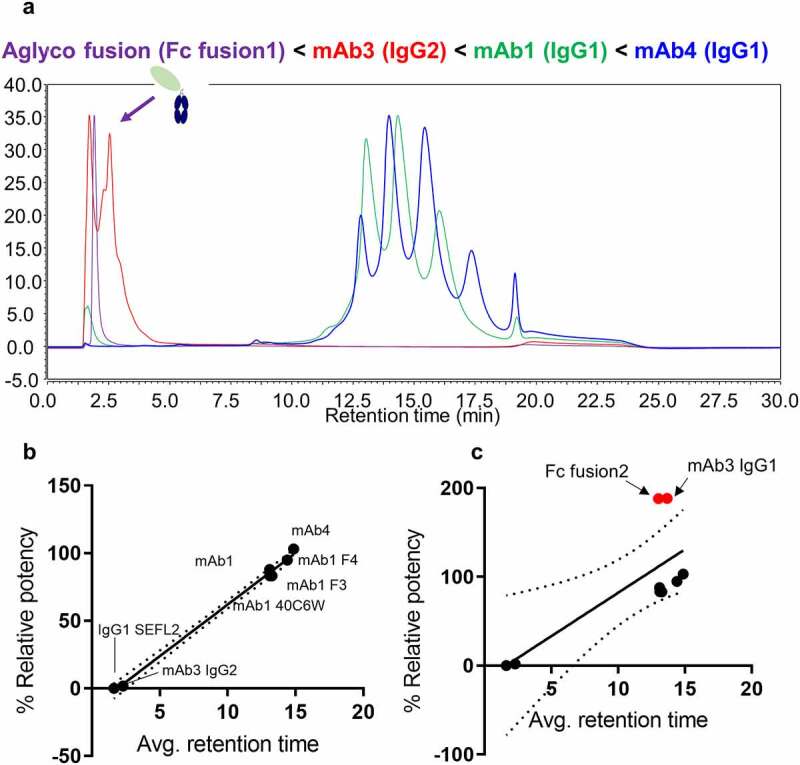
Figure 4.

(a) FcγRIIIa affinity LC-UV chromatograms of four representative therapeutic protein modalities: aglycosylated Fc fusion protein (purple), IgG2 mAb (red), and two IgG1 mAbs with different glycosylation patterns (blue and green). (b) Correlation plots showing relationship between relative binding affinity to average weighted retention time with outlier samples removed. (c) Correlation plots of relative binding affinity to weighted retention time including outlier samples
