Abstract
Triggering receptor expressed on myeloid cell 2 (TREM2) is linked to neurodegenerative disease risk. However, the function of TREM2 in neurodegeneration is still not fully understood. Here we investigated the role of microglial TREM2 in TAR-DNA binding protein 43 kDa (TDP-43)-related neurodegeneration using viral-mediated and transgenic mouse models. We found that TREM2 deficiency impaired phagocytic clearance of pathological TDP-43 by microglia, and enhanced neuronal damage and motor impairments. Mass cytometry analysis revealed that hTDP-43 induced a TREM2-dependent subpopulation of microglia with high CD11c expression and phagocytic ability. Using mass spectrometry and surface plasmon resonance analysis, we further demonstrated an interaction between TDP-43 and TREM2 in vitro and in vivo as well as in ALS patient tissues. We computationally identified regions within hTDP-43 that interact with TREM2. Our data highlights that TDP-43 is a possible ligand for microglial TREM2 and that this interaction mediates neuroprotection of microglia in TDP-43-related neurodegeneration.
Introduction
Initially implicated as inflammatory cells, microglia are now recognized to play neuroprotective roles in neurodegenerative diseases, by sensing their environment, clearing injury stimuli via phagocytosis, and preserving neuronal health1. Triggering receptor expressed on myeloid cell 2 (TREM2) is exclusively expressed on microglia in the central nervous system (CNS) and is critical for microglial proliferation, migration, and phagocytosis2. TREM2 variants are genetically linked to increased risk for Alzheimer’s disease (AD)3, 4. In an AD mouse model, TREM2 was demonstrated to act as a sensor for anionic lipids associated with amyloid-β (Aβ) accumulation and degenerating neurons5. In addition, recent studies have further demonstrated, both in vivo and in vitro, that TREM2 is a receptor for Aβ6.
TAR-DNA binding protein 43 kDa (TDP-43) is a DNA binding protein and plays a critical role in regulating gene expression7. It is the main component of the insoluble and ubiquitinated protein aggregates found in most ALS patients8. TDP-43 aggregates have also been identified in frontotemporal dementia (FTD) and AD9. In regards to TREM2, it is still under debate as to whether TREM2 variants are risk factors for ALS. A large population based study showed TREM2 variant R47H increases risk for sporadic ALS10. However, others found TREM2 variant R47H is not associated with ALS11. Notably, all these studies focused on TREM2 variant R47H, while other variants are largely understudied. Nevertheless, spatial gene expression analysis in both ALS mouse models and sporadic ALS patients implicates TREM2-mediated mechanism in disease pathogenesis12, 13. However, whether TREM2 participates in TDP-43-related neurodegeneration remains unknown.
Towards this end, we used viral-transduction to express human TDP-43 (hTDP-43) in the mouse CNS as well as a transgenic mouse model that inducibly expresses hTDP-43 bearing defective nuclear localization signal (rNLS8)14. We found that TREM2 mediates microglial phagocytic clearance of pathological hTDP-43 proteins and that TREM2 deficiency facilitates motor impairments. We further demonstrated that microglial TREM2 interacts with pathological hTDP-43, suggesting a molecular mechanism underlying the neuroprotection ability of microglia in TDP-43-mediated neurodegeneration.
Results
TREM2 deficiency aggravates TDP-43-induced neurodegeneration.
We preformed intracerebroventricular (ICV) injection of AAV9 into P0 neonatal mice to express hTDP-43 protein fused with a GFP tag (AAV9.CAG.hTDP-43.GFP) (Fig. 1a). Human TDP-43 protein was exclusively expressed in neurons throughout the brain and spinal cord 21 days after injection (Extended Data Fig. 1a–f). Moreover, hTDP-43 expression was in both nucleus and cytoplasm of neurons 5 weeks after AAV injection (Fig. 1b, c). Pathological inclusions of phosphorylated hTDP-43 (p-hTDP-43) were also detected, particularly in motor cortex (Fig. 1d, Extended Data Fig. 1g). We also observed significant motor deficits, as illustrated by impaired hindlimb clasping in hTDP-43 expressing mice at day 14 when compared with controls (Fig. 1e).
Fig 1. TREM2 deficiency aggravates hTDP-43-induced behavioral deficits and neurodegeneration.
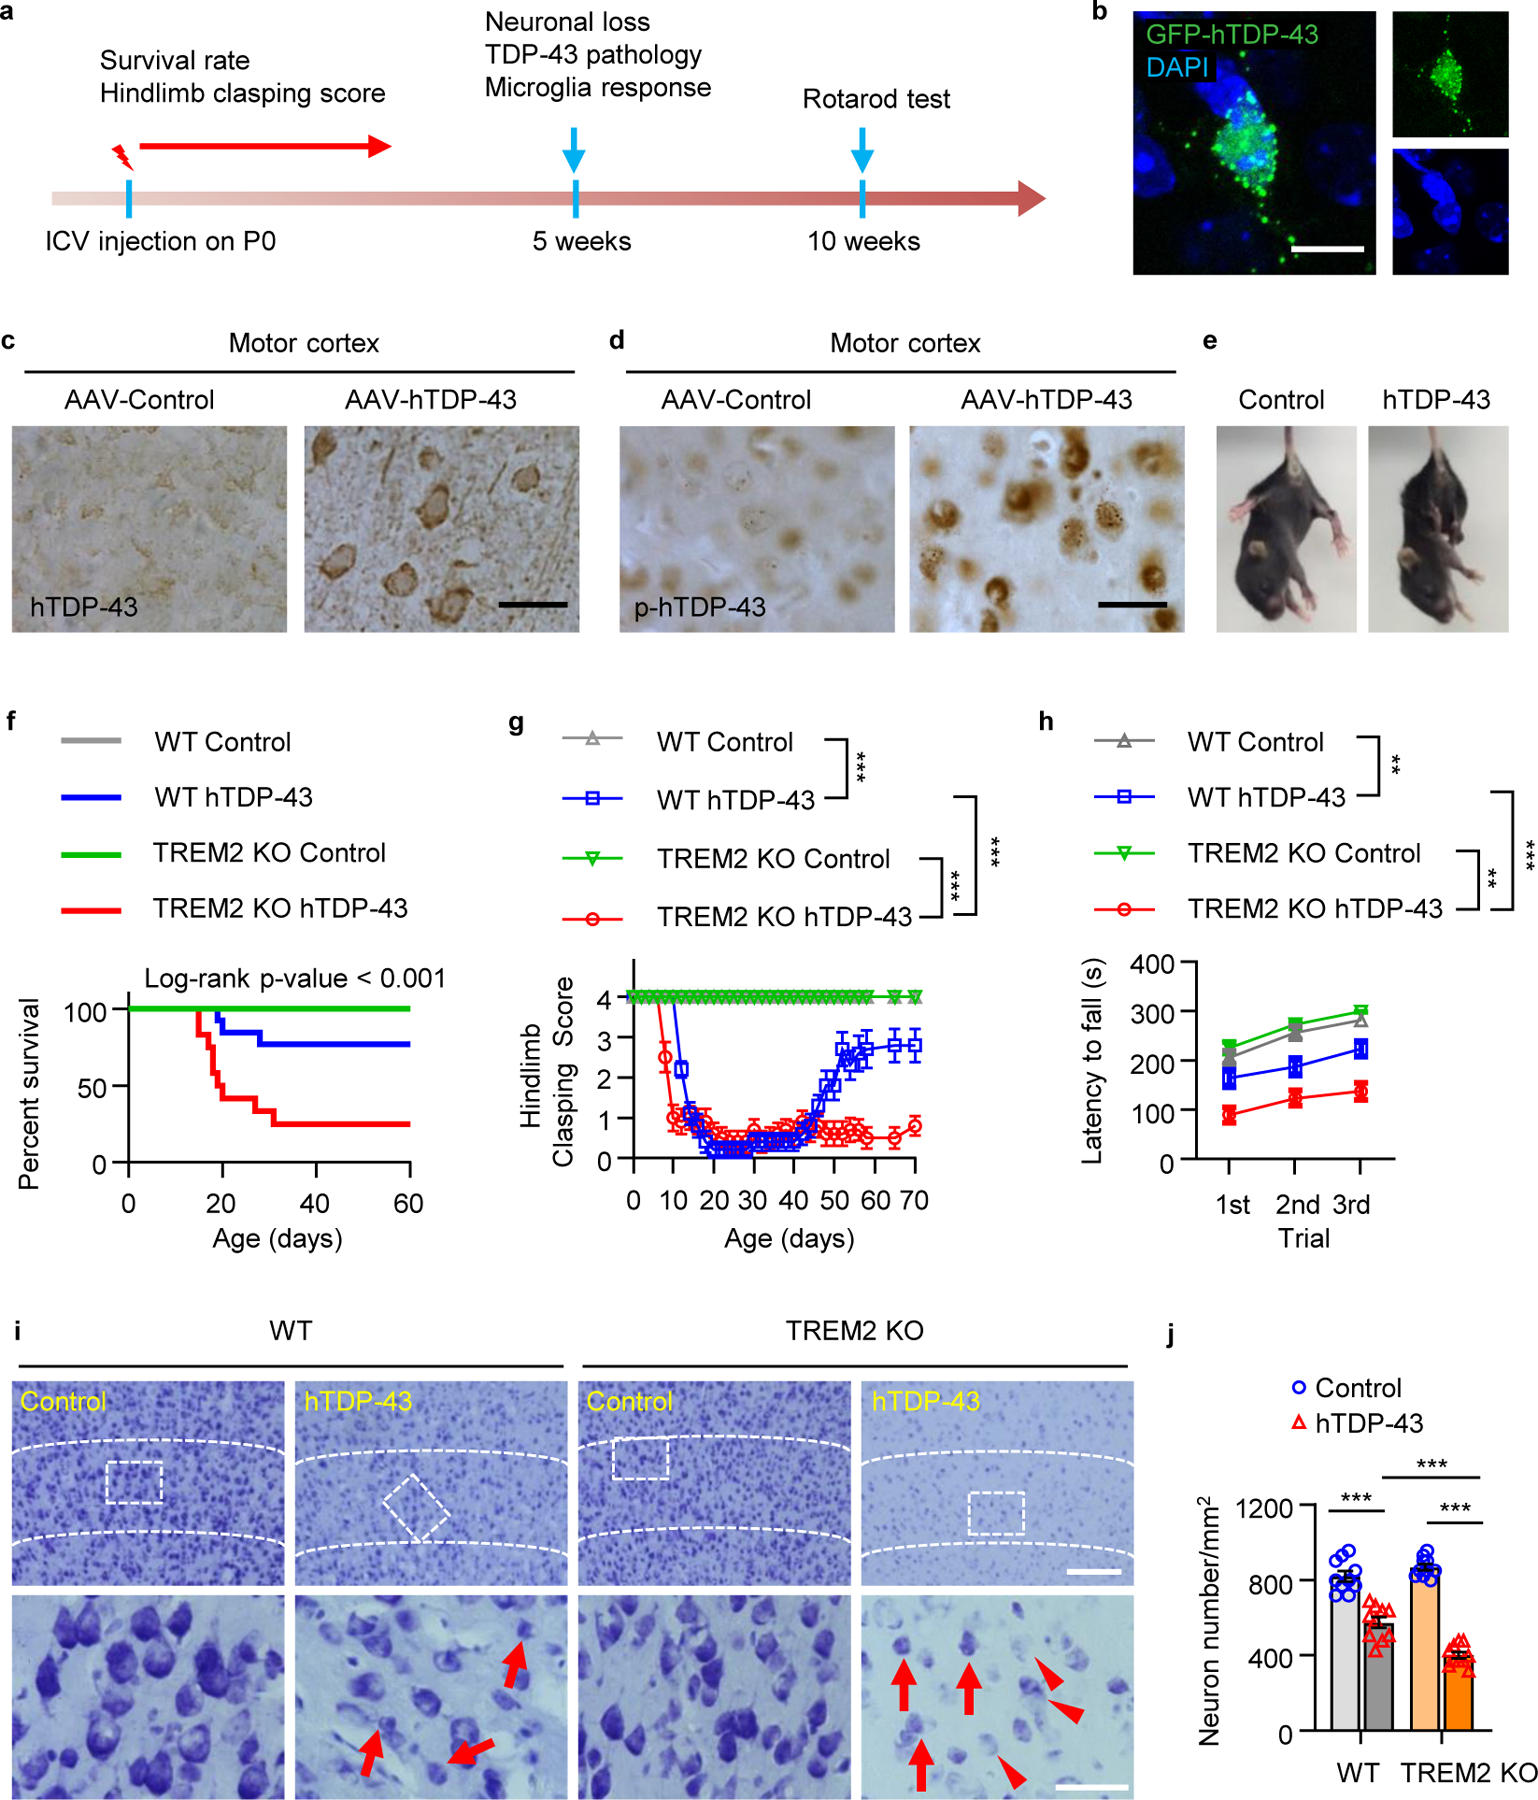
GFP tagged hTDP-43 protein (GFP-hTDP-43) expression was induced via intracerebroventricular injection of AAV9.CAG.hTDP-43.GFP in neonatal mice (AAV9.CAG.GFP as control). a, Study design and timeline for the neonatal ICV injection model. b, Representative images of GFP-hTDP-43 expression in both nucleus and cytosol of neurons in the primary motor cortex of WT mice at 35 days post-infection (dpi). Scale bar, 10 μm. c-d, Representative images of hTDP-43 (c) and p-hTDP-43 (d) expression in the motor cortex at 35 dpi. Scale bar, 20 μm. e, Representative images of typical clasping phenotype in WT mice expressing hTDP-43 at 14 dpi. f, Kaplan-Meier survival curves show the percentage of mice alive at each postnatal day up to 60 dpi. g, Hindlimb clasping response scores collected over 70 days. h, Average latency to fall during rotarod analysis at 70 dpi. i, j, Representative images (i) and quantification (j) of Nissl staining in the primary motor cortex of indicated groups at 35 dpi; Dashed lines indicate the borders of layer 4&5. Scale bar, 100 μm. High magnification images as indicated by area in dotted white box showing neuronal morphology of the cortical layer V at the bottom. Scale bar, 50 μm. Red arrows indicate neuronal shrinkage and red arrowheads indicate a significant loss of Nissl staining. f. Survival curves were analyzed using a log-rank (Mantel-Cox) test. n = 20 per group, P < 0.0001, χ² = 9.227, d.f. = 3. In g, h, and j, Significance was calculated using two-way ANOVA followed by Tukey’s post hoc test. Data represented as mean ± SEM. n.s. = not significant, *P < 0.05, **P < 0.01, *** P < 0.001. g, n = 10 per group, P < 0.0001, F 3,1152 =2002; h, n = 10 per group, P < 0.0001, F 3,108 = 69.45; j, n = 10 per group, P < 0.0001, F 3,27 = 104.9.
To evaluate the function of TREM2 in hTDP-43-related motor deficits, we compared TREM2 knockout (KO) and wild-type (WT) mice expressing hTDP-43. We found that mortality after hTDP-43 overexpression was significantly higher in TREM2 KO mice than WT mice (Fig. 1f). Additionally, TREM2 KO mice exhibited hindlimb clasping 5 days earlier and remained hunched while WT mice began to recover approximately 40 days post-virus injection (Fig. 1g). These results indicate that TREM2 deficiency worsens hTDP-43 related motor dysfunction.
At 5 weeks post-virus injection, WT and TREM2 KO mice have similar hindlimb clasping response (Fig. 1g) and weight loss (Extended Data Fig. 2a). However, locomotor impairment was significantly greater in TREM2 KO mice than in WT mice (Extended Data Fig. 2b, c). Rotarod performance during the recovery phase (10 weeks post-injection) also revealed greater impairment of motor function in TREM2 KO mice than in WT mice (Fig. 1h). Nissl staining at 5 weeks post-virus injection showed that shrinkage of neuronal populations was higher in TREM2 KO mice than WT mice (Fig. 1i, j). Similarly, NeuN loss was greater in TREM2 KO mice than WT mice (Extended Data Fig. 2d, e). To determine whether motor dysfunction correlated with levels of pathological hTDP-43, we isolated soluble and sarkosyl-insoluble fractions to measure total and phosphorylated hTDP-43 (p-hTDP-43) (Extended Data Fig. 3a). Indeed, levels of both hTDP-43 and p-hTDP-43 were much higher in TREM2 KO mice when compared to WT mice in the soluble fraction (Extended Data Fig. 3b). The sarkosyl-insoluble fraction in brains of TREM2 KO mice also contained more p-hTDP-43 (Extended Data Fig. 3c). Thus, the higher level of pathological hTDP-43 in TREM2 KO mice likely contributes to their worse motor dysfunction.
TREM2 deficiency abolishes TDP-43-induced CD11c+ microglia.
Microglia undergo significant phenotypic changes following CNS injury and neurodegeneration15. We therefore evaluated the effects of TREM2 deficiency on microglial phenotypes in response to hTDP-43-related neurodegeneration. We characterized microglial phenotypes via mass cytometry (CyTOF), a high dimensional single cell analysis that can identify functional cell subpopulations16 (Fig. 2a). Antibody panels to various microglia related surface and intracellular antigens were utilized (Supplementary Table 1). We gated CD45medCD11b+ microglia for CyTOF analysis (Extended Data Fig. 4a). A major microglia population in WT mice was characterized by a CD45mid:CD11b+:CX3CR1hi:F4/80+:CD64+:MERTK+:Siglec-H+:CD11c− signature (Extended Data Fig. 4b). Increased levels of Iba1, CD206, CD11c, F4–80, and TGFβ and decreased CX3CR1 expression was observed in WT mice expressing hTDP-43 but not in TREM2 KO mice (Extended Data Fig. 4c). Frequency analysis revealed that the number of microglia similarly increased in both WT and TREM2 KO mice expressing hTDP-43 at 5 weeks post-virus injection (Extended Data Fig. 4d). Consistently, microglia numbers were similarly increased in CX3CR1GFP/+ and CX3CR1GFP/+:TREM2 KO mice expressing hTDP-43 (Extended Data Fig. 5a, b). However, microglia differed morphologically with TREM2 KO mice exhibiting smaller soma size (Extended Data Fig. 5c).
Fig 2. TREM2 deficiency abolishes hTDP-43-induced CD11c+ microglia subpopulation.
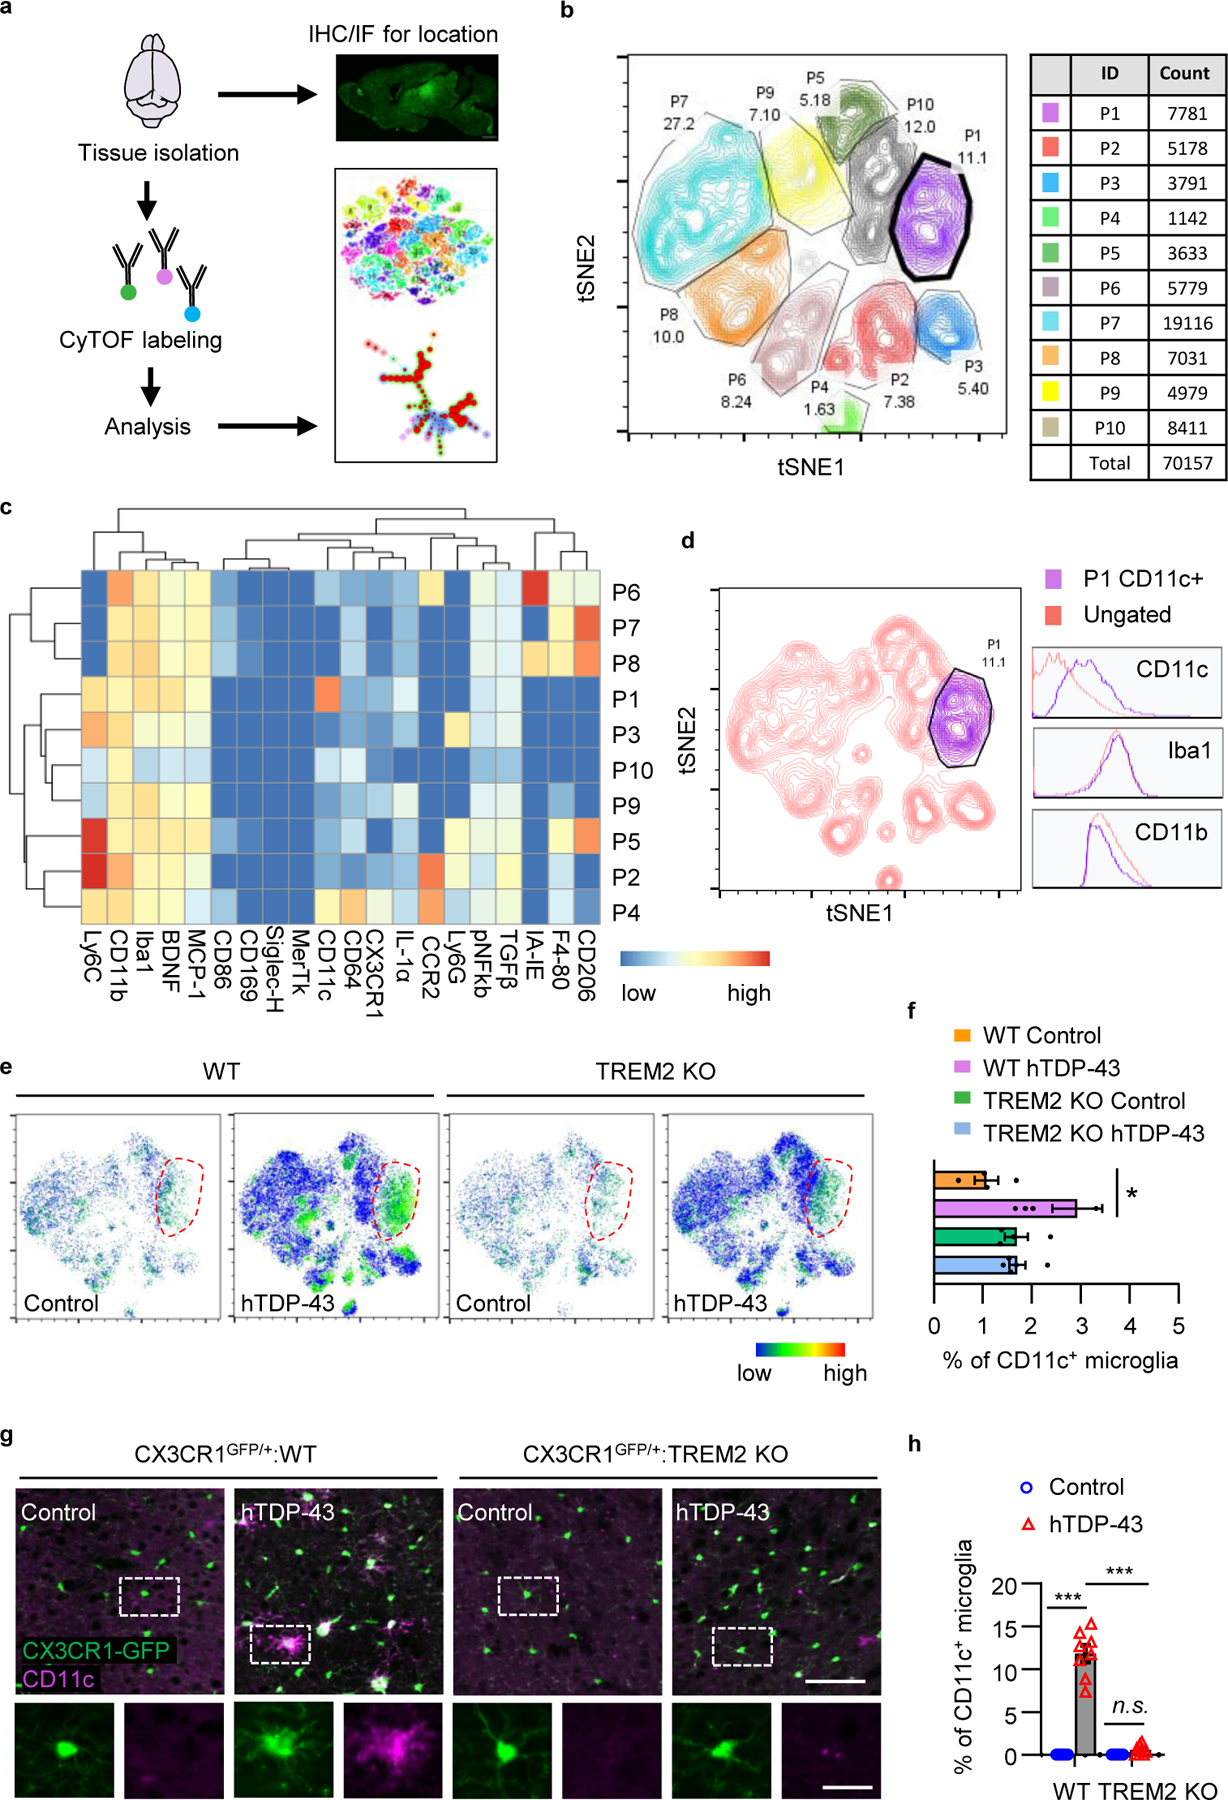
hTDP-43 protein expression was induced via intracerebroventricular injection of AAV9.CAG.hTDP-43 in neonatal mice (AAV9.CAG.Empty as control). a, Schematic workflow for cytometry by time of flight mass spectrometry (CyTOF). b, t-SNE map displaying 70157 CD45medCD11b+ microglia from 20 mice brain of 4 indicated groups at 35 dpi. Colors correspond to FlowSOM-guided clustering of microglia subpopulations. c, Heat map shows the expression levels of markers used for the microglia subpopulation analysis. Heat colors of expression levels have been scaled for each marker (blue, low expression; red, high expression). d, Single-cell t-SNE map highlights CD11c+ microglia sub-population. The histogram panels show the expression of CD11c, Iba1 and CD11b. e, t-SNE map reveals a unique CD11c+ microglia sub-population indicated by dotted circle in WT mice expressing hTDP-43 at 35 dpi. The color code shows the expression level of CD11c (blue, low expression; red, high expression). f, Frequency analysis of CD11c+ microglia based on manual gating of indicated groups at 35 dpi. g, Representative images (g) and quantification (h) of CD11c (purple) expression by immunostaining in the primary motor cortex of indicated groups at 35 dpi. Scale bar, 100 μm. High magnification images as indicated by area in dotted white box showing at the bottom. Scale bar, 10 μm. In f and h, Significance was calculated using two-way ANOVA followed by Tukey’s post hoc test. Data represented as mean ± SEM. n.s., not significant, *P < 0.05, **P < 0.01, *** P < 0.001. f, n = 4 for control groups; n = 6 for WT group with hTDP-43; n = 5 for TREM2 KO group with hTDP-43, P = 0.0146, F 3,10 = 5.807; h, n = 8 per group, P < 0.0001, F 3,21 = 140.9.
We then examined t-SNE map (t-distributed Stochastic Neighbor Embedding) using 70157 microglia pooled from all samples (Fig. 2b). Microglia were divided into 10 clusters by phenotypic heat maps (Fig. 2c). Interestingly, a sub-cluster of microglia with distinctive CD11chigh phenotype was highlighted in WT hTDP-43 expressing mice (Fig. 2d–f). Moreover, in TREM2 KO hTDP-43 expressing mice, this CD11chigh microglia subpopulation was largely reduced (Fig. 2e, f). CD11c+ microglia have also been reported in a mouse model of AD and ALS, with CD11c being a potential marker for disease-associated microglia (DAM)12, 17. Using immunostaining, we confirmed these findings as the microglia subpopulation expressing CD11c was observed only in WT mice but not TREM2 KO mice expressing hTDP-43 (Fig. 2g, h). To further explore the function of CD11c+ microglia, we performed co-staining for Iba1 and CD11c with GFP-hTDP-43. We observed that microglia with phagocytosed GFP-hTDP-43 (phagocytic microglia) had higher CD11c expression (Extended Data Fig. 5d, e). Together, our results suggest TREM2 deficiency abolishes the hTDP-43-induced CD11c+ microglia subpopulation which may be important for phagocytosing hTDP-43.
TREM2 deficiency locks microglia into a homeostatic status.
To investigate how TREM2 deficiency affects microglial response, we stereotactically injected GFP-hTDP-43 virus into the primary motor cortex of 2-month-old mice (Fig. 3a and Extended Data Fig. 6a). At day 14 post-virus injection, hTDP-43 inclusions were predominantly in neuronal nuclei and diffusely in cytoplasm (Extended Data Fig. 6b). hTDP-43 expression in WT and TREM2 KO groups did not differ significantly (Extended Data Fig. 6c, d), indicating similar viral transduction efficiency. This is further confirmed by immunoblotting against GFP or TDP-43 (Extended Data Fig. 6e). As expected, microglia accumulation was abundant in areas of hTDP-43 expression at 14 days post-virus injection in both WT and TREM2 KO mice (Extended Data Fig. 6f, g). Additionally, WT microglia exhibited a canonical reactive phenotype, less ramified with enlarged soma and shorter processes, in response to hTDP-43 expression (Fig. 3b–e). However, this hTDP-43-induced reactive phenotype was significantly attenuated in TREM2 KO mice (Fig. 3b–e).
Fig 3. TREM2 deficiency locks microglia into a homeostatic state in TDP-43-induced neurodegeneration.
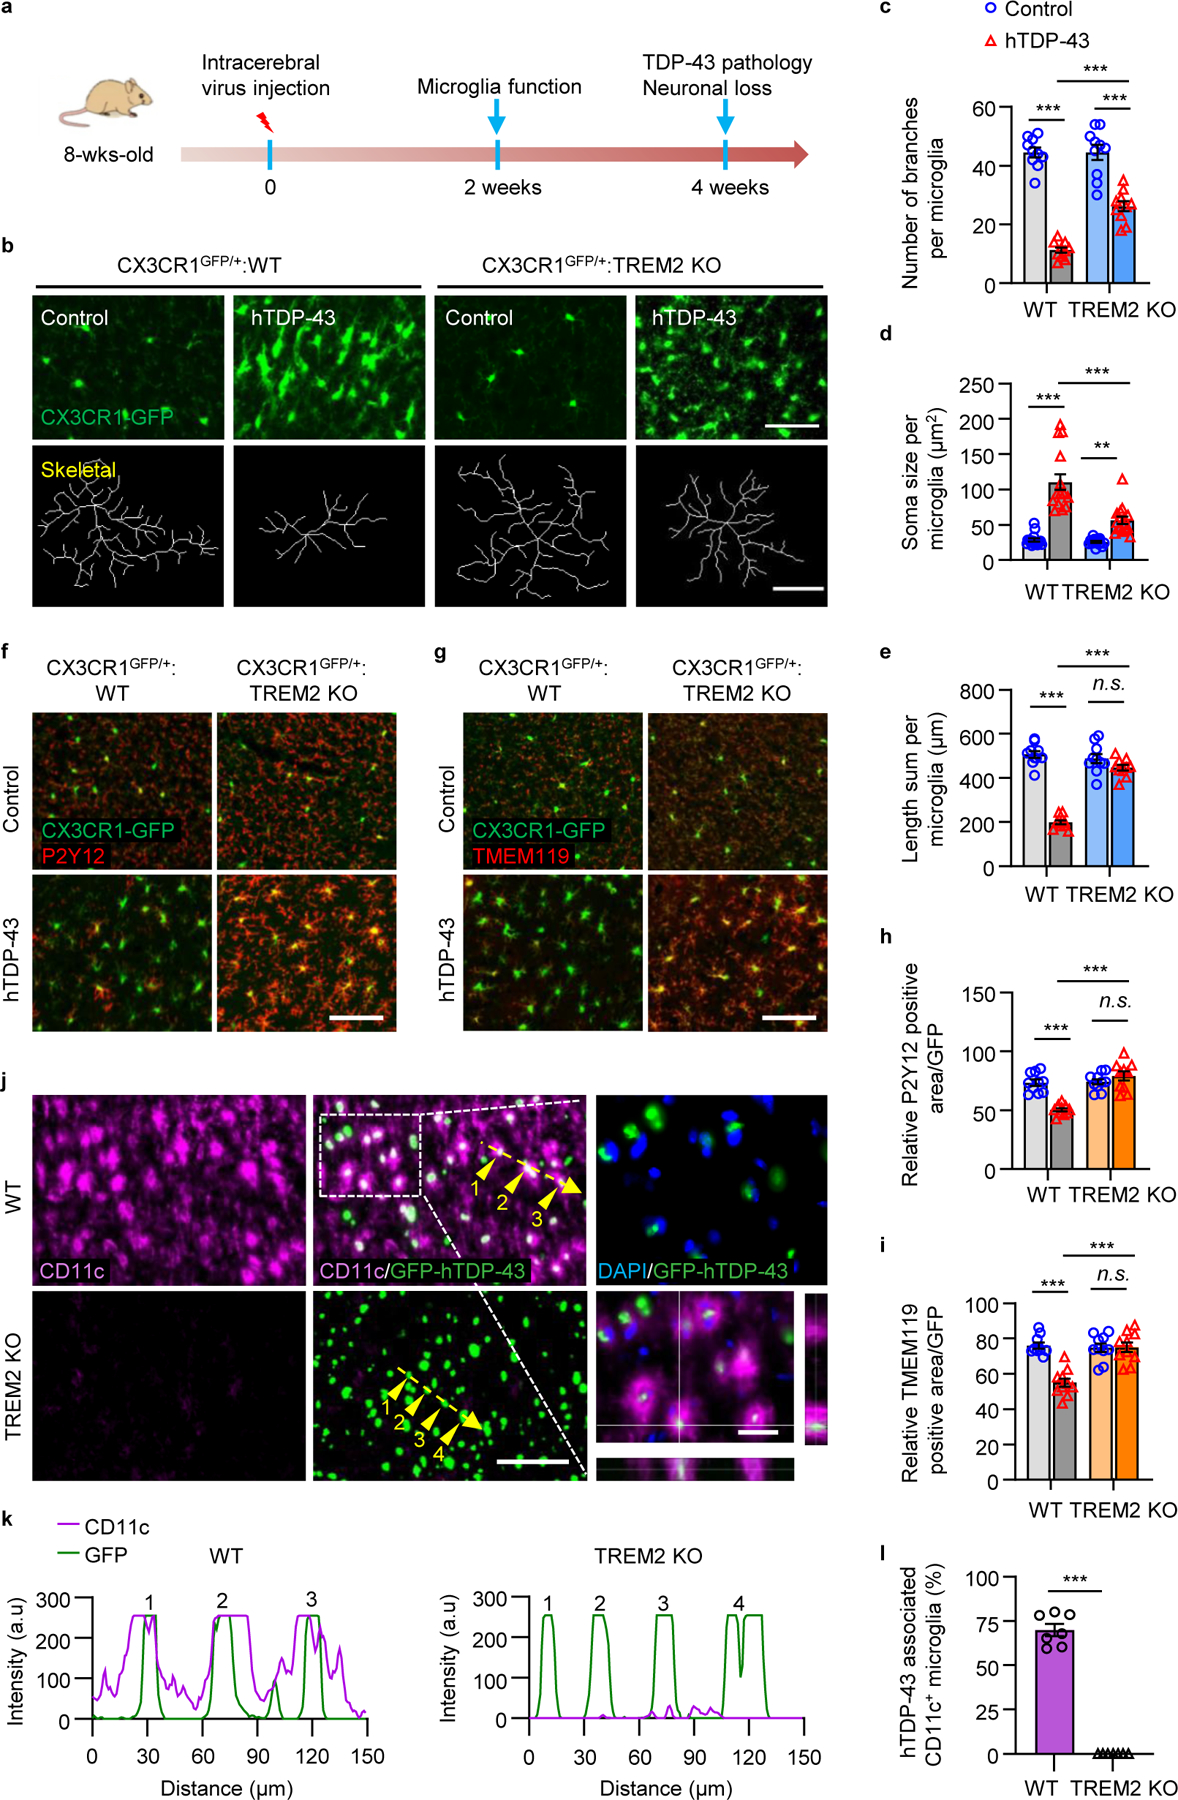
In adult local injection model, hTDP-43 or GFP-hTDP-43 was expressed in the primary motor cortex of 2-month-old mice via stereotactic intracerebral injection of AAV9.CAG.hTDP-43 or AAV9.CAG.hTDP-43.GFP (AAV9.CAG.Empty or AAV9.CAG.GFP as control). a, Timeline for local injection model. b, Representative images (upper panels. Scale bar, 100 μm) and skeletal images (lower panels. Scale bar, 10 μm) of GFP-expressing microglia in the primary motor cortex of indicated groups at 14 dpi. c-e, Quantification of microglia number of branches (c), soma size (d), and process length (e) in b. f,g, Representative images of P2Y12 expression (f) and TMEM119 expression (g) in the primary motor cortex of indicated groups at 7 dpi. Scale bar, 100 μm. h, i, Quantification of relative P2Y12 (h) and TMEM119 (i) positive area. j, Representative images of CD11c (purple), hTDP-43 (green), and DAPI staining (blue) in the primary motor cortex of indicated groups at 28 dpi. Scale bar, 100 μm. High magnification images as indicated by area in dotted white box showing on the right. Scale bar, 10 μm. k, Analysis of co-localization of CD11c with GFP-hTDP-43 in the primary motor cortex of indicated groups at 28 dpi. Fluorescence intensity profiles of CD11c and GFP-hTDP-43 show the distribution of fluorescence across the yellow dotted arrows in j. l, Quantification of the CD11c+ microglia in i. Significances were calculated using either two-way ANOVA, Tukey’s post-hoc analysis (c-e, h and i) or two-tailed unpaired Student’s t-test (l). Data represented as mean ± SEM. n.s., not significant, *P < 0.05, **P < 0.01, *** P < 0.001. c, n = 10 per group, P < 0.0001, F 3,27 = 80.39; d, n = 15 per group, P < 0.0001, F 3,42 = 38.44; e, n = 10 per group, P < 0.0001, F 3,27 = 89.88; h, n = 10 per group, P < 0.0001, F 3,27 = 24.12; i, n = 10 per group, P = 0.0146, F 3,27 = 14.90; l, n = 7 per group, P < 0.0001, t = 20.47, d.f. = 12.
We next examined two microglia homeostatic markers, P2Y12 and TMEM11918, in response to hTDP-43 expression. P2Y12 and TMEM119 were largely confined to microglial processes under basal conditions in both WT and TREM2 KO mice (Fig. 3f, g). We found that hTDP-43 induced remarkable downregulation of P2Y12 and TMEM119 in WT microglia (Fig. 3f–i). However, both P2Y12 and TMEM119 expression were unchanged in TREM2 KO microglia after hTDP-43 expression (Fig. 3f–i). These results suggest that TREM2 deficiency attenuates microglial activation in response to hTDP-43 and locks microglia into a homeostatic status.
We next characterized the CD11c+ microglia subpopulation in this adult local injection model. Consistent with the neonatal model, we found dramatic microglial CD11c upregulation in WT but not TREM2 mice in response to local hTDP-43 expression (Fig. 3j). Additionally, CD11c+ microglia are mostly associated with GFP-hTDP-43 in WT but not TREM2 KO mice (Fig. 3k, l). Notably, the percentage of CD11c+ microglia is much higher in the adult local injection model when compare with the neonatal model because of more concentrated pathology. These results indicate that TREM2-dependent CD11c+ microglia may phagocytose pathological hTDP-43 proteins.
TREM2 deficiency reduces clearance of TDP-43 by microglia.
A recent study suggested that microglia actively participate in clearing hTDP-43 in a transgenic TDP-43 mouse model19. We therefore tested whether TREM2 mediates microglia hTDP-43 clearance first by performing CD68 immunostaining 14 days post-virus injection. Indeed, hTDP-43 significantly increased CD68 expression in WT mice over TREM2 KO mice (Fig. 4a.b). Additionally, these CD68+ microglia have high CD11c expression and are co-localized with GFP-hTDP-43 (Fig. 4c). Next, we directly investigated whether hTDP-43 was phagocytosed by microglia. At 4 weeks post-virus injection, we found that the number GFP-hTDP-43 containing microglia was significantly higher in WT than TREM2 KO mice (Fig. 4d, e, Extended Data Fig. 6h). Moreover, hTDP-34 was in the cytoplasm but not nucleus of Iba1+ microglia (Fig. 4d). Co-localization analysis confirmed that GFP-hTDP-43 existed in the soma of WT, but not TREM2 KO microglia (Fig. 4f). Consistent with the neonate model, we found that phagocytic microglia (colocalized with hTDP-43) had higher CD11c expression when compared with non-phagocytic microglia (Fig. 4g, h). Thus, our results suggest that TREM2 is required for phagocytosis of hTDP-43.
Fig 4. TREM2 deficiency impairs microglial phagocytosis of pathological hTDP-43 protein.
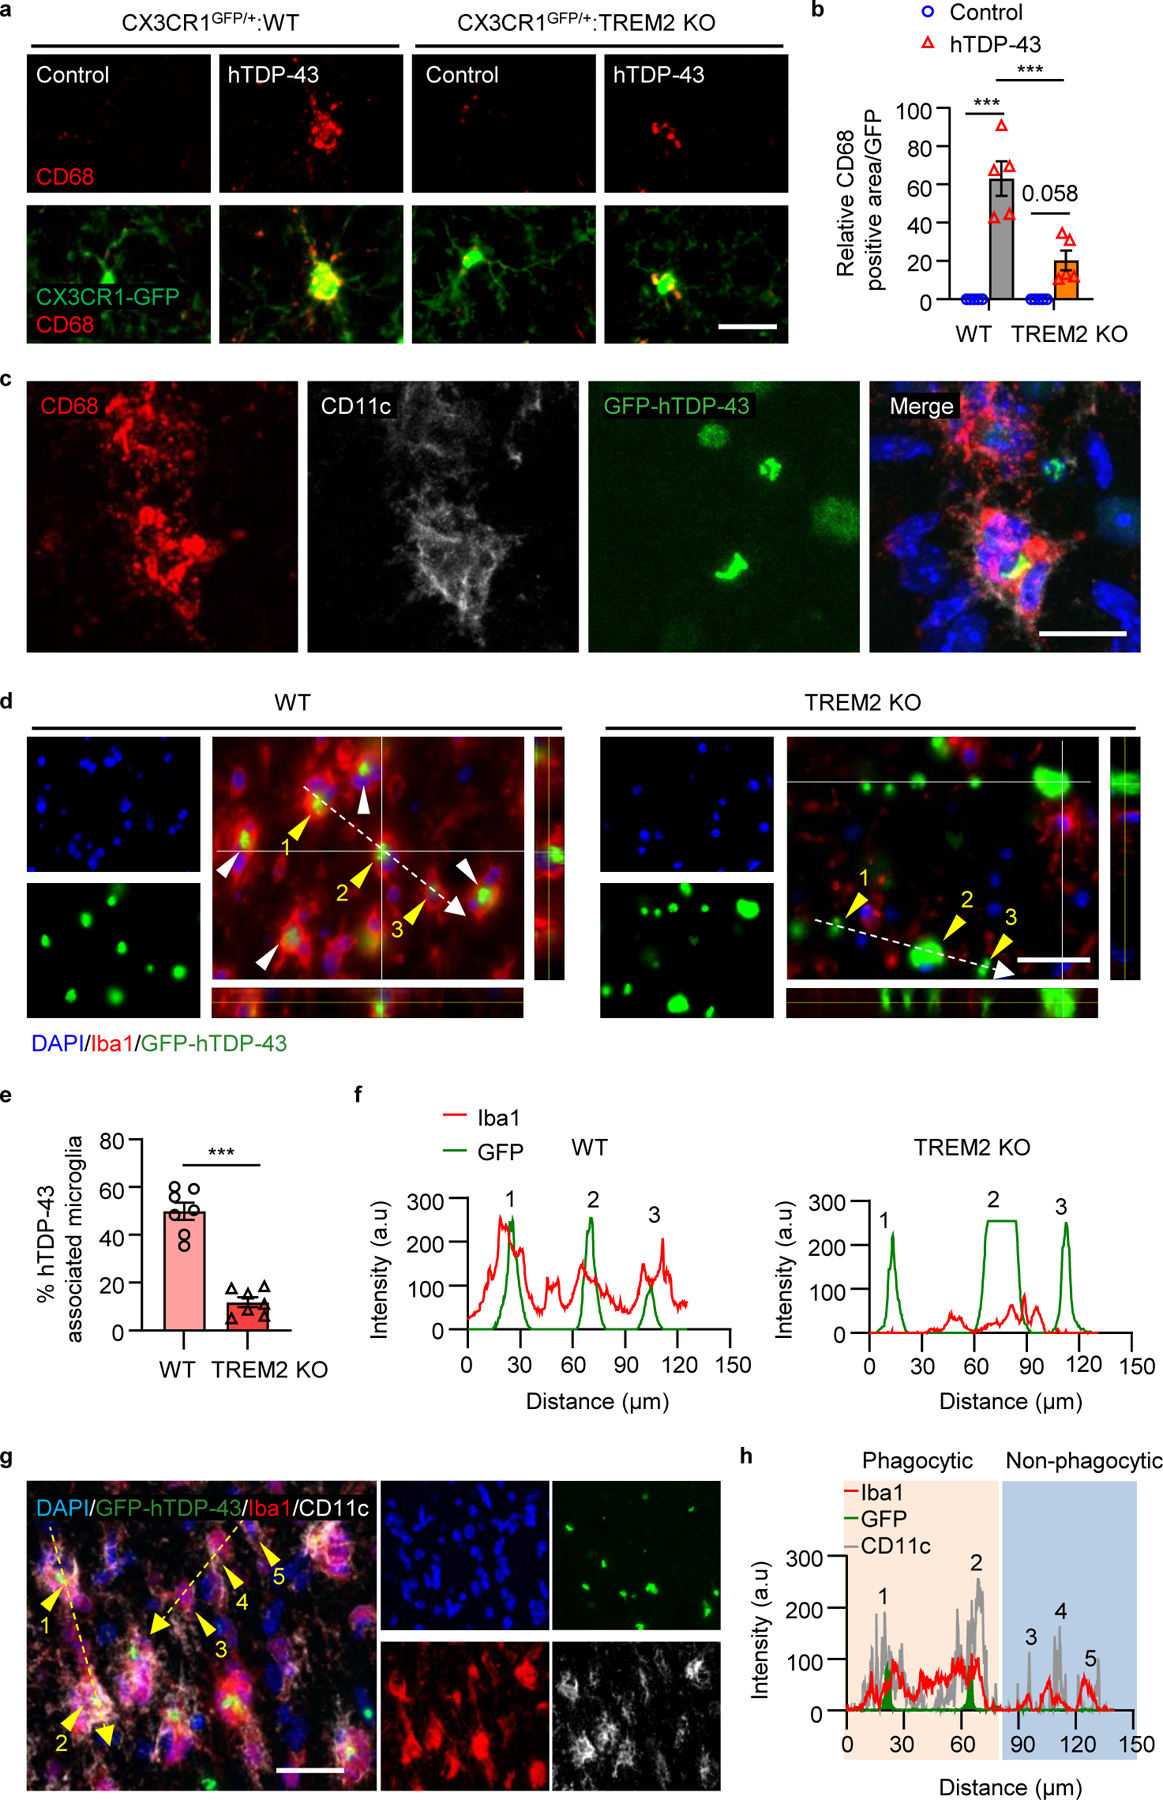
hTDP-43 or GFP-hTDP-43 was expressed in the primary motor cortex of 2-month-old mice via stereotactic intracerebral injection of AAV9.CAG.hTDP-43 or AAV9.CAG.hTDP-43.GFP (AAV9.CAG.Empty or AAV9.CAG.GFP as control). a,b, Representative images (a) and quantification (b) of CD68 expression (red) in microglia (CX3CR1-GFP, green) in the primary motor cortex of indicated groups at 14 dpi. Scale bar, 100 μm. c, Representative images of CD68 (red) and CD11c (white) expression in microglia phagocytosing GFP-hTDP-43 (green) in the primary motor cortex of WT mice at 14 dpi. Scale bar, 10 μm. d,e, Representative images (d) and quantification (e) of microglia (Iba1, red) phagocytosis of GFP-hTDP-43 (green) in the primary motor cortex of indicated groups at 28 dpi, as indicated by the arrowheads. Scale bar, 20 μm. f, Analysis of co-localization of Iba1 (red curves) and GFP-hTDP-43 (green curves). Fluorescence intensity profiles of Iba1 and GFP-hTDP-43 show the distribution of fluorescence across the white dotted arrows in d. g, Representative images of co-localization of CD11c (white) with Iba1 (red) in microglia phagocytosing GFP-hTDP-43 (green) in the primary motor cortex of WT mice at 28 dpi. Scale bar, 10 μm. h, Analysis of co-localization of Iba1 (red curves), CD11c (grey curves) and GFP-hTDP-43 (green curves). Fluorescence intensity profiles of Iba1, CD11c, and GFP-hTDP-43 show the distribution of fluorescence across the yellow dotted arrows in g. Significances were calculated using either two-way ANOVA, Tukey’s post-hoc analysis (b) or two-tailed unpaired Student’s t-test (e). Data are represented as mean ± SEM. n.s., not significant, *P < 0.05, **P < 0.01, *** P < 0.001. b, n = 5 per group, P < 0.0001, F 3,12 = 36.21; e, n = 7 per group, P < 0.0001, t = 9.227, d.f. = 12.
TREM2 deficiency leads to greater TDP-43 accumulation.
To characterize the dynamic changes of hTDP-43 pathology resulting from microglial phagocytic clearance, we examined total and p-TDP-43 level at 4 weeks following hTDP-43 expression. Immunostaining results showed that p-TDP-43 was co-localized with GFP-hTDP-43 clusters in both WT and TREM2 KO mice (Fig. 5a, b). However, TREM2 KO mice had significantly more hTDP-43 and p-TDP-43 accumulation than WT mice (Fig. 5c, d). In addition, the average size of GFP-hTDP-43 clusters was much larger in TREM2 KO mice (Fig. 5e). Particle size distribution analysis revealed that hTDP-43 clusters with a size below 4 μm2 or over 20 μm2 were much higher in TREM2 KO than in WT mice (Fig. 5f).
Fig 5. TREM2 deficiency leads to increased accumulation of pathological hTDP-43 protein.
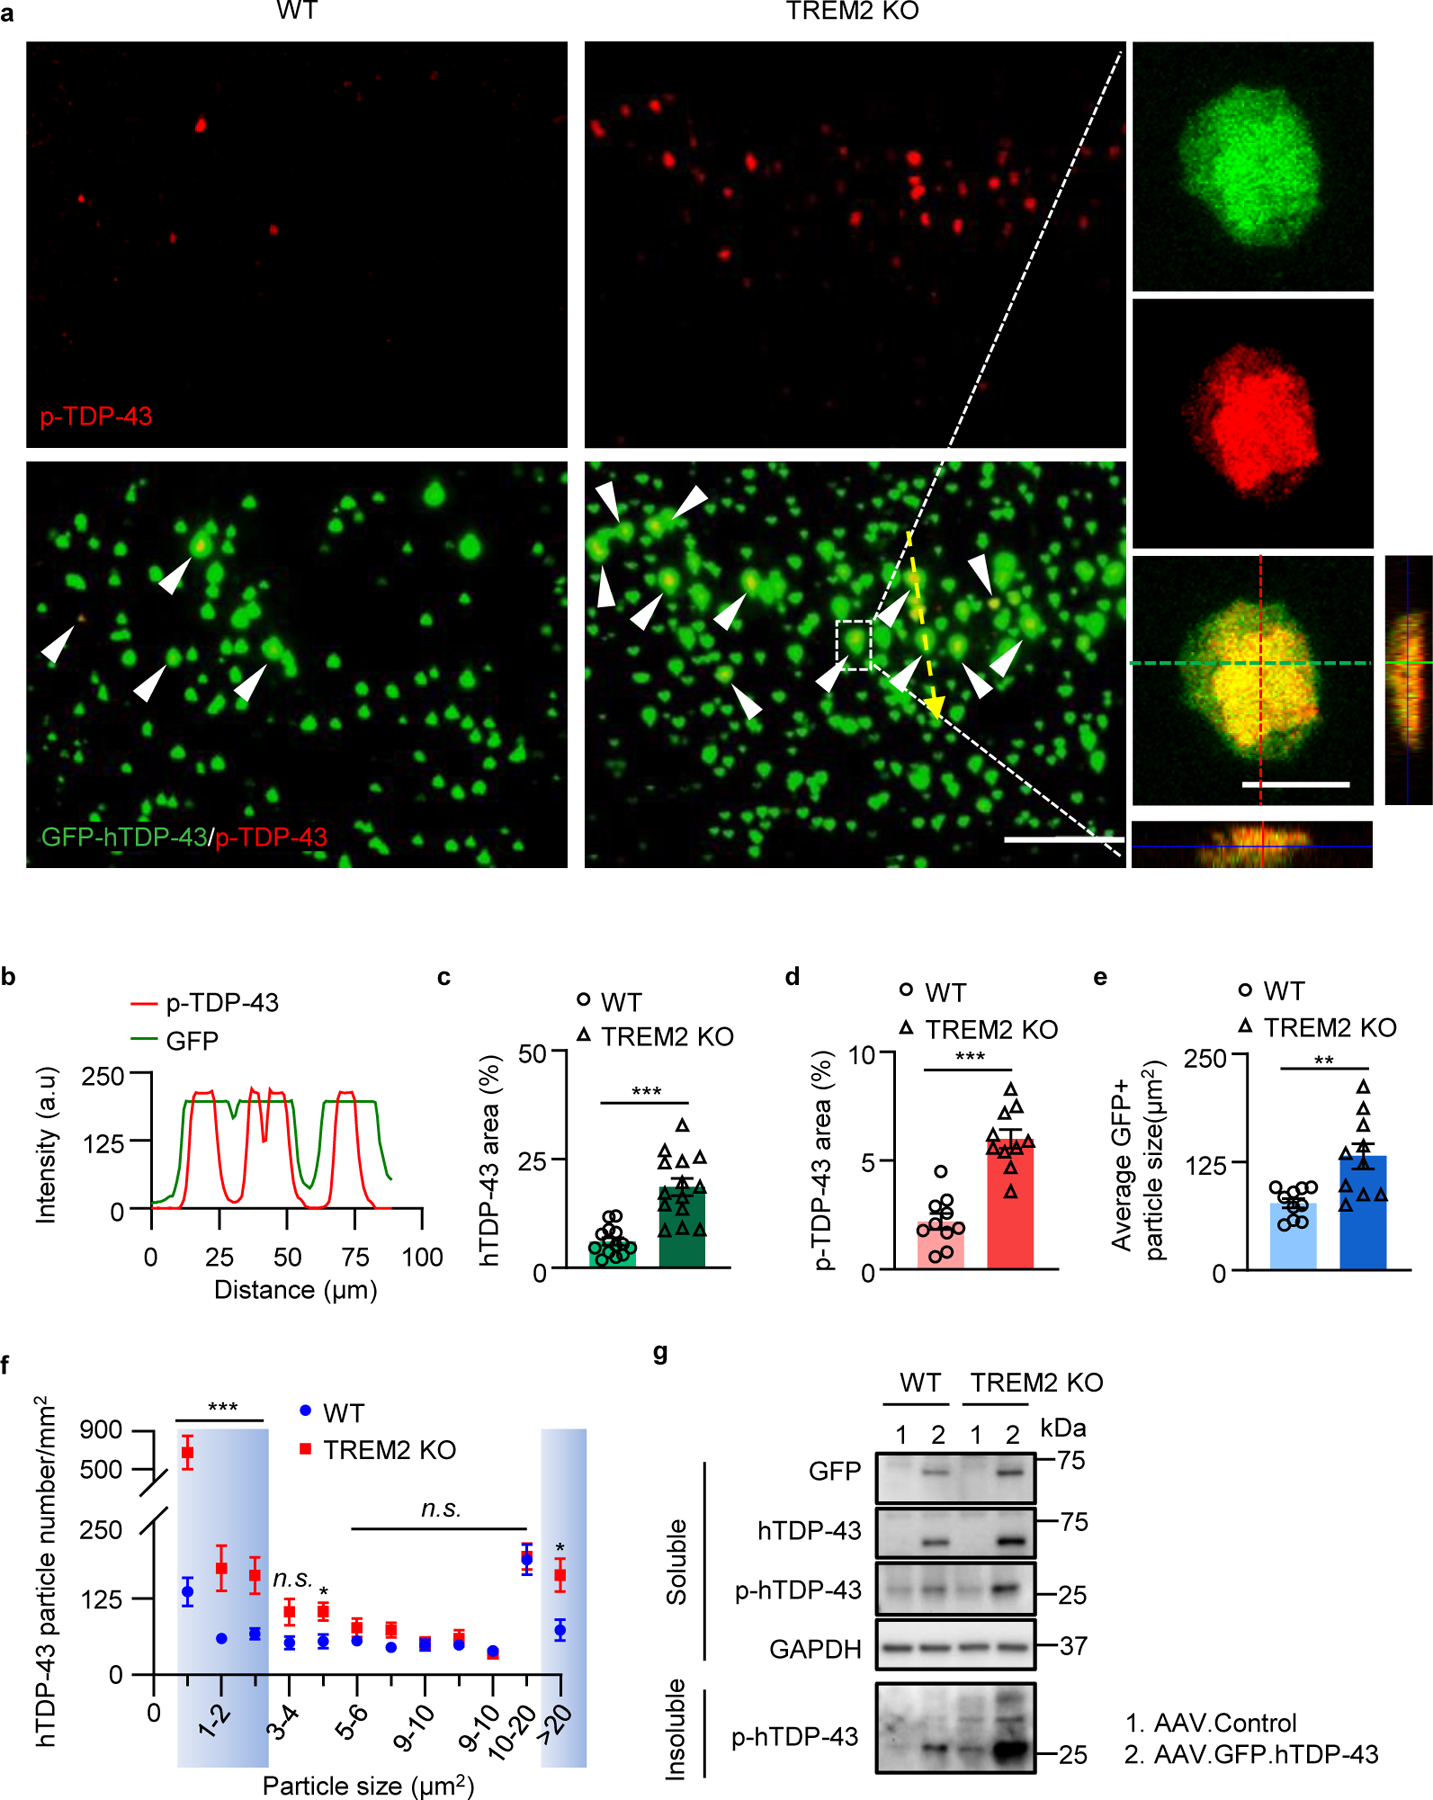
GFP-hTDP-43 was expressed in the primary motor cortex of 2-month-old mice via stereotactic intracerebral injection of AAV9.CAG.hTDP-43.GFP (AAV9.CAG.GFP as control). a, Representative images of co-localization of p-TDP-43 with GFP-hTDP-43 in the primary motor cortex of indicated groups at 28 dpi, as indicated by white arrowheads. Scale bar, 100 μm. High magnification images as indicated by area in dotted white box showing on the right. Scale bar, 10 μm. b, Analysis of co-localization of p-TDP-43 and GFP-hTDP-43. Fluorescence intensity profiles of p-TDP-43 and GFP-hTDP-43 show the distribution of fluorescence across the yellow dotted arrow in a. c-e, Quantification of hTDP-43 area (c), p-TDP-43 area (d) and GFP+ particle size (e) in a. f, Analysis of hTDP-43 particle size distribution in a. Particles with size below 4 μm2 or over 20 μm2 are highlighted by blue. g, GFP-hTDP-43 and p-hTDP-43 (Ser409/410) immunoblots of the soluble fractions and p-hTDP-43 immunoblots of the Sarkosyl-insoluble fraction from primary motor cortex of indicated groups at 28 dpi. Western blots were independently repeated four times (n = 4 per group). GAPDH was used as loading control. In c, d, e, and f, Significance was calculated using two-tailed unpaired Student’s t-test. Data represented as mean ± SEM. n.s., not significant, *P < 0.05, **P < 0.01, *** P < 0.001. c, n = 14 per group, P < 0.0001, t = 5.782, d.f. = 26; d, n = 10 per group, P < 0.0001, t = 6.662, d.f. = 18; e, n = 10 per group, P = 0.0027, t = 3.478, d.f. = 18; f, n = 9 per group, 0–1 μm2 : P = 0.0004, t = 4.419, d.f. = 16; 1–2 μm2 : P = 0.0073, t = 3.073, d.f. = 16; 2–3 μm2 : P = 0.0075, t = 3.056, d.f. = 16; 4–5 μm2 : P = 0.0185, t = 2.623, d.f. = 16; >20 μm2 : P = 0.0119, t = 2.837, d.f. = 16.
Western blot analysis of motor cortices for GFP-hTDP-43 found higher levels of both hTDP-43 and a ~27 kD fragment p-hTDP-43 in TREM2 KO mice than WT mice in soluble fractions (Fig. 5g). Interestingly, full length p-hTDP-43 was not detected in the adult local injection model (Fig. 5g). To test whether the large GFP-hTDP-43 particles with high p-TDP-43 content were aggregated, we isolated sarkosyl-insoluble fractions for further analysis. Indeed, cleaved p-hTDP-43 fragments were the major component and were significantly more abundant in the insoluble fraction of TREM2 KO mice (Fig. 5g). Together, these results indicate that microglia TREM2 is critical for microglial clearance of TDP-43. In TREM2 KO mice, the uncleared hTDP-43 clusters are prone to being cleaved and forming hyperphosphorylated aggregates.
We next assessed neuronal loss and found that hTDP-43 expression lead to reduced NeuN staining, which was further aggravated by TREM2 KO (Extended Data Fig. 7a, b). Interestingly, many microglia interact with presumably damaged neurons in WT mice but not TREM2 KO mice following hTDP-43 expression (Extended Data Fig. 7c, d). In addition, those neuron-associated microglia had high CD11c expression (Extended Data Fig. 7e), suggesting a phagocytic function. Thus, these results collectively demonstrate that TREM2 deficiency leads to greater brain tissue accumulation of hTDP-43 protein which aggravates TDP-43-induced neurodegeneration.
TDP-43 interacts with TREM2 in vitro and in vivo.
The TDP-43 protein in ALS patient blood and CSF is likely released from cells via extracellular vesicles20. We hypothesize that hTDP-43 released into the CNS parenchyma from degenerating neurons can be detected by microglia through TREM2. To test this hypothesis, we used human iPSC-derived neurons infected with GFP-hTDP-43 virus and evaluated hTDP-43 release. By day 21 after virus infection, hTDP-43 was robustly expressed throughout the cytoplasm (Extended Data Fig. 8a). We found that extracellular hTDP-43 was detectable in the culture medium directly and by capture via bead-immobilized GFP antibodies (Extended Data Fig. 8b). Interestingly, using antibody recognizing N-terminal hTDP-43, we observed cleaved products of ~25 kD in the culture medium, suggesting a mix of full-length and N-terminal fragments were released (Extended Data Fig. 8b).
Next, to test whether TREM2 interacts with hTDP-43, we performed the co-immunoprecipitation (co-IP) experiments. To this end, we transfected human embryo kidney (HEK) 293T cells with myc-tagged hTREM2 (myc-hTREM2) or control plasmids. hTREM2 was immunoprecipitated using an hTREM2 antibody. Immunoblotting against hTDP-43 revealed the co-IP of endogenous hTDP-43 from HEK cells (Fig. 6a). We then performed liquid chromatography with tandem mass spectrometry (LC-MS/MS) to characterize the interaction between TREM2 and hTDP-43. Specifically, annotated MS/MS spectra of V124LVEVLADPLDHR136 from hTREM2 and T103SDLIVLGLPWK114 from hTDP-43 were obtained from anti-hTREM2 immunoprecipitates (Fig. 6b). To further explore which domain of hTDP-43 interacts with TREM2, we co-transfected HEK cells with myc-hTREM2 and GFP-hTDP-43 C terminal fragment (residues 216–414) or GFP control plasmids (Extended Data Fig. 8c). GFP or GFP-tagged proteins were captured using bead-immobilized GFP antibody. Immunoblot using anti-Myc revealed the co-IP of GFP-hTDP-43 C terminal fragment with myc-hTREM2 (Extended Data Fig. 8d). In addition, co-IP using bead-immobilized myc antibody obtained similar results (Extended Data Fig. 8e). To further distinguish hTREM2 interacting proteins from contaminating proteins, we employed a stable isotope labeling with amino acids in cell culture (SILAC)-based quantitative proteomics to study the hTREM2 interactome21 (Extended Data Fig. 9a). As expected, hTREM2 was labeled with heavy amino acid as evidenced by the lack of light peptides (Extended Data Fig. 9b and c). The analysis of mass spectra revealed 157 potential hTREM2 interacting proteins including hTDP-43. A list of the 10 proteins with highest intensity is provided in supplementary Table 2.
Fig 6. hTDP-43 interacts with TREM2 in vitro and in vivo in mouse brain.
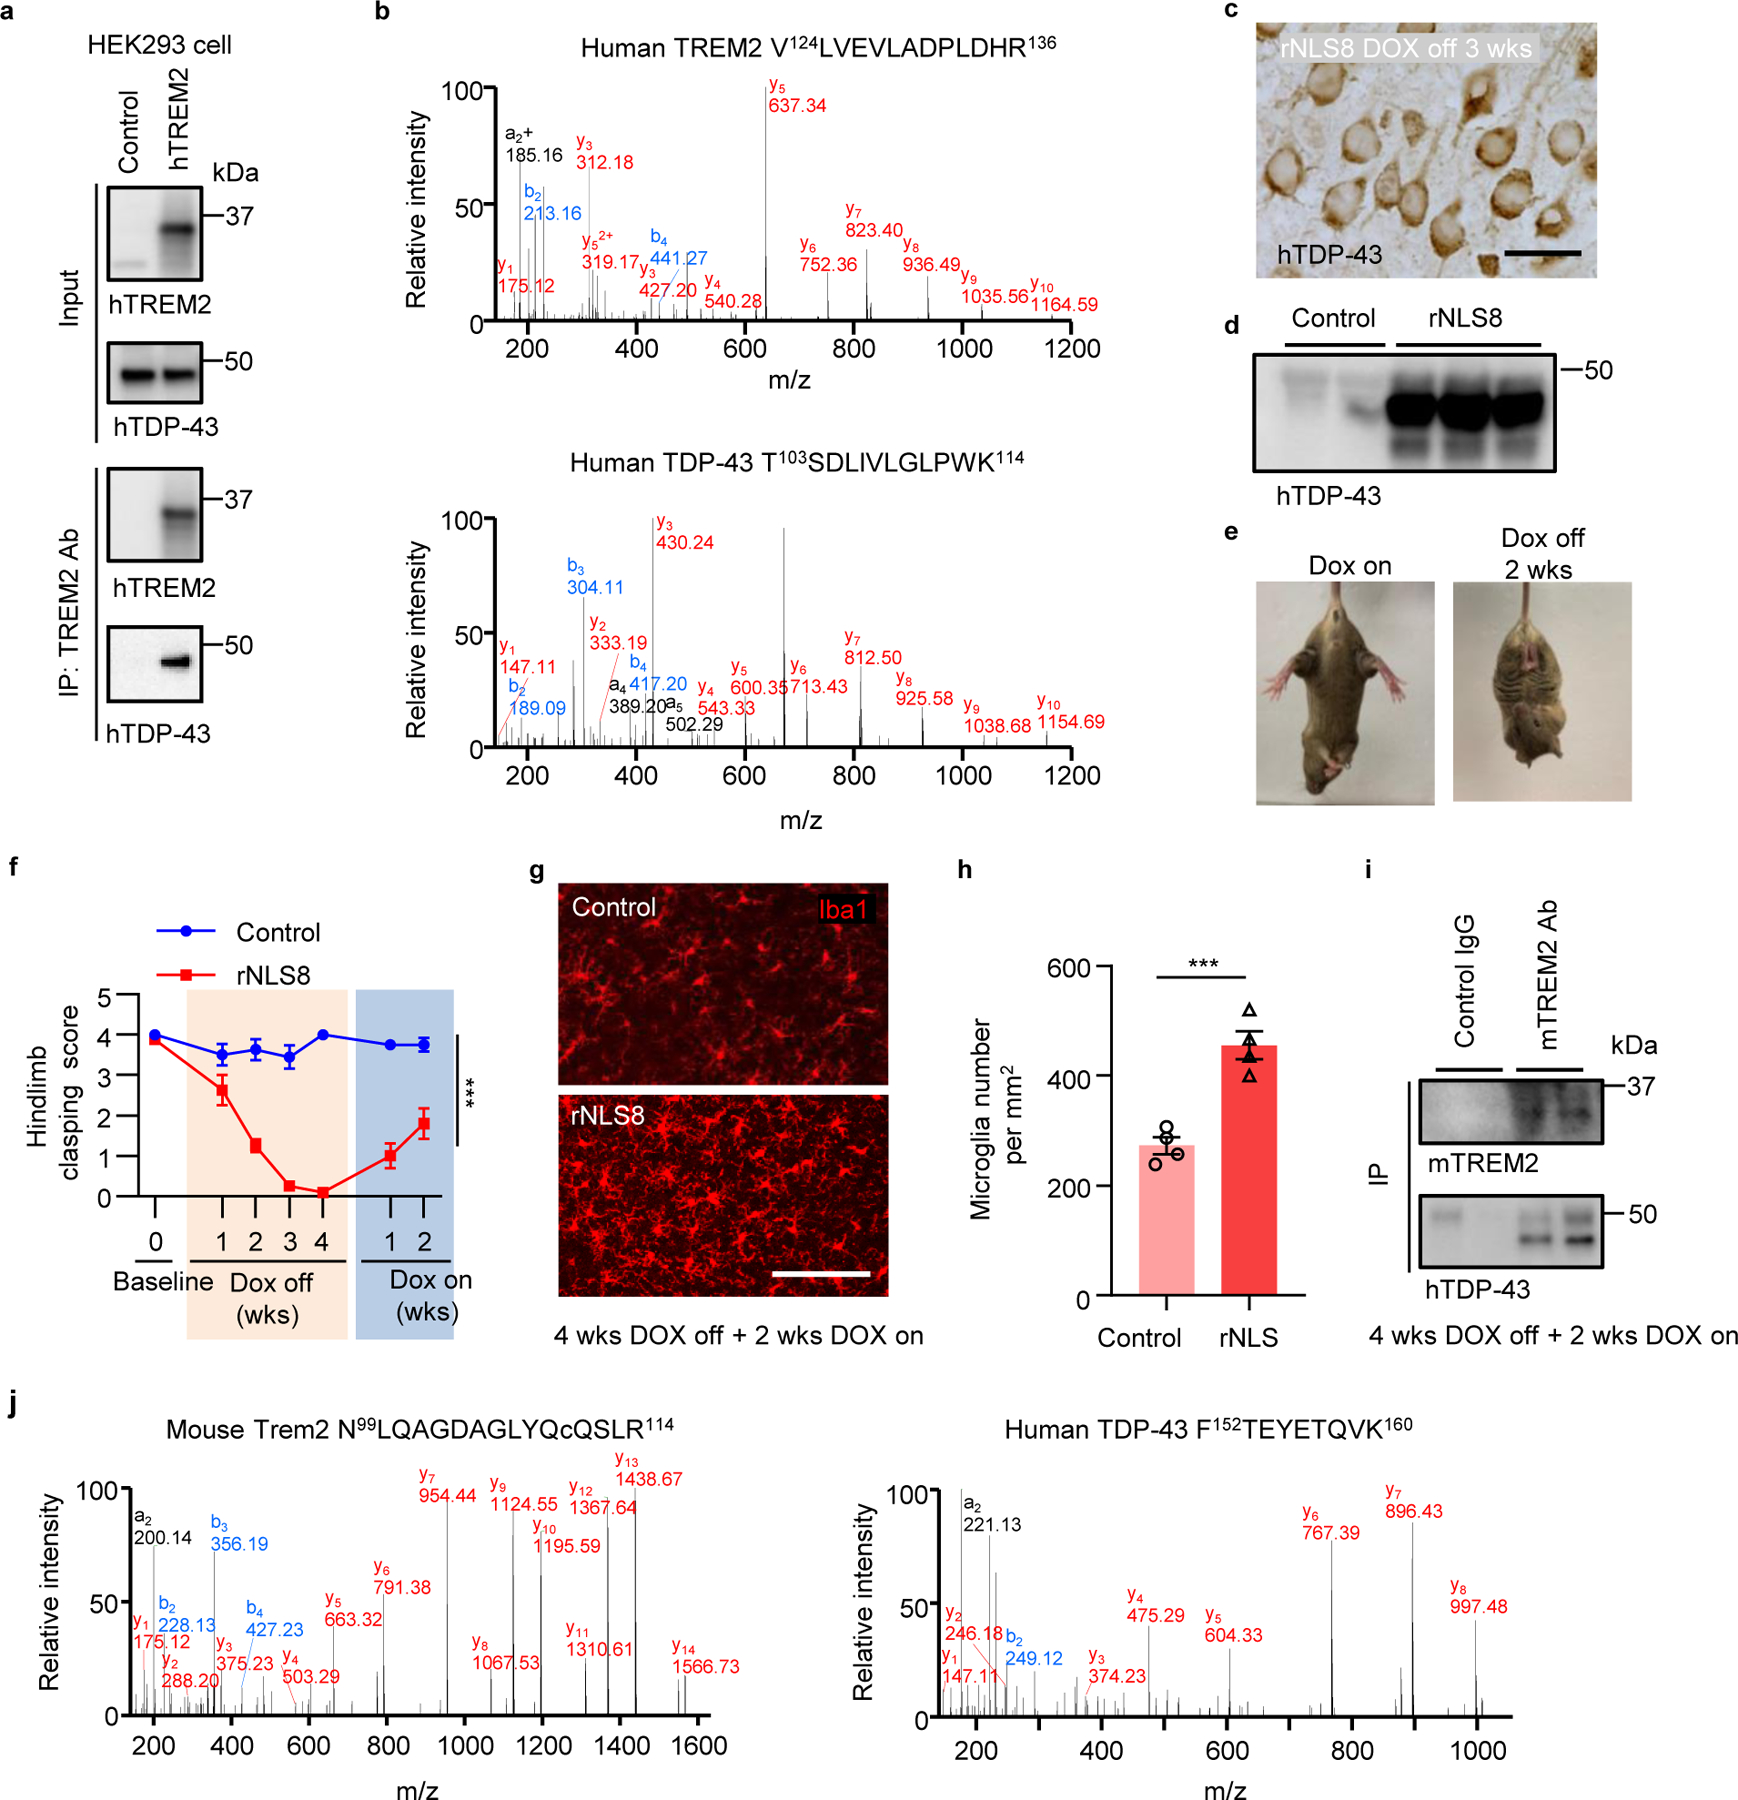
a, hTDP-43 was co-immunoprecipitated with myc-hTREM2 in HEK 293T cells overexpressing hTREM2. Experiments were independently repeated three times. b, Annotated MS/MS spectra of V124LVEVLADPLDHR136 from hTREM2 and T103SDLIVLGLPWK114 from hTDP-43 identified in anti-hTREM2 immunoprecipitates from HEK 293T cells. c, Representative images of hTDP-43 expression in cytosol in the primary motor cortex of rNLS8 mice at 3 weeks off DOX diet. Scale bar, 20 μm. d, hTDP-43 immunoblots of primary motor cortex of rNLS8 mice at 3 weeks off DOX diet. e, rNLS8 mice showed clasping phenotype at 2 weeks off DOX diet. f, Hindlimb clasping response scores over 4 weeks off DOX diet followed by 2 weeks DOX on. g,h, Representative images (g) and quantification (h) of microglia (Iba1, red) in the primary motor cortex of indicated groups at 4 weeks off DOX diet followed by 2 weeks DOX on. Scale bar, 100 μm. i, Endogenous mTREM2 was co-immunoprecipitated with hTDP-43 in the motor cortex of rNLS8 mice at 4 weeks off DOX diet followed by 2 weeks DOX on. Experiments were independently repeated three times. j, Annotated MS/MS spectra of N99LQAGDAGLYQcQSLR114 (c is carbaminomethylated cysteine) from mTREM2 and F152TEYETQVK160 from hTDP-43 in anti-mTREM2 immunoprecipitates from rNLS8 mouse cortex tissue at 4 weeks off DOX diet followed by 2 weeks DOX on. Significance was calculated using either two-way ANOVA, Tukey’s post-hoc analysis (f) or two-tailed unpaired Student’s t-test (h). Data represented as mean ± SEM. n.s., not significant, *P < 0.05, **P < 0.01, *** P < 0.001. f, n = 12 per group, P < 0.0001, F 6,110 = 19.97; h, n = 4 per group, P = 0.0008, t = 6.149, d.f. = 6.
To evaluate the possible interaction between TREM2 and TDP-43 in vivo, we used an inducible mouse model of ALS-rNLS8, which expresses mutant hTDP-43 (hTDP-43-ΔNLS) in a doxycycline (DOX)-dependent manner14. We confirmed that mutant hTDP-43 accumulated in cytoplasm after expression (Fig. 6c, d) and observed typical clasping phenotype when hTDP-43-ΔNLS was induced during removal of DOX diet, with a rapid functional recovery as early as 2 weeks back on DOX diet (Fig. 6e, f). In addition, we found dramatic microglial activation during the recovery period (Fig. 6g, h). We then performed immunoprecipitation using a biotinylated mTREM2 antibody with rNLS8 brain lysates. Immunoblotting against mTREM2 and hTDP-43 revealed co-IP of endogenous mTREM2 with hTDP-43 (Fig. 6i). We then analyzed the anti-mTREM2 immunoprecipitates from rNLS8 mouse cortex tissue by LC-MS/MS. Similarly, we were able to detect both mTREM2 and hTDP-43 in the immunoprecipitates and the MS/MS spectra of a representative peptide N99LQAGDAGLYQCQSLR114 from mTREM2 and F152TEYETQVK160 from hTDP-43 (Fig. 6j). Next, to study the interaction in situ, we performed co-staining of Iba1 with TREM2 at 2 weeks following GFP-hTDP-43 expression in the adult primary motor cortex. Indeed, in WT mice with hTDP-43 overexpression, we found that TREM2 is co-localized with GFP-hTDP-43 (Extended Data Fig. 10a). Thus, these results suggest that hTDP-43 interacts with TREM2 in vitro and in vivo.
Finally, we wanted to determine if there are interactions between TREM2 and TDP-43 in human ALS patients. To this end, we obtained frozen autopsied specimens of ALS patients from the Mayo Clinic Brain Bank for Neurodegenerative Disorders (supplementary Table 3). In addition to well-known expression of TDP-43 in ALS patients8, we found that TREM2 expression in both cortex and spinal cord was greater than those from non-neurological controls (Fig. 7a, b). More importantly, an endogenous hTDP-43/TREM2 complex was co-immunoprecipitated from ALS patient spinal cord lysates (Fig. 7c). Taken together, our results indicate the interactions between TREM2 and hTDP-43 occurs in both mouse and human tissues.
Fig 7. hTDP-43 interacts with TREM2 in human tissues and in silico.
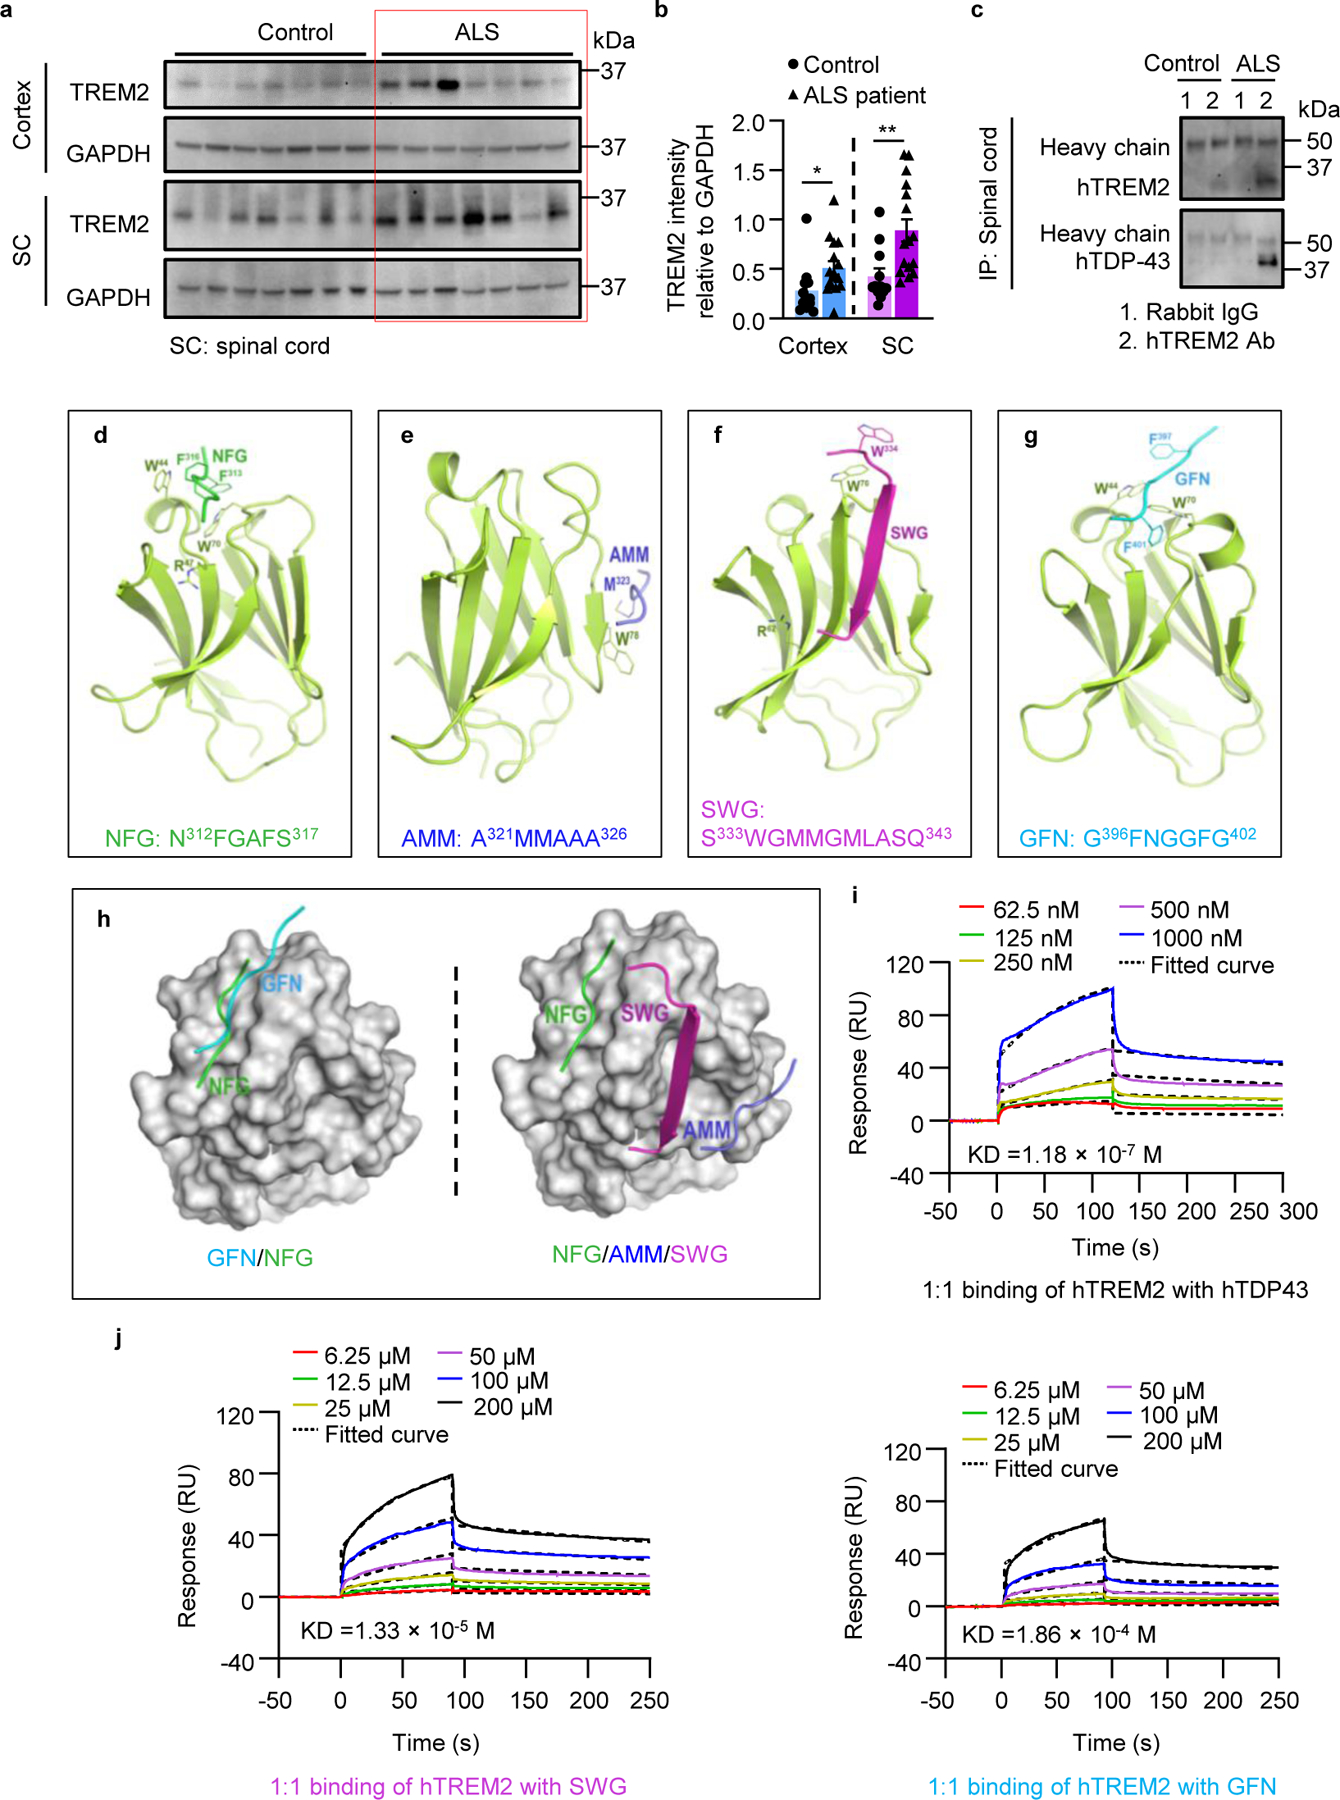
a, TREM2 immunoblots of frozen autopsied cortex and spinal cord specimens of ALS patients and age matched controls. b, Quantification of TREM2 level relative to GAPDH (n =12 for control, n = 16 for ALS patients). c, Endogenous TDP-43 of frozen autopsied spinal cord specimens from ALS patients was co-immunoprecipitated with TREM2. Experiments were independently repeated three times. d-g, Cartoon models of the human TREM2 extracellular ligand-binding domain in complex with four low-complexity domain (LCD) fragments of TDP-43, including NGF, AMM, SWG and GFN (NFG: N312FGAFS317; AMM: A321MMAAA326; SWG: S333WGMMGMLASQ343; GFN: G396FNGGFG402). h, Surface models of the TREM2 complex showing overlapping binding sites of GFN and NFG and distinct binding sites of NFG, AMM, and SWG. i, Surface plasmon resonance (SPR) analysis of the binding between recombinant hTREM2 ECD (Met1-Ser174) with full length hTDP-43. hTREM2 ECD was immobilized on a CM5 BIAcore chip and interacted with full length hTDP-43 at the indicated concentrations. j, SPR analysis of the binding between recombinant hTREM2 ECD (Met1-Ser174) with SWG and GFN at the indicated concentrations. SPR was independently repeated three times for full length hTDP-43. In b, Significance was calculated using two-tailed unpaired Student’s t-test. Data represented as mean ± SEM. n.s., not significant, *P < 0.05, **P < 0.01, *** P < 0.001. Cortex: P = 0.0316, t = 2.271, d.f. =26; SC: P = 0.0045, t = 3.112, d.f. = 26.
TREM2 interacts with residues 333–402 of hTDP-43 in silico.
To investigate the interaction between TREM2 and hTDP-43 at the atomic level, we performed a computational analysis. Our in vitro studies showed that TREM2 interacted with residues 216–414 of hTDP-43. Therefore, we carried out microsecond molecular dynamics (MD) simulations using forcefield FF12MC and the crystal structures of the extracellular ligand-binding domain (ECD) of hTREM2 and low-complexity domain (LCD) fragments of hTDP-4322. The four LCD fragments were N312FGAFS317 (NFG), A321MMAAA326 (AMM), S333WGMMGMLASQ343 (SWG), and G396FNGGFG402 (GFN) (Fig. 7d–g). They were chosen because of their involvement in irreversible stress granules22. Our visual inspection suggested the structural fitness between the residues in complementarity-determining regions (CDRs) of the TREM2 ECD and those in four LCD fragments of hTDP-43.
Four sets of 20 distinct, independent, unrestricted, unbiased and isobaric–isothermal MD simulations were carried out for each of the four LCD fragments in complex with the hTREM2 ECD. These fragments were manually docked into the same ECD region to have the LCD fragment surrounded by CDR2 on one side and CDR1 and CDR3 on the other side. Interestingly, the simulations showed that AMM and SWG moved out of the CDR1–3 to interact with β-strands residues 75–78 and 65–70 of the ECD (Fig. 7e, f). The relative interaction energies of the hTREM2 ECD with SWG, GFN, NFG, and AMM were −74, −38, −38, and −33 kcal/mol, respectively. Interestingly, GFN and NFG remained in the CDR1–3, and NFG (but not GFN) moved closer to R47 with its two phenyl rings interacting with W44 and W70 of the ECD (Fig. 7d, g). There was an overlap for the binding sites on the ECD for NFG and GFN, but the binding sites for NFG, AMM, and SWG were distinct (Fig. 7h). These results suggest that TREM2 is in contact with the LCD residues 312–343 that encompass NFG, AMM, and SWG and constitute a potential epitope of hTDP-43 for TREM2, whereas GFN represent another epitope comprising the LCD residues 333–402 that encompass SWG and GFN.
We then performed the Biacore-based surface plasmon resonance (SPR) analyses to study direct interactions of hTREM2 ECD with four LCD fragments or the full-length hTDP-43. We found hTREM2 indeed interacted with GFN, SWG, and the full-length hTDP-43 in a dose-dependent manner with KD values of 1.86 × 10⁻⁴ M, 1.33 × 10⁻⁵ M, and 1.18 × 10⁻⁷ M, respectively (Fig. 7i, j). However, we did not observe the interaction of hTREM2 with NFG or AMM under the same conditions (Extended Data Fig. 10b), possibly due to the interference of hTREM2 immobilization involving K42, K57, and/or K123 with the binding of NFG or AMM. Nevertheless, these SPR results confirm the interactions of hTREM2 with SWG and GFN predicted by the MD simulations. Therefore, the SPR results support the direct interaction of hTREM2 with hTDP-43 that was inferred from our in vivo, in vitro, and in silico studies.
Discussion
Our current study provides a comprehensive analysis of TREM2 deficiency on microglial phenotypic and functional change in mouse models of TDP-43 proteinopathy. These results demonstrate that TREM2 regulates the microglial response to, and phagocytic clearance of, pathological TDP-43. We further reveal that TDP-43 interacts with TREM2 in silico, in vitro, and in vivo. We started with a neonatal hTDP-43 overexpression model which displayed a progressive TDP-43 pathology and motor neuron degeneration. However, this model has its limitations as hTDP-43 is overexpressed at an early age and in all CNS regions. In addition, the neonatal model involves hTDP-43 overexpression, while typical TDP-43 pathology in clinic includes TDP-43 mis-localization and formation of cytosolic inclusions8, 23. To overcome these limitations, we also used adult local injection, as well as, the rNLS8 mouse model where hTDP-43 accumulates in the cytoplasm.
TREM2 mediates microglial activation in TDP-43 pathology.
The intrinsic heterogeneity of microglia allows them to acquire multiple phenotypes in response to extrinsic stimuli24, 25. Recent studies have demonstrated that TREM2 deficiency attenuated microglial responses to Aβ and tau pathologies26, 27. Consistently, elevated TREM2 gene expression conferred a rescuing effect in AD mice by reprogramming microglia responsivity28. Here we found that TREM2 deficiency reduces microglial activation in response to TDP-43 accumulation. Potential mechanisms underlying TREM2-dependent activation include, direct interaction with TDP-43 activates TREM2 signaling via DNAX-activation protein 12 (DAP12) and Syk phosphorylation29. Additionally, neuronal contact may facilitate activation, which is supported by increased microglia-neuron interaction after TDP-43 overexpression. Indeed, prior study showed that TREM2 deficiency impairs microglial migration towards damaged neurons30. Thus, our study suggests TREM2-mediated “find me” mechanisms in TDP-43 related neurodegeneration.
Moreover, we show that TREM2 interaction with TDP-43 can affect microglial molecular expressions. We showed that TREM2 deficiency prevents the downregulation of microglia homeostatic markers P2Y12 and TMEM119, suggesting microglial TREM2 may regulate the transcription factors that affect homeostatic gene expression in response to TDP-43. However, further comprehensive transcriptome-wide and network analyses are needed to identify molecular candidates that could regulate microglia activation in TDP-43 pathology.
Interestingly though, we found that TREM2 deficiency did not diminish the expansion of microglial numbers in response to TDP-43 accumulation. TREM2 has been reported to promote proliferation and survival via Wnt/β-Catenin pathway after seizures31. Therefore, it is likely that TREM2 may participate in microglial proliferation in a context-dependent manner. Then what is the major driver for microglia proliferation in response to TDP-43? Previous studies have reported that colony–stimulating factor-1 receptor (CSF1R) is critical in microglial proliferation after peripheral nerve injury or seizures32, 33. In addition, TREM2 and CSF1R share the adaptor protein DAP12 and downstream signals34. Thus, it would be interesting to explore whether CSF1R serve as a main regulator for microglial proliferation in TDP-43-related neurodegeneration.
TREM2 mediates microglial phagocytic clearance of TDP-43.
We provided strong evidence that microglia phagocytose hTDP-43 in WT mice but not in TREM2 KO mice. Consistently, in AD mouse models, TREM2-mediated microglial phagocytosis can limit amyloid plaque growth26. As professional phagocytes, microglia orchestrate innate brain immune response by eliminating detrimental structures35. Typical microglia phagocytosis receptors include Toll-like receptors (TLRs) and TREM2. The former binds pathogen-associated molecular patterns, and the latter recognizes apoptotic cellular substances36. In addition, other receptors like complement receptors, P2Y6 and TAM receptors are also involved in microglial phagocytosis37–39. Although our results suggest that microglial TREM2 is important in TDP-43 phagocytosis, it is still unknown whether other receptors may work together with TREM2.
Our study suggests an interesting idea on microglial antigen presentation in TDP-43 phagocytosis. Microglia may serve as antigen-presenting cells in neurodegenerative diseases, like AD and PD40, 41. Here microglial uptake and further degradation of TDP-43 likely leads to the antigen presentation. We found that microglia do not express CD11c under normal conditions, in agreement with their poor antigen presenting ability42. However, a distinct CD11c+ microglia subpopulation appears in response to hTDP-43 overexpression. This CD11c+ subpopulation is dependent on TREM2 and is highly phagocytic towards hTDP-43. These observations raised the question of whether CD11c+ microglia could be antigen-presenting cells during TDP-43 related neurodegeneration. Indeed, increased CD4+ T cell accumulation has been reported in patients with ALS43. Thus, future studies will examine the relationship between CD11c+ microglia and infiltrated T cells in TDP-43 neurodegeneration.
We showed that TDP-43 induced CD11c+ upregulation is dependent on TREM2. Single-cell RNAseq analysis revealed a TREM2-dependent DAM phenotype with unique transcriptional signatures in AD mice12, 17. This subpopulation is neuroprotective and is characterized by upregulation of genes involved in microglia phagocytosis and lipid metabolism. Interestingly, CD11c is also highly expressed by DAM in mouse models of AD and ALS12, 17. In a cuprizone-induced demyelination model, CD11c+ microglia accelerate the repair of damaged white matter44. Our study raises intriguing questions about TREM2 and CD11c in TDP-43 pathology including, how TREM2 regulates microglial CD11c expression and what is the function of CD11c+ microglia? The answers to these questions will provide insights into reprogramming microglia via TREM2 in sensing and regulation of TDP-43 neurodegeneration.
TDP-43 interacts with TREM2.
It has been reported that potential ligands for TREM2 are lipids, APOE, and Aβ5, 6, 45. Here we demonstrate that TDP-43 interacts with TREM2 in vitro and in vivo and thus may also act as a ligand for TREM2. This interaction may represent an intriguing mechanism for microglial TREM2-mediated sensing and clearance of pathological TDP-43. TDP-43 can be released by extracellular vesicles and then taken up by other neurons46. It is also possible that TDP-43 releases into the extracellular space. Indeed, we detected extracellular hTDP-43 in culture medium of iPSC neurons. Therefore, neuronal TDP-43 accumulation may lead to its release, which can be sensed and phagocytosed via microglial TREM2. A recent functional study has revealed that soluble TREM2 (sTREM2) enhances microglial phagocytosis and degradation of Aβ47. In the context of TDP-43 pathology, sTREM2 may recognize the extracellular TDP-43 and recruit microglia for phagocytic clearance. However, further studies are needed to test a possible role of sTREM2 in mediating phagocytic clearance of TDP-43 by microglia.
Neurodegenerative disease related mutations in TREM2 affects its ligand binding ability48. For example, AD-associated mutations compromise interactions of TREM2 with Aβ6 and GLU49. Based on our in vitro study which showed hTREM2 interacted with residue 216–414 of hTDP-43, we performed fragment-based MD simulations with statistical relevance. Without any bias from disease-associated mutations in TREM2 and hTDP-43, our fragment-based MD simulations suggest that TREM2 is in contact with two potential epitopes of hTDP-43 (residues 312–343 or 333–402). Subsequent SPR analysis has confirmed the 333–402 epitope, although confirmatory SPR for the 312–343 epitope are challenging due to hTREM2 immobilization. Interestingly, the NFG fragment of the 312–343 epitope and the SWG fragment of both epitopes contain many hTDP-43 mutations in ALS patients. Consistently, there are correlations among mutations in hTDP-43 and/or hTREM2 and the propensity of hTDP-43 for aggregation50. While further studies such as in situ cross-linking are needed, our present immunoprecipitation, SPR, and MD simulation data support the interaction of TREM2 and hTDP-43, highlighting that hTDP-43 is an intriguing new ligand for microglial TREM2. These findings point out microglial TREM2 as a potential therapeutic target for ameliorating TDP-43-related neurodegeneration.
Methods
Mice.
The TREM2 knockout (KO) mouse strain was kindly provided by Dr. Marco Colonna at the Washington University School of Medicine, St. Louis. Wild-type (WT) C57BL/6J mouse strain, CX3CR1GFP/+ mice and rNLS8 were purchased from Jackson Labs. Mouse lines were housed with littermates with free access to food and water on a 12 hour light/dark cycle, and the room temperature is 20–22°C with 55% humidity. All animal procedures, including husbandry, were performed under the guidelines set forth by the Mayo Clinic Institutional Animal Care and Use Committee. Both sexes were used in the experiments.
Human samples.
Post-mortem brain samples were dissected from the frozen brains of 16 ALS cases (age 67 ± 9.4 years, mean ± s.d.) and 12 controls (age 74.7 ± 10.6 years) from the Brain Bank for Neurodegenerative Disorders at Mayo Clinic Jacksonville. The study was approved by Mayo Biospecimen Committee. For clinic pathological studies, cases were included only if they had good quality medical documentation and there was diagnostic concurrence of at least minimum of two neurologists.
Cell culture and transfection.
Human embryonic kidney (HEK) 293T cells were cultured in DMEM (Gibco, Thermo Fisher Scientific) supplemented with 10% FBS (Gibco, Thermo Scientific). Cells were cultured at 37°C with 5% CO2. HEK293T cells were co-transfected with plasmids encoding wide-type myc-human TREM2 and GFP-human TDP-43 (residues 216–414, Addgene, 28197) or GFP control by the calcium phosphate precipitation method. The expression of TREM2 or TDP-43 was assessed 24–72 h after infection.
Induced iPSC cultures were prepared as previously reported51. 6-well plates were coated with hESC Qualified Geltrex (Gibco, ThermoFisher) and incubated at 37°C and 5% CO2 for at least 1h. To express proteins in iPSC neurons, 1 μL each of AAV9.CAG.hTDP-43-GFP (9.0E+13 viral genomes/mL; AAV9 empty vector as control) and AAV1.Tdtomato (5.0E+12 viral genomes /mL; Addgene, 59462) were added to 1 mL culture medium.
Intracerebroventricular injections.
AAV was injected intracerebroventricularly (ICV) into C57BL/6 mouse or TREM2 KO mouse pups on postnatal day 0 (P0). ICV injections were performed as described52. Newborn mice were put onto a cold metal plate for 2–3 mins to induce hypothermic anesthesia. Cryoanesthetized neonates were injected using 10 uL Hamilton syringes affixed with a 32-gauge needle at an angle of 45 degree to a depth of 3 mm. The injection site was located at 2/5 of the distance from the lambda suture to each eye and 2 uL of virus (9.0E+12 viral genomes/mL) was slowly injected into each ventricle. After injection, pups were allowed to completely recover on a warming blanket and then returned to the home cage.
Stereotaxic intracerebral injection.
Adult wildtype C57BL/6 mice or TREM2 KO mice at 2 months of age were anesthetized by 2% isoflurane. 0.2 μL AAV (9.0E+12 viral genomes/mL) was then injected into the right primary motor cortex at the following stereotaxic coordinates: 1.4 mm anterior to bregma, 1.5 mm lateral to the midline, 0.5 mm ventral to the dura, with bregma set at zero. The microinjections were carried out at a rate of 0.04 μL/min, using an automated stereotaxic injection apparatus (Model UMC4, World Precision Instruments Inc.). The microsyringe was left in place for an additional 10 mins after each injection.
Immunofluorescence staining.
Tissue was prepared as previously reported53. Mice were anesthetized with isoflurane (5% in O2) and then intracardially perfused with 40 ml cold PBS, followed by 40 ml cold 4% paraformaldehyde (PFA). Brains were removed and post-fixed in 4% PFA for an additional 6 hours, then transferred to 30% sucrose in PBS for three days. 20 μm slices were cut with a cryostat (Leica). For immunofluorescence staining, the sections were blocked for 60 mins with 10% goat serum in TBS buffer containing 0.4% Triton X-100 (Sigma), and then incubated overnight at 4 °C with a primary IgG antibody: rabbit anti-NeuN (1:500, Abcam, ab104225), rabbit anti-CD68 (1:500, Abcam, ab125212 ), hamster anti-CD11c (1:200, Thermo, 14011482), rabbit anti-P2Y12 (1:400, Anaspec, AS-55043A), rabbit anti-Iba1 (1:500, Abcam, ab178847), rabbit anti-p-TDP-43 (1:200, Proteintech, 22309–1-AP), mouse anti-GFAP (1:500, CST, 3670), rabbit anti-CNPase (1:500, Proteintech, 13427–1-AP), rabbit anti-TMEM119 (1:500, Abcam, ab209064) or sheep anti-TREM2 (1:50, R&D AF1729). After three washes with TBST, sections were exposed to appropriate secondary antibody for 60 mins at room temperature (1:500, Alexa Fluor goat anti-rabbit 594, Thermo, a32740,1:500, Alexa Fluor goat anti-ArHm 647, Abcam, ab173004 or 1:500, Alexa Fluor donkey anti-sheep 594, Thermo, a11016), washed and mounted and coverslipped with Fluoromount-G (SouthernBiotech). Fluorescent images were captured with a confocal microscope (LSM510, Zen software, Zeiss) and fluorescence microscope (BZ-X800, Keyence). Cells of interest were counted and fluorescence signal intensity was quantified using ImageJ software (National Institutes of Health, Bethesda, MD).
Immunohistochemistry
Free floating brain sections (30 μm) were rinsed 3 times in TBS, and incubated in 3% H2O2 for 30 minutes to quench endogenous peroxidase activity. IHC staining for hTDP43 antibody (mouse, 1:500, Proteintech, 60019–2-Ig) and p-hTDP43 antibody (mouse, 1:500, Proteintech, 22309–1-AP) were performed using M.O.M. immunodetection kit (Vector Laboratories BMK-2202) following the manufacturer’s instructions. After primary antibody (1:500), biotinylated secondary antibodies (goat, 1:2000, Vector Laboratories BA-9200) were added for 2 hours at room temperature. Vectastain-ABC Kit (Vector Laboratories) and ImmPACT DAB substrate peroxidase (HRP) kit (Vector Laboratories) were used to amplify and detect signals. Subsequently, sections were washed, mounted, and dehydrated through 70%, 95%, and 100% ethanol solutions. After immersing in xylene, coverslips were placed on slides using DEPEX mounting medium (Electron Microscopy Science) for observation.
Nissl staining.
Sample slices were incubated in 100% ethanol for 6 mins, and then defatted in Xylene for 15 mins, followed by another 10 mins in 100% ethanol. After rinsing in distilled water, the slides were stained with 0.5% cresyl violet acetate for 15 mins, and again rinsed in distilled water. The sections were then placed in differentiation buffer (0.2% acetic acid in 95% ethanol) for 2 mins, dehydrated with ethanol and Xylene, and then mounted with Depex medium. Neuronal number in the layer 5 of primary motor cortex was quantified following previous established standard criteria: (1) pyramidal neurons exhibited a characteristic triangular shape with a single large apical dendrite extending vertically towards the pial surface, (2) non-pyramidal neurons were identified by the absence of the preceding criteria, by the presence of two or more small calibre processes, and by their generally smaller size54.
Mass cytometry/CyTOF of isolated brain cells.
The whole mouse brain was dissociated into a single-cell suspension using brain tissue dissociation kits following the manufacturer’s instructions (Adult Brain Dissociation Kit, Miltenyi Biotec, 130–107-677). Collected cells were then incubated with metal-conjugated antibodies in cell staining buffer (ProductMaxpar Cell Staining Buffer, Fluidigm, CA, 1:100). The barcoded sample was loaded onto a Helios CyTOF® system (Fluidigm) using an attached autosampler and were acquired at a rate of 200–400 events per second. Data were collected as .FCS files using the CyTOF software (Version 6.7.1014). After acquisition intrafile signal drift was normalized to the acquired calibration bead signal using the CyTOF software. Cleanup of cell debris, removal of doublets and dead cells was performed using FlowJo software version 10.5.3 (Ashland, OR). Cleaned FCS files were analyzed by Cytobank (Santa Clara, CA) and FlowJo.
Isolation of RIPA-soluble and sarkosyl-insoluble proteins.
Mouse brain tissue was lysed in RIPA lysis buffer (Cell signaling), supplemented with protease inhibitors cocktail and phosphor inhibitor (Thermo Fisher Scientific), and kept on ice for 30 mins. The brain homogenate was then ultracentrifuged at 50,000g for 15 mins at 4°C. The supernatant was transferred to a new tube as RIPA-soluble protein fraction. The pellet was homogenized in 10% sucrose buffer before being ultracentrifuged at 50,000g for 15 mins at 4°C. After ultracentrifuge, the pellet was discarded and the supernatant was transferred to a new tube and incubated with sarkosyl (Sodium lauroyl sarcosinate) at a final concentration of 1% for 1 hour at 37°C. Following incubation, the samples were ultracentrifuged at 50,000g for 30 mins at 4°C. The supernatant was discarded and the pellet was re-suspended to obtain the insoluble protein fraction. Soluble and insoluble fractions were then boiled in SDS-PAGE loading buffer for immunoblotting. Blots were probed with antibodies for mouse anti-hTDP-43 (1:1000, Proteintech, 60019–2-Ig), rabbit anti-total TDP-43 (1:1000, Proteintech, 10782–2-AP), mouse anti-human TDP-43, phospho Ser409/410 (1:2000 , COSMOBIO, CAC-TIP-PTD-M01), rabbit anti-GFP (1:1000, Cell signaling, 2956s) and mouse anti-GAPDH (1:5000, Santa Cruz, sc-32233).
Immunoprecipitation assay.
For in vitro binding assays, we transfected HEK 293T cell with myc tagged TREM2 and GFP-hTDP-43 or GFP control plasmids. Cell lysates were prepared in IP lysis buffer (50 mM Tris-HCl, pH 7.5, 0.5% Nonidet P-40, 150 Mm NaCl, 5Mm EDTA) supplemented with protease inhibitors cocktail and phosphotase inhibitor (Thermo Fisher Scientific), and kept on ice for 30 mins. The lysates were then centrifuged at 14,000g for 15 mins at 4°C. The supernatant protein concentration was measured and normalized between samples. Myc-Trap agarose beads were used to pull down the Myc-TREM2 protein following the manufacturer’s instructions (Chromotek, yta-10). GFP-Trap agarose beads were used to pull down the GFP-human TDP-43 (residues 216–414) or GFP protein (Chromotek, gta-10). Blots were probed with antibodies for mouse anti-Myc antibody (1:1000, Sigma, SAB4700447), rabbit anti-TDP-43 (1:1000, Proteintech, 10782–2-AP), rabbit anti-GFP (1:1000, Cell signaling, 2956s).
For in vivo binding assays, TDP-43/TREM2 interaction was detected in rNLS8 mouse with 4 weeks DOX off and 2 weeks DOX on. Mouse TREM2 was immunoprecipitated from 400–500 ug protein per sample using 1.5 ug mouse TREM2 biotinylated antibody (R&D, BAF1729). After overnight incubation at 4°C, biotinylated antibody was pulled down using NeutrAvidin Agarose beads (Thermo Fisher 29200) for at least 2 h at 4°C. Avidin beads were collected by centrifugation at 2,000 ×g for 3 mins and washed four times with IP lysis buffer, and then boiled in SDS-PAGE loading buffer for immunoblotting. Blots were probed with antibodies for rat anti-mouse TREM2 antibody [5F4] (1:500, abcam, ab252876) and mouse anti-hTDP-43 (1:1000, Proteintech, 60019–2-Ig).
Endogenous TDP-43/TREM2 interactions were also determined using frozen autopsied specimens of ALS patients’ spinal cord. Lysates containing 400–500 μg protein were incubated with rabbit anti-human TREM2 antibody (Cell Signaling, 91068) / Dynabeads protein A (Thermo fisher, 22810) at 4°C overnight. Protein A beads were collected by centrifugation at 2,000 ×g for 3 mins and washed four times with IP lysis buffer, and then boiled in SDS-PAGE loading buffer for immunoblotting. Blots were probed with antibodies for goat anti-human TREM2 antibody, (1:1000, R&D, AF1828) and mouse anti-h-TDP-43 (1:1000, Proteintech, 60019–2-Ig).
Immunoblotting.
Mouse brain tissue or human tissue samples were lysed in RIPA lysis buffer (Cell signaling), supplemented with protease inhibitors cocktail and phosphatase inhibitor (Thermo Fisher Scientific), and kept on ice for 30 mins. The lysates were then centrifuged at 14,000 ×g for 30 mins at 4°C. The supernatant protein concentration was measured and normalized between samples, and was boiled in SDS loading buffer. Prepared samples were subjected to 4%–20% SDS-PAGE (Bio-Rad laboratories).
Liquid Chromatography with tandem mass spectrometry (LC-MS/MS) and affinity purification coupled with mass spectrometry (AP-MS) interactome analysis.
To detect interacting proteins of TREM2, HEK 293 cells or rNLS mice brains were lysed in lysis buffer (50 mM Tris-HCl, protease inhibitors cocktail (Thermo Fisher Scientific), phosphatase inhibitor (Thermo Fisher Scientific), and 0.002% zwittergent 3–16) and kept on ice for additional 30 mins. After centrifugation, the supernatant were incubated with rabbit anti-human TREM2 antibody (Cell Signaling, 91068) or anti-mouse TREM2 antibody on a rotator, respectively. After 3 washes, immunoprecipitated proteins were eluted by boiling in Lammaeli buffer for immunoblotting. Alternatively, immunoprecipitated proteins were eluted by boiling in 1% SDS, resolved by non-reducing gel and subjected to reduction, alkylation and trypsin digestion using an in-gel digestion protocol. The extracted tryptic peptides were dried in a speed vac. The dried peptides were reconstituted in sample loading buffer (0.2% formic acid, 0.1% TFA , 0.002% zwittergent 3–16) and analyzed by nano-ESI-LC/MS/MS with a Q Exactive mass spectrometer coupled to a dionex nano-LC system (Thermo Scientific; Waltham, MA) with a 32 cm, 100/15 um, Acclaim 2.2 um column. The LC system used a gradient with solvent A (2% ACN, 0.2% formic acid, in water) and solvent B (80% ACN, 10% IPA, 0.2% formic acid, in water) with a 400 nL/min flow rate as follows: 4–5 min 5% B; 5– 95 min 5–45 % linear gradient; 95–98 min 45–95% linear gradient; 98–102 min 95% B; 102–104 min 95–10% B linear gradient; 104–107 min 10% B; 107–115 min 10–95% B; 115–118min 95% B; 118–121 min 95–5% B linear gradient; 121–127 min 5% B. Mass spectrometer was operated in data-dependent mode with a MS survey scan (350–1800 m/z) in Orbitrap (70,000 resolution 200 m/z, 3 × 10⁶ AGC target and 100 ms maximal ion time) and 20 MS/MS fragments scans (17,500 resolution, 2 × 10⁵ AGC target, 50 ms maximal ion time, 28 normalized collision energy, 2.5 m/z isolation window) with a dynamic range set to 25 seconds. The acquired mass spectra were searched using the Andromeda search engine of MaxQuant (version 1.6.17.0) against a Uniprot database (human 2021_02 release supplemented with human myc-tagged TREM2 protein sequence for 293T CoIP and mouse 2021_02 release supplemented with human TDP-43 protein sequence for mouse CoIP) for peptide and protein identification. The search parameters included a maximum of two missed cleavages; carbamidomethylation at cysteine as a fixed modification; N-terminal acetylation, deamidation at asparagine and glutamine, oxidation at methionine as variable modifications. The monoisotopic peptide tolerance was set to 10 ppm and the first search and main search for MS/MS were set to 20 and 4.5 ppm, respectively. The maximum modifications per peptide was set to 5 and the maximum charge was set at 7. The revert type of the target-decoy analysis was chosen. The peptide-spectrum match (PSM) false discovery rate (FDR), protein FDR, and the site decoy fraction were set to 0.01. The minimum peptide length was set to 7. The minimal scores for unmodified and modified peptides were 0 and 40, respectively. The minimal delta score for unmodified and modified peptides were 0 and 17, respectively. The minimum unique and razor peptides for identification was set to 1.
Stable isotope labeling with amino acids in cell culture (SILAC).
Two sets of HEK293T cells were cultured in DMEM containing “light” (12C6-arginine and 12C6-lysine) or “heavy” (13C6-arginine and 13C6-lysine) amino acid supplemented with FBS, penicillin and streptomycin, separately. The cells gown in light medium were transfected with empty vector while the cells grown in heavy medium were transfected with hTREM2 plasmid. Forty-eight hours after transfection, both sets of cells were lysed in lysis buffer (50 mM Tris pH 7.4, 150 mM NaCl, 1% n-Octylglucoside) in the presence of cocktail protease and phosphatase inhibitors. The protein concentration of the lysates from light and heavy cells were measured by BCA method. Equal amounts of light and heavy lysates were subjected to immunoprecipitation by anti-hTREM2 antibody. After washing, the immunoprecipitates from light and heavy lysates were mixed and subjected to a trypsin digestion protocol on S-Trap according to the manufacturer’s instruction (ProtiFi). The resulting peptides were analyzed by LC-MS/MS on a high-resolution orbitrap-equipped mass spectrometer. The acquired mass spectra were also searched using the Andromeda search engine of MaxQuant (version 1.6.17.0) against a Uniprot database (human 2021_02 release supplemented with human myc-tagged TREM2 protein sequence) for peptide and protein identification. The search parameters were the same as non-SILAC experiments described before, except that two SILAC states with Arg6 (13C6-Arginine) and Lys6 (13C6-Lysine) was selected. The intensities of light and heavy proteins were calculated by MaxQuant by summing intensities of paired SILAC peaks of each identified peptide. The lack of light peptide in the mass spectrum will indicate a true TREM2 interacting protein.
Hindlimb clasping.
To examine hindlimb clasping, mice were gently removed from their home cage and suspended by the tail for 10 s and provided a hindlimb clasping score. If the mouse exhibits normal escape extension without limb clasping, it was assigned a score of 4. If one hindlimb exhibits incomplete splay and loss of mobility and toes exhibit normal splay, it received a score of 3. If both hindlimbs exhibit incomplete splay and loss of mobility and toes exhibit normal splay, it received a score of 2. If both hindlimbs exhibit clasping with curled toes and immobility, it received a score of 1. If forelimbs and hindlimbs exhibit clasping and are crossed, curled toes and immobility, it received a score of 0.
Open field testing.
Locomotor activity of mice was assessed in sound-insulated, rectangular activity chambers with continually running fans, infrared lasers, and sensors (Med Associates, St Albans, VT, USA). Prior to testing, mice were acclimatized to the room for 1 h. Mice were habituated for 5 mins in the Open Field chamber (without recording) then placed back to home cage for another 5 mins. Afterwards, mice were introduced back to the chambers and activities were monitored for 30 mins. Locomotor function was quantified by the total distance mice travelled in the chamber which was recorded on a computer with Med-PC software Version 4.0.
Rotarod.
The Rotarod performance test evaluates mouse balance and motor coordination. Mice were brought to the test room 1 h before testing. Rotarod tests were performed using a five-lane Rotarod apparatus (Med Associates Inc), started at 4 revolutions per minute and steadily accelerated to 40 revolutions per minute over a 5 mins period. Each mouse was tested 3 times at 10-min intervals.
Molecular dynamics (MD) simulations.
The LCD fragment was manually docked into the paratope region of the crystal structure of the ECD (Residues 21–219) of human TREM2 (PDB ID: 6B8O) as described above. The resulting complex was neutralized with counterions and then energy-minimized according to a protocol described below. In this complex, all ionic residues were treated as AMBER residues of ASP, GLU, ARG and LYS, all histidine residues were treated as HIE, and all cysteine residues were treated as CYX. The topology and coordinate files of the complex were generated by the tLeAP module of AmberTools 13 (University of California, San Francisco). The energy minimization and MD simulations were performed using SANDER and PMEMD of AMBER 16 (University of California, San Francisco) with force field FF12MC55. The energy minimization used dielectric constant of 1.0 and 100 cycles of steepest-descent minimization followed by 900 cycles of conjugate-gradient minimization. The energy-minimized model was solvated with the TIP3P water using “solvate box m TIP3PBOX 8.2” and energy minimized for 100 cycles of steepest-descent minimization followed by 900 cycles of conjugate-gradient minimization using the SANDER module56. The resulting system was heated from 5 K to 320 K at a rate of 10 K/ps under constant temperature and constant volume, equilibrated for 106 time steps under constant temperature of 320 K and constant pressure of 1 atm employing isotropic molecule-based scaling, and finally simulated, without any harmonic restraint, in 20 316-ns, distinct, independent, unrestricted, unbiased, and isobaric–isothermal MD simulations with FF12MC using the PMEMD module of AMBER 16 with a periodic boundary condition at 320 K and 1 atm. The 20 unique seed numbers for initial velocities of Simulations 1–20 were taken from Ref.57. All simulations used (i) a dielectric constant of 1.0, (ii) Langevin thermostat58 with a collision frequency of 2 ps−1, (iii) the Particle Mesh Ewald method to calculate electrostatic interactions of two atoms at a separation of >8 Å59, (iv) Δt = 1.00 fs of the standard-mass time55, 60, (v) the SHAKE-bond-length constraints applied to all bonds involving hydrogen, (vi) a protocol to save the image closest to the middle of the “primary box” to the restart and trajectory files, (vii) the revised alkali and halide ions parameters61, (viii) a cutoff of 8.0 Å for nonbonded interactions, (ix) the atomic masses of the entire simulation system (both solute and solvent) that were reduced uniformly by tenfold55, 60, and (x) default values of all other inputs of the PMEMD module. The FF12MC parameters are available in the Supporting Information of previous literature60. The complex conformations were saved at 100-ps intervals in all simulations. The cluster analysis of all saved complex conformations was performed using the CPPTRAJ module of AmberTools 16 (University of California, San Francisco) with the average-linkage algorithm 89 (epsilon = 2.0 Å; RMS on all alpha carbon atoms of Residues 32–51, 60–97, and 108–124 of TREM2 and the entire LCD fragment). Centering the coordinates of the complex and imaging the coordinates to the primary unit cell were performed prior to the cluster analysis. The most populated conformation of the MD simulations identified by the cluster analysis was used as the simulation-refined model of the complex shown in Fig. 7.
Surface Plasmon Resonance (SPR).
Affinity analysis was carried out using a Biacore T200 instrument (GE Healthcare Life Sciences) at Creative biolab. hTREM2 protein (Sino Biological, 11084-H08H) was directly immobilized on the CM5 chip using an amine coupling kit (GE Healthcare Life Sciences). Before immobilization, the CM5 sensor surface was activated using a mixture of 400 mM 1-ethyl-3-(3-dimethylaminopropyl) carbodiimide (EDC) and 100mM N-hydroxysuccinimide (NHS). Then, 10 μg/mL of hTREM2 in immobilization buffer (10 mM NaAc (pH 4.5)) was then injected into Fc2 sample channel at a flow rate of 10 μL/min. The amount of ligand immobilized was about 5,000 RU. The chip was deactivated by 1 M Ethanolamine hydrochloride-NaOH (GE Healthcare Life Sciences) at a flow rate of 10 μL/min for 420 s. The reference Fc1 channel underwent similar procedures but without injecting the ligand. The hTDP-43 protein (R&D, AP-190–100) was serially diluted with the running buffer to give a concentration of 1000, 500, 250, 125, 62.5, and 0 nM, respectively. Different concentrations of hTDP-43 proteins were then injected into Fc2-Fc1 channels at a flow rate of 30 μL/min, with a contact time of 120 s, followed by a dissociation time of 180 s. After each cycle of interaction analysis, the analyte injection, the association and dissociation process are all handling in the running buffer. The 4 TDP-43 peptides (Mayo Clinic Rochester Proteomics Core) were serially diluted with the running buffer to give a concentration of 200, 100, 50, 25, 12.5, 6.25 and 0 μM, respectively. Different concentrations of TDP-43 peptides were then injected into Fc2-Fc1 channels at a flow rate of 30 μL/min, with a contact time of 60 s, followed by a dissociation time of 90 s. After each cycle of interaction analysis, the analyte injection, the association and dissociation process are all handling in the running buffer. Data analysis was performed on the Biacore T200 computer and with the Biacore T200 evaluation software, using the 1:1 binding model.
Statistics.
Statistical details of the experiments, including sample sizes and statistical tests are described in figure legends. Results are displayed as mean ± s.e.m. Mean values for multiple groups was compared using a two-way ANOVA followed by Tukey’s post hoc test. Comparison of two groups was performed using a two-tailed unpaired Student’s t-test. Survival curves were analyzed using a log-rank (Mantel–Cox) test. P values < 0.05 were considered as statistically significant. All statistical analysis was performed with GraphPad Prism software (version 8). No statistical methods were used to pre-determine sample sizes, but our samples sizes are comparable to similar studies62, 63. Data distribution was assumed to be normal, but this was not formally tested. Mice were grouped according to genotype before they were randomly assigned to the experimental groups. The investigators were blinded to group allocation during data collection and analysis. Animals or samples were excluded from analysis only in the instance of technical failure. No data were excluded for other reasons. The images analyses of figures 1b–d, 6c, 6d and extended data figures 1a–b, 1g, 5d, 6a–b, 6h, 7e, 8a–c, 10a were replicated in at least three biologically independent experiments.
Extended Data
Extended Data Fig. 1. Characterizations of GFP-hTDP-43 expression in a neonatal TDP-43 mouse model.
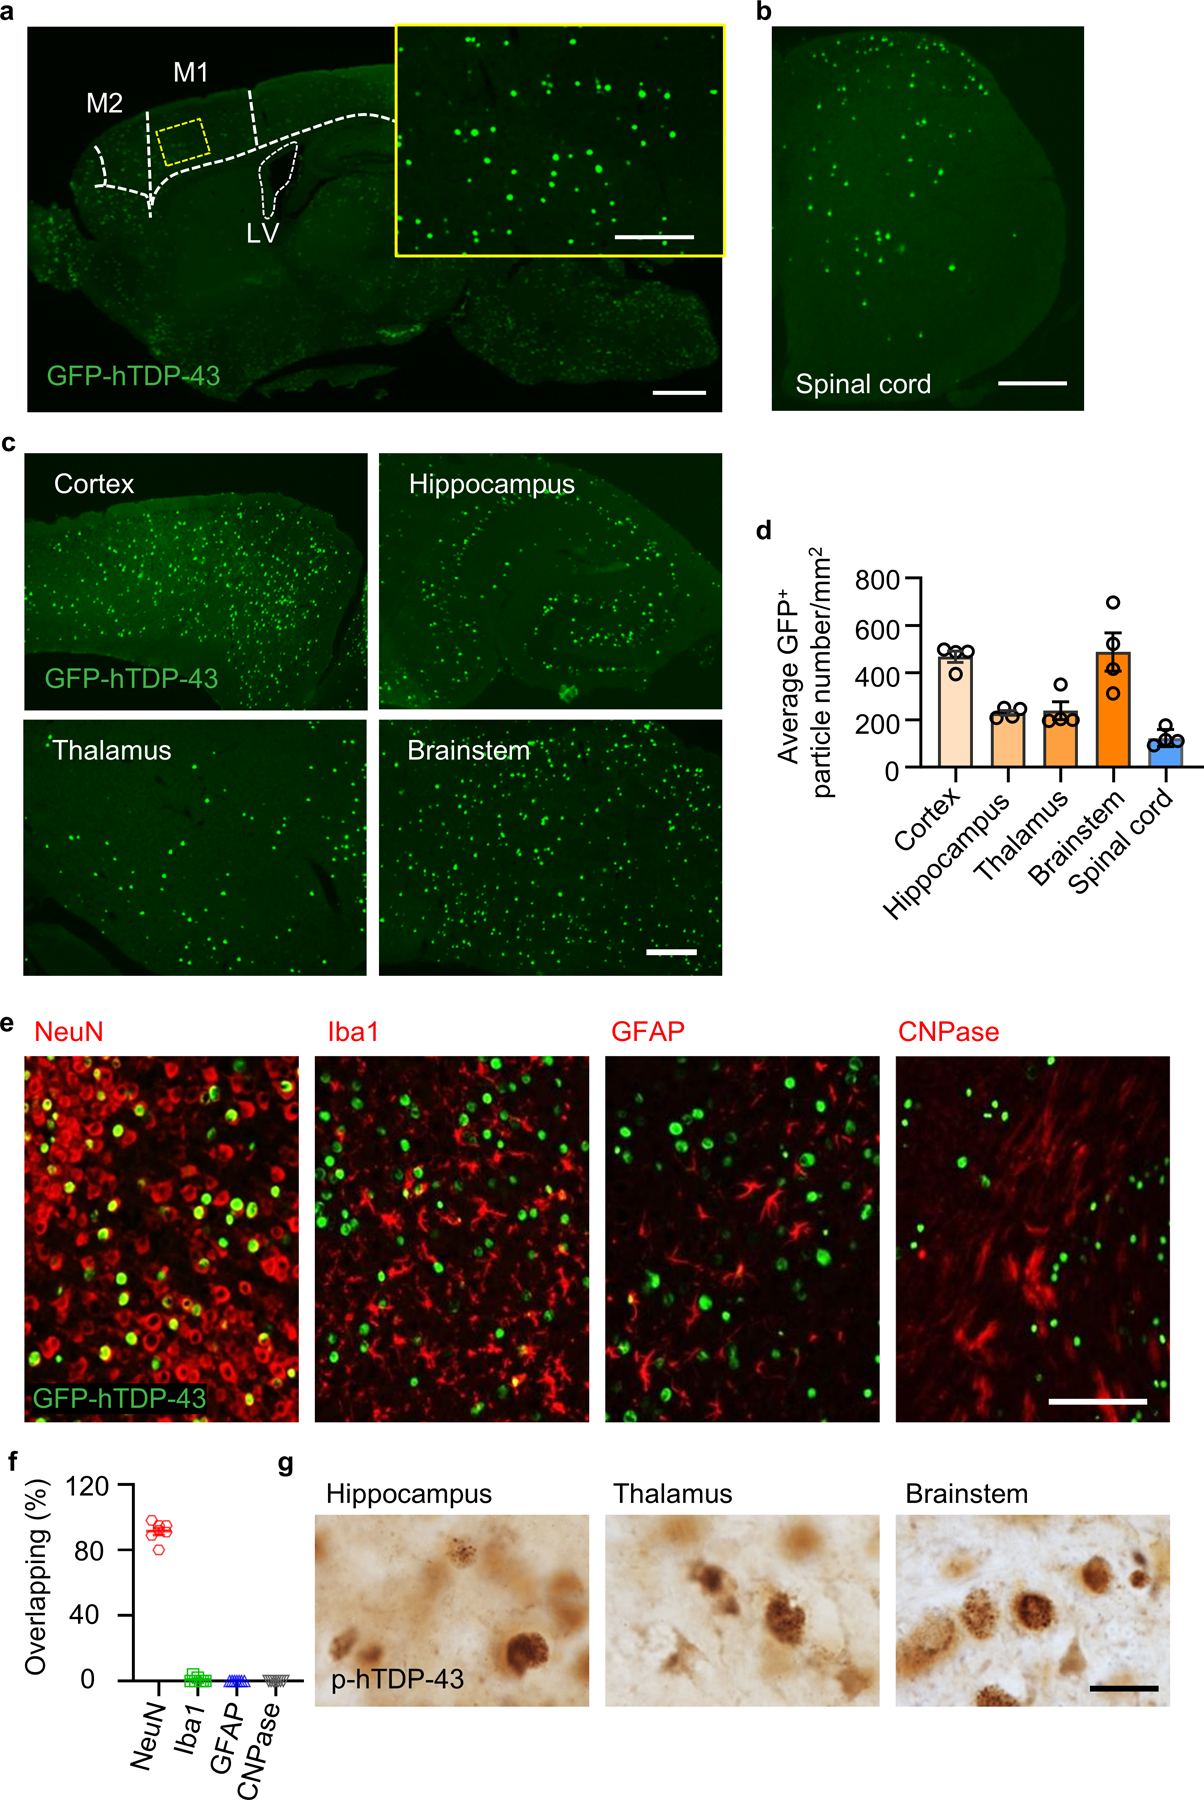
GFP-hTDP-43 expression was induced via intracerebroventricular injection of AAV9.CAG.hTDP-43.GFP in C57/BL6 (WT) neonatal mice. a, Representative image of brain GFP-hTDP-43 expression in WT mice at 21 days post-infection (dpi). Primary motor cortex (M1), supplementary motor area (M2) and lateral ventricle (LV) are separated by dashed line. Scale bar, 500 μm. Inset shows hTDP-43 expression at higher magnification as indicated by the area in dotted yellow box. Scale bar, 100 μm. b, Representative image of spinal cord (SC) GFP-hTDP-43 expression in WT mice at 21 dpi. Scale bar, 200 μm. c, Representative image (c) and quantification (d, n = 4) of GFP-hTDP-43 expression in the brain regions of cerebral cortex, hippocampus, thalamus and brainstem in WT mice at 21 dpi. Scale bar, 100 μm. e,f, Representative images (e) and quantification (f, n = 7) of co-immunostaining of GFP-hTDP-43 (green) with neuron marker NeuN (red), microglia marker Iba1 (red), astrocyte marker GFAP (red), and oligodendroglia marker CNPase (red) in the primary motor cortex of WT mice at 21 dpi. Scale bar, 100 μm. g, Representative images of p-hTDP-43 expression in the brain regions of hippocampus, thalamus, brainstem at 35 dpi. Scale bar, 20 μm. In d and f, data represented as mean ± SEM.
Extended Data Fig. 2. Characterizations of motor deficits and neuronal loss in a neonatal TDP-43 mouse model.
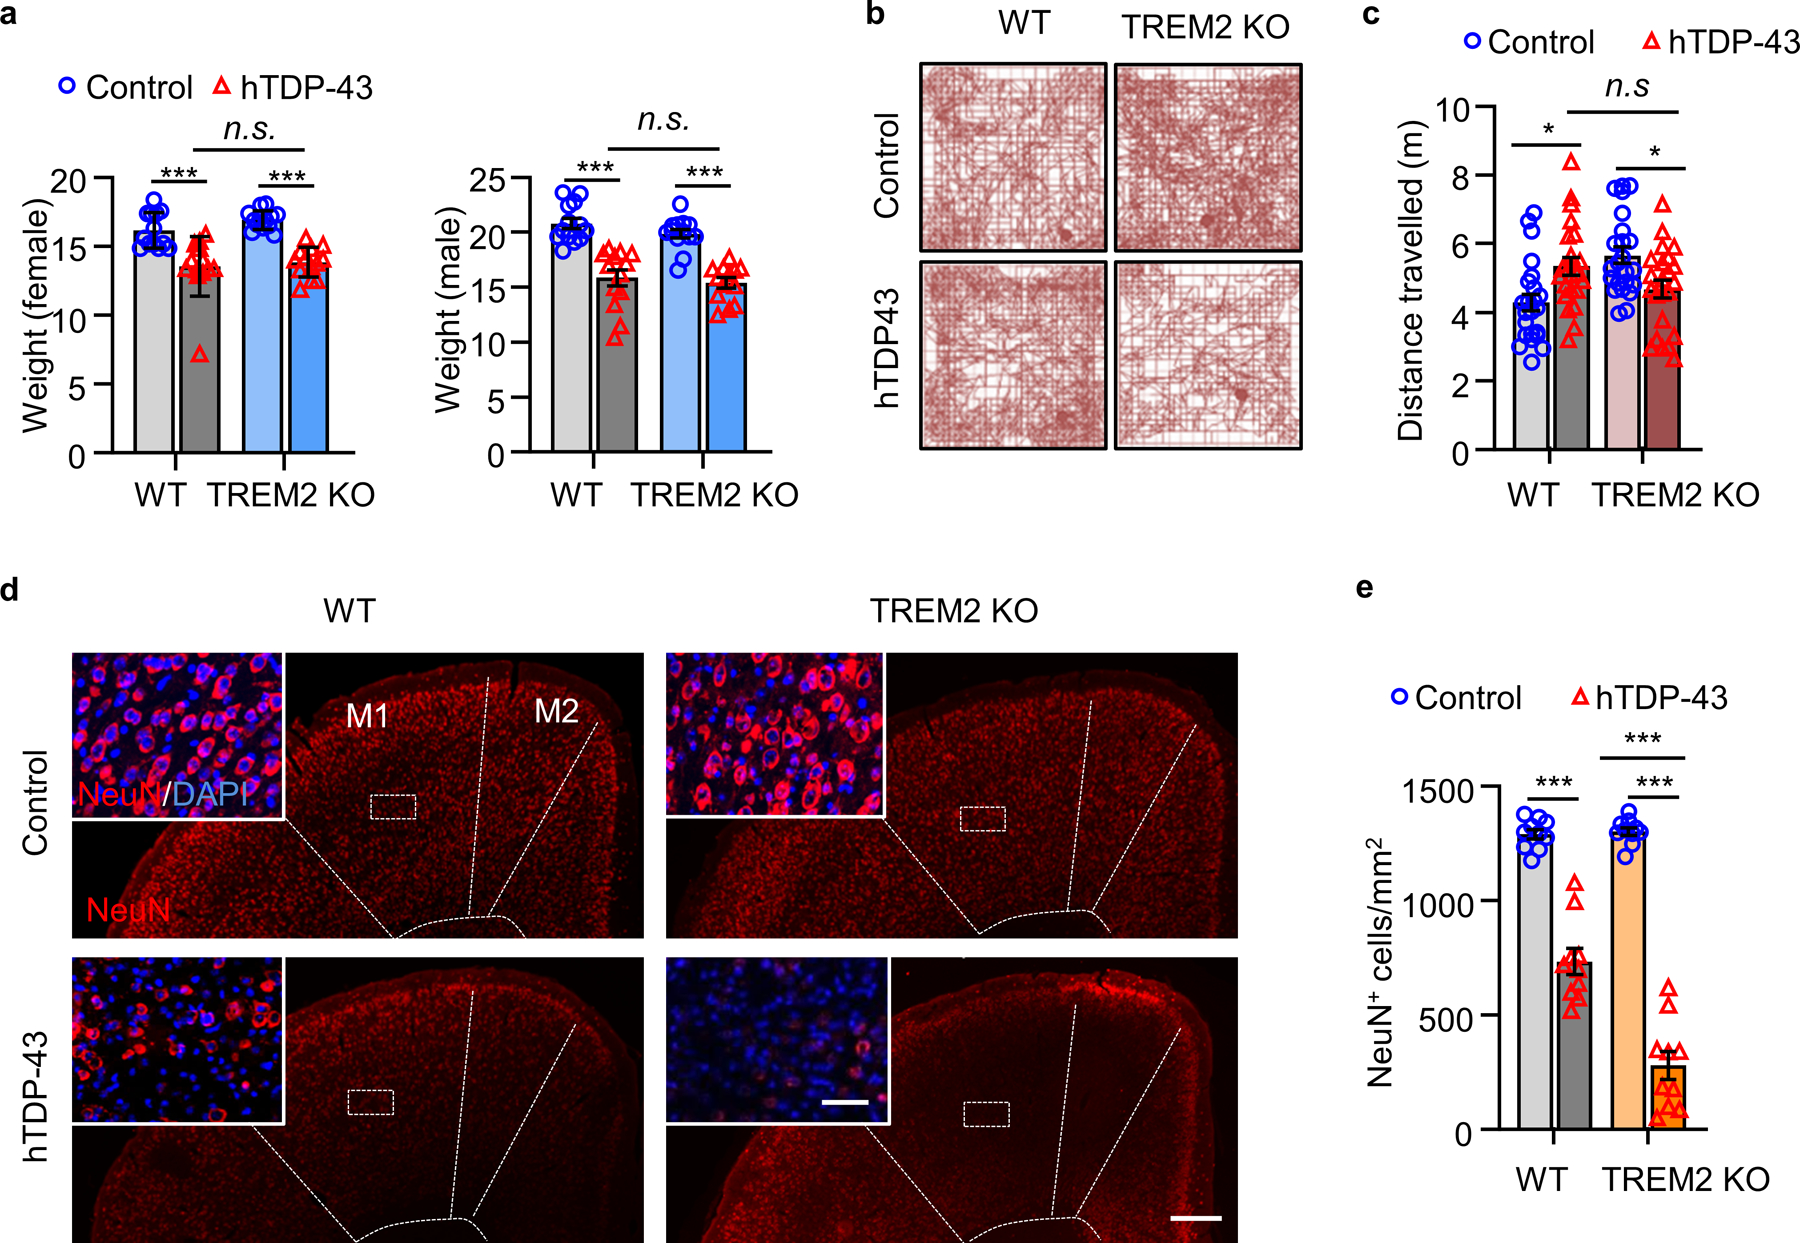
GFP-hTDP-43 expression was induced via intracerebroventricular injection of AAV9.CAG.hTDP-43.GFP in neonatal mice (AAV9.CAG.GFP as control). a, Body weights were measured separately for male and female of indicated groups at 35 dpi. b,c, Representative traces (b) and quantification (c) of locomotor activity in an open field test of indicated groups at 35 dpi. d,e, Representative immunostaining images (d) and quantification (e) of NeuN (red) with DAPI (blue) in the primary motor cortex of indicated groups at 35 dpi. M1 and M2 are separated by dashed line. Scale bar, 200 μm. Insets show NeuN staining in layer 5 of primary motor cortex at higher magnification as indicated by the area in dotted white box. Scale bar, 20 μm. In a, c, and e, Significance was calculated using Two-way ANOVA, Tukey’s post-hoc analysis. Data represented as mean ± SEM. n.s., not significant, *P < 0.05, **P < 0.01, *** P < 0.001. a, n = 13 per group, female: P < 0.0001, F 3,36 = 17.08; male: P < 0.0001, F 3,36 = 21.72; c, n = 25 per group, P = 0.0008, F 3,66 = 6.339; e, n = 10 per group, P < 0.0001, F 3,27 = 195.1.
Extended Data Fig. 3. TREM2 deficiency leads to increased accumulation of hTDP-43 protein.
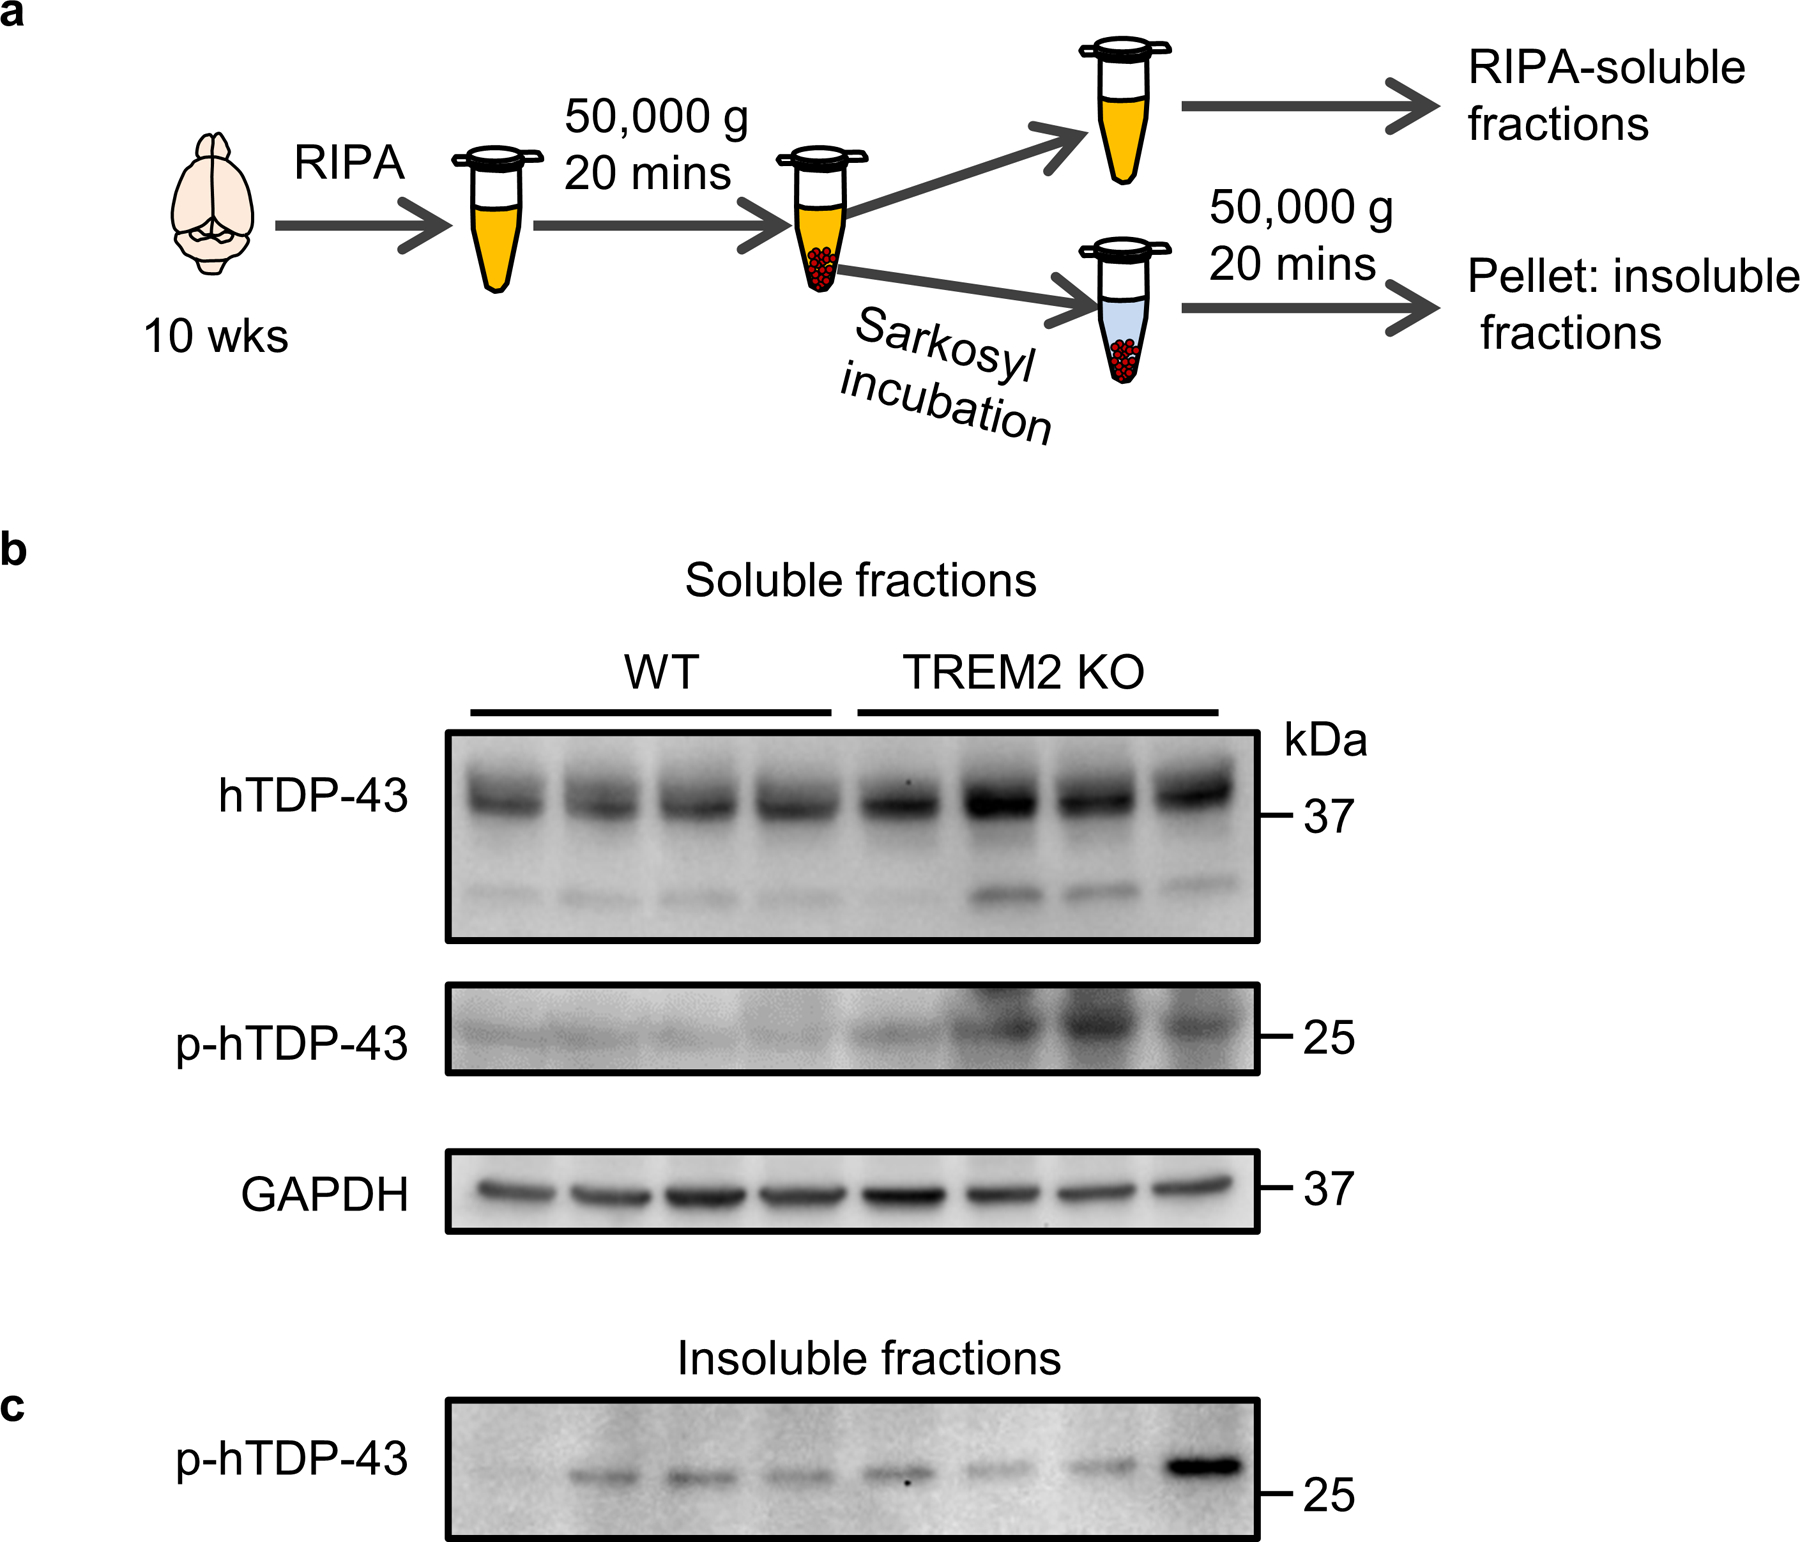
hTDP-43 protein expression was induced via intracerebroventricular injection of AAV9.CAG.hTDP-43 in neonatal mouse (AAV9.CAG.Empty as control). a, Schematic representation of the velocity sedimentation protocol for separating soluble from Sarkosyl-insoluble aggregated proteins from an aqueous homogenate of brain tissue. b, Whole brain hTDP-43 and p-hTDP-43 (Ser409/410) immunoblots of the soluble fraction of WT and TREM2 KO mice at 70 dpi. p-hTDP-43 (Ser409/410) antibody detected a ~25 kD fragment in the soluble fractions. Notably, Ser409/410 is at the extreme C-terminal of TDP-43 protein, suggesting a higher level of phosphorylated C-terminal fragments in TREM2 KO mice. c, Whole brain p-hTDP-43 immunoblots of the Sarkosyl-insoluble fraction of WT and TREM2 KO mice at 70 dpi. Western blots were independently repeated twice with n = 4 for each group.
Extended Data Fig. 4. Phenotypic diversity of microglia in response to TDP-43 pathology by CyTOF.
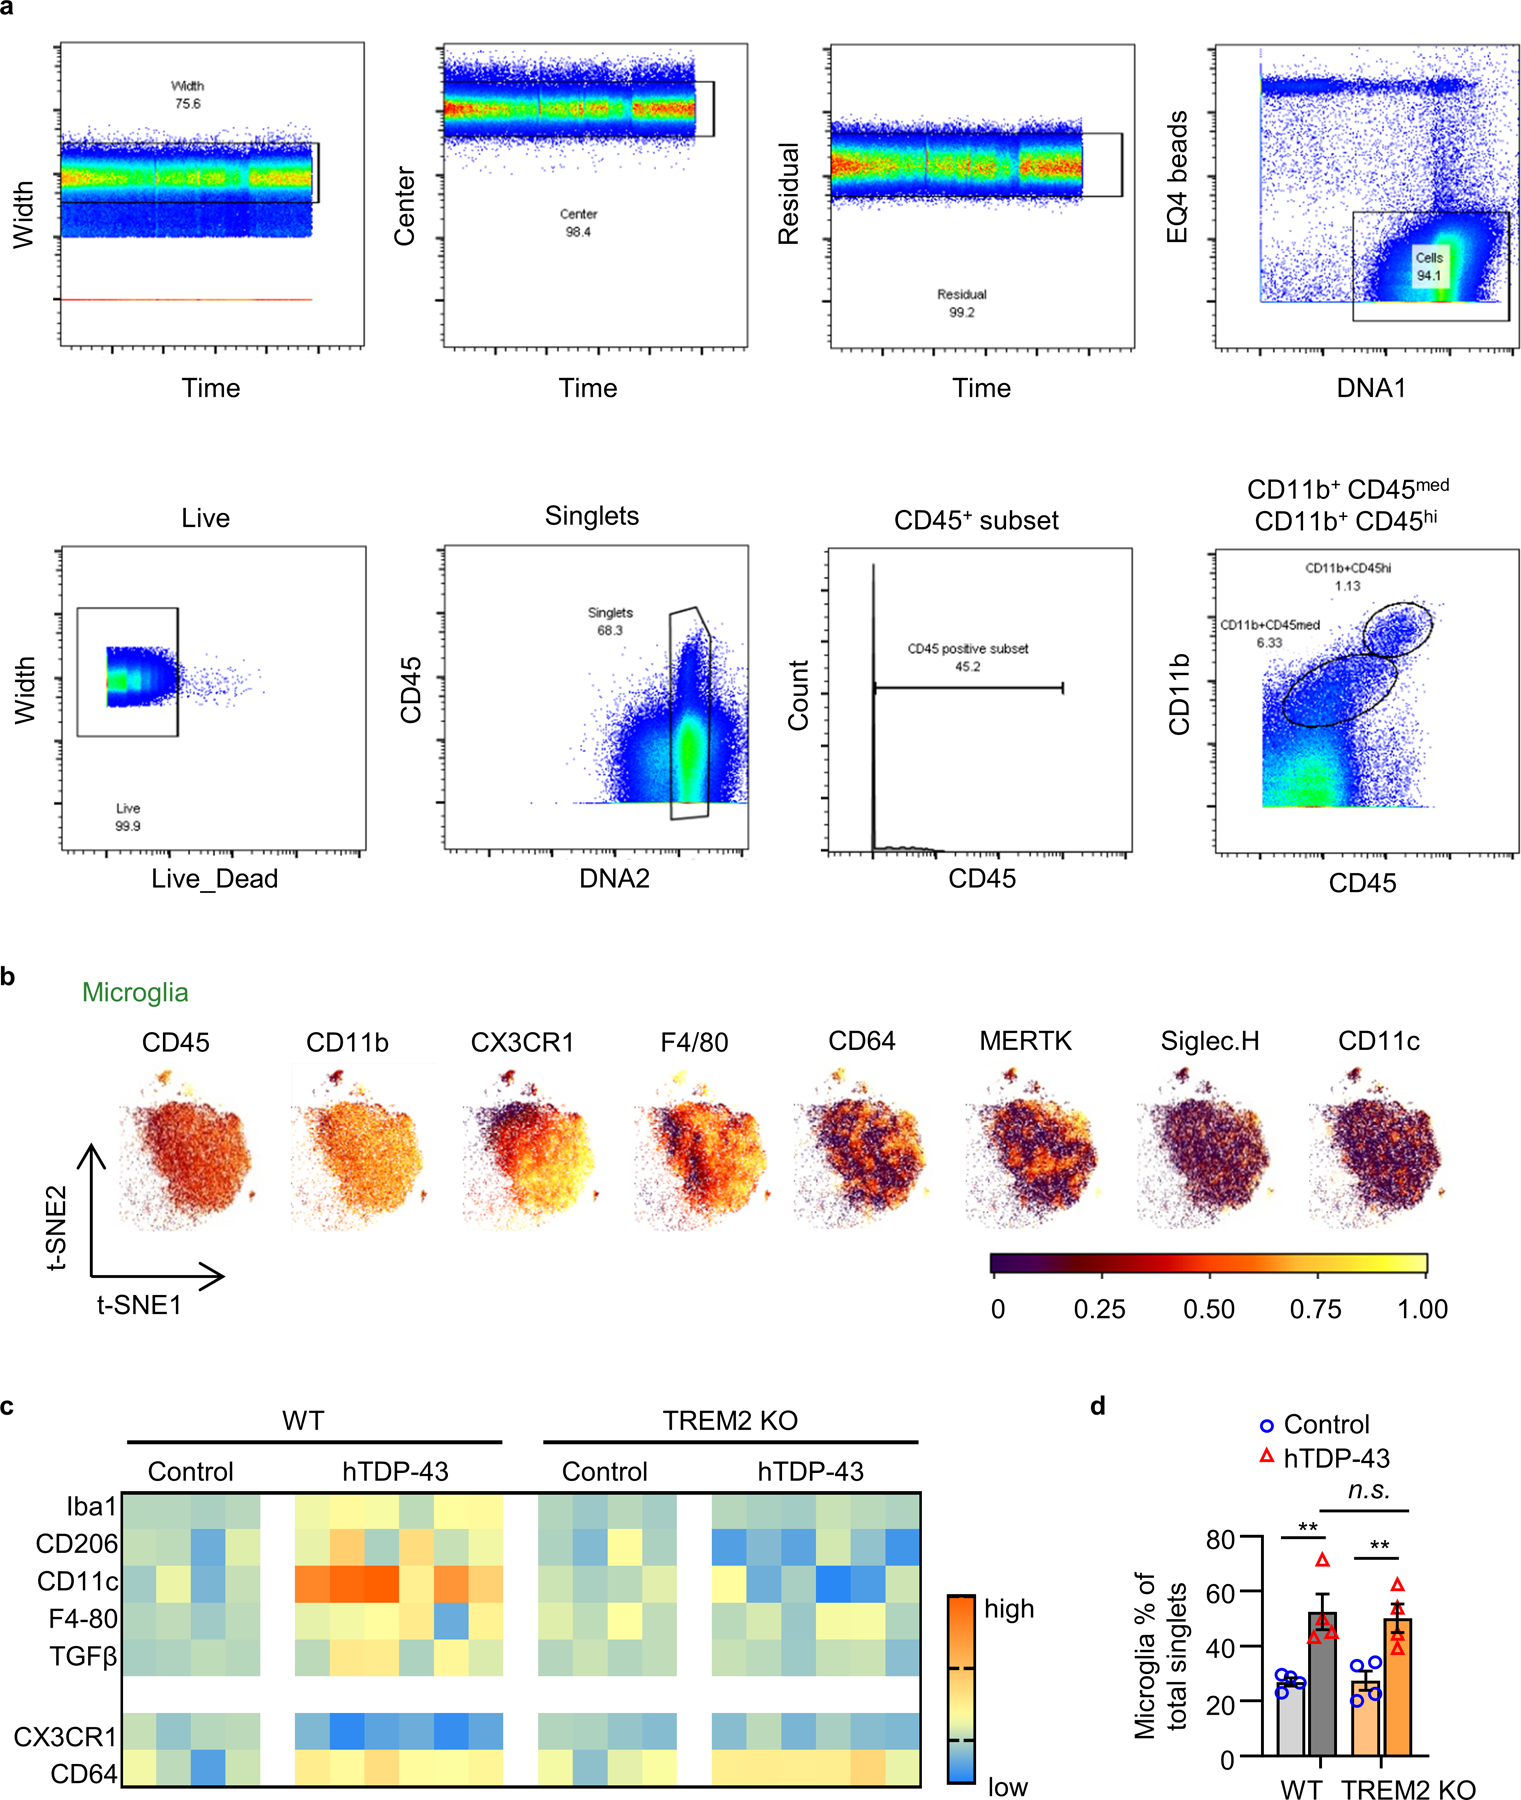
a, A representative gating strategy illustrating brain myeloid cell being subgated to CD45medCD11b+ microglia. b, Microglia were plotted onto a t-SNE. Plots represent distinguishing cell surface markers for microglia of 6 to 8-week-old WT mice. Clustering analysis revealed a major microglia population characterized by CD45mid:CD11b+:CX3CR1hi:F4/80+:CD64+:MERTK+:Siglec-H+:CD11c−. c, Heat map shows the change of expression levels of typical microglial markers in response to TDP-43 pathology in individual samples. Heat colors of expression levels have been scaled for each marker (blue, low expression; orange, high expression). d, Frequency analysis of microglia based on manual gating of indicated groups at 35 dpi. Significance was calculated using two-way ANOVA, Tukey’s post-hoc analysis. Data represented as mean ± SEM. n.s., not significant, *P < 0.05, **P < 0.01, *** P < 0.001. n = 4 per group, P = 0.0008, F 3,9 = 14.79.
Extended Data Fig. 5. TREM2 deficiency attenuates hTDP-43-induced microglial activation.
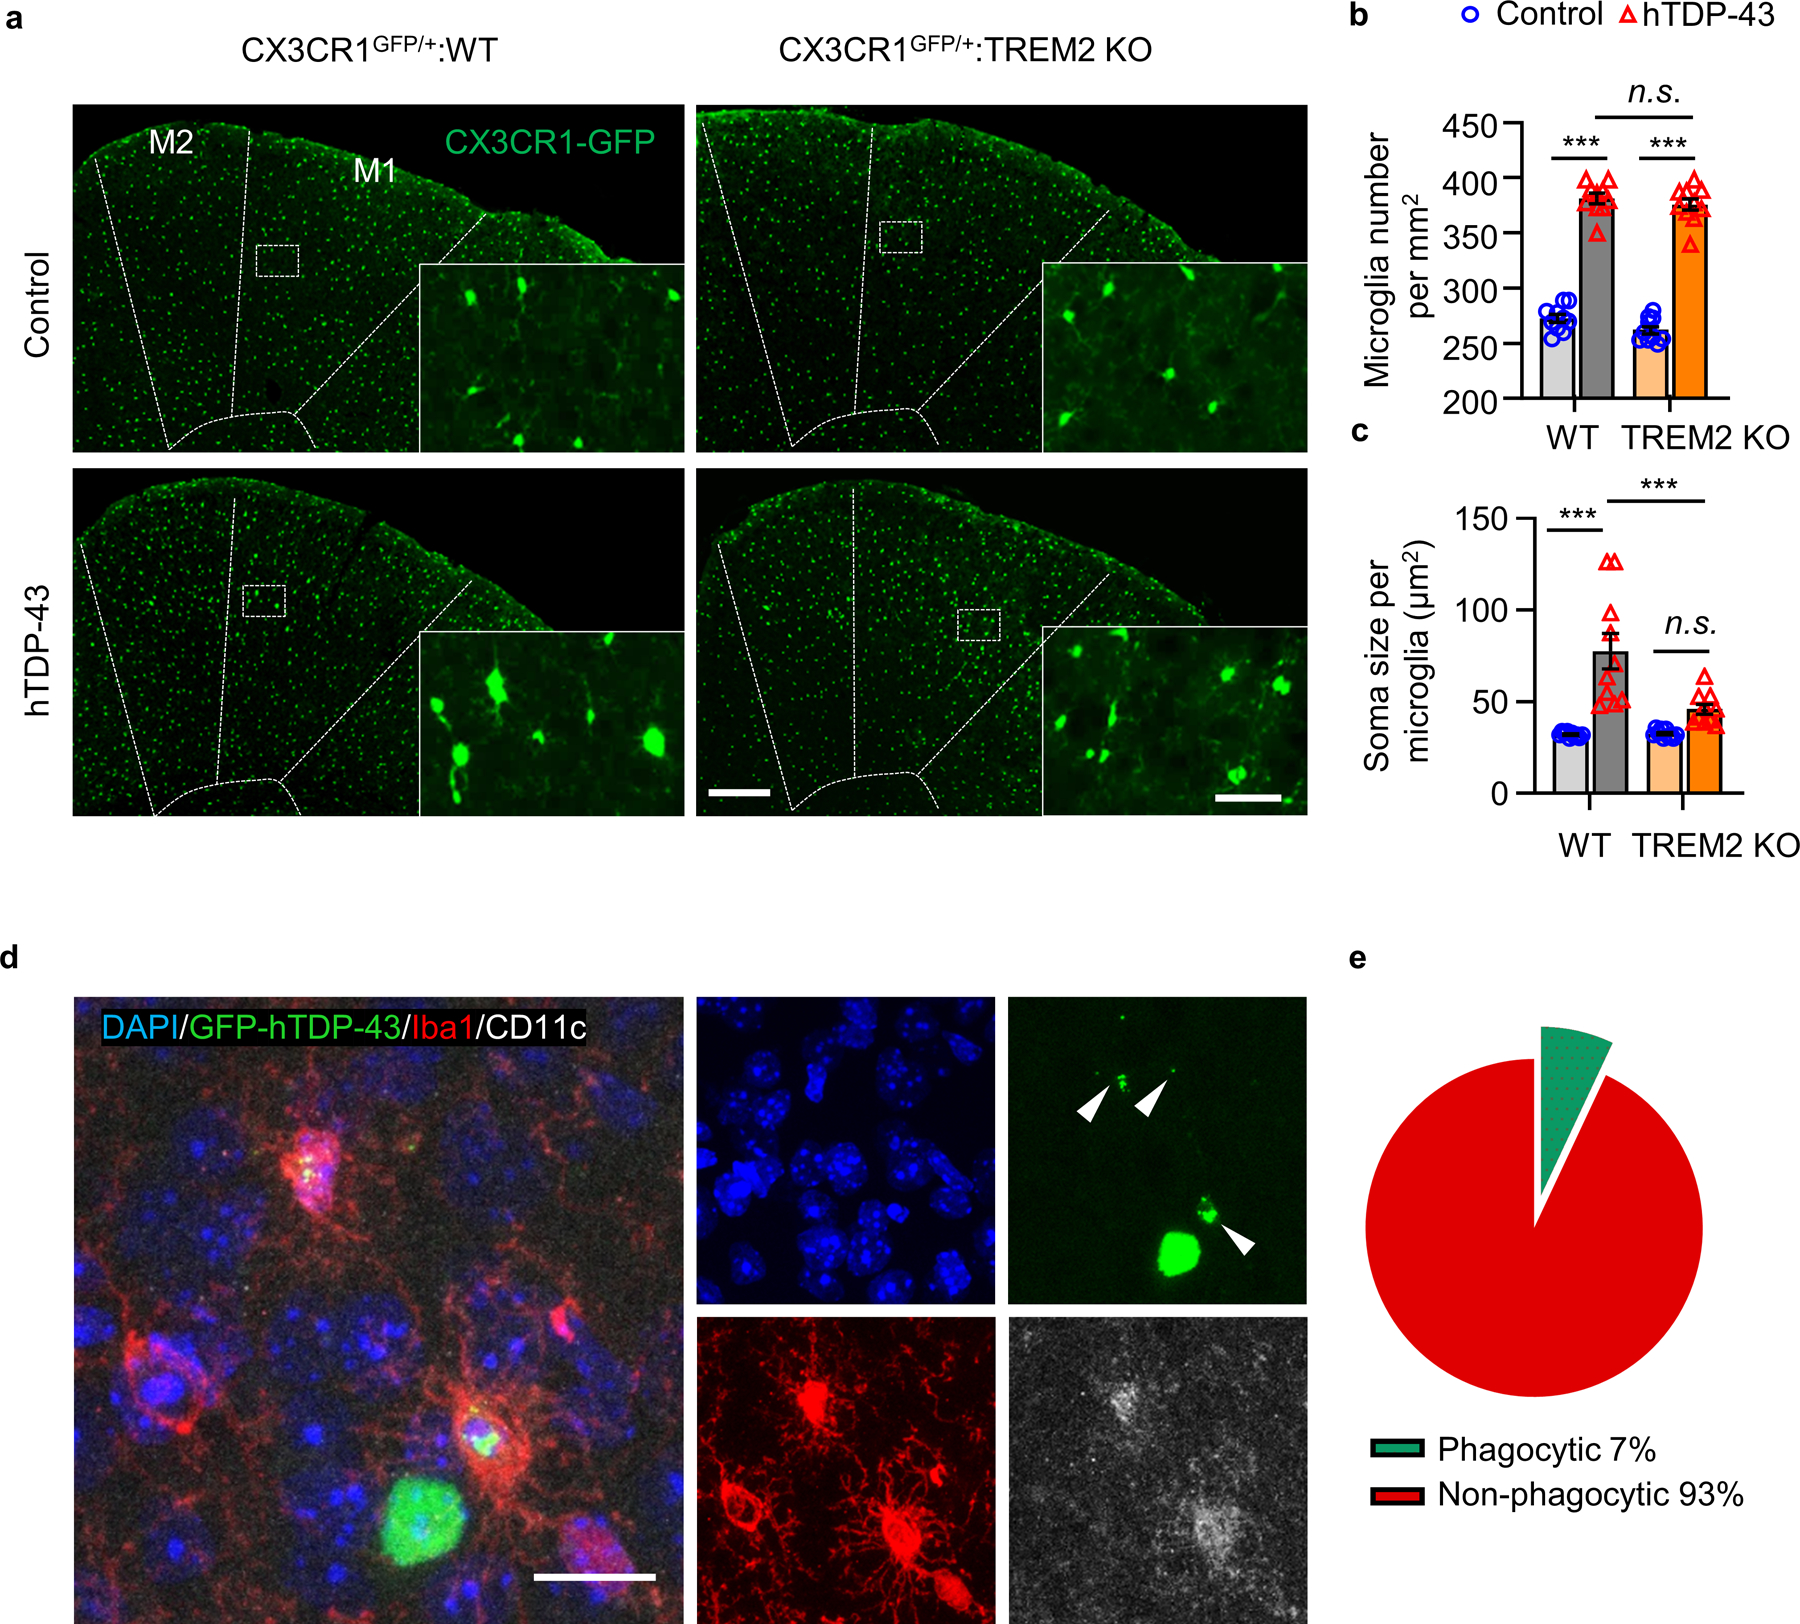
hTDP-43 protein expression was induced via intracerebroventricular injection of AAV9.CAG.hTDP-43 in neonatal mouse (AAV9.CAG.Empty as control). a-c, Representative images (a) and quantification of GFP-expressing microglia number (b) and soma size (c) in the primary motor cortex of indicated groups at 35 dpi. M1 and M2 are separated by dashed line. Scale bar, 200 μm. Insets show microglia at higher magnification as indicated by the area in white box. Scale bar, 50 μm. d, Representative images of co-localization of CD11c (white) with Iba1 (red) in microglia phagocytosing GFP-hTDP-43 (green) in the primary motor cortex of WT group at 35 dpi. White arrowheads indicate phagocytic puncta of GFP-hTDP-43. Scale bar, 20 μm. e, Pie chart representing the percentage of microglia phagocytosing GFP-hTDP-43 (green, phagocytic microglia) and those non-phagocytic microglia in d. In b and c, Significance was calculated using two-way ANOVA followed by Tukey’s post hoc test. Data represented as mean ± SEM. n.s., not significant, *P < 0.05, **P < 0.01, *** P < 0.001. b, n = 10 per group, P < 0.0001, F 3,27 = 283.9; c, n = 10 per group, P < 0.0001, F 3,27 = 19.59.
Extended Data Fig. 6. Characterizations of hTDP-43 expression mouse model via local virus injection in the primary motor cortex of adult mice.
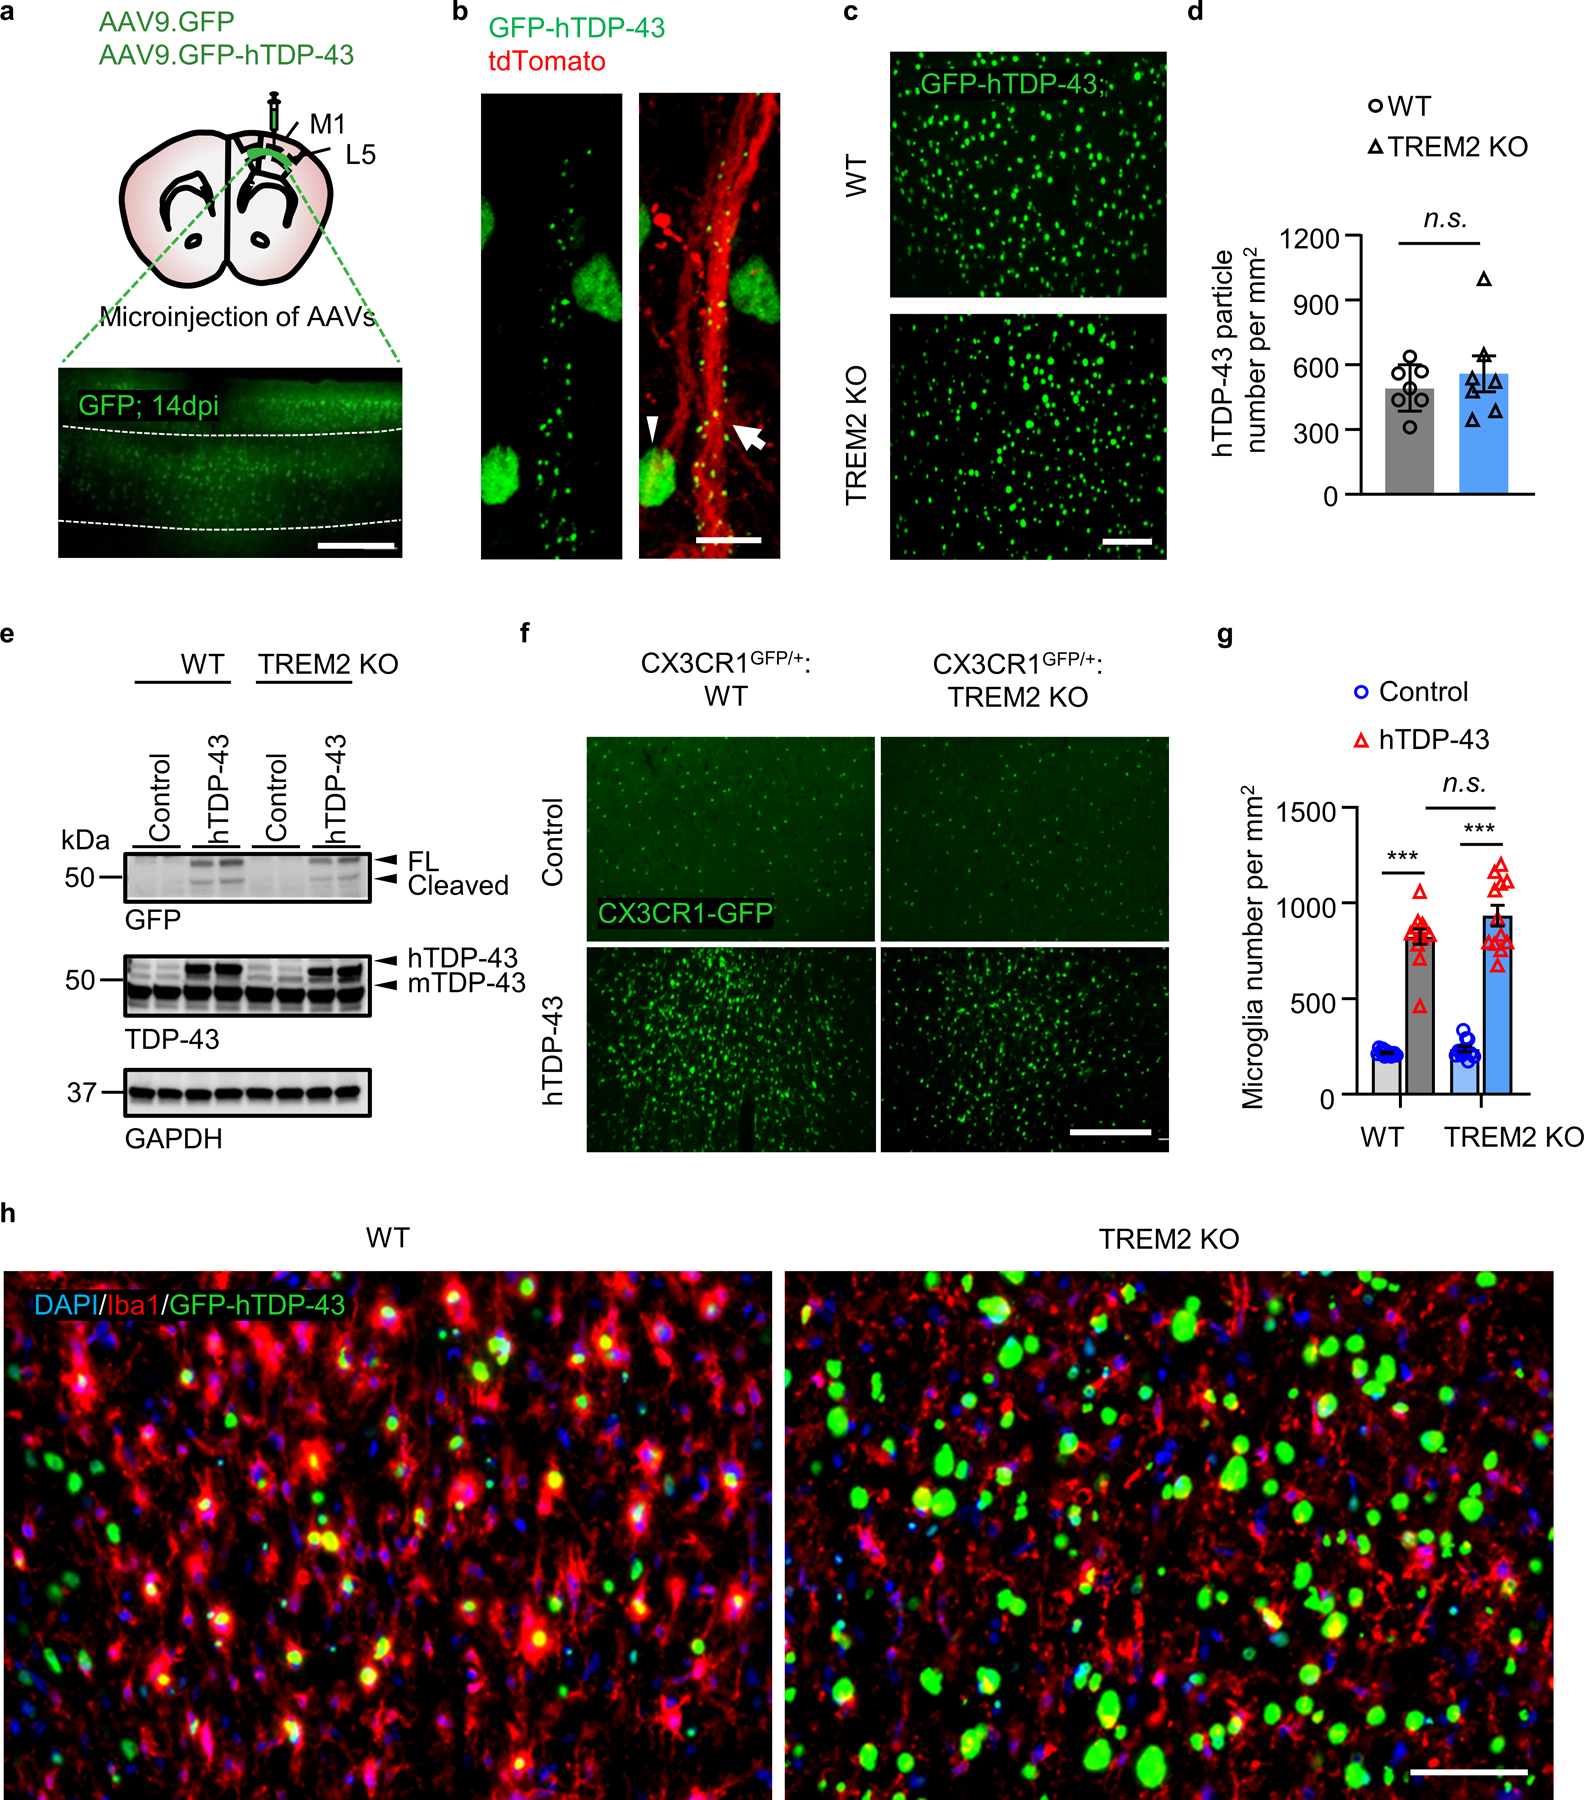
GFP-hTDP-43 or hTDP-43 was expressed in the primary motor cortex of 2-month-old mice via stereotactic intracerebral injection of AAV9.CAG.hTDP-43.GFP or AAV9.CAG.hTDP (AAV9.CAG.GFP or AAV9.CAG.Empty as control). a, Schematic picture showing stereotactic virus injection site (upper). Representative image of GFP expression in the primary motor cortex of 2-month-old WT mice at 14 dpi (lower); Dashed lines indicate the borders of layer 4&5. Scale bar, 100 μm. b, Representative images of GFP-hTDP-43 expression in neuronal nuclei (white arrowhead) and diffusely in dendrites (white arrow) in motor cortex of WT mice at 14 dpi. AAV1.CAG.tdTomato virus was co-injected to visualize neurons. Scale bar, 5 μm. c,d, Representative images (c) and quantification (d) of GFP-hTDP-43 expression in the primary motor cortex of WT and TREM2 KO mice at 14 dpi. Scale bar, 100μm. e, GFP-hTDP-43 immunoblots of primary motor cortex of WT and TREM KO mice at 14 dpi. Western blots were independently repeated four times (n = 8 per group). GAPDH was used as loading control. f,g, Representative images (f) and quantification (g) of GFP-expressing microglia in the primary motor cortex of indicated groups at 14 dpi. Scale bar, 100μm. h, Representative images of microglia (Iba1, red) phagocytosing GFP-hTDP-43 (green) in the primary motor cortex of indicated groups at 28 dpi. Scale bar, 100 μm. Significance was calculated using either two-tailed unpaired Student’s t-test (d) or two-way ANOVA, Tukey’s post-hoc analysis (g). Data represented as mean ± SEM. n.s. =, not significant, *P < 0.05, **P < 0.01, *** P < 0.001. d, n = 7 per group, P = 0.4802, t = 0.7286, d.f. = 12; g, n = 12 per group, P < 0.0001, F 3,33 = 133.4.
Extended Data Fig. 7. TREM2 deficiency facilitates hTDP-43-induced neurodegeneration.
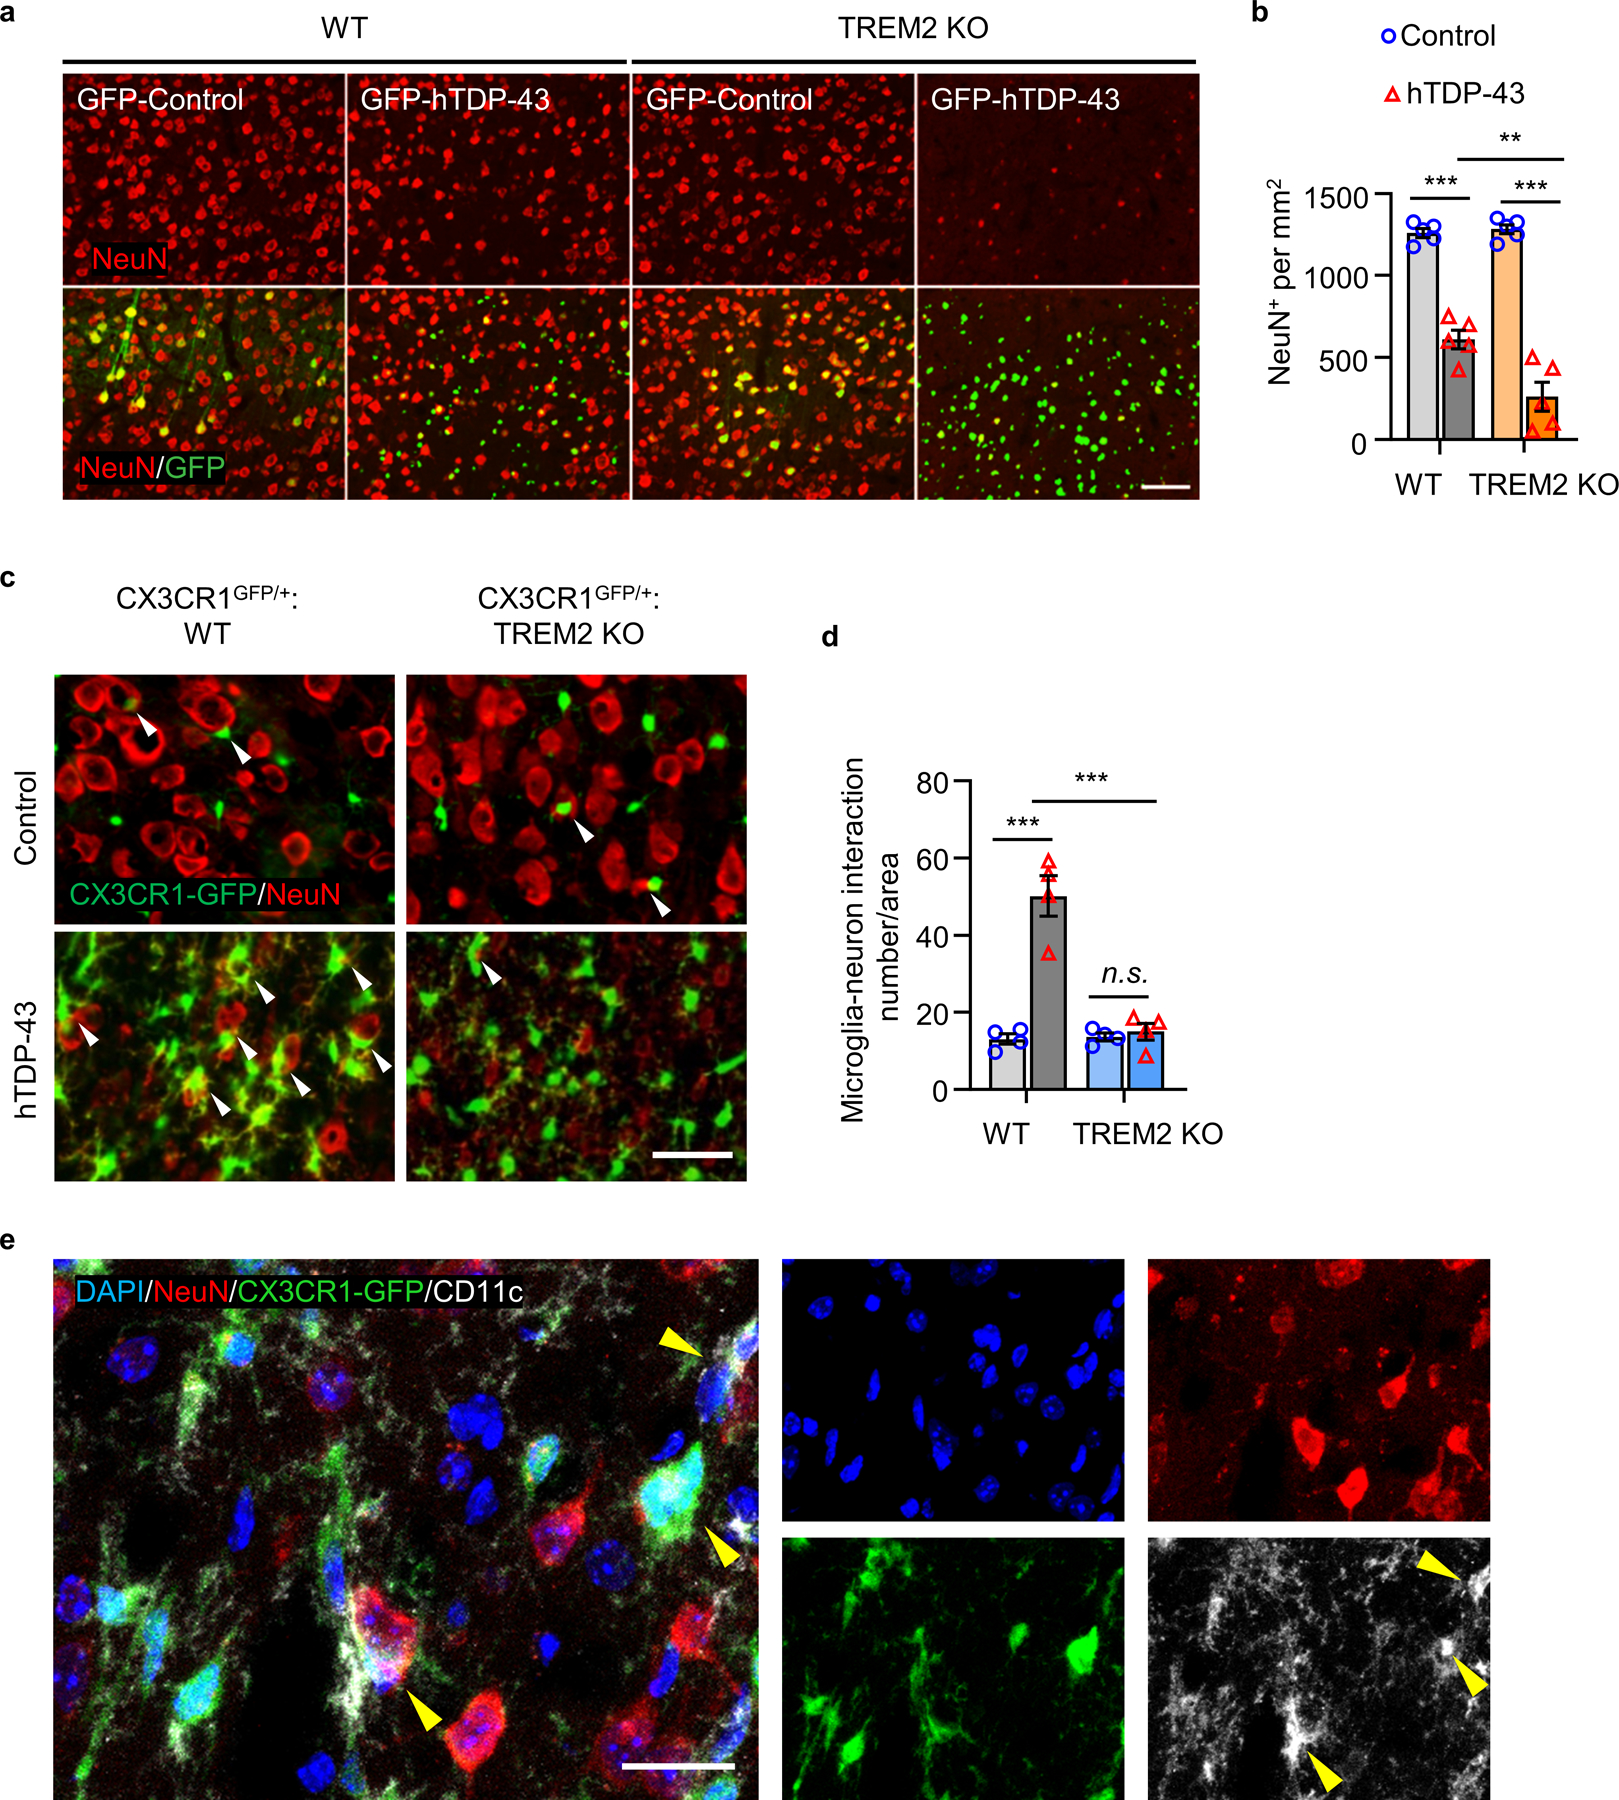
GFP-hTDP-43 or hTDP-43 was expressed in the primary motor cortex of 2-month-old mice via stereotactic intracerebral injection of AAV9.CAG.hTDP-43.GFP or AAV9.CAG.hTDP (AAV9.CAG.GFP or AAV9.CAG.Empty as control). a,b, Representative images (a) and quantification (b) of NeuN immunostaining (red) in the primary motor cortex of indicated groups at 28 dpi. Scale bar, 100 μm. c,d, Representative images (c) and quantification (d) of microglia (GFP) interaction with NeuN+ neurons (red) in the primary motor cortex of indicated groups at 28 dpi. Scale bar, 50 μm. e, Representative images of CD11c (white) expression in microglia (CX3CR1-GFP, green) interacting with NeuN+ neurons (red) in the primary motor cortex of WT groups at 28 dpi. Scale bar, 20 μm. In b and d, Significance was calculated using two-way ANOVA followed by Tukey’s post hoc test. Data represented as mean ± SEM. n.s., not significant, *P < 0.05, **P < 0.01, *** P < 0.001. b, n = 5 per group, P < 0.0001, F 3,12 = 60.56; d, n = 4 per group, P < 0.0001, F 3,9 = 34.58.
Extended Data Fig. 8. TDP-43 can be released from neurons and interact with TREM2 in vitro.
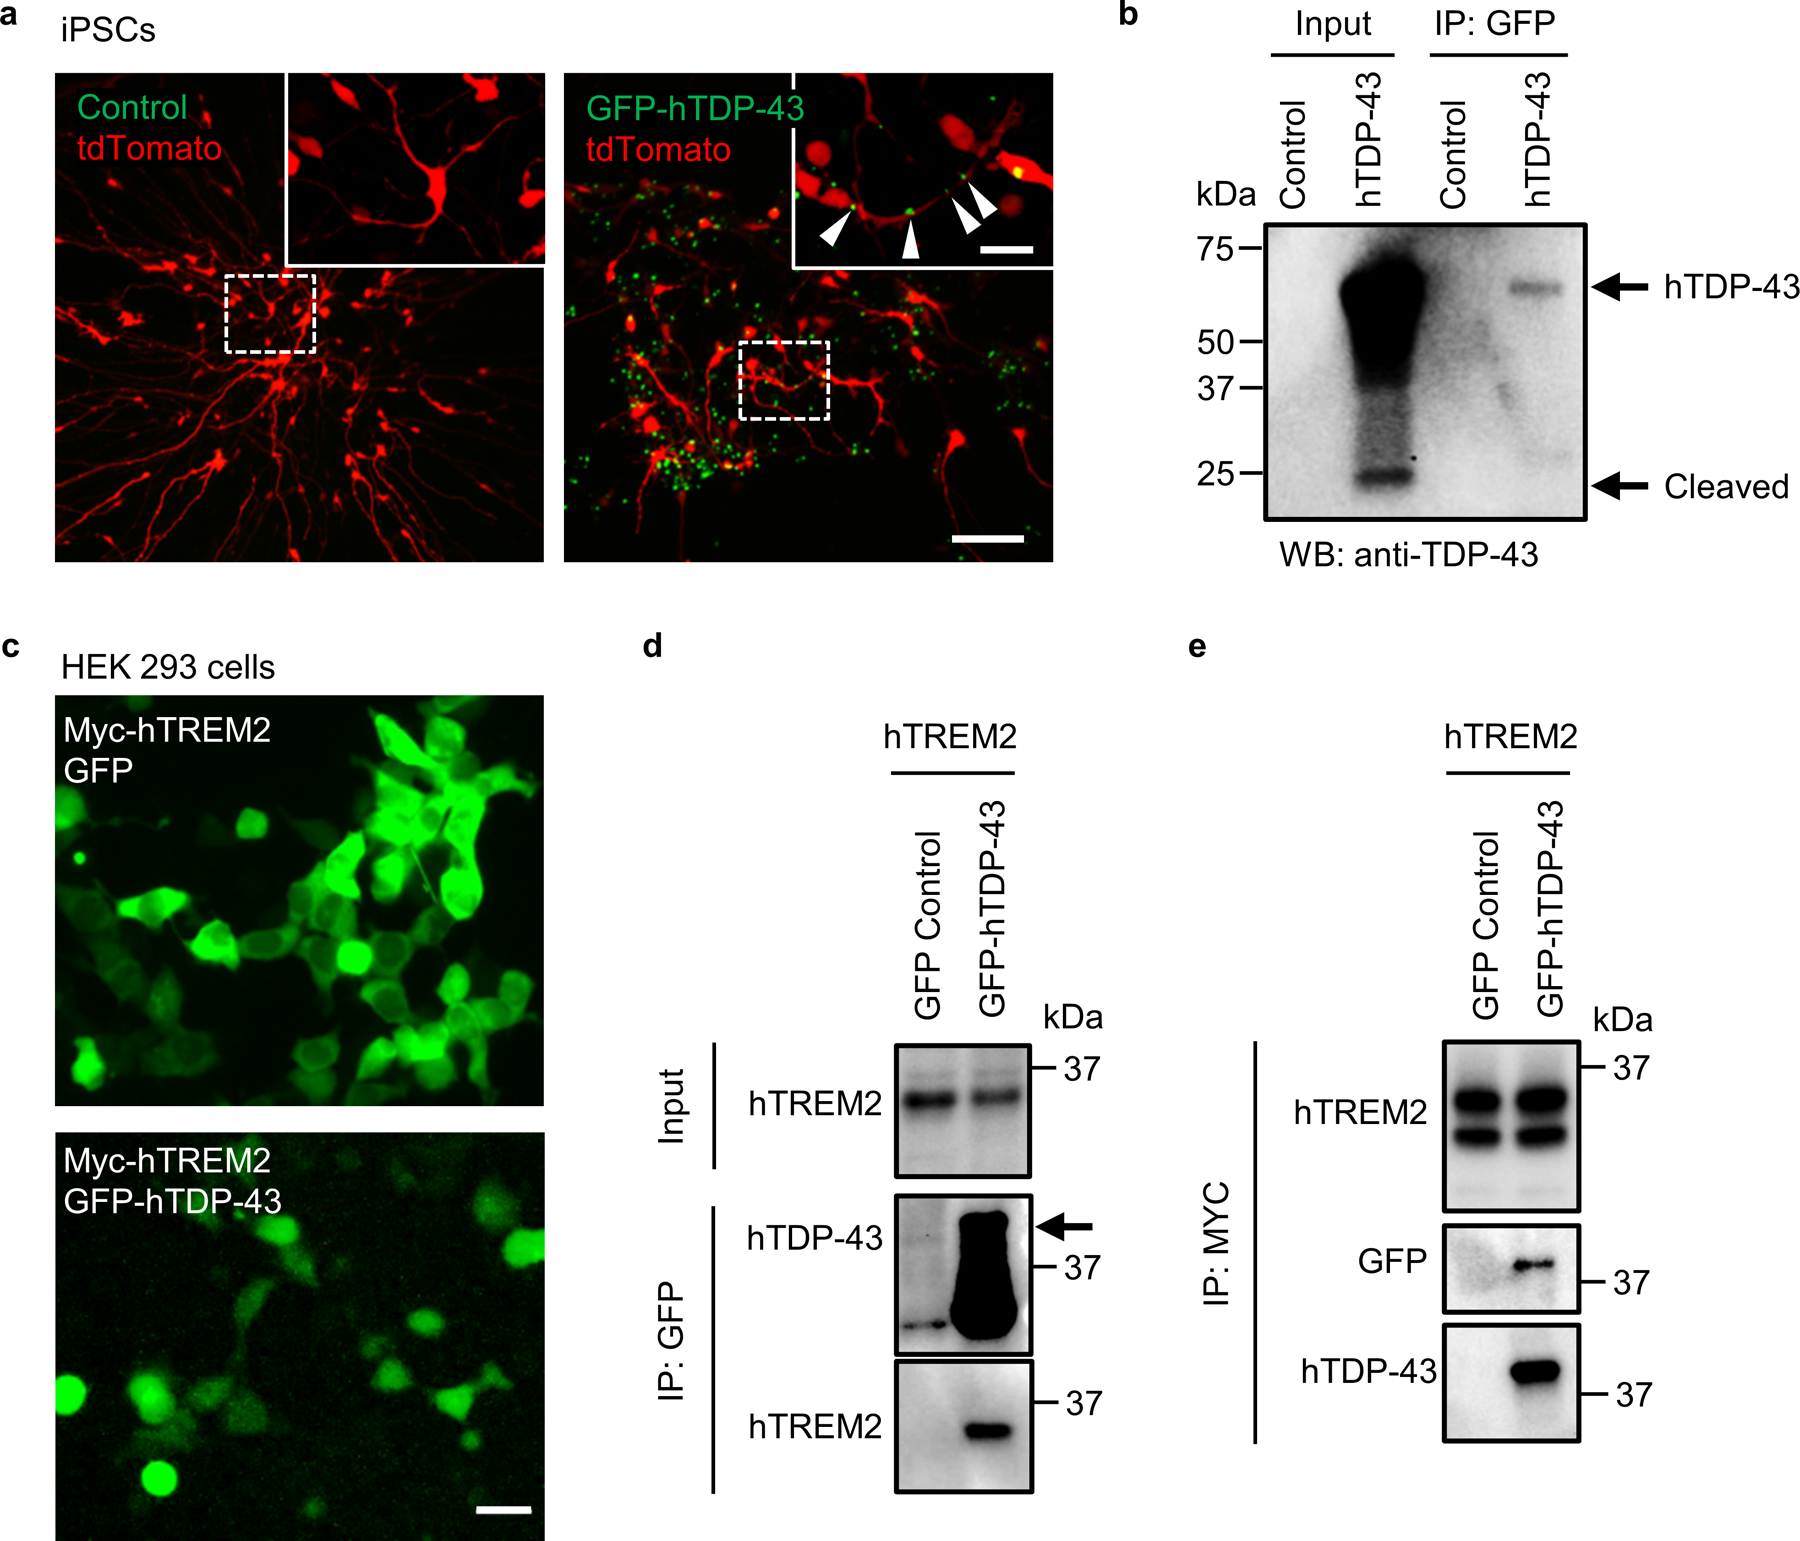
a, Representative images of human iPSC derived neurons infected with AAV9.CAG.hTDP-43.GFP virus or control virus at 21dpi. AAV1.CAG.tdTomato virus used to visualize neurons. Scale bar, 100 μm. Inserts show neuron morphology at high magnification as indicated by the area in dotted white box. White arrowheads indicate GFP-hTDP-43 translocation in neurites. Scale bar, 20 μm. b, Immunoblots of TDP-43 contained within collected culture media of iPSCs (left) or in pulled down fractions by bead-immobilized GFP antibody (right). c, Representative images of HEK 293T cells co-transfected with myc-tagged human TREM2 (myc-hTREM2) and GFP-hTDP-43 C terminal fragment (residues 216–414) or GFP control plasmids. Scale bar, 20 μm. d, myc-hTREM2 was co-immunoprecipitated with GFP-hTDP-43 in HEK 293T cells using bead-immobilized GFP antibody. Experiments were independently repeated three times. e, GFP-hTDP-43 was co-immunoprecipitated with myc-hTREM2 in HEK 293T cells using bead-immobilized myc antibody. Experiments were independently repeated three times.
Extended Data Fig. 9. Human TREM2 interacting proteins in HEK293T cells.
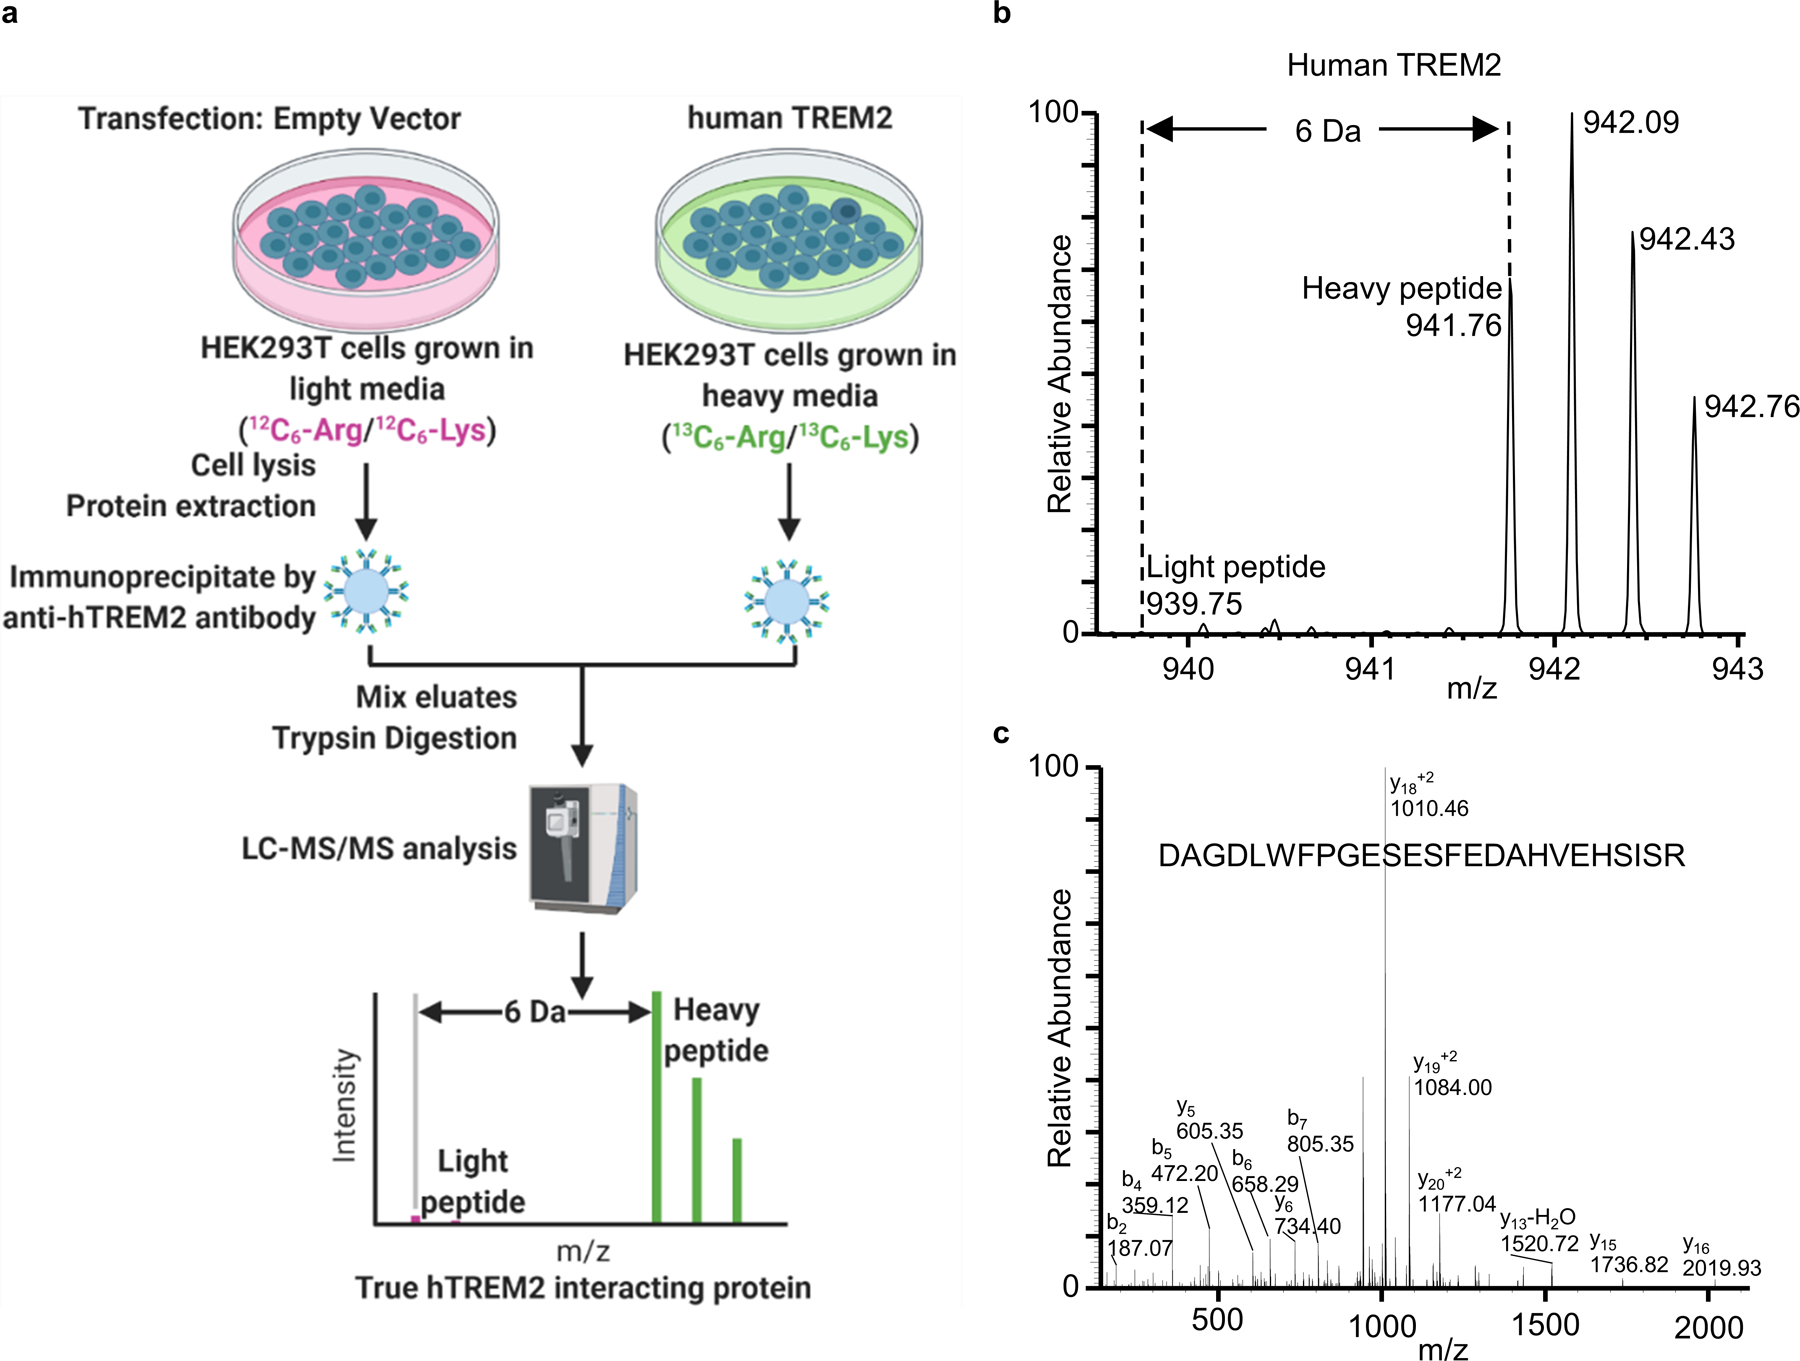
a, A schematic illustration of the SILAC methodology to identify human TREM2 interacting proteins in HEK293T cells (Created with BioRender.com). b and c, MS and MS/MS spectra of a peptide “D137AGDLWFPGESESFEDAHVEHSISR161” from human TREM2.
Extended Data Fig. 10. hTDP-43 interacts with TREM2 in vivo in mouse brain.
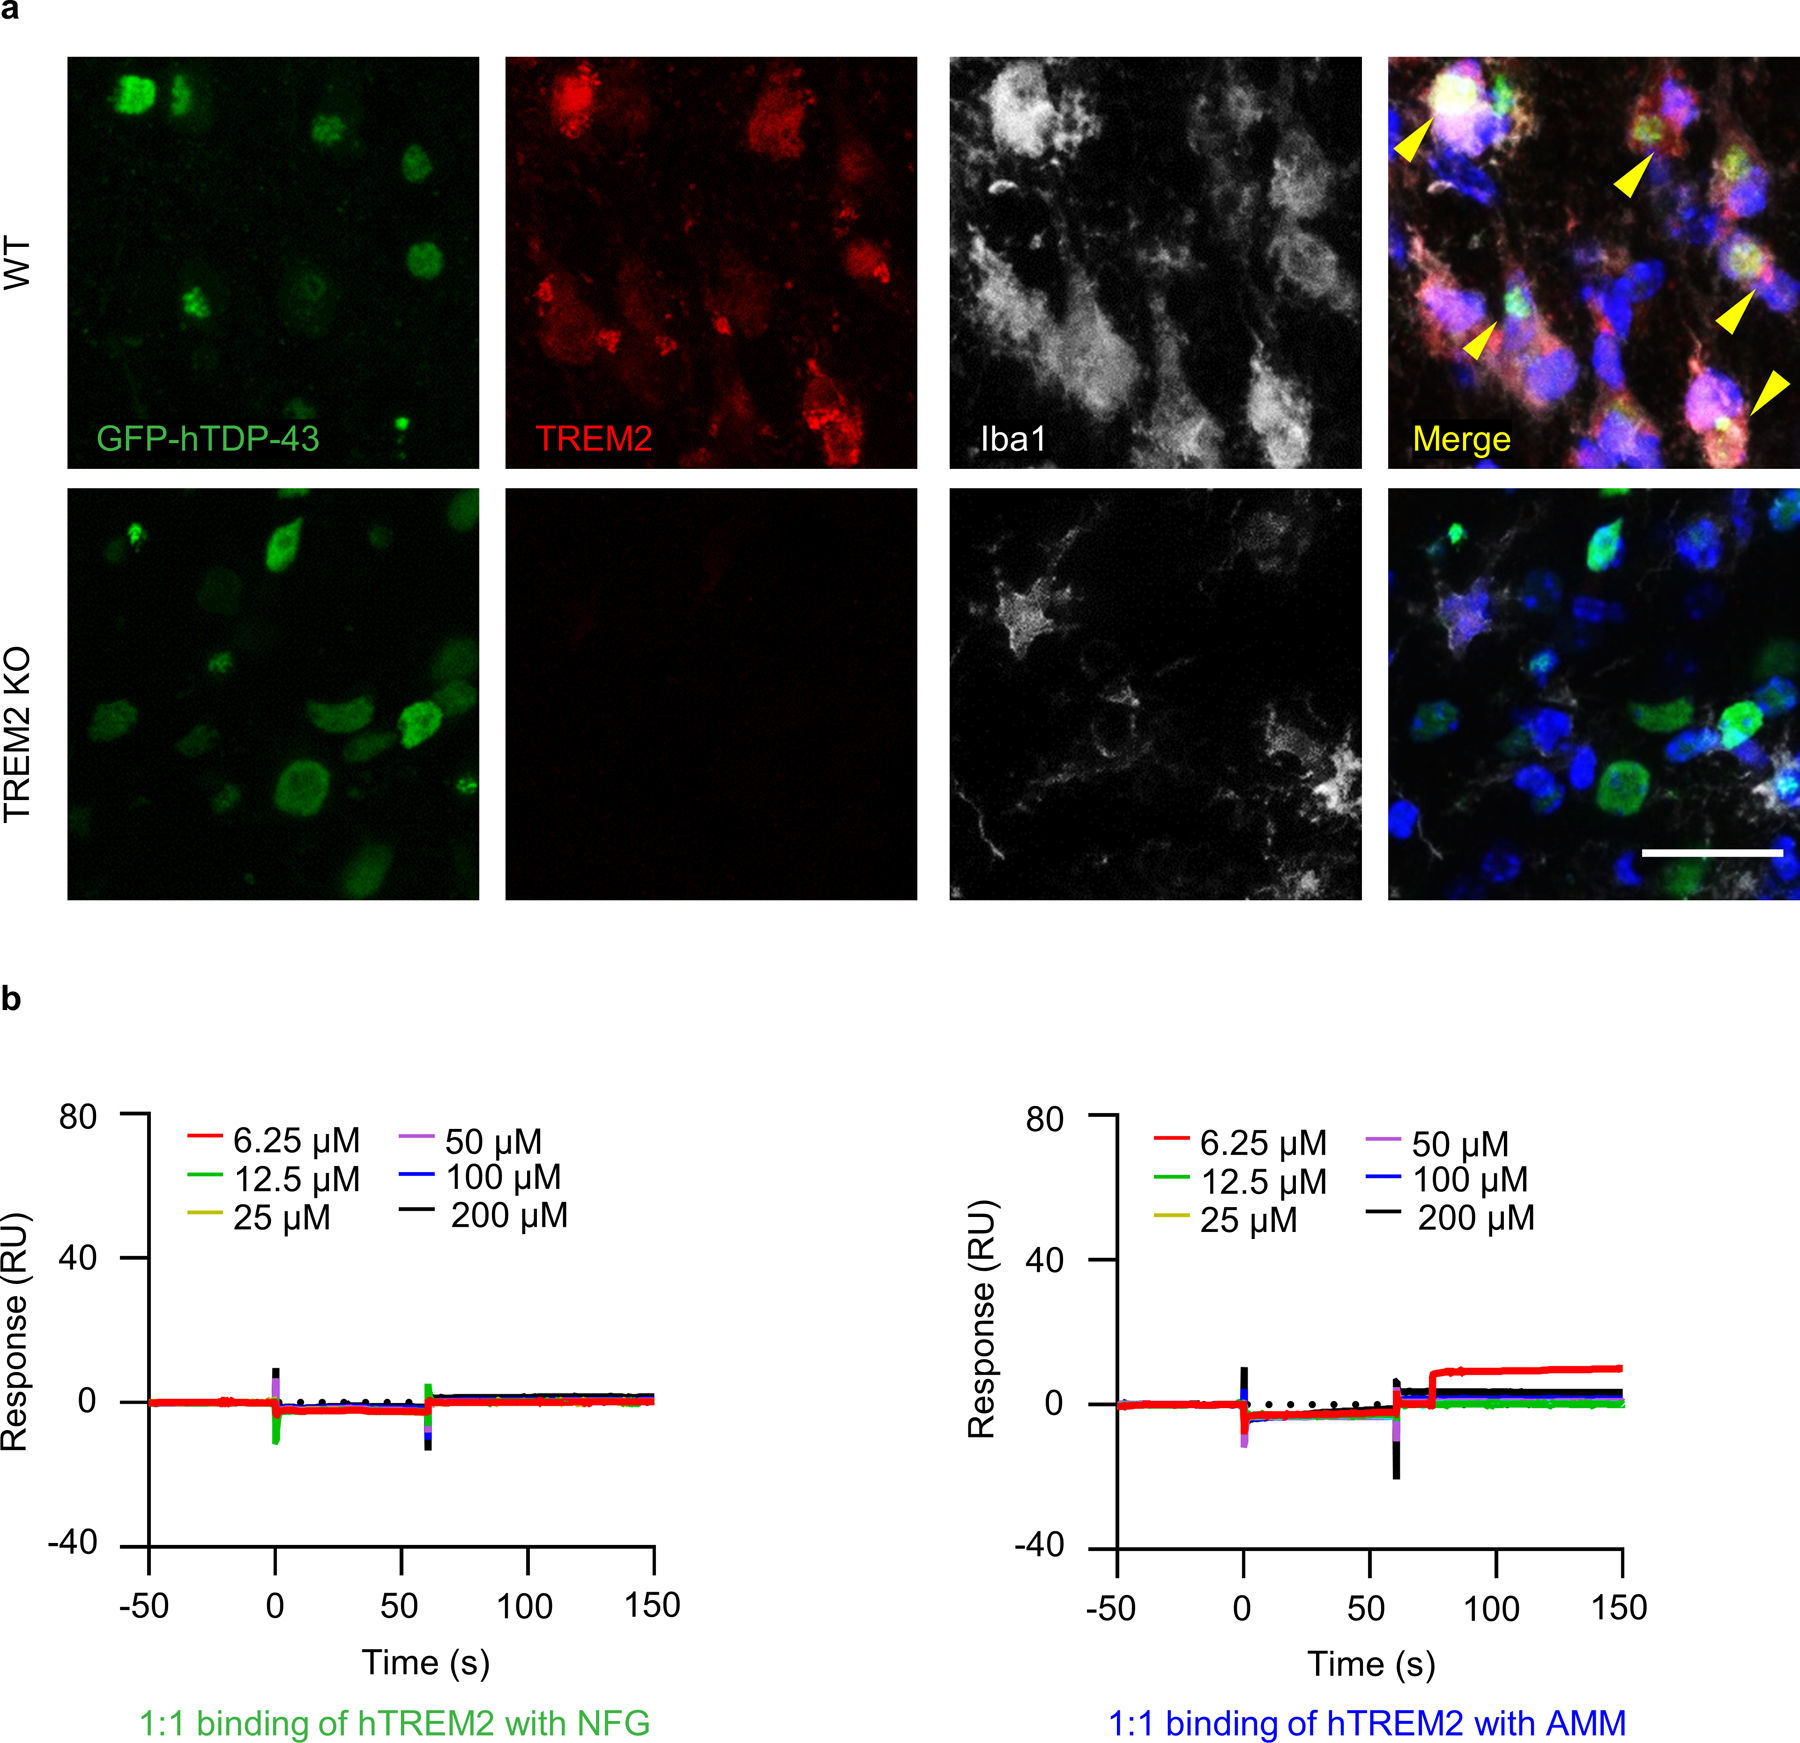
GFP-hTDP-43 was expressed in the primary motor cortex of 2-month-old mice via stereotactic intracerebral injection of AAV9.CAG.hTDP-43.GFP. a, Representative images of co-localization of TREM2 (red) with Iba1 (white) in microglia phagocytosing GFP-hTDP-43 (green) in the primary motor cortex of indicated groups at 14 dpi. Arrowheads indicate co-localization of TREM2 with phagocytic puncta of GFP-hTDP-43. Scale bar, 20 μm. b, SPR analysis of the binding between recombinant hTREM2 ECD (Met1-Ser174) with NFG and AMM at the indicated concentrations.
Supplementary Material
Acknowledgments
The authors thank Dr. Marco Colonna (Washington University) for providing TREM2 KO mice; Dr. Ronald L. Klein (Louisiana State University) for providing AAV virus, Dr. Vanda A. Lennon (Mayo Clinic Rochester) for thoughtful discussion and manuscript editing; Dr. Wilfried Rossoll (Mayo Clinic Florida) for insightful suggestions; Dr. Aaron J. Johnson (Mayo Clinic Rochester), Dr. Yi Zhu (Mayo Clinic Rochester) and Dr. Kevin D. Pavelko (Mayo Clinic Rochester Immune Monitoring Core) for assistance with CyTOF sample preparation and data analysis; Dr. Akhilesh Pandey (Mayo Clinic Rochester) and Mayo Clinic Proteomics Core (a shared resource of the Mayo Clinic Cancer Center) for LC-MS/MS experiment and data analysis; Dr. Charles Howe and Dr. Benjamin Clarkson (Mayo Clinic Rochester) for providing iPSC-derived neurons; Dr. Richard M Weinshilboum (Mayo Clinic Rochester) for assistance with biochemistry experiments. The current study is supported by NIH grants R21AG064159 and R01NS088627 to L.J.W, R01AG066395 to G.B and N.Z, and U19AG069701 to G.B, Y.A.M, N.Z, C.C.L, D.W.D, and L.J.W.
Footnotes
Competing interests
The authors declare no competing interests.
Data availability
The mass spectrometry proteomics data have been deposited to the ProteomeXchange Consortium via the PRIDE64 partner repository with the accession number PXD029429 and 10.6019/PXD029429. Other information that supports the findings of this study is available from the corresponding author upon request. Source data are provided with this paper.
References
- 1.Hickman S, Izzy S, Sen P, Morsett L & El Khoury J Microglia in neurodegeneration. Nat Neurosci 21, 1359–1369 (2018). [DOI] [PMC free article] [PubMed] [Google Scholar]
- 2.Ulland TK & Colonna M TREM2 - a key player in microglial biology and Alzheimer disease. Nat Rev Neurol 14, 667–675 (2018). [DOI] [PubMed] [Google Scholar]
- 3.Guerreiro R, et al. TREM2 variants in Alzheimer’s disease. N Engl J Med 368, 117–127 (2013). [DOI] [PMC free article] [PubMed] [Google Scholar]
- 4.Jonsson T, et al. Variant of TREM2 associated with the risk of Alzheimer’s disease. N Engl J Med 368, 107–116 (2013). [DOI] [PMC free article] [PubMed] [Google Scholar]
- 5.Wang Y, et al. TREM2 lipid sensing sustains the microglial response in an Alzheimer’s disease model. Cell 160, 1061–1071 (2015). [DOI] [PMC free article] [PubMed] [Google Scholar]
- 6.Zhao Y, et al. TREM2 Is a Receptor for beta-Amyloid that Mediates Microglial Function. Neuron 97, 1023–1031 e1027 (2018). [DOI] [PMC free article] [PubMed] [Google Scholar]
- 7.Ou SH, Wu F, Harrich D, Garcia-Martinez LF & Gaynor RB Cloning and characterization of a novel cellular protein, TDP-43, that binds to human immunodeficiency virus type 1 TAR DNA sequence motifs. J Virol 69, 3584–3596 (1995). [DOI] [PMC free article] [PubMed] [Google Scholar]
- 8.Neumann M, et al. Ubiquitinated TDP-43 in frontotemporal lobar degeneration and amyotrophic lateral sclerosis. Science 314, 130–133 (2006). [DOI] [PubMed] [Google Scholar]
- 9.Cairns NJ, et al. TDP-43 in familial and sporadic frontotemporal lobar degeneration with ubiquitin inclusions. Am J Pathol 171, 227–240 (2007). [DOI] [PMC free article] [PubMed] [Google Scholar]
- 10.Cady J, et al. TREM2 variant p.R47H as a risk factor for sporadic amyotrophic lateral sclerosis. JAMA Neurol 71, 449–453 (2014). [DOI] [PMC free article] [PubMed] [Google Scholar]
- 11.Rayaprolu S, et al. TREM2 in neurodegeneration: evidence for association of the p.R47H variant with frontotemporal dementia and Parkinson’s disease. Mol Neurodegener 8, 19 (2013). [DOI] [PMC free article] [PubMed] [Google Scholar]
- 12.Krasemann S, et al. The TREM2-APOE Pathway Drives the Transcriptional Phenotype of Dysfunctional Microglia in Neurodegenerative Diseases. Immunity 47, 566–581 e569 (2017). [DOI] [PMC free article] [PubMed] [Google Scholar]
- 13.Maniatis S, et al. Spatiotemporal dynamics of molecular pathology in amyotrophic lateral sclerosis. Science 364, 89–93 (2019). [DOI] [PubMed] [Google Scholar]
- 14.Walker AK, et al. Functional recovery in new mouse models of ALS/FTLD after clearance of pathological cytoplasmic TDP-43. Acta Neuropathol 130, 643–660 (2015). [DOI] [PMC free article] [PubMed] [Google Scholar]
- 15.Perry VH, Nicoll JA & Holmes C Microglia in neurodegenerative disease. Nat Rev Neurol 6, 193–201 (2010). [DOI] [PubMed] [Google Scholar]
- 16.Mrdjen D, et al. High-Dimensional Single-Cell Mapping of Central Nervous System Immune Cells Reveals Distinct Myeloid Subsets in Health, Aging, and Disease. Immunity 48, 380–395 e386 (2018). [DOI] [PubMed] [Google Scholar]
- 17.Keren-Shaul H, et al. A Unique Microglia Type Associated with Restricting Development of Alzheimer’s Disease. Cell 169, 1276–1290 e1217 (2017). [DOI] [PubMed] [Google Scholar]
- 18.Eyo UB, et al. P2Y12R-Dependent Translocation Mechanisms Gate the Changing Microglial Landscape. Cell Rep 23, 959–966 (2018). [DOI] [PMC free article] [PubMed] [Google Scholar]
- 19.Spiller KJ, et al. Microglia-mediated recovery from ALS-relevant motor neuron degeneration in a mouse model of TDP-43 proteinopathy. Nat Neurosci 21, 329–340 (2018). [DOI] [PMC free article] [PubMed] [Google Scholar]
- 20.Steinacker P, et al. TDP-43 in cerebrospinal fluid of patients with frontotemporal lobar degeneration and amyotrophic lateral sclerosis. Arch Neurol 65, 1481–1487 (2008). [DOI] [PMC free article] [PubMed] [Google Scholar]
- 21.Zhong J, et al. The interactome of a PTB domain-containing adapter protein, Odin, revealed by SILAC. J Proteomics 74, 294–303 (2011). [DOI] [PMC free article] [PubMed] [Google Scholar]
- 22.Guenther EL, et al. Atomic structures of TDP-43 LCD segments and insights into reversible or pathogenic aggregation. Nat Struct Mol Biol 25, 463–471 (2018). [DOI] [PMC free article] [PubMed] [Google Scholar]
- 23.Lee EB, Lee VM & Trojanowski JQ Gains or losses: molecular mechanisms of TDP43-mediated neurodegeneration. Nat Rev Neurosci 13, 38–50 (2011). [DOI] [PMC free article] [PubMed] [Google Scholar]
- 24.Li Q, et al. Developmental Heterogeneity of Microglia and Brain Myeloid Cells Revealed by Deep Single-Cell RNA Sequencing. Neuron 101, 207–223 e210 (2019). [DOI] [PMC free article] [PubMed] [Google Scholar]
- 25.Liu YU, et al. Neuronal network activity controls microglial process surveillance in awake mice via norepinephrine signaling. Nat Neurosci 22, 1771–1781 (2019). [DOI] [PMC free article] [PubMed] [Google Scholar]
- 26.Parhizkar S, et al. Loss of TREM2 function increases amyloid seeding but reduces plaque-associated ApoE. Nat Neurosci 22, 191–204 (2019). [DOI] [PMC free article] [PubMed] [Google Scholar]
- 27.Leyns CEG, et al. TREM2 function impedes tau seeding in neuritic plaques. Nat Neurosci 22, 1217–1222 (2019). [DOI] [PMC free article] [PubMed] [Google Scholar]
- 28.Lee CYD, et al. Elevated TREM2 Gene Dosage Reprograms Microglia Responsivity and Ameliorates Pathological Phenotypes in Alzheimer’s Disease Models. Neuron 97, 1032–1048 e1035 (2018). [DOI] [PMC free article] [PubMed] [Google Scholar]
- 29.Konishi H & Kiyama H Microglial TREM2/DAP12 Signaling: A Double-Edged Sword in Neural Diseases. Front Cell Neurosci 12, 206 (2018). [DOI] [PMC free article] [PubMed] [Google Scholar]
- 30.Mazaheri F, et al. TREM2 deficiency impairs chemotaxis and microglial responses to neuronal injury. EMBO Rep 18, 1186–1198 (2017). [DOI] [PMC free article] [PubMed] [Google Scholar]
- 31.Zheng H, et al. TREM2 Promotes Microglial Survival by Activating Wnt/beta-Catenin Pathway. J Neurosci 37, 1772–1784 (2017). [DOI] [PMC free article] [PubMed] [Google Scholar]
- 32.Guan Z, et al. Injured sensory neuron-derived CSF1 induces microglial proliferation and DAP12-dependent pain. Nat Neurosci 19, 94–101 (2016). [DOI] [PMC free article] [PubMed] [Google Scholar]
- 33.Gu N, et al. Spinal Microgliosis Due to Resident Microglial Proliferation Is Required for Pain Hypersensitivity after Peripheral Nerve Injury. Cell Rep 16, 605–614 (2016). [DOI] [PMC free article] [PubMed] [Google Scholar]
- 34.Otero K, et al. Macrophage colony-stimulating factor induces the proliferation and survival of macrophages via a pathway involving DAP12 and beta-catenin. Nat Immunol 10, 734–743 (2009). [DOI] [PMC free article] [PubMed] [Google Scholar]
- 35.Brown GC & Neher JJ Microglial phagocytosis of live neurons. Nat Rev Neurosci 15, 209–216 (2014). [DOI] [PubMed] [Google Scholar]
- 36.Fu R, Shen Q, Xu P, Luo JJ & Tang Y Phagocytosis of microglia in the central nervous system diseases. Mol Neurobiol 49, 1422–1434 (2014). [DOI] [PMC free article] [PubMed] [Google Scholar]
- 37.Hong S, et al. Complement and microglia mediate early synapse loss in Alzheimer mouse models. Science 352, 712–716 (2016). [DOI] [PMC free article] [PubMed] [Google Scholar]
- 38.Koizumi S, et al. UDP acting at P2Y6 receptors is a mediator of microglial phagocytosis. Nature 446, 1091–1095 (2007). [DOI] [PMC free article] [PubMed] [Google Scholar]
- 39.Tufail Y, et al. Phosphatidylserine Exposure Controls Viral Innate Immune Responses by Microglia. Neuron 93, 574–586 e578 (2017). [DOI] [PMC free article] [PubMed] [Google Scholar]
- 40.Das R & Chinnathambi S Microglial priming of antigen presentation and adaptive stimulation in Alzheimer’s disease. Cell Mol Life Sci 76, 3681–3694 (2019). [DOI] [PMC free article] [PubMed] [Google Scholar]
- 41.Harms AS, et al. MHCII is required for alpha-synuclein-induced activation of microglia, CD4 T cell proliferation, and dopaminergic neurodegeneration. J Neurosci 33, 9592–9600 (2013). [DOI] [PMC free article] [PubMed] [Google Scholar]
- 42.Bulloch K, et al. CD11c/EYFP transgene illuminates a discrete network of dendritic cells within the embryonic, neonatal, adult, and injured mouse brain. J Comp Neurol 508, 687–710 (2008). [DOI] [PubMed] [Google Scholar]
- 43.Sheean RK, et al. Association of Regulatory T-Cell Expansion With Progression of Amyotrophic Lateral Sclerosis: A Study of Humans and a Transgenic Mouse Model. JAMA Neurol 75, 681–689 (2018). [DOI] [PMC free article] [PubMed] [Google Scholar]
- 44.Sato-Hashimoto M, et al. Microglial SIRPalpha regulates the emergence of CD11c(+) microglia and demyelination damage in white matter. Elife 8 (2019). [DOI] [PMC free article] [PubMed] [Google Scholar]
- 45.Atagi Y, et al. Apolipoprotein E Is a Ligand for Triggering Receptor Expressed on Myeloid Cells 2 (TREM2). J Biol Chem 290, 26043–26050 (2015). [DOI] [PMC free article] [PubMed] [Google Scholar]
- 46.Feiler MS, et al. TDP-43 is intercellularly transmitted across axon terminals. J Cell Biol 211, 897–911 (2015). [DOI] [PMC free article] [PubMed] [Google Scholar]
- 47.Zhong L, et al. Soluble TREM2 ameliorates pathological phenotypes by modulating microglial functions in an Alzheimer’s disease model. Nat Commun 10, 1365 (2019). [DOI] [PMC free article] [PubMed] [Google Scholar]
- 48.Kober DL, et al. Neurodegenerative disease mutations in TREM2 reveal a functional surface and distinct loss-of-function mechanisms. Elife 5 (2016). [DOI] [PMC free article] [PubMed] [Google Scholar]
- 49.Yeh FL, Wang Y, Tom I, Gonzalez LC & Sheng M TREM2 Binds to Apolipoproteins, Including APOE and CLU/APOJ, and Thereby Facilitates Uptake of Amyloid-Beta by Microglia. Neuron 91, 328–340 (2016). [DOI] [PubMed] [Google Scholar]
- 50.Ling JP, Pletnikova O, Troncoso JC & Wong PC TDP-43 repression of nonconserved cryptic exons is compromised in ALS-FTD. Science 349, 650–655 (2015). [DOI] [PMC free article] [PubMed] [Google Scholar]
- 51.Clarkson BDS, Patel MS, LaFrance-Corey RG & Howe CL Retrograde interferon-gamma signaling induces major histocompatibility class I expression in human-induced pluripotent stem cell-derived neurons. Ann Clin Transl Neurol 5, 172–185 (2018). [DOI] [PMC free article] [PubMed] [Google Scholar]
- 52.Kim JY, Grunke SD, Levites Y, Golde TE & Jankowsky JL Intracerebroventricular viral injection of the neonatal mouse brain for persistent and widespread neuronal transduction. J Vis Exp, 51863 (2014). [DOI] [PMC free article] [PubMed] [Google Scholar]
- 53.Peng J, et al. Microglia and monocytes synergistically promote the transition from acute to chronic pain after nerve injury. Nat Commun 7, 12029 (2016). [DOI] [PMC free article] [PubMed] [Google Scholar]
- 54.Gittins R & Harrison PJ Neuronal density, size and shape in the human anterior cingulate cortex: a comparison of Nissl and NeuN staining. Brain Res Bull 63, 155–160 (2004). [DOI] [PubMed] [Google Scholar]
- 55.Pang YP FF12MC: A revised AMBER forcefield and new protein simulation protocol. Proteins 84, 1490–1516 (2016). [DOI] [PMC free article] [PubMed] [Google Scholar]
- 56.Jorgensen WL, Chandreskhar J, Madura JD, Impey RW & Klein ML Comparison of simple potential functions for simulating liquid water. J. Chem. Phys 79, 926–935 (1983). [Google Scholar]
- 57.Pang Y-P Use of 1–4 interaction scaling factors to control the conformational equilibrium between α-helix and β-strand. Biochem. Biophys. Res. Commun 457, 183–186 (2015). [DOI] [PubMed] [Google Scholar]
- 58.Larini L, Mannella R & Leporini D Langevin stabilization of molecular-dynamics simulations of polymers by means of quasisymplectic algorithms. J Chem Phys 126, 104101 (2007). [DOI] [PubMed] [Google Scholar]
- 59.Darden TA, York DM & Pedersen LG Particle mesh Ewald: An N log(N) method for Ewald sums in large systems. J. Chem. Phys 98, 10089–10092 (1993). [Google Scholar]
- 60.Pang YP Low-mass molecular dynamics simulation for configurational sampling enhancement: More evidence and theoretical explanation. Biochem Biophys Rep 4, 126–133 (2015). [DOI] [PMC free article] [PubMed] [Google Scholar]
- 61.Joung IS & Cheatham TE Determination of alkali and halide monovalent ion parameters for use in explicitly solvated biomolecular simulations. J. Phys. Chem. B 112, 9020–9041 (2008). [DOI] [PMC free article] [PubMed] [Google Scholar]
- 62.Leyns CEG, et al. TREM2 function impedes tau seeding in neuritic plaques. Nat Neurosci (2019). [DOI] [PMC free article] [PubMed] [Google Scholar]
- 63.Zhang J, et al. Neurotoxic microglia promote TDP-43 proteinopathy in progranulin deficiency. Nature 588, 459–465 (2020). [DOI] [PMC free article] [PubMed] [Google Scholar]
- 64.Perez-Riverol Y, et al. The PRIDE database and related tools and resources in 2019: improving support for quantification data. Nucleic Acids Res 47, D442–D450 (2019). [DOI] [PMC free article] [PubMed] [Google Scholar]
Associated Data
This section collects any data citations, data availability statements, or supplementary materials included in this article.
Supplementary Materials
Data Availability Statement
The mass spectrometry proteomics data have been deposited to the ProteomeXchange Consortium via the PRIDE64 partner repository with the accession number PXD029429 and 10.6019/PXD029429. Other information that supports the findings of this study is available from the corresponding author upon request. Source data are provided with this paper.


