

Abstract
Recent advancements place a comprehensive catalog of the structures, oligomeric states, sequences, and modification statuses of cellular proteins tentatively within reach; thus providing an unprecedented roadmap to therapies for many human diseases. To achieve this goal, revolutionary technologies capable of bridging key gaps in our ability to simultaneously measure protein composition and structure must be developed. Much of the current progress in this area has been catalyzed by mass spectrometry (MS) tools, which have become an indispensable resource for interrogating the structural proteome. For example, methods associated with native proteomics seek to comprehensively capture and quantify the endogenous assembly states for all proteins within an organism. Such technologies have often been partnered with ion mobility (IM) separation, from which collision cross section (CCS) information can be rapidly extracted to provide protein size information. IM technologies are also being developed that utilize CCS values to enhance the confidence of protein identification workflows derived from liquid chromatography-IM-MS analyses of enzymatically produced peptide mixtures. Such parallel advancements in technology beg the question: can CCS values prove similarly useful for the identification of intact proteins and their complexes in native proteomics? In this perspective, I examine current evidence and technology trends to explore the promise and limitations of such CCS information for the comprehensive analysis of multi-protein complexes from cellular mixtures.
Keywords: Ion Mobility, Native Mass Spectrometry, Collision Induced Unfolding, Proteoform, Structural Biology, Structural Proteomics, Structural Mass Spectrometry, Protein Identification, Multi-protein Complexes, Ion Mobility-Mass Spectrometry
Graphical Abstract

Introduction
Despite decades of sustained study, there remain many gaps in our understanding of protein function. Recent advances in mass spectrometry (MS) and proteomics have dramatically advanced our ability to comprehensively assay the identities of protein-based gene products1 leading recently to a broad, cross-organism comparison of protein expression levels2. Similar advancements have enabled the proteome-wide atlas of protein stability3. Each of these advances have been built on MS analyses of peptides produced from enzymatic digests of protein mixtures, referred to collectively as bottom-up proteomics methods, which are largely blind to the presence of individual proteoforms within the organisms probed. Proteoforms (Figure 1) are products of the same gene differentiated through small variations in their ultimate sequence and modification state4. This concept allows for 1–2 orders of magnitude more functional proteins than indicated within the human genome5. Proteoforms can be directly characterized by MS in a top-down sequencing mode6, unraveling the complexities associated with many biochemical processes, including epigenetic control over gene expression7 and cardiac myofilament function8.
Figure 1.

This schematic diagram illustrates the many processes by which proteoforms can be created. Genomic DNA sequences give rise to RNA transcripts which in turn are translated and expressed as proteins. Each gene can give rise to many separate proteoforms by way of splice variants, sequence variations, single nucleotide polymorphisms (SNPs), or differential post-translational modifications (PTMs, phosphorylation and glycosylation shown). Such compositional proteoforms can also give rise to structural proteoforms, which can regulate the formation of larger biological assemblies. These last three aspects of proteins can be targets of native protoemics (red dashed box). Although not shown in this diagram, the quaternary structures of protein complexes may also adopt a range of structural microstates that impact assembly function. Modified with permission from reference 5. Copyright 2018, Springer Nature.
While proteoforms are centrally important to our expanding understanding of protein biochemistry, this concept does not typically encompass the impact of dynamic 3D structures on protein function. Indeed, the structures of proteins can be proteoform dependent, giving rise to the concept of structural proteoforms (Figure 1) that can be critical to evaluate in our on-going efforts to uncover the functional mechanisms of cellular proteins. In addition, such structural proteoforms rarely function in isolation, instead forming a vast array of multi-protein complexes to carry out key cellular tasks9. Macromolecular protein machines comprise an incredibly diverse and important class of drug targets10, for which any level of structural information would significantly enable the discovery and development of therapeutics, particularly in the context of drugs targeting specific protein-protein interactions. Native MS, a branch of MS technology capable of directly detecting intact multi-protein complexes, has recently grown to encompass top-down sequencing capabilities, and proteome-wide assessments of multi-protein complexes continue to be reported based on such approaches, often collectively termed native proteomics11. In parallel with these efforts, a wide array of structural MS tools have been developed to assay protein conformations, which excel in extracting such information from mixtures, at low levels, for targets that exhibit some level of oligomeric polydispersity12.
The MS technology underpinning much of the discussion above has been dramatically enhanced by the incorporation of ion mobility (IM) spectrometry, a gas-phase analog of electrophoresis capable of separating biomolecular ions according to their size, shape and charge on the millisecond to second timescale13. Ion size information, in the form of orientationally-averaged collision cross sections (CCSs) can be directly extracted from most IM datasets, providing valuable information that can aide in the identification of proteins when added to existing liquid chromatography (LC)-MS experiments14. Recent advancements in IM separation technology have enabled the acquisition of high resolution (RIM > 200) IM data and high-precision CCS values (σ < 1%) for the proteolytic peptides typically interrogated in bottom-up proteomic pipelines, considerably enhancing the peak capacity and information content typically realized in such experiments15–18. Alongside these dramatic improvements in experimental IM-MS data, comprehensive CCS databases19 and machine learning based CCS predictions20 have allowed IM data to more directly aide in the identification of proteolytic peptides and have thus produced significant improvements in both the depth and confidence of proteome coverage data21.
Given the IM-related advantages currently leveraged by bottom-up proteomics protocols, a direct extension of such technology to native proteomics methods may seem like an obvious route to similarly improve this separate branch of proteomics. IM-MS is commonly used to interrogate the structures of purified proteins and protein complexes22–24, and is increasingly being utilized to assess the conformation of protein assemblies in the context of complex mixtures that remain refractory to other structural biology approaches25,26. While protein CCS prediction methodologies currently lag significantly behind those currently in use for small molecules and peptides27, the wide availability of structural data for individual proteins and their associated assemblies28 allows for predictions to be made concerning the effectiveness of CCS values in the identification of such biomolecules within complex mixtures. In this perspective, I explore both the potential advantages and future challenges associated with IM-MS in native proteomics, as well as suggest future routes for the development of IM-MS methods aimed at comprehensive protein complex identification.
Estimated Collision Cross Section Ensembles for Native Protein Mixtures
If 3D structural coordinates are available for a target protein, CCS values can be readily estimated using a variety of approaches of differing accuracy and speed27. Currently the on-line protein databank (PDB) contains over eighteen thousand macromolecular structures28, thus providing a rich environment form which to project simulated protein mixtures that may mimic those encountered in native proteomics data. Indeed, a wide variety of methods exist to estimate protein ion CCS values using PDB structure data as a starting point, typically requiring molecular dynamics (MD) simulations in order to generate the compact, ionized forms of the available structures adopted by gas-phase proteins29. Notably, the rise of rapid, projection-approximation based estimates of protein CCSs has enabled such assessments of nearly the entire PDB inventory30.
Figure 2 projects a portion of a previously reported CCS analysis of the PDB30, replotted in an effort to emulate a future IM-MS dataset encountered during a native proteomics experiment. Clearly, differences exist between real IM-MS data and the plot shown in Figure 2, including: an incomplete assessment of structures resulting from the presence of multiple proteoforms, the lack of multiple charge states for indicated proteins, and the use of an estimated RIM value that currently exceeds what has been demonstrated experimentally for protein complex ions31. Despite this, Figure 2 clearly illustrates the increased peak capacity for native proteomics experiments offered by IM-MS when compared to MS-only workflows. When the m/z and CCS range depicted in Figure 2 is considered, a maximum factor increase in peak capacity of ~80 can realized over MS analyses alone. Since the 2D IM-MS region containing signals is not a uniform shape, the overall magnitude of the CCS-related peak capacity benefit realized is dependent upon the resolution of the IM dimension and the mass range probed21,32,33. As a specific example, Figure 2B highlights a simulated IM separation for the PDB structures found within a 0.55 m/z slice, a simulated MS resolution (RMS) of 10,000, centered on an estimated m/z value of 5418.2 within the data shown in Figure 2A. In this narrow section of MS space, approximately 8 CCS features can be resolved at a simulated IM resolution (RIM) of approximately 100. The separated CCS features correspond to proteins and complexes possessing dramatically different topologies, including structures for the aluminum fluoride bound sarcoplasmic reticulum (SR) Ca2+-ATPase (Figure 2C), the SR Ca2+-ATPase bound to the inhibitor thapsigargin which stabilizes its calcium-free E2 conformational state (Figure 2D), and the trimeric AcrB multidrug efflux pump (Figure 2E). Clearly, high resolution IM separations would confer significant benefits to native proteomics methods, if realized, as such experiments are often conducted using RMS values close to those indicated above, although lower values can often be observed for samples containing highly-adducted protein assemblies34.
Figure 2.
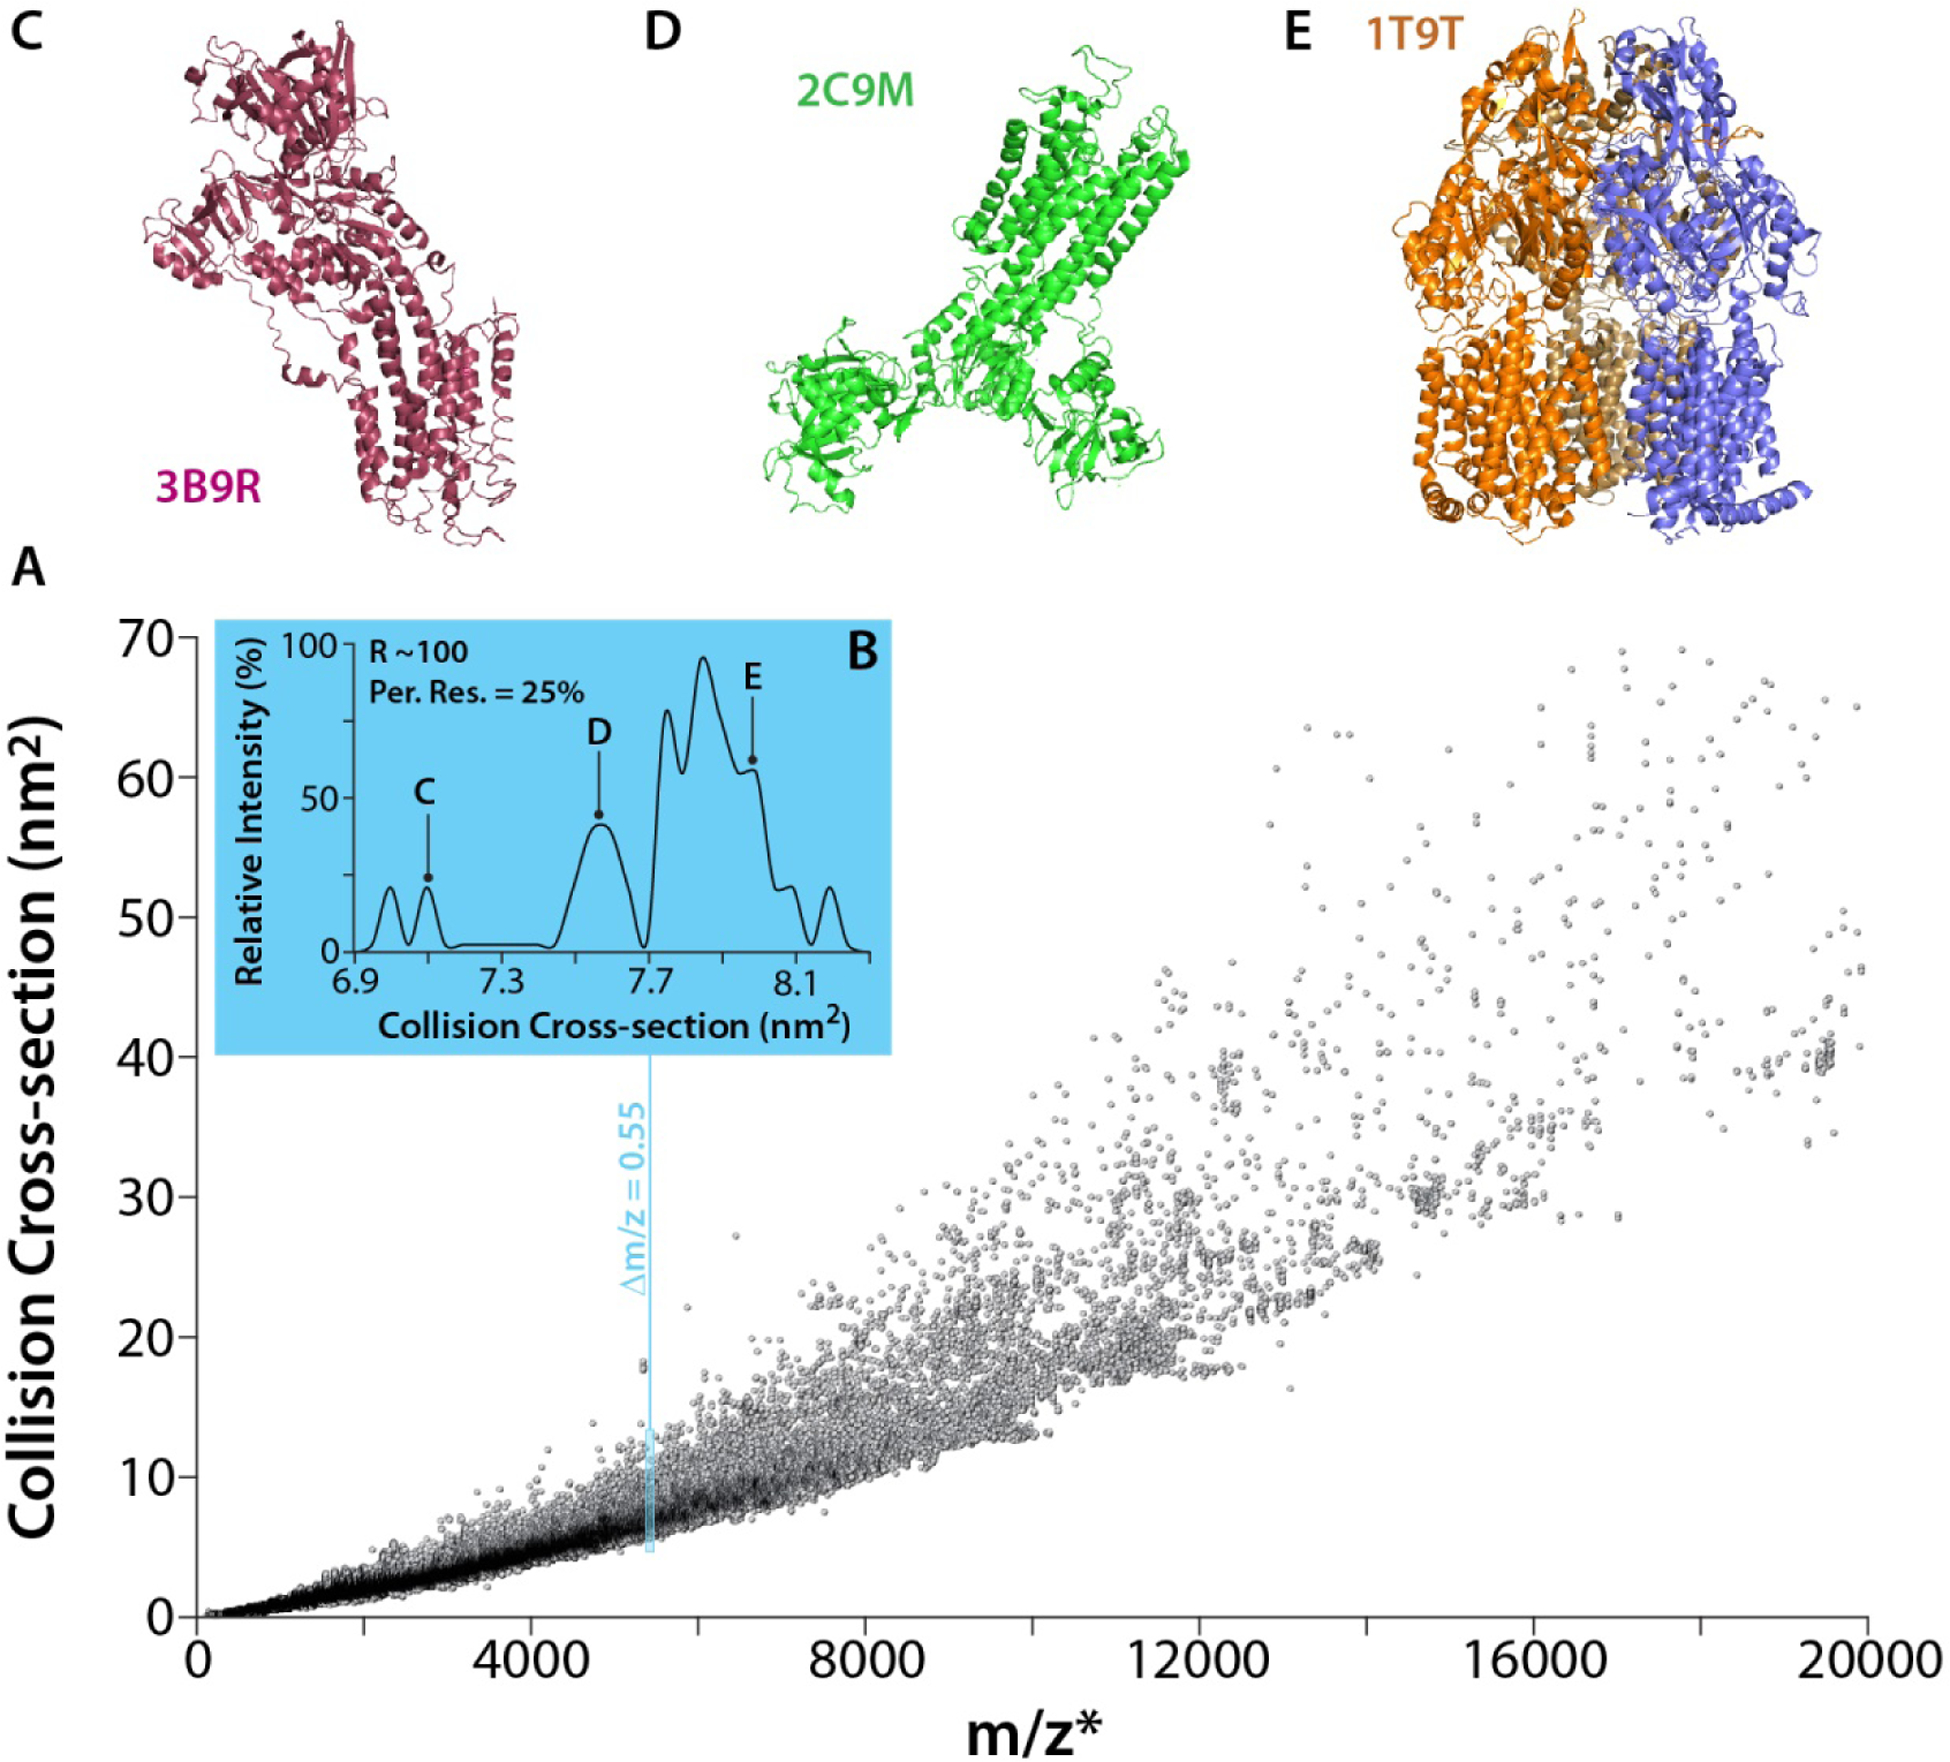
CCS data across the proteome. A) A plot of the IMPACT-determined CCS values for PDB structures against their estimated m/z value (using 1.87 (MW)1/2 to estimate the average protein charge state and assuming proton charge carriers). The raw CCS data includes the same group of curated pdb entries discussed in reference 30. B) An inset showing an estimated IM data set extracted from a 0.55 m/z window centered on an estimated m/z 5481.2. Annotated peaks correspond to structures indicated in panels C-E. In total, 33 PDB structures are represented in the simulated IM data shown, which are binned in order to produce an effective IM resolution (R) of ~100. C) Structure for the aluminum fluoride bound sarcoplasmic reticulum (SR) Ca2+-ATPase, PDB ID: 3B9R. D) Structure for the SR Ca2+-ATPase bound to the inhibitor thapsigargin, PDB ID: 2C9M. E) Structure of the trimeric AcrB multidrug efflux pump, PDB ID: 1T9T. Data from reference 30.
The Dynamism of Protein Structures and Ion Mobility Band Broadening
Despite the potential benefits of IM separations and protein ion CCS values illustrated in Figure 2, there remain many significant challenges in realizing IM separations of a quality sufficient to produce the peak capacity enhancements quoted above. First, the simulated data shown in Figure 2B does not succeed in resolving all of the structures found within the simulated m/z space queried. In total, 33 PDB coordinate files have intact molecular weights that place them within the narrow m/z slice depicted in Figure 2B, thus an RIM value of ~100 leads to the resolution of only 25% of the available protein forms available in the source data used to generate the plot shown. It is worth noting that an RIM value of 5.98 × 10⁶ would be required to resolve all PDB structures included in Figure 2. Secondly, most reports of current-generation high resolution IM separators do not include examples of RIM ~100 data for model proteins or protein complex ions under native conditions, with most reports indicating that an RIM values ranging from 40–80 represent the maximum current level of separation performance available for native protein IM separations31,35. Obviously, such a decrease in RIM would further degrade both the number of resolved PDB structures from the values quoted above, as well as the significance of the recorded CCS data from such an experiment for identification purposes.
Discrepancies between RIM values reported for large proteins and small molecules on high-resolution IM separators are a product of many factors, but among the most important to consider is the dynamism and plasticity that defines native, functional protein forms. Figure 3 uses previously reported models of monoclonal antibody microstates (Figure 3A) extracted from individual particle electron tomography (IPET) to illustrate the potential impact of the structural plasticity of proteins on RIM36. The IPET derived models used for this analysis include 120 distinct structural states, and the CCS of each were estimated and plotted at various levels of IM instrument performance (Figure 3B–E). Figure 3 indicates both the estimated diffusion-limited resolution of the IM device (RD) as well as the apparent resolution displayed in the data, which includes apparent conformational broadening effects (RD+C). This analysis reveals that an RD+C of 15, a typical IM resolution value reported for intact antibody ions, completely encompasses the IPET-derived ensemble of native antibody structures. Greater levels of instrument performance reveal increased levels of fine structure, culminating in the resolution of 45% of the original antibody structural ensemble at an RIM value of 600. If similar levels of conformational broadening are applied to the data shown in Figure 2, which currently assumes that each protein analyte adopts a single structural form, then far fewer structures would be resolved in the simulated native proteomics experiment depicted. Currently, it is unknown to what extent the native structural ensembles of proteins and their assemblies can be faithfully transported into the gas phase for IM analysis, or to what degree gas-phase compaction and charging would alter the CCS distributions shown in Figure 3. In addition, prior reports clearly illustrate that RIM values for proteins depend strongly on the solution conditions used to prepare samples37, changes to structure that can occur during the analysis38, as well as the energy imparted to ions during their transport and analysis39,40, further complicating the value of CCSs obtained from such data for the purposes of proteoform identification.
Figure 3.

The Impact of Native Protein Dynamics on IM Resolution. A) An overlay of 120 distinct IPET-derived models of intact antibody structural states first disclosed in reference 36. B-E) Simulated CCS plots for the antibody structures shown in A, projected at the resolution values indicated. Binning was used to simulate diffusion limited resolution (RD), and the spacing of estimated CCS values from IMPACT30 gave rise to effective conformational broadening in the data (RD+C). Gaussian peak shapes are assumed. RD refers directly to the bin dimensions used to provide a lower limit on the base width, so the indicated RD values should be viewed as a lower bound estimate of the expected RD values encoded in the plots shown. RD+C values are measured directly from the plots shown as CCS/ΔCCS (with the latter measured at 50% peak height). The percent resolved (Per. Res.) value shown reports the ratio of the number of resolved features over the total number of structures included in the distribution, reported as a percent. For these values, features resolved at 90% peak height were counted for the estimates shown. Data from reference 36.
Collision Induced Unfolding for Native Proteoform Identification
Despite the challenges indicated above in using CCS data to aid in protein and proteoform identification, many IM methods are under development that may provide an important route toward the discovery of structural proteoforms and their complexes. For example, collision induced unfolding (CIU) techniques have recently gained broad adoption for the separation and evaluation of protein structure microstates that remain challenging or impossible to resolve using high-resolution IM separations alone41. These examples have included those associated with biotherapeutic antibodies, protein kinases, membrane proteins, and protein complexes42–45. In each of these instances, CIU was able to discern subtle differences in protein stability and unfolding pathway adopted by protein ion populations that share the same ground state CCS values. In general, CIU works through the carefully controlled collisional heating of protein ion populations, and by capturing the resulting structural transitions using IM separation41. While most CIU reports focus on examples of protein-ligand binding, an increasing number focus on proteins that differ in sequence or modification state in a manner analogous to the proteoform populations illustrated in Figure 146,47.
The data shown in Figure 4 is taken from one of the reports alluded to above, where CIU data was used to differentiate protein sequence variants that share the same ground state CCS in a manner similar to the proteoform separations required in future native proteomics experiments. Figure 4A displays a series of CIU fingerprints recorded for albumin analogues, originally investigated in an effort to map the level of domain-correlation in their CIU pathways46. While three albumin variants are shown in Figure 4A, a greater number than this was analyzed in the original report, which found that while the CCS values and the centroid voltages of the CIU states remained relatively unchanged between albumin homologues, the activation voltage values that defined the transitions between states, often termed CIU50 values, provided the greatest coefficient of variation between isoforms (Figure 4B). In other words, while the general CIU mechanism remains the same between albumin isoforms, favoring the unfolding of domain 2 at lowest collision energies, followed by the unfolding of domains 3 and 1 at increasingly higher ion temperatures, the energy barriers associated with these transitions differ in a manner dependent upon the albumin sequence under investigation (Figure 4C). The utility of this observation for applications associated with proteoform identification is amplified by the similar masses and sequences shared by the albumin homologues probed in this study, which differed by as little as 14 Da and exhibited as much as 98.5% sequence identity. Subsequent studies have indicated that a single point mutation is sufficient to alter CIU50 values significantly, providing a clear route to the separation of sequence-based proteoforms in native proteomics workflows47. These observations, combined with recent quantitative comparisons of CIU data collected across different instrument geometries, raise the possibility of databasing elements of CIU fingerprint data in an effort to aid proteoform identification in future native proteomics experiments48.
Figure 4.

CIU has the potential to resolve native proteoforms and aid in protein identification. A) CIU screen of homologous serum albumins. Four main conformer families (1–4, highlighted in the bovine sample) are detected throughout. B) Bar plot of variations detected in drift times, centroid voltages, and stabilities of each feature detected for albumin analogues across 8 variants and 3 charge states. Feature-specific stability drove the vast majority of deviations detected in CIU data across sequence variants. C) Unfolding model for the CIU of albumins, where domain 2 (green) unfolds at the lowest energies, followed by domain 3 (blue) and domain 1 (red). This model was constructed based on a range of evidence acquired from chemical probes and domain deleted albumin constructs. Modified with permission from reference 46. Copyright 2017, ACS Publications.
Conclusions and Outlook
Proteomic methods are presently on a trajectory to reveal both the compositional and structural details of cellular protein inventories. Native proteomics, in particular, possess some clear advantages over typical top-down and bottom-up workflows, and is poised to reveal much regarding the organization of the cellular proteome49,50. It is apparent that IM separations will play a varied and significant role in the continual evolution of these technologies driving a revolution in proteomic information over the next decade and beyond. High-resolution IM separations and CCS prediction software are currently providing clear benefits to bottom-up proteomic surveys across all kingdoms of life. IM-MS has played a similarly critical role in the growth of structural MS technologies aimed at intact proteins and complexes, but the value of such CCS data for intact proteoform identifications remains unclear. While the same benefits of IM-MS currently enabling bottom-up proteomics experiments may also be realized for top-down and native proteomics workflows, especially when used in tandem with the plurality of condensed phase separation tools currently under development in support of such workflows51,52, projected levels of sample complexity and conformational IM peak broadening endemic in native proteins conspire to throw such advantages into question for current-generation IM separators.
CIU may provide a solution to many of the current shortcomings of CCS values for applications associated with proteoform identification. While CIU is currently the most prevalent IM methodology in this vein currently employed, there are many other similar approaches utilizing different ion activation or analysis techniques that may prove to be more sensitive tactics for proteoform identification. For example, cyclic IM35 and tandem IM (IM/IM)53 methods are both positioned to give rise to CIU2 type assays, which utilize timed ion selection to perform two rounds of ion activation and IM separation to produce fingerprint data of greater depth and information than is accessible by typical CIU tools. Future efforts by the IM-MS and CIU communities will likely include attempts to standardize and catalog CIU fingerprint data in order to enable the next-generation of native proteomics experiments. These efforts, combined with the continued growth of CIU and CIU2 technologies, which should be initially targeted at a reference set of community-curated proteoform standards54, will undoubtedly lay the foundation for future discoveries with the potential to revolutionize our understanding of cellular biochemistry.
Acknowledgments
IM-MS research focused on native proteomics is supported in the Ruotolo lab by the National Institutes of Health, National Institutes of General Medical Sciences, under R01GM095832-09. The author thanks Daniel Vallejo (Georgia Tech), Gary Ren (LBNL), and Erik Marklund (Uppsala) for their help in providing primary data for the creation of some of the figures shown in this work, and Joseph Eschweiler (Abbvie) for discussions surrounding Figure 3.
References
- (1).Bludau I; Aebersold R Proteomic and Interactomic Insights into the Molecular Basis of Cell Functional Diversity. Nature Reviews Molecular Cell Biology 2020, 21 (6), 327–340. 10.1038/s41580-020-0231-2. [DOI] [PubMed] [Google Scholar]
- (2).Müller JB; Geyer PE; Colaço AR; Treit P. v; Strauss MT; Oroshi M; Doll S; Virreira Winter S; Bader JM; Köhler N; Theis F; Santos A; Mann M The Proteome Landscape of the Kingdoms of Life. Nature 2020, 582 (7813), 592–596. 10.1038/s41586-020-2402-x. [DOI] [PubMed] [Google Scholar]
- (3).Jarzab A; Kurzawa N; Hopf T; Moerch M; Zecha J; Leijten N; Bian Y; Musiol E; Maschberger M; Stoehr G; Becher I; Daly C; Samaras P; Mergner J; Spanier B; Angelov A; Werner T; Bantscheff M; Wilhelm M; Klingenspor M; Lemeer S; Liebl W; Hahne H; Savitski MM; Kuster B Meltome Atlas—Thermal Proteome Stability across the Tree of Life. Nature Methods 2020, 17 (5), 495–503. 10.1038/s41592-020-0801-4. [DOI] [PubMed] [Google Scholar]
- (4).Smith LM; Kelleher NL; Proteomics, =Consortium for Top Down. Proteoform: A Single Term Describing Protein Complexity. Nature methods 2013, 10 (3), 186–187. 10.1038/nmeth.2369. [DOI] [PMC free article] [PubMed] [Google Scholar]
- (5).Aebersold R; Agar JN; Amster IJ; Baker MS; Bertozzi CR; Boja ES; Costello CE; Cravatt BF; Fenselau C; Garcia BA; Ge Y; Gunawardena J; Hendrickson RC; Hergenrother PJ; Huber CG; Ivanov AR; Jensen ON; Jewett MC; Kelleher NL; Kiessling LL; Krogan NJ; Larsen MR; Loo JA; Ogorzalek Loo RR; Lundberg E; MacCoss MJ; Mallick P; Mootha VK; Mrksich M; Muir TW; Patrie SM; Pesavento JJ; Pitteri SJ; Rodriguez H; Saghatelian A; Sandoval W; Schlüter H; Sechi S; Slavoff SA; Smith LM; Snyder MP; Thomas PM; Uhlén M; van Eyk JE; Vidal M; Walt DR; White FM; Williams ER; Wohlschlager T; Wysocki VH; Yates NA; Young NL; Zhang B How Many Human Proteoforms Are There? Nature Chemical Biology 2018, 14 (3), 206–214. 10.1038/nchembio.2576. [DOI] [PMC free article] [PubMed] [Google Scholar]
- (6).Donnelly DP; Rawlins CM; DeHart CJ; Fornelli L; Schachner LF; Lin Z; Lippens JL; Aluri KC; Sarin R; Chen B; Lantz C; Jung W; Johnson KR; Koller A; Wolff JJ; Campuzano IDG; Auclair JR; Ivanov AR; Whitelegge JP; Paša-Tolić L; Chamot-Rooke J; Danis PO; Smith LM; Tsybin YO; Loo JA; Ge Y; Kelleher NL; Agar JN Best Practices and Benchmarks for Intact Protein Analysis for Top-down Mass Spectrometry. Nature Methods 2019, 16 (7), 587–594. 10.1038/s41592-019-0457-0. [DOI] [PMC free article] [PubMed] [Google Scholar]
- (7).Marchione DM; Garcia BA; Wojcik J Proteomic Approaches for Cancer Epigenetics Research. Expert Review of Proteomics 2019, 16 (1), 33–47. 10.1080/14789450.2019.1550363. [DOI] [PMC free article] [PubMed] [Google Scholar]
- (8).Cai W; Tucholski TM; Gregorich ZR; Ge Y Top-down Proteomics: Technology Advancements and Applications to Heart Diseases. Expert Review of Proteomics 2016, 13 (8), 717–730. 10.1080/14789450.2016.1209414. [DOI] [PMC free article] [PubMed] [Google Scholar]
- (9).Robinson C. v; Sali A; Baumeister W The Molecular Sociology of the Cell. Nature 2007, 450 (7172), 973–982. 10.1038/nature06523. [DOI] [PubMed] [Google Scholar]
- (10).Eschweiler JD; Kerr R; Rabuck-Gibbons J; Ruotolo BT Sizing Up Protein–Ligand Complexes: The Rise of Structural Mass Spectrometry Approaches in the Pharmaceutical Sciences. Annual Review of Analytical Chemistry 2017, 10 (1), 25–44. 10.1146/annurev-anchem-061516-045414. [DOI] [PubMed] [Google Scholar]
- (11).Robinson C. v. From Molecular Chaperones to Membrane Motors: Through the Lens of a Mass Spectrometrist. Biochemical Society transactions 2017, 45 (1), 251–260. 10.1042/BST20160395. [DOI] [PMC free article] [PubMed] [Google Scholar]
- (12).Hyung S-J; Ruotolo BT Integrating Mass Spectrometry of Intact Protein Complexes into Structural Proteomics. PROTEOMICS 2012, 12 (10), 1547–1564. 10.1002/pmic.201100520. [DOI] [PMC free article] [PubMed] [Google Scholar]
- (13).Gabelica V; Shvartsburg AA; Afonso C; Barran P; Benesch JLP; Bleiholder C; Bowers MT; Bilbao A; Bush MF; Campbell JL; Campuzano IDG; Causon T; Clowers BH; Creaser CS; de Pauw E; Far J; Fernandez-Lima F; Fjeldsted JC; Giles K; Groessl M; Hogan CJ Jr; Hann S; Kim HI; Kurulugama RT; May JC; McLean JA; Pagel K; Richardson K; Ridgeway ME; Rosu F; Sobott F; Thalassinos K; Valentine SJ; Wyttenbach T Recommendations for Reporting Ion Mobility Mass Spectrometry Measurements. Mass Spectrometry Reviews 2019, 38 (3), 291–320. 10.1002/mas.21585. [DOI] [PMC free article] [PubMed] [Google Scholar]
- (14).Meier F; Beck S; Grassl N; Lubeck M; Park MA; Raether O; Mann M Parallel Accumulation–Serial Fragmentation (PASEF): Multiplying Sequencing Speed and Sensitivity by Synchronized Scans in a Trapped Ion Mobility Device. Journal of Proteome Research 2015, 14 (12), 5378–5387. 10.1021/acs.jproteome.5b00932. [DOI] [PubMed] [Google Scholar]
- (15).Stow SM; Causon TJ; Zheng X; Kurulugama RT; Mairinger T; May JC; Rennie EE; Baker ES; Smith RD; McLean JA; Hann S; Fjeldsted JC An Interlaboratory Evaluation of Drift Tube Ion Mobility–Mass Spectrometry Collision Cross Section Measurements. Analytical Chemistry 2017, 89 (17), 9048–9055. 10.1021/acs.analchem.7b01729. [DOI] [PMC free article] [PubMed] [Google Scholar]
- (16).Giles K; Ujma J; Wildgoose J; Pringle S; Richardson K; Langridge D; Green M A Cyclic Ion Mobility-Mass Spectrometry System. Analytical Chemistry 2019, 91 (13), 8564–8573. 10.1021/acs.analchem.9b01838. [DOI] [PubMed] [Google Scholar]
- (17).Garimella SVB; Nagy G; Ibrahim YM; Smith RD Opening New Paths for Biological Applications of Ion Mobility - Mass Spectrometry Using Structures for Lossless Ion Manipulations. TrAC Trends in Analytical Chemistry 2019, 116, 300–307. 10.1016/j.trac.2019.04.021. [DOI] [PMC free article] [PubMed] [Google Scholar]
- (18).Ridgeway ME; Bleiholder C; Mann M; Park MA Trends in Trapped Ion Mobility – Mass Spectrometry Instrumentation. TrAC Trends in Analytical Chemistry 2019, 116, 324–331. 10.1016/j.trac.2019.03.030. [DOI] [Google Scholar]
- (19).Picache JA; Rose BS; Balinski A; Leaptrot KL; Sherrod SD; May JC; McLean JA Collision Cross Section Compendium to Annotate and Predict Multi-Omic Compound Identities. Chemical Science 2019, 10 (4), 983–993. 10.1039/C8SC04396E. [DOI] [PMC free article] [PubMed] [Google Scholar]
- (20).Meier F; Köhler ND; Brunner A-D; Wanka J-MH; Voytik E; Strauss MT; Theis FJ; Mann M Deep Learning the Collisional Cross Sections of the Peptide Universe from a Million Experimental Values. Nature Communications 2021, 12 (1), 1185. 10.1038/s41467-021-21352-8. [DOI] [PMC free article] [PubMed] [Google Scholar]
- (21).Haynes SE; Polasky DA; Dixit SM; Majmudar JD; Neeson K; Ruotolo BT; Martin BR Variable-Velocity Traveling-Wave Ion Mobility Separation Enhancing Peak Capacity for Data-Independent Acquisition Proteomics. Analytical Chemistry 2017, 89 (11), 5669–5672. 10.1021/acs.analchem.7b00112. [DOI] [PMC free article] [PubMed] [Google Scholar]
- (22).Bohrer BC; Merenbloom SI; Koeniger SL; Hilderbrand AE; Clemmer DE Biomolecule Analysis by Ion Mobility Spectrometry. Annual Review of Analytical Chemistry 2008, 1 (1), 293–327. 10.1146/annurev.anchem.1.031207.113001. [DOI] [PMC free article] [PubMed] [Google Scholar]
- (23).Wyttenbach T; Pierson NA; Clemmer DE; Bowers MT Ion Mobility Analysis of Molecular Dynamics. Annual Review of Physical Chemistry 2014, 65 (1), 175–196. 10.1146/annurev-physchem-040513-103644. [DOI] [PubMed] [Google Scholar]
- (24).Niu S; Rabuck JN; Ruotolo BT Ion Mobility-Mass Spectrometry of Intact Protein–Ligand Complexes for Pharmaceutical Drug Discovery and Development. Current Opinion in Chemical Biology 2013, 17 (5), 809–817. 10.1016/j.cbpa.2013.06.019. [DOI] [PubMed] [Google Scholar]
- (25).Landreh M; Sahin C; Gault J; Sadeghi S; Drum CL; Uzdavinys P; Drew D; Allison TM; Degiacomi MT; Marklund EG Predicting the Shapes of Protein Complexes through Collision Cross Section Measurements and Database Searches. Analytical Chemistry 2020, 92 (18), 12297–12303. 10.1021/acs.analchem.0c01940. [DOI] [PubMed] [Google Scholar]
- (26).Eschweiler JD; Frank AT; Ruotolo BT Coming to Grips with Ambiguity: Ion Mobility-Mass Spectrometry for Protein Quaternary Structure Assignment. Journal of the American Society for Mass Spectrometry 2017, 28 (10), 1991–2000. 10.1007/s13361-017-1757-1. [DOI] [PMC free article] [PubMed] [Google Scholar]
- (27).Allison TM; Barran P; Cianférani S; Degiacomi MT; Gabelica V; Grandori R; Marklund EG; Menneteau T; Migas LG; Politis A; Sharon M; Sobott F; Thalassinos K; Benesch JLP Computational Strategies and Challenges for Using Native Ion Mobility Mass Spectrometry in Biophysics and Structural Biology. Analytical Chemistry 2020, 92 (16), 10872–10880. 10.1021/acs.analchem.9b05791. [DOI] [PubMed] [Google Scholar]
- (28).Burley SK; Bhikadiya C; Bi C; Bittrich S; Chen L; Crichlow G. v; Christie CH; Dalenberg K; di Costanzo L; Duarte JM; Dutta S; Feng Z; Ganesan S; Goodsell DS; Ghosh S; Green RK; Guranović V; Guzenko D; Hudson BP; Lawson CL; Liang Y; Lowe R; Namkoong H; Peisach E; Persikova I; Randle C; Rose A; Rose Y; Sali A; Segura J; Sekharan M; Shao C; Tao Y-P; Voigt M; Westbrook JD; Young JY; Zardecki C; Zhuravleva M RCSB Protein Data Bank: Powerful New Tools for Exploring 3D Structures of Biological Macromolecules for Basic and Applied Research and Education in Fundamental Biology, Biomedicine, Biotechnology, Bioengineering and Energy Sciences. Nucleic Acids Research 2021, 49 (D1), D437–D451. 10.1093/nar/gkaa1038. [DOI] [PMC free article] [PubMed] [Google Scholar]
- (29).Rolland AD; Prell JS Computational Insights into Compaction of Gas-Phase Protein and Protein Complex Ions in Native Ion Mobility-Mass Spectrometry. TrAC Trends in Analytical Chemistry 2019, 116, 282–291. 10.1016/j.trac.2019.04.023. [DOI] [PMC free article] [PubMed] [Google Scholar]
- (30).Marklund EG; Degiacomi MT; Robinson CV; Baldwin AJ; Benesch JLP Collision Cross Sections for Structural Proteomics. Structure 2015, 23 (4), 791–799. 10.1016/j.str.2015.02.010. [DOI] [PubMed] [Google Scholar]
- (31).Jeanne Dit Fouque K; Garabedian A; Leng F; Tse-Dinh Y-C; Ridgeway ME; Park MA; Fernandez-Lima F Trapped Ion Mobility Spectrometry of Native Macromolecular Assemblies. Analytical Chemistry 2021, 93 (5), 2933–2941. 10.1021/acs.analchem.0c04556. [DOI] [PMC free article] [PubMed] [Google Scholar]
- (32).Ruotolo BT; Gillig KJ; Stone EG; Russell DH Peak Capacity of Ion Mobility Mass Spectrometry:: Separation of Peptides in Helium Buffer Gas. Journal of Chromatography B 2002, 782 (1), 385–392. 10.1016/S1570-0232(02)00566-4. [DOI] [PubMed] [Google Scholar]
- (33).Ruotolo BT; McLean JA; Gillig KJ; Russell DH Peak Capacity of Ion Mobility Mass Spectrometry: The Utility of Varying Drift Gas Polarizability for the Separation of Tryptic Peptides. Journal of Mass Spectrometry 2004, 39 (4), 361–367. 10.1002/jms.592. [DOI] [PubMed] [Google Scholar]
- (34).Lössl P; Snijder J; Heck AJR Boundaries of Mass Resolution in Native Mass Spectrometry. Journal of the American Society for Mass Spectrometry 2014, 25 (6), 906–917. 10.1007/s13361-014-0874-3. [DOI] [PubMed] [Google Scholar]
- (35).Eldrid C; Ujma J; Kalfas S; Tomczyk N; Giles K; Morris M; Thalassinos K Gas Phase Stability of Protein Ions in a Cyclic Ion Mobility Spectrometry Traveling Wave Device. Analytical Chemistry 2019, 91 (12), 7554–7561. 10.1021/acs.analchem.8b05641. [DOI] [PMC free article] [PubMed] [Google Scholar]
- (36).Zhang X; Zhang L; Tong H; Peng B; Rames MJ; Zhang S; Ren G 3D Structural Fluctuation of IgG1 Antibody Revealed by Individual Particle Electron Tomography. Scientific Reports 2015, 5 (1), 9803. 10.1038/srep09803. [DOI] [PMC free article] [PubMed] [Google Scholar]
- (37).Han L; Ruotolo BT Hofmeister Salts Recover a Misfolded Multiprotein Complex for Subsequent Structural Measurements in the Gas Phase. Angewandte Chemie International Edition 2013, 52 (32), 8329–8332. 10.1002/anie.201301893. [DOI] [PMC free article] [PubMed] [Google Scholar]
- (38).Allen SJ; Eaton RM; Bush MF Structural Dynamics of Native-Like Ions in the Gas Phase: Results from Tandem Ion Mobility of Cytochrome c. Analytical Chemistry 2017, 89 (14), 7527–7534. 10.1021/acs.analchem.7b01234. [DOI] [PubMed] [Google Scholar]
- (39).Shelimov KB; Clemmer DE; Hudgins RR; Jarrold MF Protein Structure in Vacuo: Gas-Phase Conformations of BPTI and Cytochrome c. Journal of the American Chemical Society 1997, 119 (9), 2240–2248. 10.1021/ja9619059. [DOI] [Google Scholar]
- (40).Allen SJ; Giles K; Gilbert T; Bush MF Ion Mobility Mass Spectrometry of Peptide, Protein, and Protein Complex Ions Using a Radio-Frequency Confining Drift Cell. Analyst 2016, 141 (3), 884–891. 10.1039/C5AN02107C. [DOI] [PubMed] [Google Scholar]
- (41).Dixit SM; Polasky DA; Ruotolo BT Collision Induced Unfolding of Isolated Proteins in the Gas Phase: Past, Present, and Future. Current Opinion in Chemical Biology 2018, 42, 93–100. 10.1016/j.cbpa.2017.11.010. [DOI] [PMC free article] [PubMed] [Google Scholar]
- (42).Watanabe Y; Vasiljevic S; Allen JD; Seabright GE; Duyvesteyn HME; Doores KJ; Crispin M; Struwe WB Signature of Antibody Domain Exchange by Native Mass Spectrometry and Collision-Induced Unfolding. Analytical Chemistry 2018, 90 (12), 7325–7331. 10.1021/acs.analchem.8b00573. [DOI] [PMC free article] [PubMed] [Google Scholar]
- (43).Wagner ND; Clemmer DE; Russell DH ESI-IM-MS and Collision-Induced Unfolding That Provide Insight into the Linkage-Dependent Interfacial Interactions of Covalently Linked Diubiquitin. Analytical Chemistry 2017, 89 (18), 10094–10103. 10.1021/acs.analchem.7b02932. [DOI] [PubMed] [Google Scholar]
- (44).Liu Y; Cong X; Liu W; Laganowsky A Characterization of Membrane Protein–Lipid Interactions by Mass Spectrometry Ion Mobility Mass Spectrometry. J. Am. Soc. Mass Spectrom 2017, 28, 579–586. 10.1007/s13361-016-1555-1. [DOI] [PubMed] [Google Scholar]
- (45).Rabuck-Gibbons JN; Keating JE; Ruotolo BT Collision Induced Unfolding and Dissociation Differentiates ATP-Competitive from Allosteric Protein Tyrosine Kinase Inhibitors. International Journal of Mass Spectrometry 2018, 427, 151–156. 10.1016/j.ijms.2017.12.002. [DOI] [Google Scholar]
- (46).Eschweiler JD; Martini RM; Ruotolo BT Chemical Probes and Engineered Constructs Reveal a Detailed Unfolding Mechanism for a Solvent-Free Multidomain Protein. Journal of the American Chemical Society 2017, 139 (1), 534–540. 10.1021/jacs.6b11678. [DOI] [PMC free article] [PubMed] [Google Scholar]
- (47).Fantin SM; Parson KF; Yadav P; Juliano B; Li GC; Sanders CR; Ohi MD; Ruotolo BT Ion Mobility–Mass Spectrometry Reveals the Role of Peripheral Myelin Protein Dimers in Peripheral Neuropathy. Proceedings of the National Academy of Sciences 2021, 118 (17), e2015331118. 10.1073/pnas.2015331118. [DOI] [PMC free article] [PubMed] [Google Scholar]
- (48).Gadkari V. v.; Ramírez CR; Vallejo DD; Kurulugama RT; Fjeldsted JC; Ruotolo BT Enhanced Collision Induced Unfolding and Electron Capture Dissociation of Native-like Protein Ions. Analytical Chemistry 2020, 92 (23), 15489–15496. 10.1021/acs.analchem.0c03372. [DOI] [PMC free article] [PubMed] [Google Scholar]
- (49).Lermyte F; Tsybin YO; O’Connor PB; Loo JA Top or Middle? Up or Down? Toward a Standard Lexicon for Protein Top-Down and Allied Mass Spectrometry Approaches. Journal of the American Society for Mass Spectrometry 2019, 30 (7), 1149–1157. 10.1007/s13361-019-02201-x. [DOI] [PMC free article] [PubMed] [Google Scholar]
- (50).Zhou M; Lantz C; Brown KA; Ge Y; Paša-Tolić L; Loo JA; Lermyte F Higher-Order Structural Characterisation of Native Proteins and Complexes by Top-down Mass Spectrometry. Chemical Science 2020, 11 (48), 12918–12936. 10.1039/D0SC04392C. [DOI] [PMC free article] [PubMed] [Google Scholar]
- (51).Skinner OS; do Vale LHF; Catherman AD; Havugimana PC; de Sousa M. v; Compton PD; Kelleher NL Native GELFrEE: A New Separation Technique for Biomolecular Assemblies. ANALYTICAL CHEMISTRY 2015, 87 (5), 3032–3038. 10.1021/ac504678d. [DOI] [PubMed] [Google Scholar]
- (52).Chen BF; Peng Y; Valeja SG; Xiu LC; Alpert AJ; Ge Y Online Hydrophobic Interaction Chromatography-Mass Spectrometry for Top-Down Proteomics. ANALYTICAL CHEMISTRY 2016, 88 (3), 1885–1891. 10.1021/acs.analchem.5b04285. [DOI] [PMC free article] [PubMed] [Google Scholar]
- (53).Koeniger SL; Merenbloom SI; Valentine SJ; Jarrold MF; Udseth HR; Smith RD; Clemmer DE An IMS−IMS Analogue of MS−MS. Analytical Chemistry 2006, 78 (12), 4161–4174. 10.1021/ac051060w. [DOI] [PubMed] [Google Scholar]
- (54).Schachner LF; Ives AN; McGee JP; Melani RD; Kafader JO; Compton PD; Patrie SM; Kelleher NL Standard Proteoforms and Their Complexes for Native Mass Spectrometry. Journal of the American Society for Mass Spectrometry 2019, 30 (7), 1190–1198. 10.1007/s13361-019-02191-w. [DOI] [PMC free article] [PubMed] [Google Scholar]