Abstract
Objective
Computer-aided diagnosis using deep learning algorithms has been initially applied in the field of mammography, but there is no large-scale clinical application.
Methods
This study proposed to develop and verify an artificial intelligence model based on mammography. Firstly, mammograms retrospectively collected from six centers were randomized to a training dataset and a validation dataset for establishing the model. Secondly, the model was tested by comparing 12 radiologists’ performance with and without it. Finally, prospectively enrolled women with mammograms from six centers were diagnosed by radiologists with the model. The detection and diagnostic capabilities were evaluated using the free-response receiver operating characteristic (FROC) curve and ROC curve.
Results
The sensitivity of model for detecting lesions after matching was 0.908 for false positive rate of 0.25 in unilateral images. The area under ROC curve (AUC) to distinguish the benign lesions from malignant lesions was 0.855 [95% confidence interval (95% CI): 0.830, 0.880]. The performance of 12 radiologists with the model was higher than that of radiologists alone (AUC: 0.852 vs. 0.805, P=0.005). The mean reading time of with the model was shorter than that of reading alone (80.18 s vs. 62.28 s, P=0.032). In prospective application, the sensitivity of detection reached 0.887 at false positive rate of 0.25; the AUC of radiologists with the model was 0.983 (95% CI: 0.978, 0.988), with sensitivity, specificity, positive predictive value (PPV), and negative predictive value (NPV) of 94.36%, 98.07%, 87.76%, and 99.09%, respectively.
Conclusions
The artificial intelligence model exhibits high accuracy for detecting and diagnosing breast lesions, improves diagnostic accuracy and saves time.
Keywords: Breast cancer, mammography, deep learning, artificial intelligence
Introduction
Breast cancer is the most common malignant tumor in women (1,2), and the leading cause of cancer death in women worldwide. Early diagnosis can improve the 5-year survival rate of breast cancer patients from 25% to 99% (3). Several imaging methods are used to identify suspicious malignant breast lesions, while mammography is the only screening method that has been proved to reduce the mortality of breast cancer (4-6), which can reduce the risk of breast cancer death up to 40% (7,8).
Asian women’s mammary glands are denser, reducing the sensitivity of mammography. The large number of breast cancer screening population results in heavy mammography load, and uneven distribution of breast specialists makes difference in the level of mammography diagnosis. A number of studies have pointed out that about 75% of breast biopsies caused by suspicious mammography results are finally confirmed as benign changes (9). The increase of unnecessary pathological biopsy leads to the waste of medical resources and further aggravates the shortage of medical resources. Therefore, it is highly essential to effectively and accurately detect breast lesions (10).
Computer-aided detection (CAD) uses computerized algorithms to identify suspicious regions of interest (ROIs) on imaging studies. It can assist radiologists as a second reader in detecting early breast cancer in an efficient way, especially on screening mammograms (11). Since CAD was proved to improve the detection rate of cancer in 1998, it has been extensively applied thereafter for screening different types of cancer (12). In spite of improving detection rate, CAD increases false positive rate and true positive rate (13).
In recent years, deep learning (DL), especially convolution neural network (CNN), has remarkably attracted scholars’ attention for detection and classification of medical images (14,15). Numerous machine learning models based on artificial intelligence (AI) have been successfully applied in imaging diagnosis and efficacy evaluation of breast, liver, and rectum (16-20). Computer-aided models for mammographic breast cancer diagnosis have been proposed (21,22), and studies have shown that DL-based CAD may assist radiologists to improve diagnostic efficiency and reduce their work load (23-25). However, there is no prospective large-scale clinical study confirming the clinical practicability of DL-based CAD.
Therefore, the main purpose of the present study was to establish an AI assisted diagnosis model based on DL method, to evaluate the effectiveness of the model for aiding doctors to obtain better accuracy and less working time, and to finally validate it in real world practice.
Materials and methods
Study design and participants
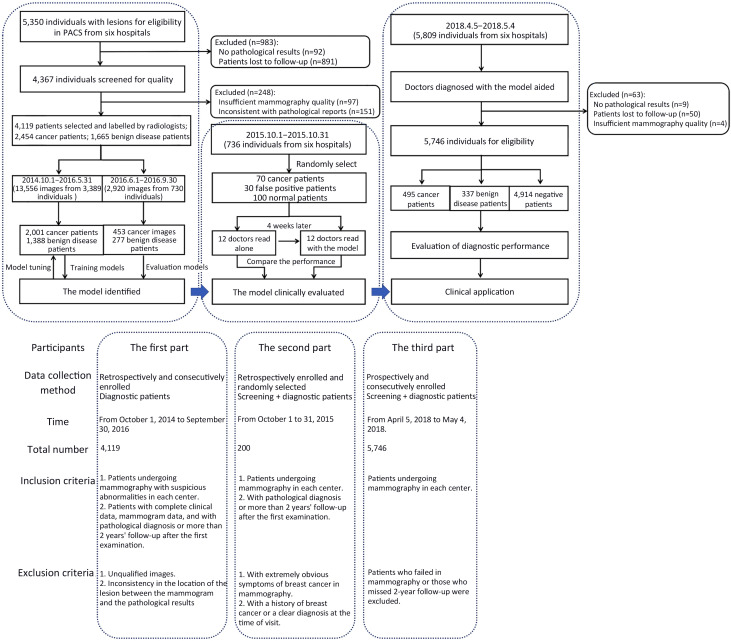
This is a multicenter study, including both retrospective design and prospective design. The study was in accordance with the precepts established by the Helsinki Declaration, and the study protocol was approved by the Ethics Committee of Peking University Cancer Hospital (2018KT47). The informed consent was waived for the retrospective part, and obtained from all participants for the prospective part (Reg. No. NCT03708978). Web version on PubMed Central were referred for additional files. Our study consisted of three parts, the first part was the retrospective construction of AI system and internal verification. The second part tested whether the diagnosis efficiency of doctors with AI system assistance is higher than that of doctors alone. The third part prospectively verified the effect of the system in multicenter clinical practice (Figure 1 ).
Figure 1.
Workflow diagram for development and application of the model. PACS, picture archiving and communication system.
Participants of the first part
We retrospectively enrolled patients who were admitted to Peking University Cancer Hospital for screening clinical symptoms from October 1, 2014 to September 30, 2016. Figure 1 shows the study flowchart. Supplementary Table S1 shows the study sites and patients enrolled in this part. The inclusion criteria were patients with complete clinical data, mammogram data, and with pathological diagnosis or more than 2 years’ follow-up after the first examination. The exclusion criteria included unqualified images required for the segmentation and inconsistency in the location of lesions between mammograms and pathological results.
Participants of the second part
To determine the effectiveness of the model for improving the accuracy of diagnosis, we retrospectively collected mammograms from six centers (A, Peking University Cancer Hospital; B, Shunyi Women’s & Children’s Health Hospital of Beijing Children’s Hospital; C, Beijing Daxing District Hospital; D, Beijing Chaoyang Maternal and Child Health Center; E, Shunyi District Hospital; F, Beijing Shijingshan Hospital) from October 1 to 31, 2015, and conducted an evaluation of the developed diagnostic system with participation of 12 radiologists.
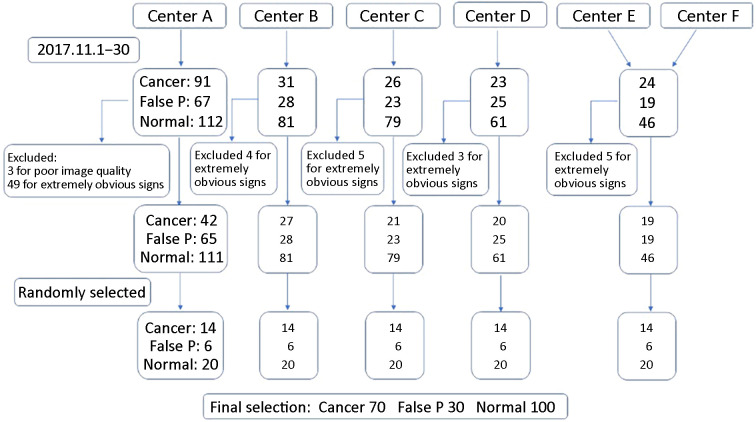
Supplementary Figure S1 illustrates the process of collection of mammography data and participants’ selection. A step-by-step procedure for estimating power and sample size was used which was proposed by Hilliset al. (26) for planned multi-reader receiver operating characteristic (ROC) studies. For 12 evaluators, in which the study efficacy was not less than 0.80, an area under the curve (AUC) difference of 0.05 required 200 mammograms (70 pathologically confirmed malignant cases, 30 pathologically or follow-up confirmed false positive cases, and 100 negative cases).
Figure S1.
Selection of 200 patients. Center A, Peking University Cancer Hospital; Center B, Shunyi Women’s & Children’s Hospital of Beijing Children’s Hospital; Center C, Beijing Daxing District People’s Hospital; Center D, Beijing Chaoyang Maternal and Child Health Center; Center E, Shunyi District Hospital; Center F, Beijing Shijingshan Hospital; false P, false positive.
To ensure adequate mammography to determine the final sample size, we collected at least 14 cancer patients, 6 false positive patients, and 20 negative patients in each center (data collected from centers E and F were combined due to the small number of cases in those centers). The inclusion and exclusion criteria are shown in Figure 1 .
To ensure image quality, all cases in this part were reviewed by three radiologists with more than 25 years of experience in mammography. Each case was available for pathology or follow-up. After review, 3 patients with unqualified image quality and 66 patients with very obvious symptoms of breast cancer were excluded.
Participants of the third part
To further investigate the clinical application of the model, we prospectively applied it in six centers. Patients undergoing mammography in each center were prospectively and consecutively enrolled from April 5, 2018 to May 4, 2018. The inclusion and exclusion criteria are shown in Figure 1 . There were no specific exclusion criteria in terms of demographic or clinical characteristics for participants without lesions.
Quality control of mammogram images
All mammogram images were stored using a picture archiving and communication system (PACS) in digital imaging and communications in medicine (DICOM) format. Two standard views were the craniocaudal (CC) and the mediolateral oblique (MLO). To ensure image quality, all cases were reviewed by 3 radiologists with more than 25 years of experience in mammography.
All pathological results were obtained from the pathology report and reviewed by an experienced pathologist. Pathological tissues were obtained by hollow needle biopsy or surgery and were stained with hematoxylin and eosin (H&E).
Radiologist’s annotations
Six certified and experienced radiologists, each with an average experience of at least 5 (range, 5−10) years and read an average of 250,000 mammograms, annotated the images. Six radiologists were trained to read 800 mammograms and began to draw ROI respectively. The delineation principle was as follows: 1) manual delineation along the edge of the lesion; 2) inclusion of all suspicious parts of the tumor in the sketch; 3) the edge included burrs as far as possible; and 4) when the label was generated, the characteristics of the lesion were marked according to the Breast Imaging-Reporting and Data System (BI-RADS) (2013 edition), including lesion type (mass, calcification, structural distortion, asymmetry), distribution characteristics, and pathological or follow-up results. In case of doubtfulness, a radiologist will consult with other three experienced radiologists to make a correct decision after discussion.
Algorithm development
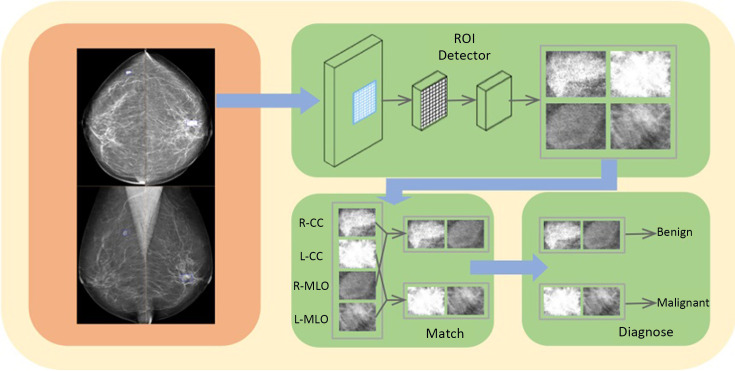
Following the successful application of DL, we established the model ( http://mgshow.yizhun-ai.com/), containing various modules to carry out automatic analysis of mammograms. It contains three deep neural models: lesion detection module, lesion matching module, and malignant degree assessment module, which constitute a complete system for breast lesion analysis (Supplementary Figure S2 ). The overview of our system is illustrated in Figure 2 .
Figure S2.
Diagnostic module of the algorithm. CC, craniocaudal; MLO, mediolateral oblique.
Figure 2.
Pipeline of the model. ROI, regions of interest; CC, craniocaudal; MLO, mediolateral oblique.
Lesion detection module
We use Faster R-CNN (27) to detect suspicious lesions in all of the images of one patient. Faster R-CNN is one of the state-of-the-art methods in the area of object detection. Faster R-CNN contains two stages, where the first stage generates box proposals and the second stage refines the box localization and predicts the class of each object. We use ResNet-50 (28) as the backbone network and adopt feature pyramid network to enhance the detector performance of small lesions.
Since the huge size of breast images and the existence of background areas with no information, we first pre-process the mammogram images before sending them to the neural networks. We crop the foreground area of each image by a simple thresholding method and then resize the images to keep spacing =0.15 mm. As shown in Figure 2 , the detector takes four images of different views as inputs, and outputs bounding boxes and lesion classes (i.e., mass and calcification) for detected suspicious lesions. In our problem, mass and calcification can appear at the same location, so we use Sigmoid function to generate the objectivity score for each class instead of SoftMax. This modification allows an object to be identified as both mass and calcification. In practice, if a predicted box has high confidence in both mass and calcification, we will call this lesion a mass with calcification.
Lesion matching module
The matching module is introduced to indicate whether a pair of detected candidates are from different views of the same lesion. In the clinical practice of mammogram examination, it is essential to combine the information of multiple views (MLO and CC). At most of the time, a lesion could be recognized in both MLO and CC views. If a mass can be only found in one view, radiologists may consider that it is caused by overlapping glands, but not lesions. According to this principle, it is natural to perform false positive reduction by matching lesions of MLO and CC view in the CAD system.
In our model, we use a neural model to conduct lesion matching. The matching model is after the detector and takes features of the detected proposals of suspicious lesions as input. We use vertex coordinates, sizes of the proposals, probabilities of each class, and the depth of proposals in the gland as input features. In the matching process, the model should use the information of all proposals to perform matching, so that we use an attention model (29) to predict the relationship of all lesion pairs. The input of the model is the concatenated features mentioned above, and it generates the probability of a real lesion pair for all possible pairs. The lesions with low probabilities will be removed during the output process.
Malignant degree assessment module
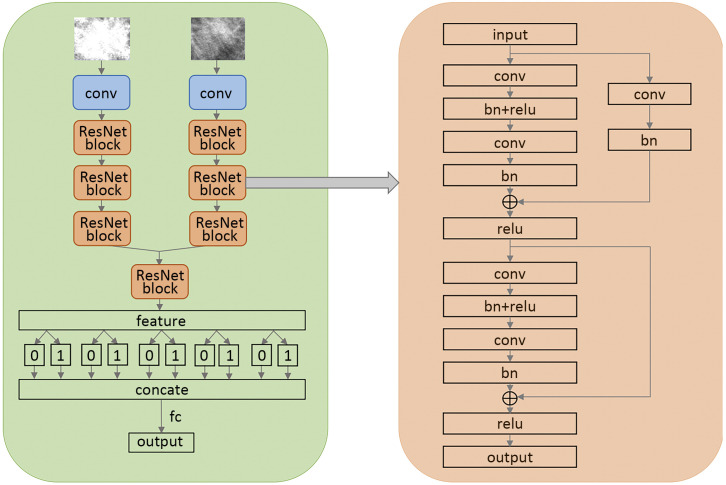
We use a CNN based on ResNet (30) to estimate the malignant degrees of lesions. In our model, we treat the malignant degree assessment problem as an ordinal regression problem (28). Ordinal regression algorithms are to solve multi-class classification problem where the labels have strong ordinal relationships. In our problem, BI-RADS can represent a lesion’s degree of malignancy. BI-RADS sometimes provides more information than pathological results, since pathological results only tell us whether a lesion is malignant, but BI-RADS can tell us how malignant a lesion’s degree of malignancy. Therefore, we use BI-RADS to train our model. Experimentally, with large amounts of BI-RADS annotations confirmed by experts, we find the performance of our system is better than using the pathological results as labels, even we evaluate the system according to the pathological results.
Following some previous studies (28), we use integration of several binary classification problems to solve the ordinal regression problem. We choose ResNet-18 as our backbone, which is one of the state-of-the-art classification models in the area of DL (30). In our data, there are 8 labels (“false positive”, “BI-RADS 2”, “BI-RADS 3”, “BI-RADS 4A”, “BI-RADS 4B”, “BI-RADS 4C”, “BI-RADS 5” and “BI-RADS 6”). Since there are few lesions which are “BI-RADS 2” or “BI-RADS 6” in our training data, we treat “BI-RADS 2” the same as false positive candidates and merge “BI-RADS 6” and “BI-RADS 5”. Therefore, our model outputs 5 logits for each lesion, the first logit predicts whether the BI-RADS of a lesion is larger than “BI-RADS 3”, the second logit predicts whether the BI-RADS of a lesion is larger than “BI-RADS 4A” and so on. Since we hope the network can output the possibility that a lesion is malignant, we add a fully connected layer to process the result of ordinal regression, which can be seen as a simple linear combination.
Development details
To train the models, the collected mammograms were chronologically divided into training dataset (about 80%) and validation dataset (about 20%). We trained the models during the first part of our study and further evaluated the established system in the next two parts.
We implemented all the models using PyTorch DL framework. In the lesion detection module, we used Adam optimizer with the learning rate of 3e−4 to train the detector and the batch size was 8. The training objective function was following the same with original Faster R-CNN (27). In the lesion match module, we adopt Focal Loss to train the lesion pair classification task since the classification objects were highly imbalanced. The parameters in Focal Loss were set to alpha=0.5 and gamma=2.0. Adam optimizer with learning rate 1e−3 and batch size 32 was utilized to train the model. In the malignant degree assessment module, the ResNet-18 was selected as the backbone network. We used Adam optimizer with learning rate 1e−3 and batch size 32 to train the network. The loss function of each binary classification output was Cross Entropy Loss.
The online demo is shown in Supplementary materials . To train the models, the collected mammograms were chronologically divided into training dataset (about 80%) and validation dataset (about 20%). We trained the models during the first part of our study and further evaluated the established system in the next two parts.
Auxiliary efficacy for models
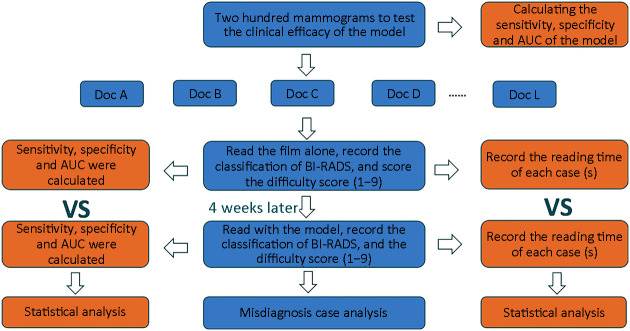
We evaluated the effectiveness of the model in detecting and diagnosing mammograms by monitoring the performance of 12 radiologists under different reading conditions (Supplementary Figure S3 ).
Figure S3.
Flowchart of cross testing between the model and 12 doctors. AUC, area under the curve; BI-RADS, Breast Imaging-Reporting and Data System.
The 12 radiologists had an average of 9.5 (range, 3−25) years of experience with the certificate of Mammography Quality Standards Act, and had read more than 5,000 mammograms per year over the past two years.
The 12 radiologists were blinded of any information about the patients, including prior imaging and histopathological reports. The assessment consisted of two stages. The interval between the two assessments should be at least 4 weeks. Each radiologist received separate training prior to the first evaluation. The purpose of the training was to familiarize radiologists with the evaluation criteria and functions and operations of the AI-aided diagnosis model. Besides, 12 radiologists were informed that the rate of malignancy in the assessed dataset was higher than clinical practice.
For each case, radiologists employed BI-RADS classification (range, 1−5), and labeled suspicious lesions as benign or malignant, and normal patients without lesions were taken as negative into account. Radiologists scored each case on a difficulty scale of 1−9 (9 represents the highest difficulty scale).
The evaluation was undertaken in an in-house developed workstation, using a 12-MP Mammography Display System that was calibrated to the medical grayscale standard display function of digital imaging. Radiologists used the AI system to read the film, which can freely adjust the window width and window level, and can scale and shift. Ambient lighting was set to about 45 lx.
Prospective clinical applications of models
Prior to the application of the model in each center, nineteen radiologists in the six centers had participated in the training of the model, in which 200 cases were trained. The median experience in mammography diagnosis was 9.5 (range, 5−26) years, and the mean number of mammograms read each year during the past 2 years was approximately 6,500 (range, 1,400−13,000). The purpose of the training was to make all the radiologists proficient in the operating system and application interface, so that they could be used freely in the routine clinical mammography.
The mammography was conducted by radiologists with DL model at six centers. The model could automatically identify suspicious lesions and percentage of malignancy for reference, and automatically generate structured reports as well. The reading time of each case was automatically recorded by the system. Pathological and follow-up results were taken as the gold standard for the diagnosis of benign and malignant lesions, and three radiologists with more than 20 years of experience were taken as the gold standard for detection of lesions, so as to observe the clinical effect of DL model.
Statistical analysis
Clopper-Pearson method was applied to calculate the accuracy, sensitivity, specificity, positive predictive value (PPV), and negative predictive value (NPV) of the model which was used to detect and diagnose mammographic lesions (Supplementary materials ). We used free-response receiver operating characteristic (FROC) curve to indicate the detection ability of the model and further analyze its diagnostic ability in different types of lesions. The ROC curve was plotted, and the AUC was used to evaluate the diagnostic performance of the model. All statistical analyses were bilateral with significance level of 0.05. Statistical analyses were performed using R software (Version 3.5.1; R Foundation for Statistical Computing, Vienna, Austria) programming language.
The end point was to compare the AUC, sensitivity, specificity, and reading time of 12 radiologists who read independently and who read with the model. P<0.05 indicated a statistically significant difference between the two reading conditions. In the present study, if a radiologist did not mark the malignant lesion within the true quadrant of the lesion, the case was modified to be negative by the reader.
The reading time of each case was automatically measured by the workstation software. The paired sample t-test or Wilcoxon rank-sum test were used to compare the average reading time under two different reading conditions (reading alone and reading with the model), and the relationship between reading time and difficulty score was further analyzed. For this analysis, the outlier (defined as more than 1.5 times the standard deviation of the data) was removed.
Outcomes and follow-up
Definition of malignant lesions: within 2 years from the time the patient came to the hospital for the first mammogram, the pathological diagnosis of the same lesion as malignant was defined as malignant lesion. Definition of benign lesions: 1) pathological diagnosis of the same lesion within 2 years was benign; and 2) patients were followed up for more than 2 years, and mammography more than 2 years after the first mammography examination indicated benign, without pathological diagnosis. Follow-up plan is in Supplementary materials .
Results
Patients’ baseline data
The flowchart of the study design and data collection is shown in Figure 1 .
The first part: between October 1, 2014 and September 30, 2016, 5,350 participants with suspected lesions from PACS of six centers were enrolled, of whom 891 were excluded due to no follow-up data or follow-up for less than two years, and 92 were excluded because their pathological results were not obtained. Of the remaining 4,367 participants assessed for quality control, 97 (2.22%) were excluded due to poor quality of mammography and 151 (3.46%) were excluded due to inconsistency in anatomical location and pathological report. Eventually, 16,476 images of 4,119 participants were involved in the analysis, including 2,454 patients with malignant lesions and 1,665 patients with benign lesions. Among them, pathological results of 3,186 patients were achieved through biopsy or surgery. In chronological order, a total of 3,389 patients were used for model training from October 1, 2014 to May 31, 2016, and 730 patients were recruited for model verification from June 1, 2016 to September 30, 2016 (approximately 5:1). The patients’ data are summarized in Supplementary Table S2 .
Table S2. Basic characteristics of patients in developing the model.
| Variables | n (%) | P | |
| Training set (N=3,389) | Verification set (N=730) | ||
| BI-RADS, breast imaging reporting and data system. | |||
| Age [mean (range)] (year) | 52.45 (19−88) | 53.23 (26−85) | 0.718 |
| BI-RADS breast density | 0.028 | ||
| a | 177 (5.2) | 36 (4.9) | |
| b | 641 (18.9) | 153 (21.0) | |
| c | 2,323 (68.6) | 509 (69.7) | |
| d | 248 (7.3) | 32 (4.4) | |
| Lesion type | <0.001 | ||
| Malignant type | 2,001 | 453 | 0.190 |
| Mass | 1,665 (58.1) | 388 (57.0) | |
| Calcification | 1,122 (39.1) | 270 (39.6) | |
| Distortion | 16 (0.6) | 1 (0.2) | |
| Asymmetry | 64 (2.2) | 22 (3.2) | |
| Benign type | 1,388 | 277 | 0.199 |
| Mass | 1,318 (64.5) | 251 (62.9) | |
| Calcification | 619 (30.3) | 135 (33.8) | |
| Distortion | 4 (0.2) | 1 (0.3) | |
| Asymmetry | 102 (5.0) | 12 (3.0) | |
The second part: the mean age of 200 patients tested for auxiliary efficacy of the model was 59 years (Supplementary Table S3 ), and the detailed pathological types of malignant cases are presented in Supplementary Table S4 .
Table S3. Basic clinical information of 200 tested patients.
| Variables | n (%) |
| BI-RADS, breast imaging reporting and data system. | |
| Age (year) | |
| Mean | 59 |
| Median | 59 |
| Range | 33−85 |
| Interquartile range | 46−58 |
| BI-RADS breast density | |
| a | 12 (6.0) |
| b | 37 (18.5) |
| c | 82 (41.0) |
| d | 69 (34.5) |
Table S4. Pathological results and morphological features of lesions in 70 malignant patients.
| Characteristics | n |
| *, 10 cases presented with mass with calcification. | |
| Histological type | |
| Invasive ductal carcinoma | 53 |
| Ductal carcinomain situ | 10 |
| Invasive papillary carcinoma | 6 |
| Others | 1 |
| Lesion type* | |
| Mass | 49 |
| Calcification | 20 |
| Asymmetry | 6 |
| Structural distortion | 5 |
The third part: a total of 5,809 cases of mammography were involved, and 63 cases were excluded according to the exclusion criteria (9 cases had no pathological results, 50 cases had no follow-up results, and 4 cases failed to undergo mammography). The remaining 5,746 cases were included in the analysis. There were 495 patients with malignant lesions, 337 patients with benign lesions, and 4,914 negative patients. The prevalence of breast cancer in A−F centers was 15.72%, 5.91%, 7.52%, 3.83%, 11.11%, and 7.10%, respectively. There was no significant difference in patients’ baseline data (Supplementary Table S5 ).
Table S5. Basic information of prospective application cases of the model.
| Variables | Center A (N=1,450) | Center B (N=1,454) | Center C (N=958) | Center D (N=1,098) | Center E (N=279) | Center F (N=507) | P |
| BI-RADS, breast imaging reporting and data system. | |||||||
| Age (year) [mean (range)] | 50.35 (26−85) | 50.57 (25−86) | 50.84 (29−82) | 49.99 (26−79) | 51.50 (30−77) | 50.61 (33−85) | 0.652 |
| BI-RADS breast density | <0.001 | ||||||
| a | 38 | 75 | 68 | 56 | 41 | 31 | |
| b | 101 | 261 | 246 | 253 | 64 | 161 | |
| c | 1,000 | 1,062 | 551 | 732 | 157 | 300 | |
| d | 311 | 56 | 93 | 57 | 17 | 15 | |
| Lesion type | <0.001 | ||||||
| Malignant type | 228 | 86 | 72 | 42 | 31 | 36 | |
| Mass | 195 | 71 | 61 | 36 | 28 | 31 | |
| Calcification | 144 | 47 | 40 | 26 | 16 | 21 | |
| Distortion | 1 | 0 | 0 | 0 | 0 | 0 | |
| Asymmetry | 8 | 5 | 2 | 2 | 2 | 3 | |
| Benign type | 144 | 69 | 41 | 36 | 17 | 30 | |
| Mass | 132 | 69 | 30 | 32 | 17 | 26 | |
| Calcification | 54 | 34 | 24 | 14 | 7 | 24 | |
| Distortion | 0 | 0 | 0 | 0 | 0 | 1 | |
| Asymmetry | 11 | 4 | 1 | 2 | 0 | 1 | |
| Negative | 1,078 | 1,299 | 845 | 1,020 | 231 | 441 | |
First part-validation of the model
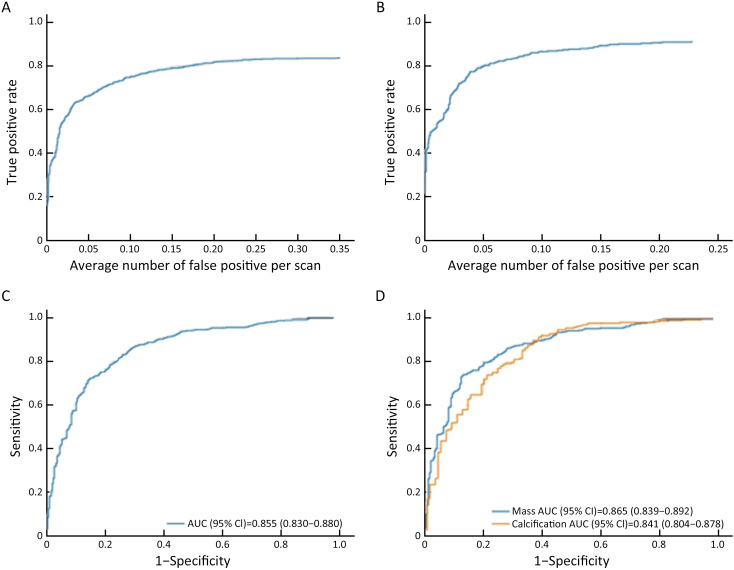
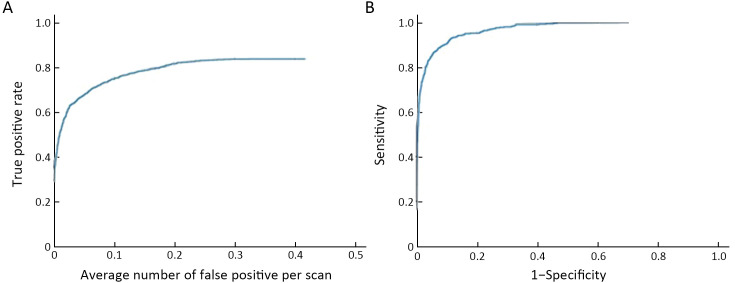
When there was a 0.25 false positive rate per image, the overall sensitivity of detection in the validation dataset was 0.828. The sensitivity of detection after matching was 0.908 for false positive rate of 0.25 in unilateral images. Among all the lesions, the AUC of the model to distinguish benign lesions from malignant lesions was 0.855 [95% confidence interval (95% CI): 0.830, 0.880]. For mass and calcification, the AUC for benign and malignant lesions were 0.865 and 0.841, respectively (Figure 3 , Supplementary Table S6 , and Supplementary Figure S4 )
Figure 3.
FROC and ROC curves in validation dataset. (A) FROC curve for detection; (B) FROC curve for detection after matching; (C) ROC curve for distinguishing benign lesions from malignant lesions [AUC (95% CI)=0.855 (0.830, 0.880)]; (D) ROC curve of the model to differentiate benign lesions from malignant lesions for calcification [AUC (95% CI)=0.841 (0.804, 0.878)] and masses [AUC (95% CI)=0.865 (0.839, 0.892)], respectively (only the detected lesions were considered, and test results and IOU marked by radiologists were >0.25). FROC, free-response receiver operating characteristic; ROC, receiver operating characteristic; AUC, area under the curve; 95% CI, 95% confidence interval; IOU, intersection over Union.
Table S6. Classification performance of the model (by lesions).
| Variables | Validation |
| 95% CI, 95% confidence interval; PPV, positive predictive value; NPV, negative predictive value. | |
| Malignant mass (n=397) | |
| Accuracy (95% CI) | 0.784 (0.752, 0.816) |
| Sensitivity (95% CI) | 0.743 (0.700, 0.786) |
| Specificity (95% CI) | 0.853 (0.808, 0.899) |
| PPV (95% CI) | 0.897 (0.864, 0.930) |
| NPV (95% CI) | 0.660 (0.606, 0.714) |
| Malignant calcification (n=264) | |
| Accuracy (95% CI) | 0.769 (0.726, 0.812) |
| Sensitivity (95% CI) | 0.788 (0.739, 0.837) |
| Specificity (95% CI) | 0.722 (0.638, 0.807) |
| PPV (95% CI) | 0.874 (0.832, 0.916) |
| NPV (95% CI) | 0.582 (0.499, 0.666) |
| Total malignant lesions (n=468) | |
| Accuracy (95% CI) | 0.769 (0.740, 0.799) |
| Sensitivity (95% CI) | 0.726 (0.686, 0.767) |
| Specificity (95% CI) | 0.836 (0.795, 0.878) |
| PPV (95% CI) | 0.872 (0.839, 0.905) |
| NPV (95% CI) | 0.666 (0.619, 0.713) |
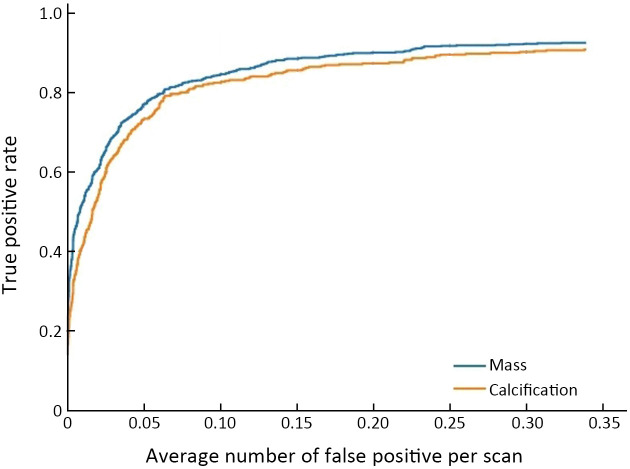
Figure S4.
FROC curve of detection in calcification and mass in 6 centers. FROC, free-response receiver operating characteristic.
Second part-comparing clinical data between the model and 12 radiologists
ROC curve, sensitivity and specificity
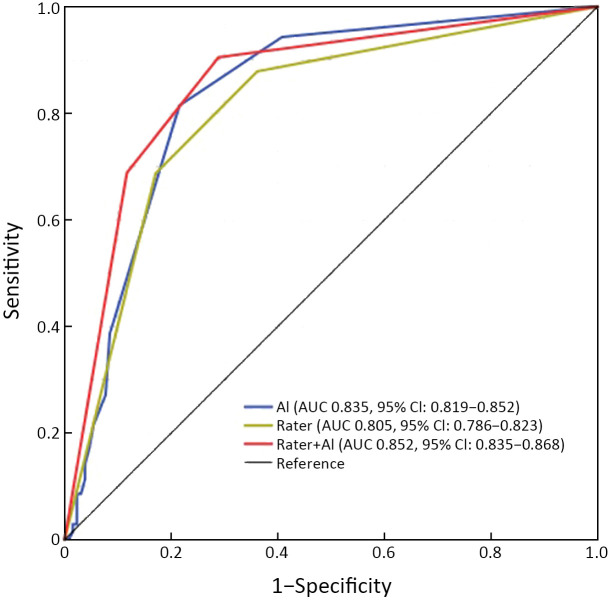
The AUC for the model-independent diagnosis was 0.835 (95% CI: 0.819, 0.852). The diagnostic performance of 12 radiologists assisted with the model was higher than that of 12 radiologists reading alone (AUC: 0.852 vs. 0.805, P=0.005) (Figure 4 , Supplementary Table S7 ). The specificity of 12 radiologists assisted with the model was higher than that of reading alone (88.34%vs. 82.05%, P=0.005), and there was no significant difference in sensitivity between these two groups of radiologists (68.78% vs. 68.70%, P=0.937) (Supplementary Table S8 ). The sensitivity and specificity of the model independent diagnosis were 81.40% and 78.50%, respectively. The sensitivity and specificity of 12 radiologists reading alone are shown in Supplementary Table S9 .
Figure 4.
ROC curves of diagnosis assisted by the model and diagnosis alone for 12 radiologists. ROC, receiver operating characteristic. AI, artificial intelligence; AUC, area under the curve; 95% CI, 95% confidence interval.
Table S7. AUC for each radiologist and reader-averaged AUCs for reading mammograms unaided and with AI support.
| Radiologists | Read alone | Read with the model |
| AUC, area under the curve; AI, artificial intelligence. | ||
| A | 0.781 | 0.836 |
| B | 0.765 | 0.824 |
| C | 0.829 | 0.877 |
| D | 0.821 | 0.794 |
| E | 0.775 | 0.865 |
| F | 0.793 | 0.828 |
| G | 0.891 | 0.905 |
| H | 0.796 | 0.852 |
| I | 0.889 | 0.891 |
| J | 0.777 | 0.893 |
| K | 0.788 | 0.846 |
| L | 0.758 | 0.812 |
| Average | 0.805 | 0.852 |
Table S8. Mean sensitivity and specificity across radiologists.
| Variables | % | P | |
| Radiologists alone | Radiologist with the model | ||
| Sensitivity | 68.70±16.34 | 68.78±18.67 | 0.937 |
| Specificity | 82.05±4.65 | 88.34±6.93 | 0.005 |
Table S9. Sensitivity and specificity of 12 radiologists read alone and read with the model.
| Radiologists | % | ||||
| Radiologist alone | Radiologist with the model | ||||
| Sensitivity | Specificity | Sensitivity | Specificity | ||
| A | 72.9 | 76.9 | 58.5 | 98.5 | |
| B | 38.6 | 91.5 | 35.7 | 93.8 | |
| C | 62.9 | 86.9 | 77.1 | 96.2 | |
| D | 70.0 | 80.0 | 47.1 | 84.6 | |
| E | 60.0 | 85.4 | 67.1 | 96.2 | |
| F | 67.1 | 81.5 | 60.0 | 85.4 | |
| G | 94.3 | 82.3 | 95.7 | 82.3 | |
| H | 70.0 | 80.0 | 81.4 | 81.5 | |
| I | 98.6 | 78.5 | 100 | 78.5 | |
| J | 51.4 | 86.2 | 65.7 | 88.5 | |
| K | 64.3 | 80.0 | 77.1 | 81.5 | |
| L | 74.3 | 75.4 | 60.0 | 93.1 | |
Reading time
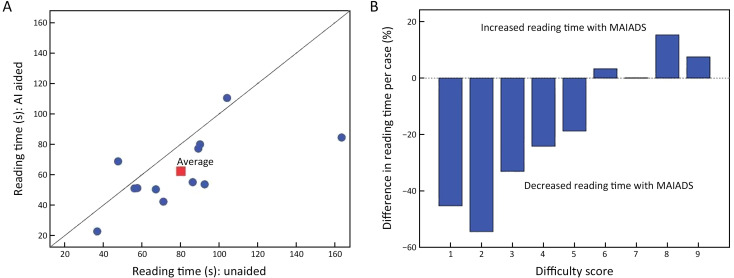
With the model, the mean reading time of 12 radiologists was significantly shorter than that of 12 radiologists alone (62.28±23.12 s vs. 80.18±33.26 s, P=0.032). Additionally, with the aid of the model, the reading time of 1 radiologist increased (6.1%), while that of 11 radiologists decreased (range, 9.1%−48.3%) (Figure 5A ). The difference in reading time caused by different difficulty scores is shown in Figure 5B . Of all the reading time, 0.4% (21 of 4,800) was defined as an outlier and was excluded from this analysis.
Figure 5.
Reading times. (A) Graph shows the reading time (circle) and mean reading time (square) of each case for each radiologist; (B) bar graph depicts the difference in reading time caused by different difficulty scores. AI, artificial intelligence; MAIADS, mammography artificial intelligence diagnosis system.
For cases with low-difficulty coefficient (1−5 points), with the aid of the model, the average reading time of each case was reduced by 35.2%. On the contrary, for cases with high difficulty coefficient (6−9 points), the reading time of each case was elevated by 6.5%.
Third part-prospective clinical results of the model
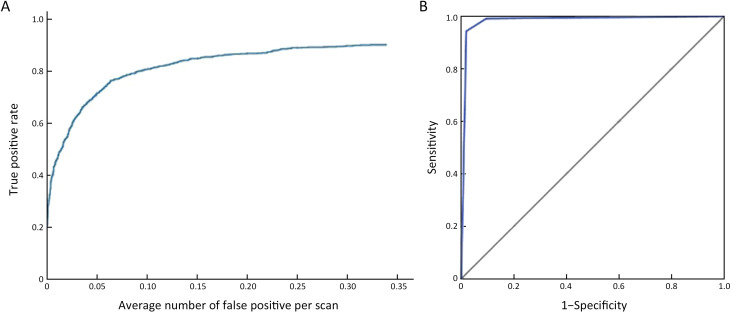
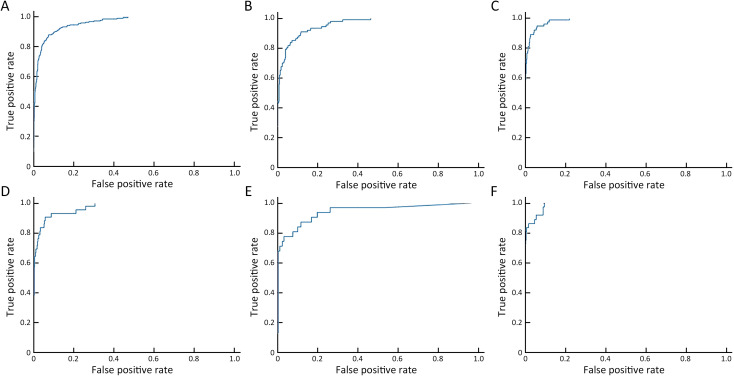
With the model, the sensitivity of detection reached 0.887 at false positive rate of 0.25 (Supplementary Figure S5 ). With the model, the AUC of differentiating benign lesions from malignant lesions was 0.983 (95% CI: 0.978, 0.988) (Figure 6 , Supplementary Table S10 ). The sensitivity, specificity, PPV and NPV of diagnosis were 94.36%, 98.07%, 87.76% and 99.09%, respectively. The AUC of the model diagnosing alone in A−F centers was 0.959, 0.959, 0.986, 0.970, 0.941 and 0.989, respectively (Supplementary Figure S6 ). The mean diagnosis time including writing report of each mammogram was 94.23 s.
Figure S5.
Performance of the model in prospective data. (A) Detection performance of the model in prospective data in multicenter; (B) classification performance of the model in prospective data in multicenter [AUC (95% CI)=0.967 (0.962, 0.972)]. AUC, area under the curve; 95% CI, 95% confidence interval.
Figure 6.
Diagnostic performance of radiologists with the aid of the model in the prospective multicenter clinical application. (A) FROC curve; (B) ROC curve for differentiating malignant lesions [AUC (95% CI)=0.983 (0.978, 0.988)]. FROC, free-response receiver operating characteristic; ROC, receiver operating characteristic; AUC, area under the curve; 95% CI, 95% confidence interval.
Table S10. Performance of the model in prospective clinical application in each center (by patients).
| Variables | Prospective application performance (N=5,746) | |||||
| Center A (n=1,450) | Center B (n=1,454) | Center C (n=958) | Center D (n=1,098) | Center E (n=279) | Center F (n=507) | |
| 95% CI, 95% confidence interval; PPV, positive predictive value; NPV, negative predictive value. | ||||||
| Accuracy
(95% CI) |
0.959
(0.948, 0.969) |
0.959
(0.949, 0.969) |
0.986
(0.979, 0.994) |
0.970
(0.960, 0.980) |
0.941
(0.913, 0.969) |
0.989
(0.979, 0.998) |
| Sensitivity
(95% CI) |
0.754
(0.699, 0.810) |
0.674
(0.575, 0.773) |
0.806
(0.714, 0.897) |
0.690
(0.551, 0.830) |
0.742
(0.588, 0.896) |
0.778
(0.642, 0.914) |
| Specificity
(95% CI) |
0.965
(0.954, 0.975) |
0.979
(0.971, 0.986) |
0.984
(0.976, 0.992) |
0.985
(0.977, 0.992) |
0.976
(0.957, 0.995) |
0.996
(0.990, 1.002) |
| PPV
(95% CI) |
0.800
(0.747, 0.853) |
0.667
(0.568, 0.766) |
0.806
(0.714, 0.897) |
0.644
(0.505, 0.784) |
0.793
(0.646, 0.941) |
0.933
(0.844, 1.023) |
| NPV
(95% CI) |
0.955
(0.943, 0.966) |
0.980
(0.972, 0.987) |
0.984
(0.976, 0.992) |
0.988
(0.981, 0.994) |
0.968
(0.946, 0.990) |
0.983
(0.972, 0.995) |
Figure S6.
ROC curves of the model’s diagnosing performance in 6 centers. (A) Peking University Cancer Hospital [sensitivity (95% CI)=0.754 (0.699, 0.810), specificity (95% CI)=0.965 (0.954, 0.975), PPV (95% CI)=0.800 (0.747, 0.853) and NPV (95% CI)=0.955 (0.943, 0.966)]; (B) Shunyi Women’s & Children’s Hospital of Beijing Children’s Hospital [sensitivity (95% CI)=0.674 (0.575, 0.773), specificity (95% CI)=0.979 (0.971, 0.986), PPV (95% CI)=0.667 (0.568, 0.766) and NPV (95% CI)=0.980 (0.972, 0.987)]; (C) Beijing Daxing District People’s Hospital [sensitivity (95% CI)=0.806 (0.714, 0.897), specificity (95% CI)=0.984 (0.976, 0.992), PPV (95% CI)=0.806 (0.714, 0.897) and NPV (95% CI)=0.984 (0.976, 0.992)]; (D) Beijing Chaoyang Maternal and Child Health Center [sensitivity (95% CI)=0.690 (0.551, 0.830), specificity (95% CI)=0.985 (0.977, 0.992), PPV (95% CI)=0.644 (0.505, 0.784) and NPV (95% CI)=0.988 (0.981, 0.994)]; (E) Shunyi District Hospital [sensitivity (95% CI)=0.742 (0.588, 0.896), specificity (95% CI)=0.976 (0.957, 0.995), PPV (95% CI)=0.793 (0.646, 0.941) and NPV (95% CI)=0.968 (0.946, 0.990)]; (F) Beijing Shijingshan Hospital [sensitivity (95% CI)=0.778 (0.642, 0.914), specificity (95% CI)=0.996 (0.990, 1.002), PPV (95% CI)=0.933 (0.844, 1.023) and NPV (95% CI)=0.983 (0.972, 0.995)]. ROC, receiver operating characteristic; PPV, positive predictive value; NPV, negative predictive value; 95% CI, 95% confidence interval.
Discussion
In the present study, a mammography-based AI model for breast cancer was established, and it was unveiled that the proposed system had superior diagnostic performance, and can assist radiologists to improve the diagnostic accuracy and shorten the diagnosis time. Finally, through prospective multicenter population verification, the system exhibited a satisfactory auxiliary diagnostic performance. To our knowledge, this is a prospective clinical research in the field of mammography based on AI, and outstanding outcomes could be achieved.
In order to avoid missed diagnosis, an AI-assisted diagnosis model may lead to increase of false positive rate. In clinical application, a model with high false positive rate may result in over-testing, interfering with radiologists’ attention, consuming radiologist’ energy, and increasing patients’ psychological anxiety and financial burden. Several AI-based models for mammography were previously reported, some of which were developed for the purposes of detection and classification (31), and some of which were developed based on clinical data (32,33), while none of them tackled the above-mentioned deficiencies. Our model could make a correlation between the two views of lesions. Our model used a matching module to combine the image on the CC position and MLO position to ensure that the detected lesion was a true positive lesion. It can be seen from the data obtained before and after matching that the matching module reduced the false positive rate, while ensured the sensitivity, and improved the accuracy of differentiation of benign lesions from malignant lesions, indicating the reliable capability of clinical application of the proposed system.
In our study, three different participants were selected for model developing, comparative testing and prospective validation. During the development of the model, we selected the population with suspicious lesions in mammography for better learning. In the comparison test, the 200 mammogram cases were significantly more difficult than those in the usual clinical work, in order to better test the auxiliary ability of the model. In the prospective verification, the cases we collected were as close to the real world as possible, which is more conducive to observing the role of assisted diagnosis system in the real world. The results presented were different due to the differences in the population observed. Population in the first part of the study are suspected cases and therefore the AUC of classification of the model is 0.852, and in the prospective part, participants include clinic diagnosis cases and screening cases, as well as breast X-ray negative cases, the results reached 0.983.
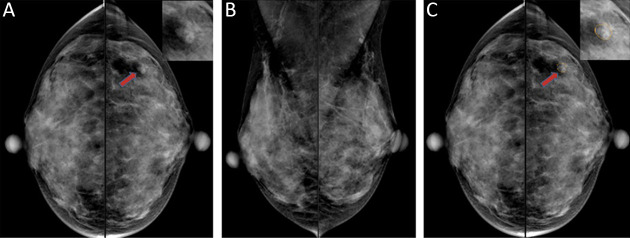
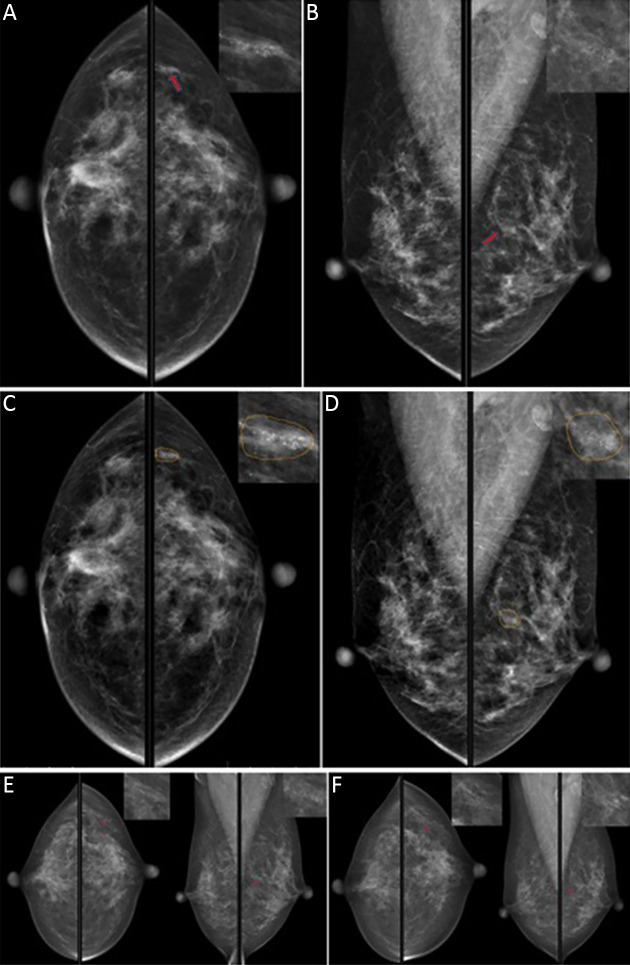
In the part of testing whether the model can assist a radiologist to improve the diagnostic performance, we deliberately selected the difficult and differentiated cases. This aimed to monitor radiologists’ diagnostic accuracy in diagnosing difficult cases and simple cases, so as to better assess capability of the model in assisting radiologists for diagnosing and clarifying its clinical application value. With the model, the 12 radiologists’ diagnostic performance was higher than that without assistance (0.852 vs. 0.808, P=0.005). It indicated that radiologists’ diagnostic performance can be improved with the DL model. Supplementary Figures S7,8 show examples of the correct number of detection and diagnosis changed under different reading conditions. The results showed that the sensitivity of the diagnosis of 12 radiologists reading alone was quite different (38.8%−98.6%), which is consistent with result of a previous study (34), and is also one of the important reasons for the implementation of double-reading. This may be related to radiologists’ experience. The AUC of the model-independent diagnosis was 0.835 (95% CI: 0.819, 0.852), which was close to some radiologists’ diagnostic performance. Therefore, it is feasible to make the model for fast and robust diagnosing patients with breast cancer.
The reading time of 12 radiologists with the model was significantly shorter than that of reading alone. The reading time was shortened in a number of radiologists by up to 50%. We speculated that this might be related to radiologists’ experience, and this conclusion was consistent with a previous research’s outcome (23). When there were cases with low-difficulty coefficient (1−5 points), the viewing time was markedly shortened with the aid of the model, indicating that our model can save time and enable radiologists to further concentrate on cases with high-difficulty coefficient, so that radiologists could avoid the possibility of missed diagnosis and misdiagnosis. For cases with high-difficulty coefficient, it increased the diagnostic time while the average increase was only 6.5%, which was still within the acceptable range.
The previously reported AI-based models for mammography were partially limited to the detection of lesions (22), and they were partly tested on public datasets (31). In contrast, the model exhibited high detection and diagnostic efficacy in prospective clinical applications in six different centers. In addition, the model showed high sensitivity and specificity for detection of the two types of lesions (masses and calcifications). In particular, the detection of calcification accompanied with satisfactory results under the background of generally dense glands in Asian women, which greatly shortens the detection time of lesions and saves radiologists’ energy in detecting lesions, thereby assisting radiologists to improve diagnostic efficiency. In addition, the prospective application results of the model achieved in six different centers reflected its universality and practicality.
Despite the above-mentioned outstanding results, this study has several limitations. First, we did not carry out a prospective multicenter randomized controlled trial to validate the superiority of auxiliary diagnosis with the model compared without it, because it is hard to randomly assign clinical cases through image diagnosis system. Second, there are still a limited number of deficiencies in the matching module (i.e., the network cannot deal with mismatch between lesions and other views). Third, in terms of clinical applicability, our model was only conducted by training and validation datasets in a large population in mainland China, and its effectiveness in other populations (such as Western countries) remains to be further studied.
Conclusions
We developed an AI-assisted diagnostic model for breast cancer, and demonstrated that it can improve the diagnostic accuracy and shorten the time for breast cancer diagnosis. The clinical application of the model was prospectively completed for the first time in multicenters, which highlighted the effectiveness and applicability of the AI-assisted diagnostic system.
Footnote
Conflicts of Interest: The authors have no conflicts of interest to declare.
Supplementary materials
Online demo of the system
For the online demo, please see http://mgshow.yizhun-ai.com/. The user name is mgshow, and password is mgshow1234.
Follow-up plan
Follow-up plan: 1) retrospective study part: a) Collect mammography from the image workstation for patients with suspicious breast lesions and collect pathological diagnosis information; and b) For patients without pathological diagnosis, all mammography information of the patient was collected from the image workstation to confirm whether the patient had mammography more than 2 years after the first mammography in Peking University Cancer Hospital, and the diagnostic tendency was benign; 2) prospective study part: Mammography was performed for suspicious breast lesions, and biopsies were performed in category of breast imaging reporting and data system (BI-RADS) 4 and 5 patients to obtain pathological diagnosis and terminate follow-up. Patients with BI-RADS 3 were followed up by mammography every 6 months for more than 2 years. During the follow-up period, patients diagnosed as BI-RADS 4 and 5 by mammography received biopsy, and obtained pathological diagnosis and terminated the follow-up. Patients in the BI-RADS 1 and 2 categories received mammography 2 years after the first mammography, and those with BI-RADS 4 and 5 categories received biopsy.
Statistical analysis
We evaluated the diagnostic accuracy, sensitivity, specificity, and positive predictive value (PPV) and negative predictive value (NPV) of the model in the differential diagnosis of cancerous lesions.
1) Detection rate of lesions: the detection rate of lesions in the model was calculated based on the results of pathological examination and the results of imaging follow-up of more than 2 years, and the detection rates of different types of lesions were further calculated respectively.
2) Diagnostic accuracy of lesions: the sensitivity, specificity, PPV, NPV and overall accuracy of the model for breast lesions were calculated, and the diagnostic accuracy of different types of lesions was calculated respectively.
3) Area under the curve (AUC) for patient level diagnosis: to measure the diagnosis performance of the model, we use the predicted score of the most malignant detected lesion as the malignant score of a patient, and calculate AUC with pathological examination results.
Figure S7.
A 40-year-old woman with a lobulated mass (red arrow) in the left external breast quadrant on the CC view, and an ambiguous lesion on the MLO view, was pathologically confirmed as invasive apocrine carcinoma by biopsy. Only 4 of the 12 doctors detected the lesion when they read the film alone. When doctors read with the model, 9 of 12 doctors detected the disease. (A) CC view, with local zoom image in the upper right corner; (B) MLO view; (C) CC view, the yellow line is the detection result of the model. CC, craniocaudal; MLO, mediolateral oblique.
Figure S8.
A 51-year-old woman with clustered calcification (red arrow) in the upper quadrant of her left breast. No significant changes were observed in the 2-year follow-up, which was considered to be benign. When the doctors read alone, 9 of 12 doctors misjudged it as malignant lesions. The model accurately detected the lesion and suggested that the lesion type was calcification, and the possibility of malignancy was 1.8%. BI-RADS 3 was recommended. With the model, 3 of the original 9 doctors changed right. (A) CC view of the first mammogram; (B) MLO view of the first mammogram; (C) CC view, detection results of the model, and yellow lines delineated the lesion range for the model; (D) MLO view, detection results of the model, and yellow lines delineated the lesion range for the model; (E) mammogram images at 1-year follow-up; (F) mammographic images at 2-year follow-up. BI-RADS, Breast Imaging-Reporting and Data System; CC, craniocaudal; MLO, mediolateral oblique.
Table S1. Study sites.
| Centers | Institutions | No. of patients
enrolled |
Manufacturer, model name |
| Center A | Peking University Cancer Hospital | 1,450 | GE MEDICAL SYSTEMS, Senographe Essential VERSION ADS_54.20; SIEMENS, Mammomat Novation DR |
| Center B | Shunyi Women’s & Children’s Hospital of Beijing Children’s Hospital | 1,454 | HOLOGIC Inc. Selenia Dimensions |
| Center C | Beijing Daxing District People’s Hospital | 958 | Philips Medical Systems, MammoDiagnost DR |
| Center D | Beijing Chaoyang Maternal and Child Health Hospital | 1,098 | SIEMENS, Mammomat Inspiration |
| Center E | Shunyi District Hospital | 279 | HOLOGIC Inc. Selenia Dimensions |
| Center F | Beijing Shijingshan Hospital | 507 | GE MEDICAL SYSTEMS, Senograph DS VERSION ADS_54.20 |
Acknowledgements
This study was supported by Beijing Municipal Science & Technology Commission (No. Z181100001918001), Beijing Municipal Administration of Hospitals Clinical Medicine Development of Special Funding Support (No. ZYLX201803); Beijing Hospitals Authority Ascent Plan (No. DFL20191103) and Beijing Municipal Administration of Hospitals Incubating Program (No. PX2018041).
References
- 1.Chen W, Zheng R, Baade PD, et al Cancer statistics in China, 2015. CA Cancer J Clin. 2016;66:115–32. doi: 10.3322/caac.21338. [DOI] [PubMed] [Google Scholar]
- 2.Sun D, Cao M, Li H, et al Cancer burden and trends in China: A review and comparison with Japan and South Korea. Chin J Cancer Res. 2020;32:129–39. doi: 10.21147/j.issn.1000-9604.2020.02.01. [DOI] [PMC free article] [PubMed] [Google Scholar]
- 3.Hillman BJ, Goldsmith JC The uncritical use of high-tech medical imaging. N Engl J Med. 2010;363:4–6. doi: 10.1056/NEJMp1003173. [DOI] [PubMed] [Google Scholar]
- 4.Berry DA, Cronin KA, Plevritis SK, et al Effect of screening and adjuvant therapy on mortality from breast cancer. N Engl J Med. 2005;353:1784–92. doi: 10.1056/NEJMoa050518. [DOI] [PubMed] [Google Scholar]
- 5.Løberg M, Lousdal ML, Bretthauer M, et al Benefits and harms of mammography screening. Breast Cancer Res. 2015;17:63. doi: 10.1186/s13058-015-0525-z. [DOI] [PMC free article] [PubMed] [Google Scholar]
- 6.National Health Commission of the People’s Republic of China Chinese guidelines for diagnosis and treatment of breast cancer 2018 (English version) Chin J Cancer Res. 2019;31:259–77. doi: 10.21147/j.issn.1000-9604.2019.02.02. [DOI] [PMC free article] [PubMed] [Google Scholar]
- 7.Myers ER, Moorman P, Gierisch JM, et al Benefits and harms of breast cancer screening: A systematic review. JAMA. 2015;314:1615–34. doi: 10.1001/jama.2015.13183. [DOI] [PubMed] [Google Scholar]
- 8.Duffy SW, Tabár L, Yen AM, et al Mammography screening reduces rates of advanced and fatal breast cancers: Results in 549,091 women. Cancer. 2020;126:2971–9. doi: 10.1002/cncr.32859. [DOI] [PMC free article] [PubMed] [Google Scholar]
- 9.Elmore JG, Nakano CY, Koepsell TD, et al International variation in screening mammography interpretations in community-based programs. J Natl Cancer Inst. 2003;95:1384–93. doi: 10.1093/jnci/djg048. [DOI] [PMC free article] [PubMed] [Google Scholar]
- 10.Yang L, Wang S, Huang Y An exploration for quantification of overdiagnosis and its effect for breast cancer screening. Chin J Cancer Res. 2020;32:26–35. doi: 10.21147/j.issn.1000-9604.2020.01.04. [DOI] [PMC free article] [PubMed] [Google Scholar]
- 11.Chan HP, Doi K, Galhotra S, et al Image feature analysis and computer-aided diagnosis in digital radiography. I. Automated detection of microcalcifications in mammography. Med Phys. 1987;14:538–48. doi: 10.1118/1.596065. [DOI] [PubMed] [Google Scholar]
- 12.Fenton JJ, Xing G, Elmore JG, et al Short-term outcomes of screening mammography using computer-aided detection: a population-based study of medicare enrollees. Ann Intern Med. 2013;158:580–7. doi: 10.7326/0003-4819-158-8-201304160-00002. [DOI] [PMC free article] [PubMed] [Google Scholar]
- 13.Taylor P, Potts HW Computer aids and human second reading as interventions in screening mammography: two systematic reviews to compare effects on cancer detection and recall rate. Eur J Cancer. 2008;44:798–807. doi: 10.1016/j.ejca.2008.02.016. [DOI] [PubMed] [Google Scholar]
- 14.Esteva A, Kuprel B, Novoa RA, et al Dermatologist-level classification of skin cancer with deep neural networks. Nature. 2017;542:115–8. doi: 10.1038/nature21056. [DOI] [PMC free article] [PubMed] [Google Scholar]
- 15.Gulshan V, Peng L, Coram M, et al Development and validation of a deep learning algorithm for detection of diabetic retinopathy in retinal fundus photographs. JAMA. 2016;316:2402–10. doi: 10.1001/jama.2016.17216. [DOI] [PubMed] [Google Scholar]
- 16.Drukker K, Giger ML, Joe BN, et al Combined benefit of quantitative three-compartment breast image analysis and mammography radiomics in the classification of breast masses in a clinical data set. Radiology. 2019;290:621-8. doi: 10.1148/radiol.2018180608. [DOI] [PMC free article] [PubMed] [Google Scholar]
- 17.Liu Z, Li Z, Qu J, et al Radiomics of multi-parametric MRI for pretreatment prediction of pathological complete response to neoadjuvant chemotherapy in breast cancer: a multicenter study. Clin Cancer Res. 2019;25:3538–47. doi: 10.1158/1078-0432.CCR-18-3190. [DOI] [PubMed] [Google Scholar]
- 18.Yasaka K, Akai H, Abe O, et al Deep learning with convolutional neural network for differentiation of liver masses at dynamic contrast-enhanced CT: a preliminary study. Radiology. 2018;286:887–96. doi: 10.1148/radiol.2017170706. [DOI] [PubMed] [Google Scholar]
- 19.Rajpurkar P, Irvin J, Ball RL, et al Deep learning for chest radiograph diagnosis: A retrospective comparison of the CheXNeXt algorithm to practicing radiologists. PLoS Med. 2018;15:e1002686. doi: 10.1371/journal.pmed.1002686. [DOI] [PMC free article] [PubMed] [Google Scholar]
- 20.Zhu H, Zhang X, Li X, et al Prediction of pathological nodal stage of locally advanced rectal cancer by collective features of multiple lymph nodes in magnetic resonance images before and after neoadjuvant chemoradiotherapy. Chin J Cancer Res. 2019;31:984–92. doi: 10.21147/j.issn.1000-9604.2019.06.14. [DOI] [PMC free article] [PubMed] [Google Scholar]
- 21.Akselrod-Ballin A, Chorev M, Shoshan Y, et al Predicting breast cancer by applying deep learning to linked health records and mammograms. Radiology. 2019;292:331-42. doi: 10.1148/radiol.2019182622. [DOI] [PubMed] [Google Scholar]
- 22.Kooi T, Litjens G, van Ginneken B, et al Large scale deep learning for computer aided detection of mammographic lesions. Med Image Anal. 2017;35:303–12. doi: 10.1016/j.media.2016.07.007. [DOI] [PubMed] [Google Scholar]
- 23.Rodríguez-Ruiz A, Krupinski E, Mordang JJ, et al Detection of breast cancer with mammography: Effect of an artificial intelligence support system. Radiology. 2019;290:305–14. doi: 10.1148/radiol.2018181371. [DOI] [PubMed] [Google Scholar]
- 24.Becker AS, Marcon M, Ghafoor S, et al Deep learning in mammography: Diagnostic accuracy of a multipurpose image analysis software in the detection of breast cancer. Invest Radiol. 2017;52:434–40. doi: 10.1097/RLI.0000000000000358. [DOI] [PubMed] [Google Scholar]
- 25.McKinney SM, Sieniek M, Godbole V, et al International evaluation of an AI system for breast cancer screening. Nature. 2020;577:89–94. doi: 10.1038/s41586-019-1799-6. [DOI] [PubMed] [Google Scholar]
- 26.Hillis SL, Obuchowski NA, Berbaum KS Power estimation for multireader ROC methods an updated and unified approach. Acad Radiol. 2011;18:129–42. doi: 10.1016/j.acra.2010.09.007. [DOI] [PMC free article] [PubMed] [Google Scholar]
- 27.Ren S, He K, Girshick R, et al Faster R-CNN: Towards real-time object detection with region proposal networks. IEEE Trans Pattern Anal Mach Intell. 2017;39:1137–49. doi: 10.1109/TPAMI.2016.2577031. [DOI] [PubMed] [Google Scholar]
- 28.Chen S, Zhang C, Dong M, et al. Using ranking-CNN for age estimation. In Proceedings of the IEEE Conference on Computer Vision and Pattern Recognition (CVPR), p5183-92. New Jersey: IEEE, 2017.
- 29.Vaswani A, Shazeer N, Parmar N, et al. Attention is all you need. In Proceedings of the 31st Conference on Neural Information Processing Systems (NIPS 2017), p6000-10. New York: Curran Associates Inc., 2017.
- 30.He K, Zhang X, Ren S, et al. Deep residual learning for image recognition. In Proceedings of the IEEE Conference on Computer Vision and Pattern Recognition (CVPR), p770-8. New Jersey: IEEE, 2016.
- 31.Ribli D, Horváth A, Unger Z, et al Detecting and classifying lesions in mammograms with Deep Learning. Sci Rep. 2018;8:4165. doi: 10.1038/s41598-018-22437-z. [DOI] [PMC free article] [PubMed] [Google Scholar]
- 32.Akselrod-Ballin A, Chorev M, Shoshan Y, et al Predicting breast cancer by applying deep learning to linked health records and mammograms. Radiology. 2019;292:331–42. doi: 10.1148/radiol.2019182622. [DOI] [PubMed] [Google Scholar]
- 33.Wu N, Phang J, Park J, et al Deep neural networks improve radiologists’ performance in breast cancer screening. IEEE Trans Med Imaging. 2020;39:1184–94. doi: 10.1109/TMI.2019.2945514. [DOI] [PMC free article] [PubMed] [Google Scholar]
- 34.Elmore JG, Jackson SL, Abraham L, et al Variability in interpretive performance at screening mammography and associated with accuracy. Radiology. 2009;253:641–51. doi: 10.1148/radiol.2533082308. [DOI] [PMC free article] [PubMed] [Google Scholar]


