

Abstract
Background:
Abnormalities of reward sensitivity and impulsivity are known to be correlated with each other and alcohol use disorder (AUD) risk, but the underlying aberrant neural circuitry involved is not clearly defined. We sought to extend the current knowledge of AUD pathophysiology by studying incentive processing in persons with AUD using functional neuroimaging data.
Methods:
We utilized functional MRI data from the Human Connectome Project Database obtained during performance of a number-guessing incentive-processing task with win, loss, and neutral feedback conditions in 78 participants with either DSM-IV alcohol abuse or dependence (combined as the AUD group) and 78 age- and sex-matched control (CON) participants. Within a network consisting of anterior cingulate cortex (ACC), dorsolateral prefrontal cortex (DLPFC), insula, ventral striatum, and dorsal striatum (DS) in the right hemisphere, we performed dynamic causal modeling analysis to test group-level differences (AUD vs. CON) in effective directional connectivity (EC) as modulated by “win” and “loss” conditions. We used linear regression analyses to characterize the relations between each EC outcome and measures of cumulative alcohol exposure and impulsivity.
Results:
During wins, AUD participants had lower ECs from ACC to the other four nodes, greater ECs from insula to the other four nodes, greater ECs from DLPFC to the other four nodes, and greater DS to DS self-connection EC than CON participants. In the total sample, EC from the insula to the DLPFC (insula → DLPFC) during wins was positively correlated with both impulsivity (as measured by the delay-discounting task) and cumulative alcohol exposure. The DS to DS self-connection EC during wins was positively correlated with impulsivity. Many of the altered ECs from the ACC and insula to other nodes were correlated with cumulative alcohol exposure.
Conclusions:
Individuals with AUD have disrupted EC in both instrumentally driven and automatized corticostriatal reward circuits during non-alcohol reward feedback. These results point to disrupted corticostriatal EC in both “top-down” and “bottom-up” pathways among individuals with AUD.
Keywords: alcohol use disorder, DCM, effective connectivity, reward, ventral and dorsal pathways
INTRODUCTION
Alcohol use disorder (AUD) is a complex heterogeneous disorder that likely arises from various risk-related characteristics such as altered neural transmission in response to rewards that influence the propensity to become dependent on alcohol. Recent studies of the phenomenology of AUD in terms of research domain criteria have identified three mechanistic neurofunctional domains characterizing AUD: incentive salience, negative emotionality, and executive function (executive control; Kwako et al., 2019). Not only might different patterns of hypo- versus hyperfunction of these neurocircuits drive development and maintenance of AUD, but they may also instantiate “biotypes” of AUD that might identify candidates for certain kinds of AUD pharmacotherapies.
Of interest in this report is advancing the understanding of abnormalities in incentive-motivational (“reward”) circuitry in AUD. Differences in reward sensitivity in terms of the experience and evaluation of nonalcohol rewards with regard to incentive salience have been shown between AUD subjects and controls (Beck et al., 2009; Kamarajan et al., 2010). Although abnormalities in neural activation by reward prospects or deliveries have been observed with fMRI tasks in relation to AUD and AUD risk, the directionality and magnitude of these associations are poorly understood, and directionality may depend on task demands or on different phases of processing (Bjork, 2020; Sherman et al., 2018). A recent meta-analysis examining fMRI studies using reward paradigms in individuals with addictive disorders found that individuals with addictive disorders (compared to controls) showed increased striatal activation during reward receipt and decreased striatal activation during reward anticipation (Luijten et al., 2017). Radoman et al. (2021) examined the relationship between the subjective response to alcohol during an oral alcohol challenge in healthy young social drinkers and striatal brain activity during reward receipt on a reward task (the “Doors” guessing game) in the scanner. They found that increased desire for alcohol after receiving a moderate dose was positively correlated to increased striatal activity during monetary reward receipt.
Increased reward activation in AUD might be a component of increased impulsivity characteristics, in that impulsive behavior (preference for immediate rewards) has been framed as the result of a dysregulated opponent process, wherein exaggerated salience of rewarding prospects is unchecked by (poor) executive control (Bickel et al., 2007; Bjork et al., 2004). Impulsivity has been consistently shown to increase the risk for AUD and may have a complex bidirectional relationship with heavy drinking (Castellanos-Ryan et al., 2011; Dick et al., 2010). Though reward sensitivity and impulsivity are known to be correlated with each other and with AUD risk, the underlying neural physiology and circuit abnormalities that explain variance in these associations have yet to be clearly defined (Dawe et al., 2004), but by understanding them better we may be able to develop new and improved precision treatments.
Findings from Bjork et al. (2012) exemplify the complex relationship between fMRI findings of striatal activation, reward processing, and impulsivity measures in AUD subjects that have been observed also in other studies (Beck et al., 2009). They found minimal differences between detoxified AUD subjects and controls in terms of ventral striatum (VS) activation with reward anticipation or receipt with a modified monetary incentive delay (MID) task. Rather, they found that a questionnaire measure of impulsivity was correlated with VS recruitment in anticipation and receipt of low-level rewards. Similarly, in a previous study with a MID task variant, they found that increased VS recruitment by low reward notifications in participants with AUD was no longer evident when their greater questionnaire impulsivity was entered into the model (Bjork et al., 2008). In a similar study, Beck et al. (2009) found differences in VS activation between those with AUD and controls and these were correlated with an impulsivity trait measure, but only in AUD subjects. These findings suggest that differences in reward-elicited activation in AUD may be related more to trait impulsivity than compulsive use or psychosocial consequences that define AUD diagnosis per se.
Similar studies exploring reward processing differences in healthy adults with a family history of alcoholism (used as a proxy for inherited risk/propensity) have yielded mixed results, but suggest a role for genetically regulated premorbid incentive-processing abnormalities as being causal for AUD. Andrews et al. (2011) studied fMRI response during the MID task in individuals with and without a family history of alcoholism and found that those with a family history showed altered reactivity in the nucleus accumbens (NAc), a subregion of the VS. Activation of the VS during the receipt of reward did not differ between groups. However, a family history of alcoholism in subjects was specifically correlated with decreased activation in the NAc as well as other reward circuitry–associated areas during reward anticipation, which is mostly consistent with the reward deficiency syndrome (Blum et al., 2000; Koob & Le Moal, 2008) wherein reduced activation by nondrug reward prospects bias an individual toward the intense dopamine-driven rewards of substances of abuse. In a meta-analysis, Luijten et al. (2017) found an increase in striatal activation with reward receipt (outcome) in substance-addicted participants.
In the present study, we sought to extend the current knowledge of AUD pathophysiology by examining effective (directional) connectivity (EC) during reward and loss feedback processing in individuals with and without AUD using fMRI data collected during a number-guessing incentive-processing task (Delgado et al., 2000) from the Human Connectome Project [HCP, Barch et al. (2013)]. Previous fMRI studies (e.g., Delgado, 2007) have shown that this paradigm elicits a strong response in the striatum (dorsal and ventral) of healthy subjects, with wins eliciting sustained elevation of activation and losses causing decreased activity, and this was part of the rationale for its use in the HCP (Barch et al., 2013; Delgado et al., 2000; Van Essen et al., 2013). The task also activates insula (INS; Van de Steen et al., 2020), prefrontal (PF) regions including anterior cingulate cortex (ACC; Van de Steen et al., 2020), and dorsolateral prefrontal cortex (DLPFC; Delgado et al., 2003) which underlie executive control and modulate striatal activation during reward processing (Bush et al., 2002; Staudinger et al., 2011). There are no published studies of EC during reward-driven impulsivity tasks in AUD to date. EC analysis via dynamic causal modeling (DCM; Friston et al., 2003; Friston et al., 2019) can help to better delineate the specific directional influence of one brain region on others in the network of circuitry.
Based on previous fMRI studies of nondrug reward receipt (Luijten et al., 2017), we hypothesized that individuals with AUD diagnoses (compared to those without AUD) would exhibit increased EC between the striatum and its cortical regulatory or salience-detection nodes in response to wins (reward receipt) in the incentive-processing task, consistent with greater recruitment of those circuits in response to reward. Given that VS activation by reward notification has correlated with increased offline delay-discounting severity (Hariri et al., 2006), as well as findings that the presence of immediate reward prospects selectively recruits VS compared to delayed reward prospects (McClure et al., 2004), we also hypothesized that greater temporal discounting on the delay discounting task (DDT) would correlate with decreased EC between the ACC and striatum, as well as DLPFC/insula and striatum compared between AUD subjects and controls on incentive-processing task wins and losses, consistent with the notion of decreased cognitive control in AUD.
MATERIALS AND METHODS
Study participants
HCP study design, recruitment, data collection, and processing procedures are detailed elsewhere (Barch et al., 2013; Glasser et al., 2013; Marcus et al., 2011; Van Essen et al., 2012, 2013). The data used in this analysis were from the HCP 1200 Subjects Data Release. Written informed consent was obtained from all participants. The experiments were performed in accordance with relevant guidelines and regulations, and data access was approved by the Virginia Commonwealth University Institutional Review Board.
Diagnostic ascertainment was performed via the Semi-Structured Assessment for the Genetics of Alcoholism (SSAGA; Bucholz et al., 1994). The overall participant selection procedure is shown in Figure 1. In brief, after applying the general exclusion criteria (Table 1; 19 exclusion criteria) to all the 1206 HCP participants, 467 participants were excluded. In the remaining 739 participants, we identified 101 participants who met DSM-IV diagnostic criteria for a lifetime AUD who were considered for inclusion in the AUD group. Of those 101 subjects with a lifetime DSM-IV AUD (i.e., abuse/dependence), we refined the sample by applying additional inclusion criteria such that they would also have to likely meet equivalent DSM-5 AUD criteria based on available symptom counts in the public HCP dataset. This included 46 participants who definitely would meet the DSM-5 AUD criteria and 32 participants who likely had DSM-5 AUD (by endorsing at least 2 of the abuse or one abuse symptom and one dependence symptom). Those that could not have met DSM-5 AUD were excluded (i.e., only 1 symptom of abuse). The remaining 638 participants were used to select the control (CON) participants. We excluded 97 participants who were reported as having two symptoms of DSM-IV abuse and/or dependence (additively) but that were ruled out for the diagnosis DSM-IV abuse or dependence based on SSAGA interview. The control selection procedure was implemented by an in-house MATLAB code with different priority weights in matching demographics, cannabis use, and smoking between the candidate CON participants and the included AUD participants (Table S1). Consequently, 78 AUD participants and 78 CON participants were matched and included in the final analytic sample. From the publicly available dataset, it was not possible to differentiate current from remote lifetime history of AUD. However, the majority of these AUD participants (n = 51, 65%) self-reported regular hazardous drinking levels; of the 51, n = 34 reported averaging at least one heavy drinking day (5+ drinks) or more per week, and another n = 17 reported 1 to 3 heavy drinking (5+ drinks) days per month within the last 12 months.
FIGURE 1.
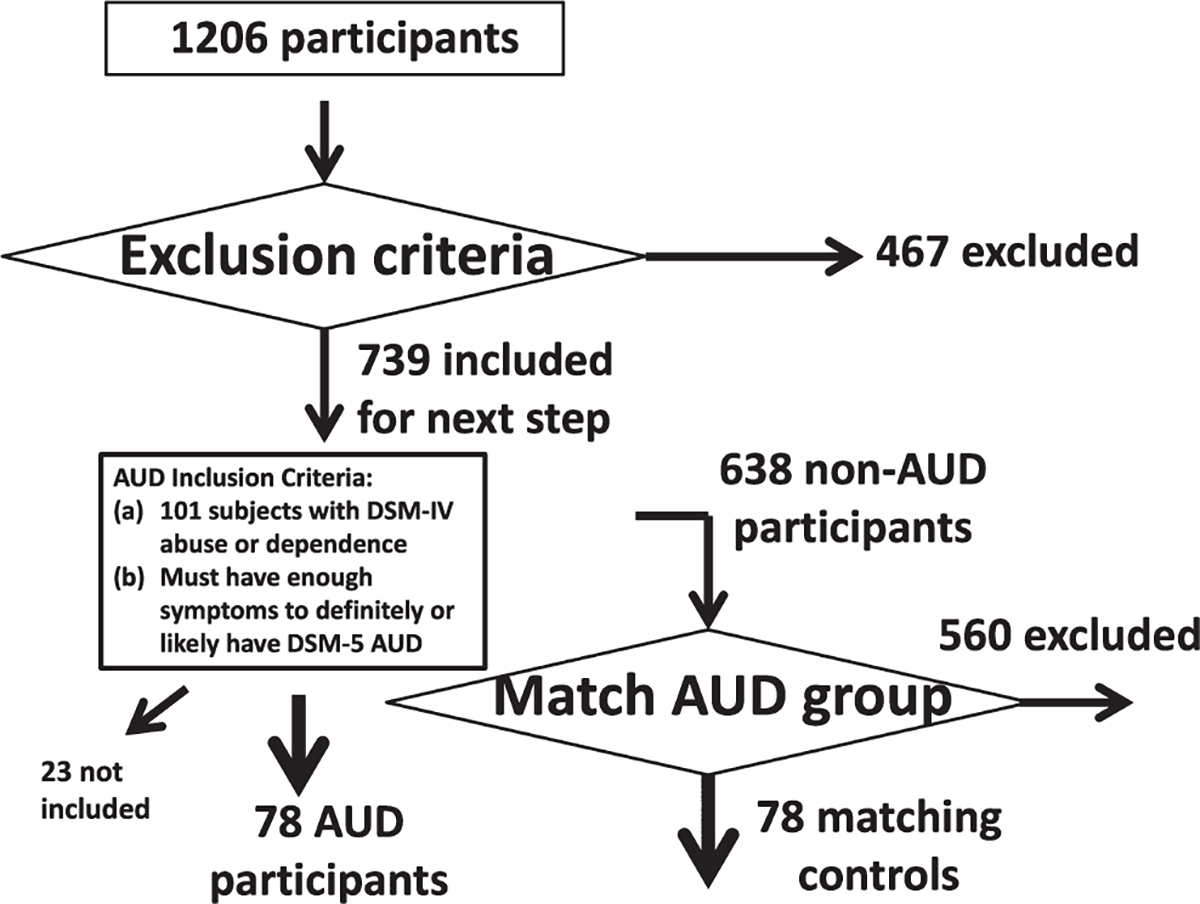
Participant selection procedure. See Table 1 and the materials and methods section for more detailed information about the matching between the AUD participants (n = 78) and the control participants (n = 78). AUD = alcohol use disorder
TABLE 1.
Participant exclusion criteria used in this study and the number of excluded participants
| Exclusion criterion | Implementation of the exclusion criterion based on HCP measurements | Number of excluded participants |
|---|---|---|
| Handedness | ||
| 1. Not right-handed | Handedness <0 | 117 |
| Diagnosis on drug addiction | ||
| 2. Meeting cannabis dependence | SSAGA_Mj_Ab_Dep = one (1) | 102 |
| 3. Meeting Fagerstrom nicotine dependence | SSAGA_FTND_Score = 4+ | 48 |
| 4. Meeting Fagerstrom tobacco dependence | SSAGA_HSI_Score = 4 | 0 |
| Times of drug use | ||
| 5. Times used cocaine more than six times | SSAGA_Times_Used_Cocaine = 5 | 15 |
| 6. Times used hallucinogens more than six times | SSAGA_Times_Used_Hallucinogens = 5 | 1 |
| 7. Times used opiates more than six times | SSAGA_Times_Used_Opiates = 5 | 8 |
| 8. Times used sedatives more than six times | SSAGA_Times_Used_Sedatives = 5 | 1 |
| 9. Times used stimulants more than six times | SSAGA_Times_Used_Stimulants = 5 | 7 |
| 10. Times used marijuana more than 999 times | SSAGA_Mj_Times_Used = 5 | 22 |
| Breath and urine test | ||
| 11. Alcohol breath test | Breathalyzer_Over_05 = "TRUE" | 1 |
| 12. Positive urine test for THC | THC = "TRUE" | 42 |
| 13. Positive urine test for cocaine | Cocaine = "TRUE" | 0 |
| 14. Positive urine test for opiates | Opiates = "TRUE" | 3 |
| 15. Positive urine test for amphetamines | Amphetamines = "TRUE" | 4 |
| 16. Positive urine test for MethAmphetamine | MethAmphetamine = "TRUE" | 1 |
| 17. Positive urine test for Oxycontin | Oxycontin = "TRUE" | 1 |
| Data availability | ||
| 18. Missing the measure of "total times used/smoked ANY | Total_Any_Tobacco_7days = space (i.e., " ") | 19 |
| TOBACCO in past 7 days" | ||
| 19. Incentive-processing task fM RI data are not complete | fMRI_Gamb_PctCompl <100% | 75 |
The exclusion criteria were applied to all the 1206 HCP participants one by one (the number in the “Exclusion criterion” column represents the order of the exclusion criteria applied), resulting 739 participants remaining for subsequent consideration after excluding 467 participants who met at least one of the 18 exclusion criteria.
fMRI incentive-processing task
The HCP used the incentive-processing task developed by Delgado and colleagues that has been shown to reliably elicit striatal and reward network activity (Delgado et al., 2000). The task is a card-guessing game with random probability of receipt of wins, losses, or neutral feedback (Barch et al., 2013; Delgado et al., 2000). During the task, the participants are shown a mystery card represented by a “?” for 1500 ms and are instructed to guess a number (an integer, ranging from 1 to 9) and press one of two buttons on a response box to indicate if the number behind the mystery card is more or less than 5 in order to win or lose money. Participants are then shown the number along with one of three different types of feedback for 1000 ms: a green up arrow with “$1” (for win trials), a red down arrow with “−$0.50” (for loss trials), or a gray double-headed arrow (for neutral trials). The intertrial interval was 1000 ms, during which a fixation cross was presented on the screen. The task includes eight blocks alternating among two mostly-win blocks, two mostly-loss blocks, and four fixation blocks (15 s/block). Importantly, unknown to the participants, win, loss, and neutral outcomes were fixed/predetermined, with card values selected after they made their selection to ensure that all participants received the same feedback in the same order. Thus, while participants believed that their earnings depended on their choices, all participants received the same amount of money at task completion.
fMRI data acquisition and preprocessing
As described in Barch et al. (2013), whole-brain gradient-echo, echo-planar fMRI imaging data were acquired with a 32-channel head coil on a modified 3T Siemens Skyra scanner, with repetition time = 720 ms, echo time = 33.1 ms, flip angle = 52°, bandwidth = 2290 Hz/pixel, in-plane field-of-view = 208 × 180 mm, 72 slices, 2.0 mm isotropic voxels, and multi-band acceleration factor of 8. Two fMRI runs, with right-to-left and left-to-right phase encodings respectively, were acquired, preprocessed, and concatenated for DCM analysis.
For preprocessing, the fMRI data used here were the “minimally” preprocessed fMRI data released by HCP (Glasser et al., 2013) that included gradient unwarping, motion correction, fieldmap-based EPI distortion correction, brain boundary–based registration of EPI to structural T1-weighted scan, nonlinear registration into standard MNI152 space, and grand mean intensity normalization. Following Hillebrandt et al. (2014), we then spatially smoothed with a 4-mm Gaussian kernel, using Statistical Parametric Mapping 12 (SPM12) software (http://www.fil.ion.ucl.ac.uk/spm/). Similar to Ma et al. (2018a), the head motion parameters were evaluated. Mean frame-wise displacement (FD; Power et al., 2012) was used to quantify head motion. The FDs (Table 2) were small for both groups and the two groups did not differ (t = 0.125, df = 154, p = 0.901).
TABLE 2.
Demographic information (i.e., age, sex, race, and education), measures of cannabis use, and tobacco usage, for the included AUD (n = 78) and matching CON (n = 78) participants
| Parameter | AUD (n = 78) | CON (n = 78) | Statistical results |
|---|---|---|---|
| Demographics | |||
| Age (years) m, SD | 29.0 ± 3.5 | 28.8 ± 3.7 | t = 0.35, df = 154, p = 0.73 |
| (22 to 36) | (22 to 35) | ||
| Sex | 35 F, 43 M | 41 F, 37 M | X2(1,202) = 0.92, p = 0.34 |
| Race | 67 White, 4 AA, 7 other | 62 White, 10 AA, 6 other | X2(2,156) = 2.84, p = 0.24 |
| Education (years) | 15.6 ± 1.4 | 15.5 ± 1.4 | t = 0.45, df = 154, p = 0.66 |
| m, SD (range) | (11 to 17) | (12 to 17) | |
| Cannabis use | |||
| Lifetime cannabis dependence? | 0 | 0 | X2(1,156) = 0, p = 1 |
| Tobacco usage | |||
| Last 7 Days tobacco use | 2.76 ± 10.17 | 2.92 ± 10.02 | t = 0.10, df = 154, p = 0.92 |
| (0 to 60) | (0 to 56) | ||
| Smoking history | Never (n = 31) | Never (n = 32) | X2(3,202) = 0.50, p = 0.92 |
| 1 to 19 times (n = 13) | 1 to 19 times (n = 10) | ||
| 20 to 99 times (n = 13) | 20 to 99 times (n = 13) | ||
| regular smoker (n = 21) | regular smoker (n = 23) | ||
| Still smoking? | 10 Yes, 68 No | 11 Yes, 67 No | X2(1,156) = 0.06, p = 0.81 |
| Fagerstrom FTND score | 0 (n = 66) | 0 (n = 70) | X2(3,202) = 1.55, p = 0.67 |
| 1 (n = 4) | 1 (n = 3) | ||
| 2 (n = 5) | 2 (n = 2) | ||
| 3 (n = 3) | 3 (n = 3) | ||
| Delay discounting | |||
| AUC for discounting of $200 (range) | 0.248 ± 0.159 (0.032 to 0.694) | 0.278 ± 0.220 (0.038 to 0.984) | t = 0.976, df = 154, p = 0.331 |
| AUC for discounting of $40,000 (range) | 0.507 ± 0.252 (0.046 to 0.977) | 0.567 ± 0.290 (0.047 to 0.969) | t = 1.379, df = 154, p = 0.170 |
| Averaged AUC for discounting of $200 and $40,000 (range) | 0.377 ± 0.189 (0.049 to 0.797) | 0.423 ± 0.233 (0.050 to 0.965) | t = 1.354, df = 154, p = 0.178 |
| NEO Personality inventory (NEO-PI) | |||
| NEO-Neuroticism | 17.22 ± 8.34 (1 to 39) | 16.91 ± 8.22 (1 to 38) | t = 0.234, df = 154, p = 0.815 |
| Alcohol usage | |||
| Total drinks in past 7 days (range) | 8.19 ± 6.60 (0 to 47) | 3.79 ± 4.72 (0 to 21) | t = 4.779, df = 153, p<.0001 |
| Drinks per drinking day in past 12 months (range) | 3.00 ± 0.96 (0 to 6) | 1.99 ± 2.31 (0 to 6) | t = 3.546, df = 153, p = 0.0005 |
| Frequency of any alcohol use in past 12 months (range; smaller number represents larger frequency) | 3.28 ± 2.95 (1 to 6) | 4.63 ± 1.50 (1 to 6) | t = 3.598, df = 153, p = 0.0004 |
| Drinks per day in heaviest 12-month period (range) | 4.51 ± 1.29 (1 to 6) | 3.31 ± 1.73 (1 to 6) | t = 4.891, df = 153, p<.0001 |
| Frequency of any alcohol use, heaviest 12-month period (range; smaller number represents larger frequency) | 1.74 ± 0.96 (1 to 5) | 3.82 ± 1.83 (1 to 6) | t = 8.844, df = 153, p<.0001 |
| Averaged Z score for SSAGA measures of alcohol use (range) | 0.400 ± 0.597 (−1.011 to 2.273) | −0.401 ± 0.592 (−1.460 to 1.070) | t = 8.387, df = 153, p<.0001 |
| Head motion during the fMRI scan | |||
| Mean frame-wise displacement (mm) | 0.158 ± 0.051 (0.088 to 0.397) | 0.157 ± 0.049 (0.079 to 0.343) | t = 0.125, df = 154, p = 0.901 |
| Proportions of larger reward or larger punishment | |||
| Proportion of larger reward | Median: 0.495 | Median: 0.5 | X2 (1,155) = 0.05, p = 0.8299 |
| IQR: 0.125 | IQR: 0.125 | ||
| Proportion of larger punishment | Median: 0.5 | Median: 0.5 | X2 (1,155) = 0.17, p = 0.6816 |
| IQR: 0.188 | IQR: 0.171 | ||
| Reaction time during the task | |||
| RT during larger reward (ms) | Median: 382 | Median: 372 | X2 (1,140) = 0.18, p = 0.6724 |
| IQR: 146 | IQR: 161 | ||
| RT during smaller reward (ms) | Median: 385 | Median: 375 | X2 (1,143) = 0.01, p = 0.9824 |
| IQR: 152 | IQR: 170 | ||
| RT during larger punishment (ms) | Median: 364 | Median: 368 | X2 (1,145) = 0.01, p = 0.961 |
| IQR: 139 | IQR: 153 | ||
| RT during smaller punishment (ms) | Median: 366 | Median: 368 | X2 (1,145) = 0.1, p = 0.7464 |
| IQR: 131 | IQR: 152 | ||
Student t and chi-square tests were used to test the group difference in continuous and category variables, respectively. Delay discounting, head motion during MRI scan, proportions of larger reward or larger punishment during the task, and RTs during the task, for the included AUD (n = 78) and match CON (n = 78) participants. Variables with normal distribution are shown using mean ±standard deviation, and variables with nonnormal distribution are shown using median and interquartile range (IQR). For these two kinds of variable, group differences were tested using Student t and Kruskal-Wallis tests, respectively. There were some NaN (i.e., not a number) in the alcohol usage and RT; therefore, the total degree of freedom was smaller than 155 when this happened. AUC, area under curve; AUD, alcohol use disorder; CON, control; m, mean; SD, standard deviation.
Self-report assessment of cumulative alcohol and tobacco use
The HCP used the SSAGA to assess recent and lifetime use of tobacco and alcohol. Similar to previous studies (Ma et al., 2020b; Orr et al., 2016) of cannabis use disorder using HCP data, we quantified alcohol consumption using a composite measure calculated from the average of the Z-scores for the following five SSAGA measures: “Total drinks in past 7 days,” “Drinks per drinking day in past 12 months,” “Frequency of any alcohol use in past 12 months,” “Drinks per day in heaviest 12-month period,” and “Frequency of any alcohol use, heaviest 12-month period.” Such a composite measure reflects the cumulative effects of recent and/or past alcohol use (Orr et al., 2016). Tobacco use could be similarly quantified (Orr et al., 2016). However, among the four SSAGA measures used by Orr et al. (2016), only one measure “Total times used/smoked any tobacco in past 7 days” was completely available for the participants included in this study. We used this measure to evaluate tobacco use.
Behavioral impulsivity measures
The DDT served as a measure of behavioral impulsivity in the HCP (Barch et al., 2013; Petker et al., 2019). In each trial of this task, participants were asked to indicate whether they would prefer to receive a smaller immediate reward (e.g., $100) today or a larger delayed reward in the future. In one block, the larger delayed reward in all choices/trials was $200. In the other block (counterbalanced order between subjects), the larger delayed reward was $40,000. Within each magnitude block, the delay in time to receipt of the later reward was kept fixed (i.e., 1, 6 months, 1, 3, 6, and 10 years), and the reward amounts were titrated based on participants’ choices until points of indifference were determined (Petker et al., 2019). Based upon responses during the DDT, two area under the curve (AUC) of indifference points across delays were calculated for each participant, one for each of the two magnitude blocks (Myerson et al., 2001). With the DDT, a smaller AUC is indicative of greater impulsivity. Typically, participants discount large rewards less severely than more modest rewards in within-subject comparisons, perhaps recruiting more top-down neurocircuitry (Johnson & Bickel, 2002). Use of two magnitude conditions thus afforded examination of EC during higher stakes (more reflective) vs lower stakes (less reflective) choices. In this study, the impulsivity was measured using the mean of the AUCs during both $200 and $40,000.
Statistical analyses
We conducted typical univariate analyses to test whether the two groups were different in delay-discounting behavior and in brain activation during the number-guessing task. For discounting behavior, we performed a mixed model repeated-measures ANOVA of discounting AUC, with group as the between-subjects factor and delayed magnitude (block) as the within-subject factor. The brain activations were also used to functionally localize the nodes to be used for DCM (please see below).
SPM univariate analysis:
In the first-level univariate statistical analysis, the two fMRI runs were included in the model as two sessions. Despite the block design of this task, individual (i.e., win, loss, and neutral) trial outcome events were available and individually modeled in the univariate analysis as well as the subsequent DCM analysis (see below). Following the HCP “Task-fMRI 3T Imaging Protocol Details” (https://protocols.humanconnectome.org/HCP/3T/task-fMRI-protocol-details.html) which specified that researchers can also use the E-Prime data files to generate the potential event-related contrasts (including the task-fMRI data used in this study), we analyzed the fMRI data with an event-related design in order to compare the win, loss, and neutral trials. Specifically, after specifying the design matrix, the parameters for the effects of different conditions were estimated at the first level for all participants as an event-related design according to the general linear model at each voxel, using stick functions modeling the onsets of win, loss, and neutral trials convolved with the SPM12 canonical hemodynamic response function as a basis function. Following (Barch et al., 2013), the fMRI data were high-pass filtered with a cutoff period of 200 s. Activations were defined as the contrasts of win–(minus) neutral, loss–neutral, and win–loss. For each of these three contrast images, an SPM12 second-level two-sample t-test was conducted to measure the differences in regional activation between groups.
To determine the DCM nodes and similar to Van de Steen et al. (2020), an SPM12 second-level (group level) conjunction analysis (Friston et al., 2005) was conducted to identify brain areas that were activated in common for the win–neutral and loss–neutral contrast images across both groups combined. In addition, SPM12 second-level one-sample t-tests for the win–neutral, loss–neutral, and win–loss contrasts were conducted. For all second-level analyses, the cluster-defining threshold was p = 0.001; statistical significance was defined as family-wise error (FWE) corrected cluster probability (p) < (less than) 0.050 (two-tail).
DCM:
fMRI-based DCM is a biophysical model of how the neuronal connectivity generates the observed fMRI signal (Friston et al., 2003, 2019). DCM has been described in detail elsewhere (Friston et al., 2003; Ma et al., 2012, 2014, 2020b). In brief, DCM is a dynamical system of bilinear differential state equations with coefficients (in units of Hz). A node in the model that receives driving input is the brain region which first experiences a task-elicited change in neuronal activity. This node then influences other nodes. The endogenous connectivity measures the EC strengths between nodes, regardless of the moment-to-moment switching on and off of inputs. Experimental conditions can modulate the endogenous connectivities. The parameters of the modulation effects quantify increased or decreased connectivity strength compared to the endogenous ECs.
Following Ma et al. (2020b), a parametric regressor called “All-visual-stimuli” (reflecting common features of the win, loss, and neutral stimuli) was used as a single driving input to the DCM, and two parametric regressors called “win–neutral” and “loss–neutral” were used as two putative modulators of EC. Here, the changes of ECs corresponding to the win–neutral modulator (relative to the endogenous ECs) are termed as win modulatory EC. By definition, a win-modulated EC reflects the change in EC corresponding to the win trials minus the change in EC corresponding to the neutral trials. The loss-modulated EC was similarly defined. Reward-modulated EC and loss-modulated EC represent the primary metrics of connectivity considered in this report, as they conceptually represent the “net effects” of reward and loss outcomes (respectively, vs. the neutral outcomes) on interregional information flow. Note, the reward-modulated/loss-modulated ECs were relative to the endogenous ECs, measures the EC strengths between nodes, regardless of the moment-to-moment switching on and off of inputs (i.e., win, loss, and neutral stimuli).
Candidate a priori DCM nodes:
The DCM nodes (ROIs) were determined in two steps. In Step 1, before looking at the brain activation results, some candidate nodes were selected based on studies investigating the reward circuit in primates and humans (see Haber & Knutson, 2010 for review), neurocircuitry underlying the neurobiology of addiction (Koob & Volkow, 2016), and relevant fMRI studies reviewed in the introduction. These a priori selected candidate DCM nodes were as follows: DLPFC, ACC, insula, parietal cortex, amygdala, ventral striatum (VS), and dorsal striatum (DS). In Step 2, we further determined whether or not a candidate region should be selected as a final region based on the actual brain activation results found in this study (i.e., if the putative region empirically showed up as part of the brain activations specific to the participants), and if so where the DCM node (a sphere) should be placed within the final region (the center of the sphere was located at the maximum significance of the brain activation within the final region). Right DLPFC, right ACC, right insula, right VS (nucleus accumbens), and right DS (caudate) were selected as the five final DCM nodes. Given the relatively large sample size, five nodes were selected because preliminary analyses showed that the computation time was reasonable for a five-node network. With the increase in the number of nodes, the time needed for the DCM analysis increases quadratically (Seghier & Friston, 2013). The five nodes were all within the right hemisphere because of the findings of stronger activations (in terms of size and/or strength) on the right hemisphere (see Results).
The spatial extent of each brain structure for DCM node placement (i.e., ACC, DLPFC, insula, VS, and DS) was determined using the anatomical automatic labeling (AAL3) atlas (Rolls et al., 2020). In AAL3, the anatomical descriptions corresponding to these five nodes were ACC (supracallosal part), middle frontal gyrus (MFG), insula, nucleus accumbens, and caudate nucleus, respectively. Since the MFG is a large brain region, the MFG was further constrained by the DLPFC functional connectivity network from Neurosynth. org meta-analyses. Each DCM node was defined as a 5-mm-radius sphere centered at the local maximum (z value) within each brain region in the activation found in this study (see Figure 2 for the location of these nodes). For each participant, the same nodes were initialized (see Table S2 for the MNI coordinates) but were slightly repositioned based on that participant’s local activation maxima (see Table S2 for the MNI coordinates of the repositioned DCM nodes). With the motion parameters (x, y, and z translations and rotations) as the covariates, the principal eigenvariate was extracted from each DCM node and used as a summary of the time series for that DCM node.
FIGURE 2.
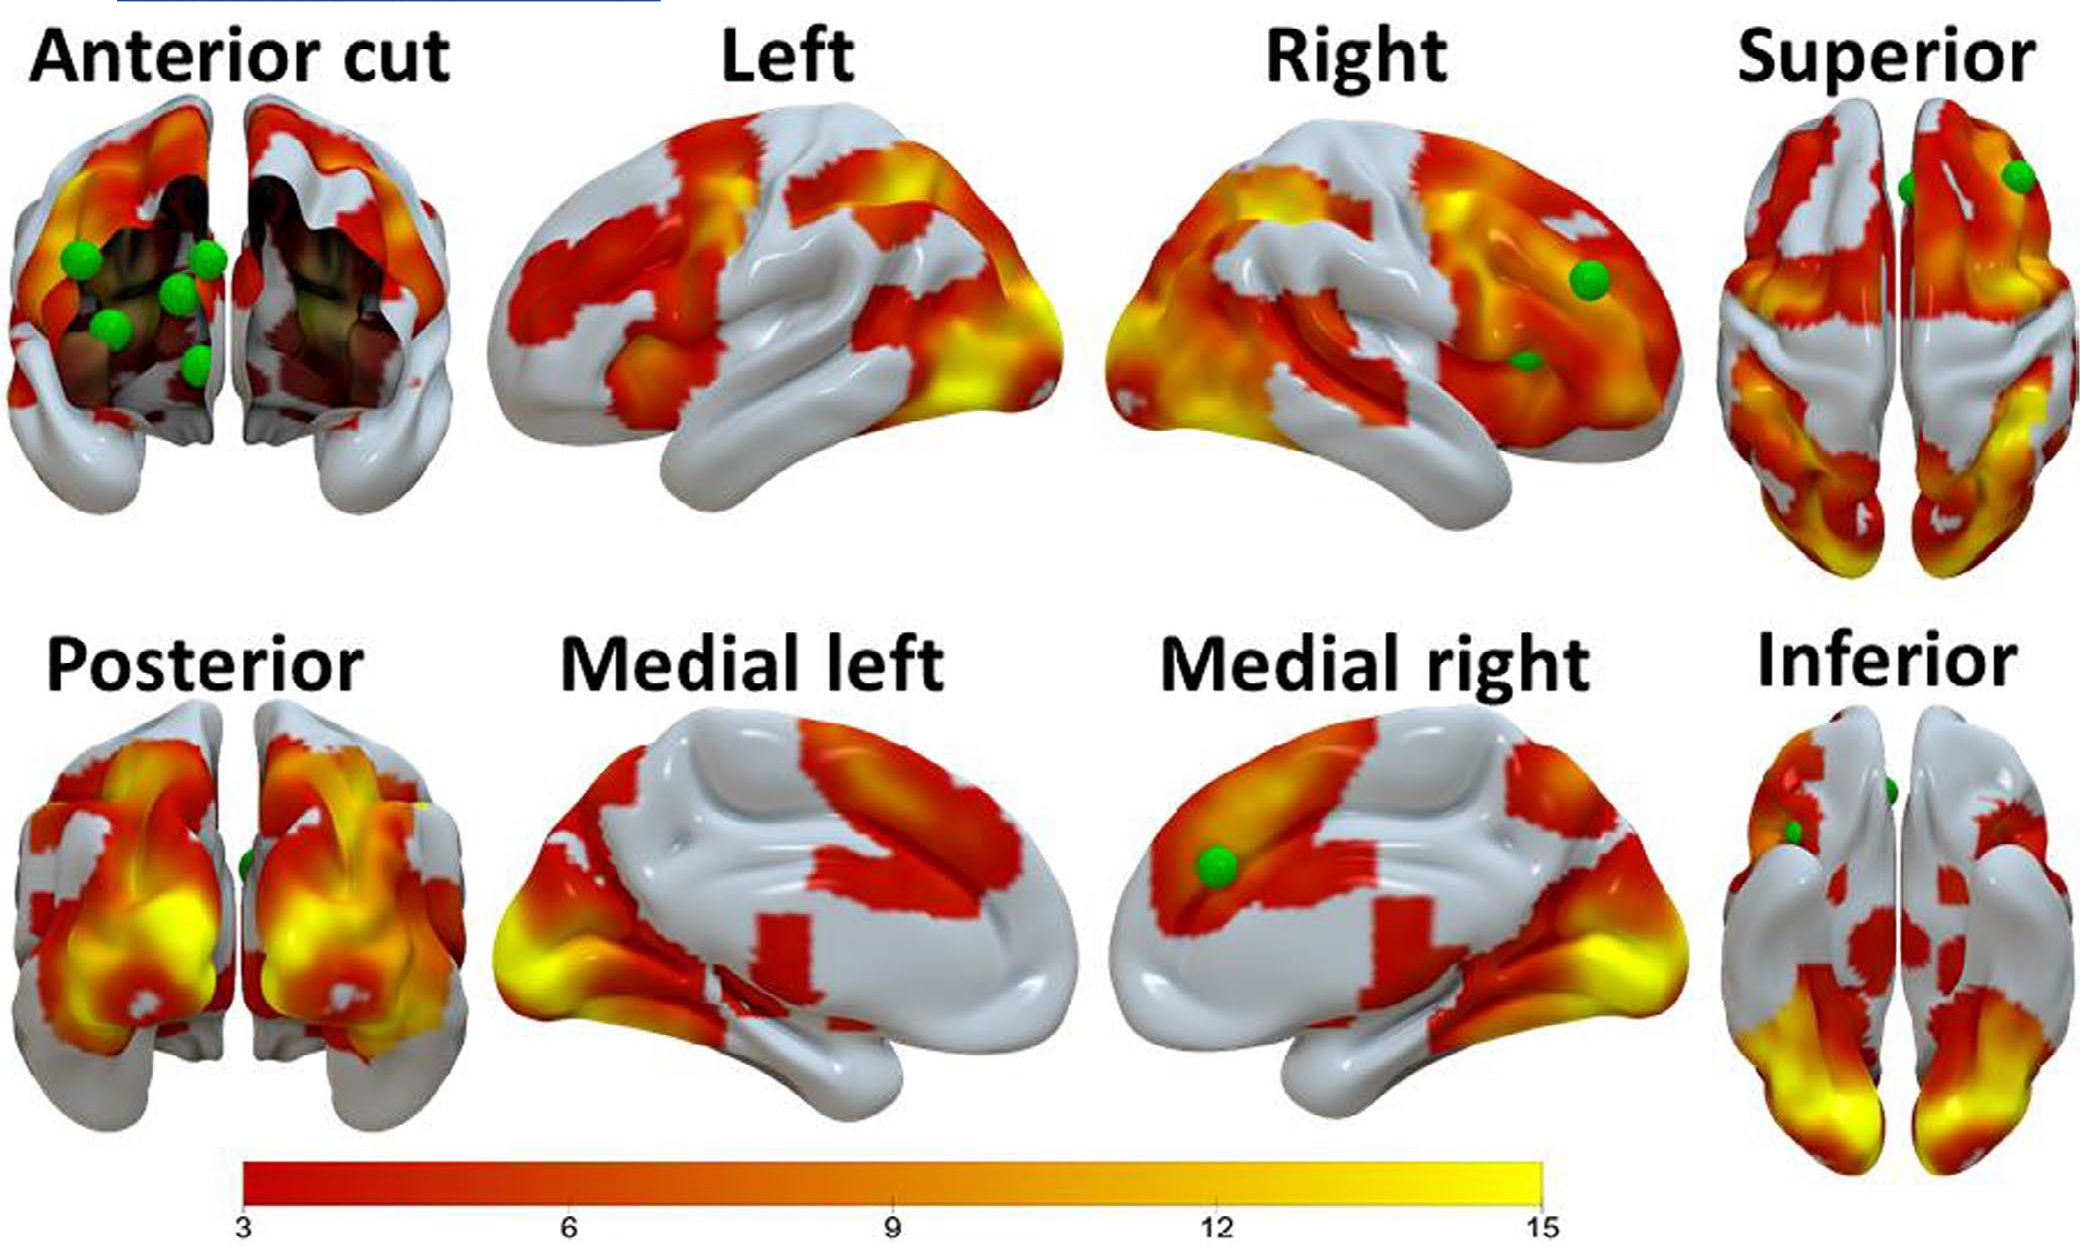
The brain activation clusters (i.e., activation common for the win–neutral and loss–neutral contrast images) found by the conjunction analysis when the two groups were combined (n = 202), with cluster-defining threshold p = 0.001 and cluster-level p < 0.05 (FWE corrected, two-tail). These brain activations, depicted using the Surf Ice software (https://www.nitrc.org/plugins/mwiki/index.php/surfice:MainPage), were used to constrain the a priori selected ACC, DLPFC, INS, and DS DCM nodes (green spheres). The VS DCM node was constrained by the activation clusters found by the SPM one-sample t-test for the win-loss contrast image (Table S3; Figure S1), and this node is shown here for demonstration purpose. Scale on the color bar represents voxel t values. ACC = anterior cingulate cortex, DLPFC = dorsolateral prefrontal cortex, INS = insula, VS = ventral striatum, DS = dorsal striatum
DCM parametric empirical Bayesian (PEB) analysis:
The PEB approach (Friston et al., 2016) as implemented in SPM12 (Revision 7771) was used to conduct group-level analyses for the EC modulatory changes, as follows: (i) testing each modulatory EC against zero in the CON group; (ii) testing the group differences in each modulatory EC between the two groups; and (iii) testing the linear relationship between each modulatory EC and other measures of interest (e.g., delay-discounting impulsivity (averaged between both delayed reward magnitude conditions), and alcohol usage). Specifically, the function “spm_dcm_peb_fit” was used to iteratively reestimate all the single subject DCMs, each time setting the priors on the connectivity parameters to the group average (as determined using spm_dcm_peb). The function “spm_dcm_peb” was used to perform a group-level analysis, which specified a hierarchical model with DCMs at the subject level and a GLM at the group level.
The advantage of the linear regression analysis within the PEB framework is that the covariance among all DCM parameters in the model is automatically taken into consideration. PEB uses Bayesian posterior inference (Friston & Penny, 2003) in which posterior probability (Bayesian-PP) is used as an indicator of the confidence in whether a modulatory EC in a group is different from zero (or different compared to another group) or the confidence in the degree of the linear relationship between variables. The Bayesian-PP (0 ≤ Bayesian-PP ≤ 1) is the conditional probability that is computed by PEB using Bayes rule after the available information (the likelihood function and the prior probability density of the model’s parameters) is taken into account (Friston & Penny, 2003). The higher the Bayesian-PP, the greater the confidence. In this paper, an EC finding was considered reliable if Bayesian-PP > 0.95 (corresponding to a Bayes factor of 3). Bayesian posterior inference during the PEB analyses eschews the multiple comparison problem because of the lack of false positives (Friston et al., 2003; Friston & Penny, 2003; Van Overwalle et al., 2019). Specifically, the PP of an EC, given the data, is the same, irrespective of whether all the ECs in the same DCM were analyzed or not (Friston & Penny, 2003). This is implemented by using independent prior distributions for different ECs (Friston & Penny, 2003).
RESULTS
AUD versus CON group comparisons of self-report and behavioral measures
As shown in Table 2, there were no differences in demographics, cannabis use, tobacco usage, delay discounting, head motion during the fMRI scans, incidence of reward or loss during the task, and reaction times (RTs) during the task, between the AUD (n = 78) and the CON (n = 78) groups. AUC for $200 rewards and for $40,000 rewards correlated within-subject (Spearman r = 0.69, p < 0.0001). Repeated-measures ANOVA of delay-discounting behavior revealed a main effect of delayed reward magnitude, with significantly reduced discounting of a delayed presentation of $40,000 relative to delayed presentation of $200, F (1, 200) = 393.838, p < 0.0001. However, this was evident in both groups, where the group × magnitude interaction was not significant (p > 0.40). There was no main effect of group (p = 0.35). As expected based upon their diagnostic status, participants with AUD had a greater averaged Z score (Table 2: t = 4.245, df = 200, p < 0.0001) for SSAGA measures of alcohol use compared to CON participants.
Univariate analysis of contrast-elicited BOLD response in AUD and CON groups
SPM two-sample t-test analyses showed no statistically significant differences (FWE corrected cluster p > 0.100, two-tail) in simple linear contrasts of task outcome-elicited activation (i.e., win–neutral, loss–neutral, and win–loss) between the two groups, thus supporting our plan to localize nodes for DCM based on the second-level map of the combined groups. When the two groups were combined (n = 156), the group-level analyses found several statistically significant (FWE corrected two-tail cluster-level p < 0.001) activation clusters. Among these clusters, the ACC, DLPFC, insula, and DS DCM nodes were constrained by the activation clusters (i.e., activation common for the win–neutral and loss–neutral contrast images) found by the conjunction analysis (Figure 2; Table S3); and the VS DCM node was constrained by the activation clusters found by the SPM one-sample t-test for the win-loss contrast image (Table S4; Figure S1).
In order to test if the task-related activation was associated with the impulsivity measure, three second-level SPM multiple regression analyses have been conducted. In each of these analyses, the covariate was the mean of the AUCs during delay discounting of $200 and $40,000, and the contrast image was one of the three contrasts, that is, the win > neutral, loss > neutral, and win > loss contrasts. None of these three analyses found clusters in which the activation significantly correlated with the mean AUC (and thus impulsivity; cluster-level family-wise error corrected p > 0.598, two-tail).
DCM PEB analysis
AUD versus CON group comparisons
The group differences in each EC between AUD and CON participants and corresponding Bayesian-PP, together with the ECs and corresponding Bayesian-PP found in the CON group, are shown in Table 3 and Figure 3. During the win trials (Table 3; Figure 3, the second panel from left in the top row), compared to the CON group, the task outcome–related modulatory EC change in the AUD group was smaller (PP = 1) in 12 ECs (including the ECs from ACC to the other four nodes, i.e., ACC → DS EC, ACC → VS EC, ACC → insula EC, and ACC → DLPFC EC) and greater (PP = 1) in 12 ECs (including the ECs from insula to the other four nodes, and from DLPFC to the other four nodes, such as insula → DLPFC EC, insula → DS EC, insula → VS EC, and insula → ACC EC and the DS to DS self-connection EC). During the loss trials (Table 3; Figure 3, the second panel from left in the bottom row), compared to the CON group, the AUD group was smaller (PP = 1) in six ECs and greater (PP = 1) in seven ECs. The major results were preserved when the average of the two delay-discounting measures) was included as a covariate of no interest (Table S5).
TABLE 3.
The results of the group-level DCM PEB analyses testing group differences
| Connectivity | EC during win trials in CON participants (n = 78) |
EC during loss trials in CON participants (n = 78) |
Group difference: AUD (n = 78) minus CON (n = 78) during win trials |
Group difference: AUD (n = 78) minus CON (n = 78) during loss trials |
||||
|---|---|---|---|---|---|---|---|---|
| EC (Hz) | PP | EC (Hz) | PP | EC (Hz) | PP | EC (Hz) | PP | |
| ACC→ACC | −0.5408 | 1 | 0.0000 | 0 | 1.7302 | 1 | 0.0000 | 0 |
| ACC→DLPFC | 0.6773 | 1 | 0.4274 | 1 | −0.4434 | 1 | −0.4215 | 1 |
| ACC→INS | 0.5788 | 1 | 0.4597 | 1 | −0.8016 | 1 | 0.0000 | 0 |
| ACC→VS | 1.2611 | 1 | −0.2755 | 1 | −1.8763 | 1 | 0.6925 | 1 |
| ACC→DS | 0.7493 | 1 | −0.4721 | 1 | −1.6705 | 1 | 0.8203 | 1 |
| DLPFC→ACC | 0.7222 | 1 | 0.0000 | 0 | 0.5900 | 1 | 0.0000 | 0 |
| DLPFC→DLPFC | −1.1105 | 1 | 0.4634 | 1 | 0.9510 | 1 | −0.5329 | 0.9977 |
| DLPFC→INS | 0.1337 | 0.9010 | 0.0000 | 0 | 0.6658 | 1 | 0.0000 | 0 |
| DLPFC→VS | 0.4381 | 1 | −0.2195 | 1 | 0.3917 | 0.9999 | 0.0000 | 0 |
| DLPFC→DS | 0.7117 | 1 | −0.1474 | 0.9645 | 0.6061 | 1 | 0.0000 | 0 |
| INS→ACC | −1.1938 | 1 | 0.2609 | 1 | 1.6673 | 1 | −0.2874 | 0.9829 |
| INS→DLPFC | −1.6660 | 1 | 0.0000 | 0 | 2.2710 | 1 | 0.0000 | 0 |
| INS→INS | 1.4251 | 1 | 1.0215 | 1 | −1.4825 | 1 | 0.0000 | 0 |
| INS→VS | −1.6724 | 1 | 0.7314 | 1 | 2.1241 | 1 | −1.2240 | 1 |
| INS→DS | −1.5618 | 1 | 0.4263 | 1 | 1.7601 | 1 | −0.6604 | 1 |
| VS→ACC | 0.0000 | 0 | 0.0000 | 0 | −0.3574 | 1 | 0.0000 | 0 |
| VS→DLPFC | −0.2943 | 1 | 0.0000 | 0 | −0.3404 | 1 | 0.5618 | 1 |
| VS→INS | −0.5604 | 1 | 0.5193 | 1 | 0.2902 | 0.9989 | −0.3860 | 1 |
| VS→VS | 1.0636 | 1 | 0.0000 | 0 | −1.1193 | 1 | 0.5670 | 1 |
| VS→DS | −0.5931 | 1 | 0.6382 | 1 | 0.0000 | 0 | 0.0000 | 0 |
| DS→ACC | −0.2943 | 1 | 0.0000 | 0 | −0.8865 | 1 | 0.5709 | 1 |
| DS→DLPFC | 0.0000 | 0 | 0.1525 | 0.9923 | −0.4526 | 1 | 0.0000 | 0 |
| DS→INS | −0.2280 | 1 | 0.0000 | 0 | −0.4784 | 1 | 0.4112 | 1 |
| DS→VS | −0.3454 | 1 | 0.0000 | 0 | −0.8792 | 1 | 0.3446 | 1 |
| DS→DS | 0.5090 | 1 | 0.4633 | 1 | 0.5144 | 0.9988 | 0.0000 | 0 |
ACC, anterior cingulate cortex; DCM, dynamic causal modeling; DLPFC, dorsolateral prefrontal cortex; DS, dorsal striatum; EC, effective connectivity; INS, insula; L, left; PEB, parametric empirical Bayesian; PP, posterior probability; R, right; VS, ventral striatum.
FIGURE 3.
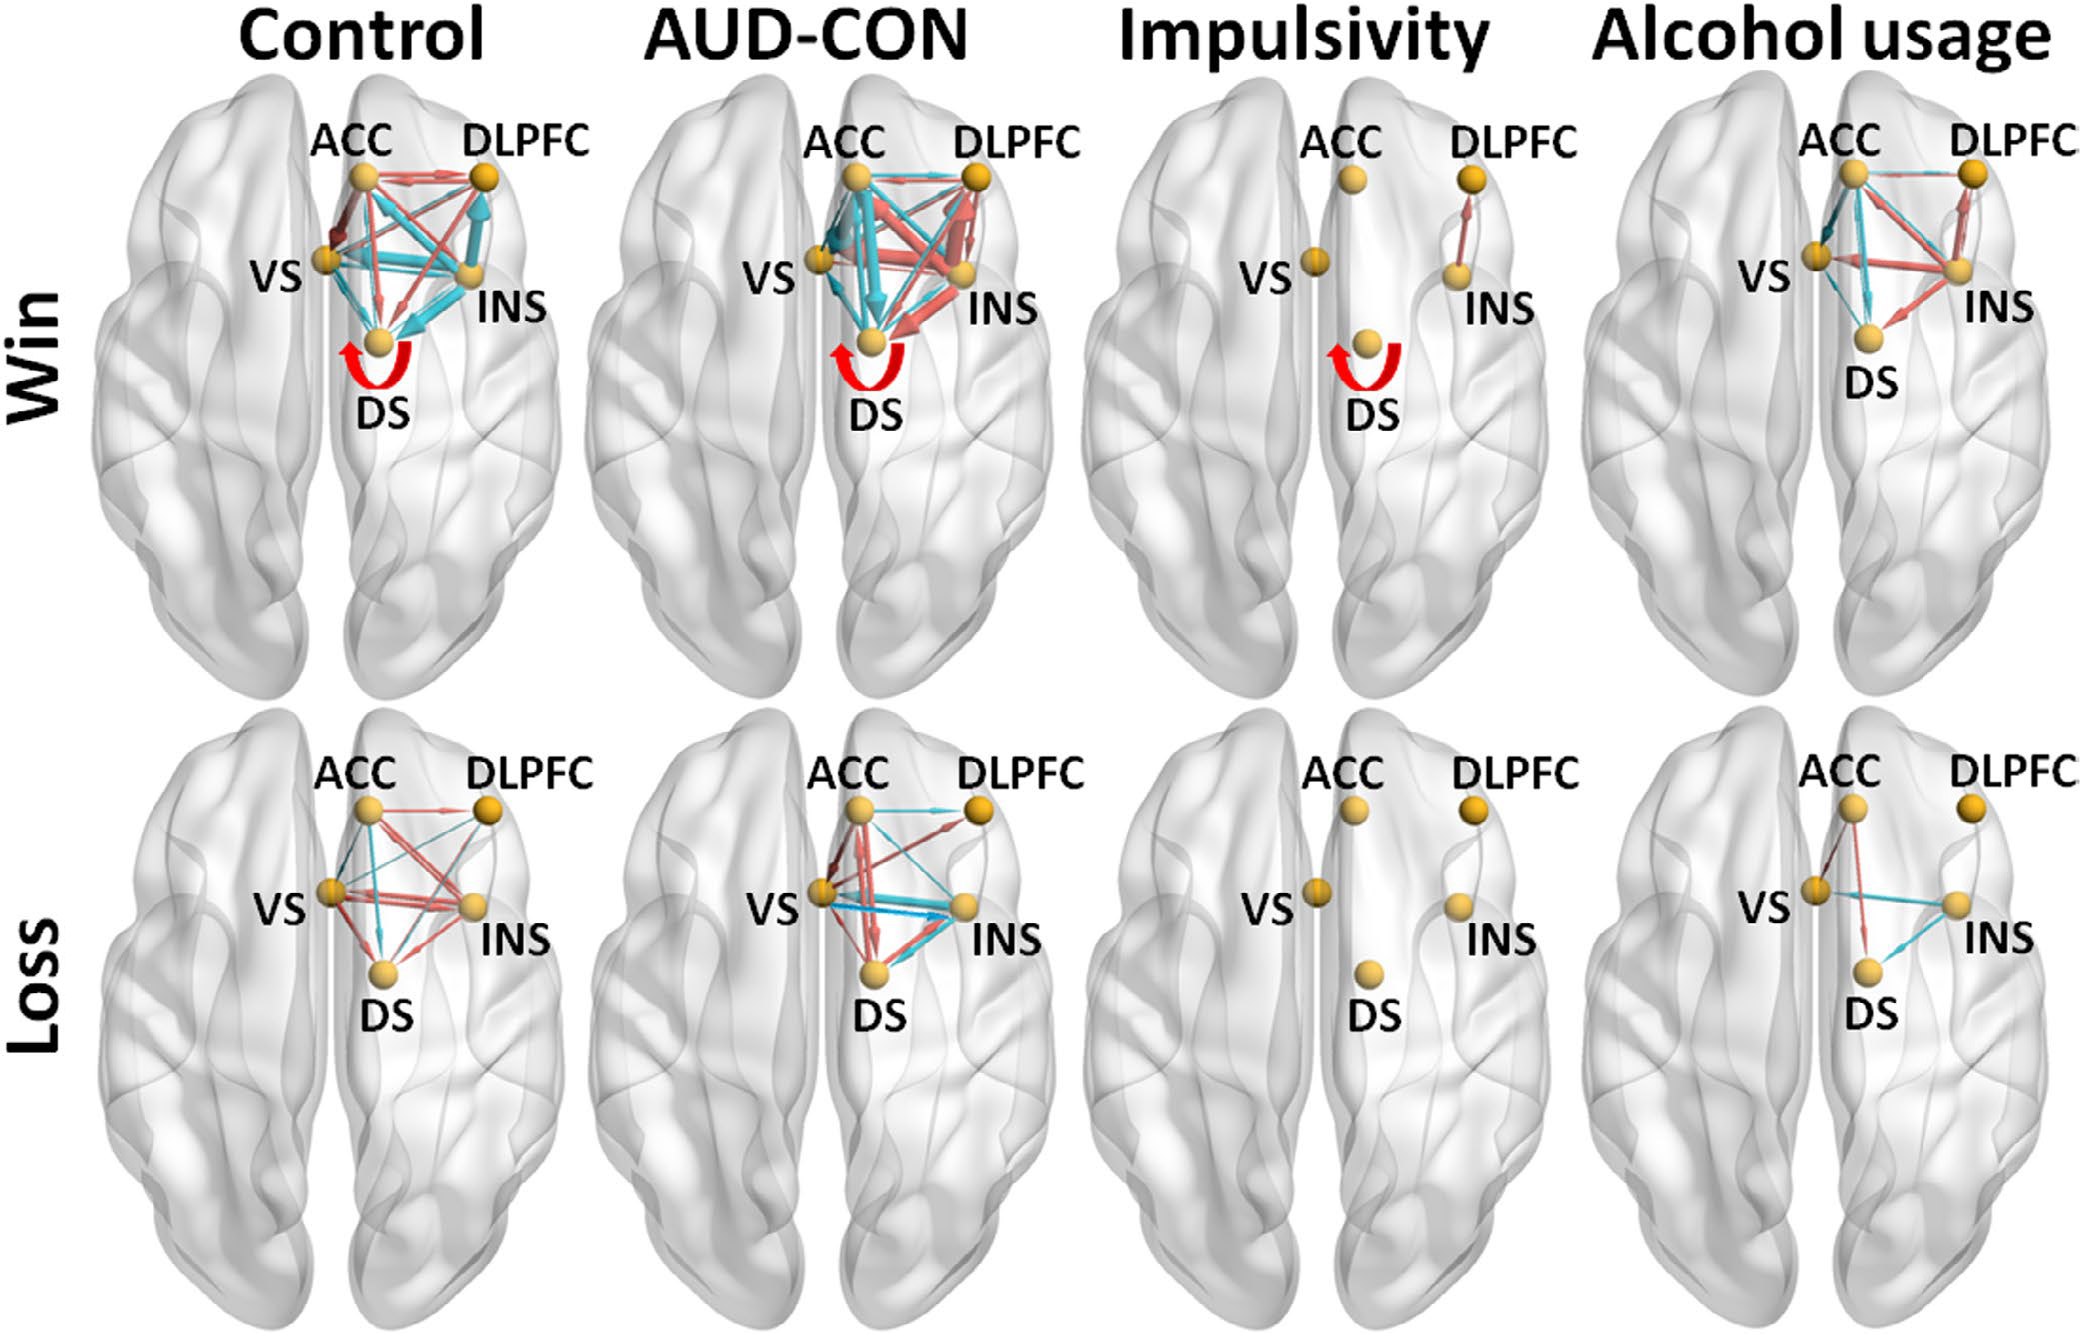
The main results of the analyses of group comparison in effective connectivities (ECs) and the analyses of the linear regression between ECs and impulsivity and cumulative alcohol usage during win trials (top panels) and Loss trials (bottom panels), visualized with the BrainNet Viewer (http://www.nitrc.org/projects/bnv/) (Xia et al., 2013). For the group comparisons, lines with arrows representing if ECs were different from zero in the Control group (n = 78, posterior probability [PP] > 0.95, left panels) or the group difference (AUD [n = 78] minus CON [n = 78], PP > 0.95, the second panels from left) in ECs. A red line denotes that an EC was greater than zero in the Control group (left panels) or greater in the AUD group than the CON group (the second panels from left); and a blue line denotes that an EC was smaller than zero in the Control group (left panels) or smaller in the Alcohol group than the Control group (the second panels from left). Line width is proportional to the EC strength. For the linear regression analyses (across all participants, n = 156), lines with arrows representing if ECs showed linear relationship with the impulsivity (PP > 0.95, the third panels from left) or the cumulative alcohol usage (PP > 0.95, the right panels). A red line denotes that an EC showed positive linear relationship with the impulsivity (the third panels from left) or cumulative alcohol use (the right panels); and a blue line denotes that an EC showed negative linear relationship with the impulsivity (third panels from left) or the cumulative alcohol usage (the right panels). Line width is proportional to the linear regression coefficient. A self-connection EC is depicted with a curved arrow. For simplicity, only the self-connection EC (i.e., DS to DS EC) showing a positive linear relationship with impulsivity is depicted here. AUD = alcohol use disorder, CON = control, ACC = anterior cingulate cortex, DLPFC = dorsolateral prefrontal cortex, INS = insula, VS = ventral striatum, DS = dorsal striatum
Relationships between each win or loss modulated EC and impulsivity
Linear regression analysis examining associations between EC and behavioral impulsivity under the average of the two delayed reward magnitude conditions were conducted in the total sample combining AUD and CON participants (Table S6). During win trials, greater insula to DLPFC EC (insula → DLPFC) and greater DS to DS EC (DS → DS) were associated with smaller AUC (therefore associated with greater impulsivity; PPs = 1; Table S6; Figure 3, the third panel from left in the top row). No other ECs (during both win and loss trials, Table S6) showed reliable linear relationships with the average AUC (PP < 0.68). Note, insula → DLPFC and DS → DS ECs (during win trials) was found to be greater in the AUD compared to CON participants in the above group comparison analysis.
Relationships between each EC and cumulative alcohol usage
Regression analysis examining associations between EC and cumulative alcohol use was conducted in the total sample combining AUD and CON participants (Table S6). During win trials, eight ECs (including the ECs from insula to the other four nodes, i.e., the insula → DLPFC EC, insula → DS EC, insula → VS EC, and insula → ACC EC; Figure 3, right panel in the top row) showed positive linear relationships with cumulative alcohol use (PPs = 1), and these ECs were found to be greater in the AUD compared to CON participants in the above group comparison analysis. In addition, insula → DLPFC EC was found to show positive linear relationship with the impulsivity measure. Also, during win trials, eight ECs (including the ECs from ACC to the other four nodes, i.e., the ACC → DS EC, ACC → VS EC, ACC → insula EC, and ACC → DLPFC EC; Figure 3, right panel in the top row) showed negative linear relationships with the cumulative alcohol use (PPs = 1), and these ECs were found to be smaller in the AUD compared to CON participants in the above group comparison analysis. During loss trials, two ECs (i.e., the ACC → DS EC and ACC → VS EC; Figure 3, right panel in the bottom row) showed positive linear relationships with cumulative alcohol use (PPs = 1), and these two ECs were found to show negative linear relationships (i.e., inverse pattern) with cumulative alcohol use during the win trials and to be greater in the AUD compared to CON participants (during the loss trials) in the above group comparison analysis. Also, during loss trials, two ECs (i.e., the insula → DS EC and insula → VS EC, right panel in the bottom row) showed negative linear relationships with cumulative alcohol use (PPs = 1), and these two ECs were found to show positive linear relationships (i.e., inverse pattern) with cumulative alcohol use during the win trials and to be smaller in the AUD compared to CON participants (during the loss trials) in the above group comparison analysis.
DISCUSSION
To our knowledge, this is the first study to examine EC during a reward sensitivity type task in AUD. Contrary to what we hypothesized based on previous studies and meta-analysis of reward processing in AUD and addictive disorders, we found bidirectional differences in cortical-striatal EC between individuals with and without AUD with regard to reward receipt (“wins”), showing a pattern of decreased bidirectional EC between ACC and striatal regions (VS and DS), increased EC from VS to INS, increased EC from INS to VS and DS, and increased EC from DLPFC to VS and DS in AUD compared to CON participants. Furthermore, we found that EC from the INS to DLPFC and also the DS to DS self-connection correlated with impulsive decision making regarding high (but not low) hypothetical rewards, and EC from the ACC and INS to all other nodes correlated with cumulative alcohol use in AUD. These results point to disrupted corticostriatal EC in both “top-down” and “bottom-up” pathways among individuals with AUD. Notably, in group comparison, all ECs from ACC to the other four nodes were smaller in the AUD group than the control group; all ECs from insula to the other four nodes were greater in the AUD group than the control group and all ECs from DLPFC to the other four nodes were greater in the AUD group than the control group.
Our results (in controls) comport with those of another DCM analysis of HCP reward task time series datasets of controls (Van de Steen et al., 2020), which utilized a slightly different set of a priori network nodes. Notably, both analyses detected five ECs in common during win trials (i.e., INS to ACC EC, DS to VS EC, INS to INS EC, VS to VS EC, and DS to DS EC) and two ECs during loss trials (INS to INS EC, and DS to DS EC). This suggests that these EC changes driven by reward and loss experiences are largely robust across specific localizations of nodes and other analytical choices, as well as across potential subsets of neurotypical participants.
We found decreased ECs between ACC and VS and ACC and DS during “wins” in AUD compared to CON participants. These ECs were somewhat correlated with metrics of cumulative alcohol exposure, possibly representing changes associated with damage or harmful allostatic neuroplasticity from heavy drinking. Given the more pronounced difference in these EC between AUD and CON subjects, it could also represent a premorbid risk signature of impaired top-down control of motivational neurocircuitry that pervades many dual-process models of addiction risk, wherein frontocortical executive circuitry fails to regulate striatal and other limbic generators of approach to substances of abuse (Bickel et al., 2019; Jentsch & Taylor, 1999). Thus, there may be predisposing differences in these EC as well as concomitant effects from heavy drinking, but we cannot separate or causally infer this from a cross-sectional study. Notably, the ACC is heavily implicated in cognitive control, and specifically error monitoring and conflict resolution (Ridderinkhof et al., 2004). To the extent that resting state EC reflects propensity for information flow irrespective of task or cognitive demand engagement, it stands to reason that chronically blunted top-down frontocortical signaling to emotion and motivational circuitry could play a role in disordered alcohol use. Abnormalities in both ACC recruitment during executive tasks (McTeague et al., 2017) and in ACC gray matter (Goodkind et al., 2015) are characteristic of most mental illnesses, fostering theories that impaired top-down control is a transdiagnostic marker of psychiatric disorders. An additional but related role of the ACC is in the detection and initial cognitive processing of external events, as a key node of the salience network (SN; Peters et al., 2016). This loosely suggests that the lower ACC to VS in AUD may primarily index a cognitive control abnormality.
Given that the finding of reduced EC during wins was bidirectional (i.e., VS to ACC EC was also blunted), this likely reflects reduced salience of the nonalcohol reward (wins) in subjects with AUD compared to controls. The reduced VS to ACC EC demonstrates that comparatively, subjects with AUD have reduced “bottom up” processing in the SN in response to nonalcohol rewards compared to controls, in addition to the “top down” deficits noted. This finding is consistent with a reward deficit and/or reinforcement learning hypothesis of AUD.
Similarly, blunted ACC to DS connectivity (bidirectionally) was also characteristic of AUD participants during wins, as with ACC to VS EC, this EC also inversely correlated with increased cumulative drinking exposure among AUD participants. This could possibly represent the increasingly evidenced transition in chronic addiction from VS-mediated substance use that is primarily motivated by ventromedial orbitofrontal cortex-mediated instrumental goals and action-outcome associations to compulsive DS-mediated use that becomes automatized over time and is driven by stimulus-response-conditioned associations (Everitt & Robbins, 2016). The lower ACC signaling to DS in participants with greater cumulative alcohol exposure may represent harmful neuroplastic effects of alcohol, which contribute to more automatized cue-elicited drinking behavior as well as further loss of control. Conversely, VS-driven signaling may have contributed to disordered drinking that was still primarily instrumentally driven, such as negatively reinforced drinking to terminate aversive mood states.
We controlled for impulsivity as a covariate of interest in group-difference analyses, a post hoc analysis, to determine whether group differences in top-down ACC to VS connectivity were more a marker of greater decision-based impulsivity in AUD (Bjork et al., 2004) than a feature of addiction or heavy alcohol exposure. Controlling for impulsivity did not eliminate the AUD group decrement in this connectivity. We also examined reaction time during task response as a covariate perhaps representing more directly reward-driven impulsivity, but it was not a significant moderator of EC (not shown). Top-down connectivity involving these structures has already been implicated in seminal fMRI studies of intertemporal choice, which have shown that VS is selectively recruited by the potential for an immediate reward (McClure et al., 2004) and that the mesofrontal cortex is selectively activated by the subjective value of deferred rewards (Kable & Glimcher, 2007).
In group comparison, the DS to DS self-connection EC was greater in the AUD group than the CON group. This EC was associated with greater impulsivity but not the cumulative alcohol usage, consistent with the role of DS in impulsivity (Kim & Im, 2019). Self-connection EC was reported only recently (Ma et al., 2020a; Van de Steen et al., 2020; Zeidman et al., 2019). According to Zeidman et al. (2019), the greater the self-connection, the more self-inhibited the region (i.e., less sensitive to the inputs from other nodes in the modeled network). In contrast, increased EC from the INS to the DLPFC was associated with both impulsivity and cumulative alcohol exposure, suggesting that perhaps this circuitry is involved in alcohol-induced impulsivity, a toxic neuroplasticity effect; however, this study is not designed to discern that causally. Increased functional connectivity between the INS and DLPFC has been found to correlate positively with compulsive drinking history in recovered AUD subjects, which may be related to changes in control over cue-elicited craving (Strosche et al., 2021). Additionally, there have been similar findings with INS and DLPFC connectivity in cocaine addiction (Cisler et al., 2013).
ECs between the INS and VS showed bidirectional increased EC between AUD and controls with wins, but bidirectional decreased EC with losses. An animal study (Parkes et al., 2015) showed that insula and VS are part of a circuit mediating the retrieval of outcome values and the subsequent choice between goal-directed actions based on those values. Specifically, the communication between the insula and VS is necessary for the retrieval of incentive value (Parkes et al., 2015). A DCM study in humans (Cho et al., 2013) suggested that insula may provide the VS with information about drive (from interoceptive signals) and opportunity (from exteroceptive signals), respectively, for incentive processing. While it is unclear what the lower VS to insula EC with losses represents, based on the Cho et al. (2013) study, the greater insula to VS EC could reflect perceived enhanced opportunity (triggered by win signals) in the AUD participants.
The DLPFC to VS EC was greater in the AUD participants than the CON participants during wins. Similar connectivity abnormalities have been observed in other addictive disorders (Contreras-Rodríguez et al., 2016; Hu et al., 2015; Wang et al., 2019; Yip et al., 2019). A previous DCM study (Ballard et al., 2011) has shown that DLPFC is the entry point of information about reward and that anticipated reward can enhance the ECs from DLPFC to VS and VTA. The greater DLPFC to VS EC could suggest that when exposed to reward stimuli, it may be easier to initialize motivated behavior in the AUD individuals. Alternatively, both DLPFC and ACC are key regions for executive control and the group differences in the ECs from the DLPFC to the two striatal regions were in the inverse pattern with those from the ACC. Given the similar behavioral performance between the two groups, the ECs from the DLPFC to the two striatal regions could reflect a compensatory mechanism. The role of DLPFC in alcoholism has been previously discussed (Fein & Cardenas, 2015).
There are several limitations to this study. AUD diagnoses and alcohol- and drug-related variables were assessed via self-report with the SSAGA, which is reliable and valid for assessing AUD (https://cogastudy.org/ssaga-i-and-ssaga-ii-information), but available diagnoses in the public dataset were limited mostly to DSM-IV. AUD participants were neither clinically referred/interviewed nor recruited by virtue of their alcohol use, and AUD diagnostic status was based upon a lifetime history of AUD (current versus lifetime history data were not released with the public dataset). However, many of the AUD subjects self-reported hazardous drinking within the last 12 months suggesting they had some degree of recent symptomatology. Regarding the fMRI analyses, the modeled neuronal network is relatively small, but this was necessitated by computational constraints in DCM that have been discussed in Ma et al. (2018b). Additionally, the DCM nodes used in this study were a priori selected from previously established brain networks and constrained by the actual sample-specific brain activations. Thus, it is possible that other altered neural connectivities were not identified because the connecting regions were not included as DCM nodes. Lastly, the cross-sectional (as opposed to longitudinal) design of the study makes it impossible to discern between what EC alterations are truly predisposing to AUD and which develop in response to repeated exposure to heavy drinking.
CONCLUSIONS
We observed differences in corticostriatal EC as a function of AUD diagnostic status, with AUD individuals (compared to CON). The results of this study corroborate previous reports of functional connectivity abnormalities in AUD and take these findings one step further showing putative directional relationships. Additionally, the ECs corresponding to reward sensitivity were discernable from those of impulsive choice and appear to be distinct, with both being altered in AUD. Our study lends further support for a neurobiological model of AUD that includes impaired “top-down” control, as well as aberrant “bottom-up” salience signaling. Since this was a cross-sectional analysis, we cannot discern whether observed EC abnormalities were a premorbid risk factor for AUD, a toxic effect of cumulative alcohol exposure or both, only longitudinal studies such as the Adolescent Brain Cognitive Development study (Bjork et al., 2017) can disentangle these potential causes.
Supplementary Material
ACKNOWLEDGMENTS
Data were provided by the Human Connectome Project, WU-Minn Consortium (Principal Investigators: David Van Essen and Kamil Ugurbil; 1U54MH091657) funded by the 16 NIH Institutes and Centers that support the NIH Blueprint for Neuroscience Research; and by the McDonnell Center for Systems Neuroscience at Washington University. Additionally: UL1TR002649 (F.G.M.) and R01AA024466 (A.J.A.).
Funding information
NIH, Grant/Award Number: 1U54MH091657; McDonnell Center for Systems Neuroscience; National Center for Advancing Translational Sciences, Grant/Award Number: UL1TR002649; National Institute on Alcohol Abuse and Alcoholism, Grant/Award Number: R01AA024466
CONFLICT OF INTEREST
Drs. Arias, Ma, Bjork, Snyder, Hammond, and Mr. Zhou have no conflicts of interests or financial disclosures. Dr. Moeller reports grant funding from and consulting to Indivior and consulting for AstraZeneca, Astellas, and Boehringer Ingelheim.
Footnotes
SUPPORTING INFORMATION
Additional supporting information may be found online in the Supporting Information section.
REFERENCES
- Andrews MM, Meda SA, Thomas AD, Potenza MN, Krystal JH, Worhunsky P et al. (2011) Individuals family history positive for alcoholism show functional magnetic resonance imaging differences in reward sensitivity that are related to impulsivity factors. Biological Psychiatry, 69, 675–683. [DOI] [PMC free article] [PubMed] [Google Scholar]
- Ballard IC, Murty VP, Carter RM, Macinnes JJ, Huettel SA & Adcock RA (2011) Dorsolateral prefrontal cortex drives mesolimbic dopaminergic regions to initiate motivated behavior. Journal of Neuroscience, 31, 10340–10346. [DOI] [PMC free article] [PubMed] [Google Scholar]
- Barch DM, Burgess GC, Harms MP, Petersen SE, Schlaggar BL, Corbetta M et al. (2013) Function in the human connectome: task-fMRI and individual differences in behavior. NeuroImage, 80, 169–189. [DOI] [PMC free article] [PubMed] [Google Scholar]
- Beck A, Schlagenhauf F, Wustenberg T, Hein J, Kienast T, Kahnt T et al. (2009) Ventral striatal activation during reward anticipation correlates with impulsivity in alcoholics. Biological Psychiatry, 66, 734–742. [DOI] [PubMed] [Google Scholar]
- Bickel WK, Athamneh LN, Basso JC, Mellis AM, Dehart WB, Craft WH et al. (2019) Excessive discounting of delayed reinforcers as a trans-disease process: update on the state of the science. Current Opinion in Psychology, 30, 59–64. [DOI] [PMC free article] [PubMed] [Google Scholar]
- Bickel WK, Miller ML, Yi R, Kowal BP, Lindquist DM & Pitcock JA (2007) Behavioral and neuroeconomics of drug addiction: competing neural systems and temporal discounting processes. Drug and Alcohol Dependence, 90(Suppl. 1), S85–S91. [DOI] [PMC free article] [PubMed] [Google Scholar]
- Bjork JM (2020) The ups and downs of relating nondrug reward activation to substance use risk in adolescents. Current Addiction Reports, 7, 421–429. [DOI] [PMC free article] [PubMed] [Google Scholar]
- Bjork JM, Hommer DW, Grant SJ & Danube C (2004) Impulsivity in abstinent alcohol-dependent patients: relation to control subjects and type 1-/type 2-like traits. Alcohol, 34, 133–150. [DOI] [PubMed] [Google Scholar]
- Bjork JM, Smith AR & Hommer DW (2008) Striatal sensitivity to reward deliveries and omissions in substance dependent patients. NeuroImage, 42, 1609–1621. [DOI] [PMC free article] [PubMed] [Google Scholar]
- Bjork JM, Smith AR, Chen G & Hommer DW (2012) Mesolimbic recruitment by nondrug rewards in detoxified alcoholics: effort anticipation, reward anticipation, and reward delivery. Human Brain Mapping, 33, 2174–2188. [DOI] [PMC free article] [PubMed] [Google Scholar]
- Bjork JM, Straub LK, Provost RG & Neale MC (2017) The ABCD study of neurodevelopment: identifying neurocircuit targets for prevention and treatment of adolescent substance abuse. Current Treatment Options in Psychiatry, 4, 196–209. [DOI] [PMC free article] [PubMed] [Google Scholar]
- Blum K, Braverman ER, Holder JM, Lubar JF, Monastra VJ, Miller D et al. (2000) Reward deficiency syndrome: a biogenetic model for the diagnosis and treatment of impulsive, addictive, and compulsive behaviors. Journal Psychoactive Drugs, 32. 10.1080/02791072.2000.10736099 [DOI] [PubMed] [Google Scholar]
- Bucholz KK, Cadoret R, Cloninger CR, Dinwiddie SH, Hesselbrock VM, Nurnberger JI Jr. et al. (1994) A new, semi-structured psychiatric interview for use in genetic linkage studies: a report on the reliability of the SSAGA. Journal of Studies on Alcohol, 55, 149–158. [DOI] [PubMed] [Google Scholar]
- Bush G, Vogt BA, Holmes J, Dale AM, Greve D, Jenike MA et al. (2002) Dorsal anterior cingulate cortex: a role in reward-based decision making. Proceedings of the National Academy of Sciences of the United States of America, 99, 523–528. [DOI] [PMC free article] [PubMed] [Google Scholar]
- Castellanos-Ryan N, Rubia K & Conrod PJ (2011) Response inhibition and reward response bias mediate the predictive relationships between impulsivity and sensation seeking and common and unique variance in conduct disorder and substance misuse. Alcoholism, Clinical and Experimental Research, 35, 140–155. [DOI] [PubMed] [Google Scholar]
- Cho YT, Fromm S, Guyer AE, Detloff A, Pine DS, Fudge JL et al. (2013) Nucleus accumbens, thalamus and insula connectivity during incentive anticipation in typical adults and adolescents. NeuroImage, 66, 508–521. [DOI] [PMC free article] [PubMed] [Google Scholar]
- Cisler JM, James GA, Tripathi S, Mletzko T, Heim C, Hu XP et al. (2013) Differential functional connectivity within an emotion regulation neural network among individuals resilient and susceptible to the depressogenic effects of early life stress. Psychological Medicine, 43, 507–518. [DOI] [PubMed] [Google Scholar]
- Contreras-Rodríguez O, Albein-Urios N, Vilar-López R, Perales JC, Martínez-Gonzalez JM, Fernández-Serrano MJ et al. (2016) Increased corticolimbic connectivity in cocaine dependence versus pathological gambling is associated with drug severity and emotion-related impulsivity. Addiction Biology, 21, 709–718. [DOI] [PubMed] [Google Scholar]
- Dawe S, Gullo MJ & Loxton NJ (2004) Reward drive and rash impulsiveness as dimensions of impulsivity: implications for substance misuse. Addictive Behaviors, 29, 1389–1405. [DOI] [PubMed] [Google Scholar]
- Delgado MR (2007) Reward-related responses in the human striatum. Annals of the New York Academy of Sciences, 1104, 70–88. [DOI] [PubMed] [Google Scholar]
- Delgado MR, Locke HM, Stenger VA & Fiez JA (2003) Dorsal striatum responses to reward and punishment: effects of valence and magnitude manipulations. Cognitive, Affective, & Behavioural Neuroscience, 3, 27–38. [DOI] [PubMed] [Google Scholar]
- Delgado MR, Nystrom LE, Fissell C, Noll DC & Fiez JA (2000) Tracking the hemodynamic responses to reward and punishment in the striatum. Journal of Neurophysiology, 84, 3072–3077. [DOI] [PubMed] [Google Scholar]
- Dick DM, Smith G, Olausson P, Mitchell SH, Leeman RF, Omalley SS & et al.(2010) Understanding the construct of impulsivity and its relationship to alcohol use disorders. Addiction Biology, 15, 217–226. [DOI] [PMC free article] [PubMed] [Google Scholar]
- Everitt BJ & Robbins TW (2016) Drug addiction: updating actions to habits to compulsions ten years on. Annual Review of Psychology, 67, 23–50. [DOI] [PubMed] [Google Scholar]
- Fein G & Cardenas VA (2015) Neuroplasticity in human alcoholism: studies of extended abstinence with potential treatment implications. Alcohol Research, 37, 125–141. [PMC free article] [PubMed] [Google Scholar]
- Friston KJ, Harrison L & Penny W (2003) Dynamic causal modelling. NeuroImage, 19, 1273–1302. [DOI] [PubMed] [Google Scholar]
- Friston KJ, Litvak V, Oswal A, Razi A, Stephan KE, Van Wijk BC et al. (2016) Bayesian model reduction and empirical Bayes for group (DCM) studies. NeuroImage, 128, 413–431. [DOI] [PMC free article] [PubMed] [Google Scholar]
- Friston KJ & Penny W (2003) Posterior probability maps and SPMs. NeuroImage, 19, 1240–1249. [DOI] [PubMed] [Google Scholar]
- Friston KJ, Penny WD & Glaser DE (2005) Conjunction revisited. NeuroImage, 25, 661–667. [DOI] [PubMed] [Google Scholar]
- Friston KJ, Preller KH, Mathys C, Cagnan H, Heinzle J, Razi A et al. (2019) Dynamic causal modelling revisited. NeuroImage, 199, 730–744. [DOI] [PMC free article] [PubMed] [Google Scholar]
- Glasser MF, Sotiropoulos SN, Wilson JA, Coalson TS, Fischl B, Andersson JL et al. (2013) The minimal preprocessing pipelines for the Human Connectome Project. NeuroImage, 80, 105–124. [DOI] [PMC free article] [PubMed] [Google Scholar]
- Goodkind M, Eickhoff SB, Oathes DJ, Jiang Y, Chang A, Jones-Hagata LB et al. (2015) Identification of a common neurobiological substrate for mental illness. JAMA Psychiatry, 72, 305–315. [DOI] [PMC free article] [PubMed] [Google Scholar]
- Haber SN & Knutson B (2010) The reward circuit: linking primate anatomy and human imaging. Neuropsychopharmacology, 35, 4–26. [DOI] [PMC free article] [PubMed] [Google Scholar]
- Hariri AR, Brown SM, Williamson DE, Flory JD, De Wit H & Manuck SB (2006) Preference for immediate over delayed rewards is associated with magnitude of ventral striatal activity. Journal of Neuroscience, 26, 13213–13217. [DOI] [PMC free article] [PubMed] [Google Scholar]
- Hillebrandt H, Friston KJ & Blakemore SJ (2014) Effective connectivity during animacy perception–dynamic causal modelling of Human Connectome Project data. Scientific Reports, 4, 6240. [DOI] [PMC free article] [PubMed] [Google Scholar]
- Hu Y, Salmeron BJ, Gu H, Stein EA & Yang Y (2015) Impaired functional connectivity within and between frontostriatal circuits and its association with compulsive drug use and trait impulsivity in cocaine addiction. JAMA Psychiatry, 72, 584–592. [DOI] [PubMed] [Google Scholar]
- Jentsch JD & Taylor JR (1999) Impulsivity resulting from frontostriatal dysfunction in drug abuse: implications for the control of behavior by reward-related stimuli. Psychopharmacology (Berl), 146, 373–390. [DOI] [PubMed] [Google Scholar]
- Johnson MW & Bickel WK (2002) Within-subject comparison of real and hypothetical money rewards in delay discounting. Journal of the Experimental Analysis of Behavior, 77, 129–146. [DOI] [PMC free article] [PubMed] [Google Scholar]
- Kable JW & Glimcher PW (2007) The neural correlates of subjective value during intertemporal choice. Nature Neuroscience, 10, 1625–1633. [DOI] [PMC free article] [PubMed] [Google Scholar]
- Kamarajan C, Rangaswamy M, Tang Y, Chorlian DB, Pandey AK, Roopesh BN et al. (2010) Dysfunctional reward processing in male alcoholics: an ERP study during a gambling task. Journal of Psychiatric Research, 44, 576–590. [DOI] [PMC free article] [PubMed] [Google Scholar]
- Kim B & Im HI (2019) The role of the dorsal striatum in choice impulsivity. Annals of the New York Academy of Sciences, 1451, 92–111. [DOI] [PubMed] [Google Scholar]
- Koob GF & Le Moal M (2008) Addiction and the brain antireward system. Annual Review of Psychology, 59, 29–53. [DOI] [PubMed] [Google Scholar]
- Koob GF & Volkow ND (2016) Neurobiology of addiction: a neurocircuitry analysis. Lancet Psychiatry, 3, 760–773. [DOI] [PMC free article] [PubMed] [Google Scholar]
- Kwako LE, Schwandt ML, Ramchandani VA, Diazgranados N, Koob GF, Volkow ND et al. (2019) Neurofunctional domains derived from deep behavioral phenotyping in alcohol use disorder. American Journal of Psychiatry, 176, 744–753. [DOI] [PMC free article] [PubMed] [Google Scholar]
- Luijten M, Schellekens AF, Kuhn S, Machielse MW & Sescousse G (2017) Disruption of reward processing in addiction: an image-based meta-analysis of functional magnetic resonance imaging studies. JAMA Psychiatry, 74, 387–398. [DOI] [PubMed] [Google Scholar]
- Ma L, Hettema JM, Cousijn J, Bjork JM, Steinberg JL, Keyser-Marcus L et al. (2020a) Resting-state directional connectivity and anxiety and depression symptoms in adult cannabis users. Biological Psychiatry: Cognitive Neuroscience and Neuroimaging, 6, 545–555. [DOI] [PMC free article] [PubMed] [Google Scholar]
- Ma L, Steinberg JL, Hasan KM, Narayana PA, Kramer LA & Moeller FG (2012) Working memory load modulation of parieto-frontal connections: evidence from dynamic causal modeling. Human Brain Mapping, 33, 1850–1867. [DOI] [PMC free article] [PubMed] [Google Scholar]
- Ma L, Steinberg JL, Hasan KM, Narayana PA, Kramer LA & Moeller FG (2014) Stochastic dynamic causal modeling of working memory connections in cocaine dependence. Human Brain Mapping, 35, 760–778. [DOI] [PMC free article] [PubMed] [Google Scholar]
- Ma L, Steinberg JL, Bjork JM, Keyser-Marcus L, Vassileva J, Zhu M et al. (2018a) Fronto-striatal effective connectivity of working memory in adults with cannabis use disorder. Psychiatry Research: Neuroimaging, 278, 21–34. [DOI] [PMC free article] [PubMed] [Google Scholar]
- Ma L, Steinberg JL, Cunningham KA, Bjork JM, Lane SD, Schmitz JM et al. (2018b) Altered anterior cingulate cortex to hippocampus effective connectivity in response to drug cues in men with cocaine use disorder. Psychiatry Research: Neuroimaging, 271, 59–66. [DOI] [PMC free article] [PubMed] [Google Scholar]
- Ma L, Steinberg JL, Bjork JM, Wang Q, Hettema JM, Abbate A et al. (2020b) Altered effective connectivity of central autonomic network in response to negative facial expression in adults with cannabis use disorder. Biological Psychiatry: Cognitive Neuroscience and Neuroimaging, 5, 84–96. [DOI] [PMC free article] [PubMed] [Google Scholar]
- Marcus D, Harwell J, Olsen T, Hodge M, Glasser M, Prior F et al. (2011) Informatics and data mining tools and strategies for the human connectome project. Frontiers in Neuroinformatics, 5, 1–12. 10.3389/fninf.2011.00004 [DOI] [PMC free article] [PubMed] [Google Scholar]
- Mcclure SM, Laibson DI, Loewenstein G & Cohen JD (2004) Separate neural systems value immediate and delayed monetary rewards. Science, 306, 503–507. [DOI] [PubMed] [Google Scholar]
- Mcteague LM, Huemer J, Carreon DM, Jiang Y, Eickhoff SB & Etkin A (2017) Identification of common neural circuit disruptions in cognitive control across psychiatric disorders. American Journal of Psychiatry, 174, 676–685. [DOI] [PMC free article] [PubMed] [Google Scholar]
- Myerson J, Green L & Warusawitharana M (2001) Area under the curve as a measure of discounting. Journal of the Experimental Analysis of Behavior, 76, 235–243. [DOI] [PMC free article] [PubMed] [Google Scholar]
- Orr JM, Paschall CJ & Banich MT (2016) Recreational marijuana use impacts white matter integrity and subcortical (but not cortical) morphometry. NeuroImage Clinical, 12, 47–56. [DOI] [PMC free article] [PubMed] [Google Scholar]
- Parkes SL, Bradfield LA & Balleine BW (2015) Interaction of insular cortex and ventral striatum mediates the effect of incentive memory on choice between goal-directed actions. Journal of Neuroscience, 35, 6464–6471. [DOI] [PMC free article] [PubMed] [Google Scholar]
- Peters SK, Dunlop K & Downar J (2016) Cortico-striatal-thalamic loop circuits of the salience network: a central pathway in psychiatric disease and treatment. Frontiers in Systems Neuroscience, 10, 104. [DOI] [PMC free article] [PubMed] [Google Scholar]
- Petker T, Owens MM, Amlung MT, Oshri A, Sweet LH & Mackillop J (2019) Cannabis involvement and neuropsychological performance: findings from the Human Connectome Project. Journal of Psychiatry and Neuroscience, 44, 414–422. [DOI] [PMC free article] [PubMed] [Google Scholar]
- Power JD, Barnes KA, Snyder AZ, Schlaggar BL & Petersen SE (2012) Spurious but systematic correlations in functional connectivity MRI networks arise from subject motion. NeuroImage, 59, 2142–2154. [DOI] [PMC free article] [PubMed] [Google Scholar]
- Radoman M, Crane NA, Gorka SM, Weafer J, Langenecker SA, De Wit H et al. (2021) Striatal activation to monetary reward is associated with alcohol reward sensitivity. Neuropsychopharmacology, 46, 343–350. [DOI] [PMC free article] [PubMed] [Google Scholar]
- Ridderinkhof KR, Ullsperger M, Crone EA & Nieuwenhuis S (2004) The role of the medial frontal cortex in cognitive control. Science, 306, 443–447. [DOI] [PubMed] [Google Scholar]
- Rolls ET, Huang CC, Lin CP, Feng J & Joliot M (2020) Automated anatomical labelling atlas 3. NeuroImage, 206, 116189. [DOI] [PubMed] [Google Scholar]
- Seghier ML & Friston KJ (2013) Network discovery with large DCMs. NeuroImage, 68, 181–191. [DOI] [PMC free article] [PubMed] [Google Scholar]
- Sherman L, Steinberg L & Chein J (2018) Connecting brain responsivity and real-world risk taking: Strengths and limitations of current methodological approaches. Developmental Cognitive Neuroscience, 33, 27–41. [DOI] [PMC free article] [PubMed] [Google Scholar]
- Staudinger MR, Erk S & Walter H (2011) Dorsolateral prefrontal cortex modulates striatal reward encoding during reappraisal of reward anticipation. Cerebral Cortex, 21, 2578–2588. [DOI] [PubMed] [Google Scholar]
- Strosche A, Zhang X, Kirsch M, Hermann D, Ende G, Kiefer F et al. (2021) Investigation of brain functional connectivity to assess cognitive control over cue-processing in Alcohol Use Disorder. Addiction Biology, 26, e12863. [DOI] [PubMed] [Google Scholar]
- Van De Steen F, Krebs RM, Colenbier N, Almgren H & Marinazzo D (2020) Effective connectivity modulations related to win and loss outcomes. NeuroImage, 207, 116369. [DOI] [PubMed] [Google Scholar]
- Van Essen DC, Smith SM, Barch DM, Behrens TE, Yacoub E, Ugurbil K & et al. (2013) The WU-Minn Human Connectome Project: an overview. NeuroImage, 80, 62–79. [DOI] [PMC free article] [PubMed] [Google Scholar]
- Van Essen DC, Ugurbil K, Auerbach E, Barch D, Behrens TE, Bucholz R et al. (2012) The Human Connectome Project: a data acquisition perspective. NeuroImage, 62, 2222–2231. [DOI] [PMC free article] [PubMed] [Google Scholar]
- Van Overwalle F, Van De Steen F & Marien P (2019) Dynamic causal modeling of the effective connectivity between the cerebrum and cerebellum in social mentalizing across five studies. Cognitive, Affective, & Behavioural Neuroscience, 19, 211–223. [DOI] [PubMed] [Google Scholar]
- Wang Y, Yan K-J, Fan C-X, Luo X-N & Zhou Y (2019) Altered functional connectivity of the nucleus accumbens subdivisions in amphetamine-type stimulant abusers: a resting-state fMRI study. BMC Neuroscience, 20, 66. [DOI] [PMC free article] [PubMed] [Google Scholar]
- Yip SW, Scheinost D, Potenza MN & Carroll KM (2019) Connectome-based prediction of cocaine abstinence. The American Journal of Psychiatry, 176, 156–164. [DOI] [PMC free article] [PubMed] [Google Scholar]
- Zeidman P, Jafarian A, Corbin N, Seghier ML, Razi A, Price CJ et al. (2019) A guide to group effective connectivity analysis, part 1: first level analysis with DCM for fMRI. NeuroImage, 200, 174–190. [DOI] [PMC free article] [PubMed] [Google Scholar]
Associated Data
This section collects any data citations, data availability statements, or supplementary materials included in this article.