Keywords: eicosanoids, fibrosis, lipoxygenase, macrophage, metabolism
Abstract
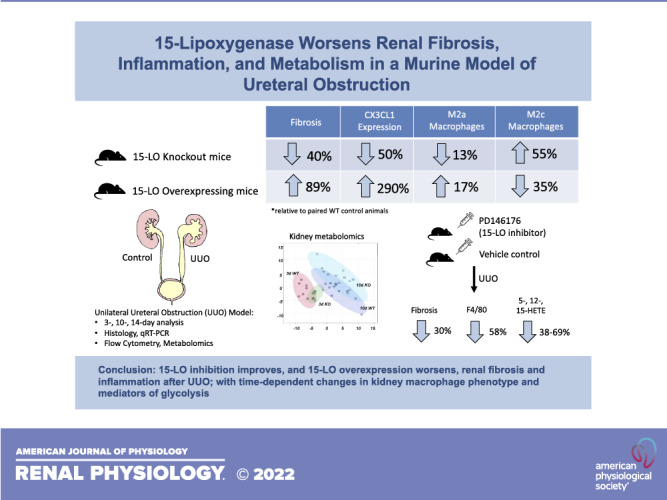
15-Lipoxygenase (15-LO) is a nonheme iron-containing dioxygenase that has both pro- and anti-inflammatory roles in many tissues and disease states. 15-LO is thought to influence macrophage phenotype, and silencing 15-LO reduces fibrosis after acute inflammatory triggers. The goal of the present study was to determine whether altering 15-LO expression influences inflammation and fibrogenesis in a murine model of unilateral ureteral obstruction (UUO). C57BL/6J mice, 15-LO knockout (Alox15−/−) mice, and 15-LO transgenic overexpressing (15LOTG) mice were subjected UUO, and kidneys were analyzed at 3, 10, and 14 days postinjury. Histology for fibrosis, inflammation, cytokine quantification, flow cytometry, and metabolomics were performed on injured tissues and controls. PD146176, a specific 15-LO inhibitor, was used to complement experiments involving knockout animals. Compared with wild-type animals undergoing UUO, Alox15−/− mouse kidneys had less proinflammatory, profibrotic message along with less fibrosis and macrophage infiltration. PD146176 inhibited 15-LO and resulted in reduced fibrosis and macrophage infiltration similar to Alox15−/− mice. Flow cytometry revealed that Alox15−/− UUO-injured kidneys had a dynamic change in macrophage phenotype, with an early blunting of CD11bHiLy6CHi “M1” macrophages and an increase in anti-inflammatory CD11bHiLy6CInt “M2c” macrophages and reduced expression of the fractalkine receptor chemokine (C-X3-C motif) receptor 1. Many of these findings were reversed when UUO was performed on 15LOTG mice. Metabolomics analysis revealed that wild-type kidneys developed a glycolytic shift postinjury, while Alox15−/− kidneys exhibited increased oxidative phosphorylation. In conclusion, 15-LO manipulation by genetic or pharmacological means induces dynamic changes in the inflammatory microenvironment in the UUO model and appears to be critical in the progression of UUO-induced fibrosis.
NEW & NOTEWORTHY 15-Lipoxygenase (15-LO) has both pro- and anti-inflammatory functions in leukocytes, and its role in kidney injury and repair is unexplored. Our study showed that 15-LO worsens inflammation and fibrosis in a rodent model of chronic kidney disease using genetic and pharmacological manipulation. Silencing 15-LO promotes an increase in M2c-like wound-healing macrophages in the kidney and alters kidney metabolism globally, protecting against anaerobic glycolysis after injury.
INTRODUCTION
Chronic kidney disease (CKD) is characterized by progressive fibrosis, a highly complex process involving cross talk between resident and recruited cells in the injured kidney microenvironment. Infiltration of neutrophils and macrophages is a common histological finding in humans and rodents with CKD. These cells, which have considerable heterogeneity in phenotype, function, and ontogeny, are poorly understood but may play an outsized role in dictating the degree of fibrosis in animal models (1).
In the setting of kidney injury, bone marrow-derived monocytes (characterized by high-surface Ly6C expression) infiltrate into the kidney and undergo phenotypic differentiation (2, 3). The appearance of Ly6CHi (“M1-like”) macrophages in the kidney occurs early after injury, and studies have shown that ablating or inactivating this population improves experimental kidney damage in rodents (4, 5). Later in the course of injury, recruited monocytes lose Ly6C expression and are thought to become “M2a-like” macrophages, which induce profibrotic signals (6, 7). In addition, a Ly6CInt population appears alongside these Ly6CLow cells and is thought to be functionally distinct, resembling “M2c-like” macrophages, which promote wound healing (7, 8).
Lipoxygenases (LOs) are a family of enzymes that catalyze polyunsaturated fatty acids into bioactive lipid eicosanoids such as hydroxyeicosatetraenoic acids (HETEs), hydroxyeicosaoctadecaenoic acids (HODEs), leukotrienes, lipoxins, and resolvins, which have diverse pro- and anti-inflammatory effects in a range of tissues and conditions. 15-LO (12/15-LOX, encoded by ALOX15) is one such enzyme and is constitutively expressed in reticulocytes, peritoneal macrophages, and airway epithelial cells. 15-LO expression is known to be highly upregulated in alternatively activated T-helper 2-stimulated M2, but not M1, macrophages in vitro (9). In addition, in rodent models of tissue injury, chemokine (C-X3-C motif) receptor 1 (CX3CR1) + Ly6CLow alternatively activated macrophages express high levels of 15-LO (10). The uninjured kidney is not known to have significant expression of 15-LO (11), but published data support that, under inflammatory conditions, 15-LO is upregulated in the kidney and appears to be deleterious (12–14), although the exact mechanism remains unclear.
15-LO may also regulate broad changes in cell metabolism, being involved in cancer cell proliferation, apoptosis, and programed cell death pathways such as necroptosis and ferroptosis (15, 16). We have previously reported that manipulation of 5-LO, a closely related enzyme that interacts with 15-LO (17), is associated with a protective “glycolytic shift” in kidney tissues from 5-LO silenced mice after unilateral ureteral obstruction (UUO), which was independent of any alterations in inflammatory cell phenotype by flow cytometry of homogenized kidney tissues (18).
The aim of the present study was to determine the role of 15-LO in a rodent model of progressive renal inflammation and fibrosis. We hypothesized that silencing 15-LO would offer protection from the development of UUO-induced fibrosis, possibly by altering alternatively activated M2 macrophage polarization or by shifting metabolism within the kidney toward a more anti-inflammatory, antifibrotic phenotype.
MATERIALS AND METHODS
Animal Experiments
All animal experiments were approved by the Institutional Animal Care and Use Committee at the University of Colorado Anschutz Medical Campus. Male C57BL/6J and Alox15−/− mice were purchased from Jackson Laboratories. 15-LO transgenic overexpressing (15LOTG) mice were procured as a gift from Dr. Yuri Miller (University of California, San Diego, CA). PD146176 was obtained from Cayman Chemicals and given via subcutaneous minipump injection at a daily dose of 5 mg/kg/day starting on day −1 before UUO up until the time of euthanasia. PD146176 was suspended in a vehicle solution consisting of 10% DMSO, 15% (70%) ethanol, and 75% PBS. Eight to ten-week-old male mice underwent UUO and were euthanized at 3, 10, or 14 days postsurgery for all experiments. For the UUO procedure, after isoflurane anesthesia, a retroperitoneal flank incision was made, the right kidney was exteriorized, and the proximal ureter was ligated with 4-0 silk suture. The abdominal cavity was then washed with 1.0 mL sterile saline, the peritoneum was closed with vicryl suture, and the skin was stapled. At the time of euthanasia, animals were weighed, terminally anesthetized, and obstructed. Contralateral unobstructed kidneys were collected, and portions were either snap-frozen in liquid nitrogen (for RNA and protein extraction, hydroxyproline, and metabolomics) or placed in buffer for mechanical dissociation for flow cytometry.
Histology and Immunohistochemistry
At the time of collection, control and UUO kidneys were cut into serial transverse sections, which were placed in 4% paraformaldehyde (Electron Microscopy Sciences, Hatfield, PA), fixed for a total of 24 h, processed, paraffin embedded, and cut into 3.0-μm sections. Tissues were then stained for picrosirius red (PSR) as previously described (19). Polarized images of renal cortical tissues (12 random images at ×20) were obtained and analyzed using ImageJ software to determine the percentage of fibrosis in the affected area. Blinded observers, qualified to quantify kidney fibrosis using this method, were used. For F4/80 immunohistochemistry, slides were hydrated and subjected to antigen retrieval with trypsin digestion (Millipore Sigma, Burlington, MA). After being blocked with hydrogen peroxide and blocking buffer (Vector Laboratories, Burlingame, CA), slides were incubated at 4°C overnight in F4/80 antibody (Bio-Rad, Hercules, CA). A Vectastain kit (Vector Laboratories) was used to incubate the slides in secondary antibody and ABC reagent according to the manufacturer’s recommendations. Slides were developed for F4/80 using 3,3′-diaminobenzidine reagent (Vector Laboratories), dehydrated, and mounted with Permount (Fisher Scientific, Waltham, MA).
Hydroxyproline Assay
Frozen kidney tissues (15–30 mg) were weighed and homogenized in 30 μL/mg tissue of molecular grade water using a bead homogenizer (TissueLyser LT, Qiagen, Germantown, MD). An aliquot was removed for direct protein measurement using a Bradford assay (Bio-Rad). The remaining solution was mixed with 12 N HCl (Fisher Scientific) at 1:1 (vol/vol) for final concentration of 6 N HCl and hydrolyzed in Pyrex glass tubes on a heat block at 120°C for 24 h. An equal amount of protein per sample was loaded into 2.0-mL tubes (Eppendorf, Hamburg, Germany), and the solvent was evaporated in a fume hood. Hydroxyproline standards (Millipore Sigma) and samples were analyzed together. Acetate-citrate buffer (pH 6.0) containing 1.4% chloramine T (Milipore Sigma) was first added to the samples. Ehrlich’s reagent, containing 60% perchloric acid and p-dimethylbenzaldehyde (Milipore Sigma), was added, and samples were heated to 60°C for 25 min. Hydroxyproline content was measured by reading the absorbance at 560 nm using a spectrophotometer and normalized to total protein.
Quantitative RT-PCR
Snap-frozen tissues were homogenized using a sterile bead homogenizer (Qiagen) in RLT buffer (Qiagen) and β-mercaptoethanol. RNA purification was performed using a RNeasy Plus kit (Qiagen), and the concentration was determined using a spectrophotometer (Nanodrop, Wilmington, DE). cDNA was made from an RNA template using a commercially available system (Quantabio, Beverly, MA). Quantitative RT-PCR was performed with SYBR green PCR master mix (Applied Biosystems, Thermo Fisher). All PCRs included no template and no reverse transcriptase controls. The sequence-specific primers were as follows: GAPDH, forward 5′-CGTGGAGTCTACTGGCGTCTTCAC-3′ and reverse 5′-CGGAGATGATGACCCTTTTGGC-3′; α-smooth-muscle actin (α-SMA or Acta2), forward 5′-GCTGCTCCAGCTATGTGTGA-3′ and reverse 5′-CCATTCCAACCATTACTCCCTGA-3′; fibronectin, forward 5′-AGACTGCAGTGACCACCATTC-3′ and reverse 5′-AATGTGTCCTTGAGAGCATAG-3′; tumor necrosis factor-α (TNF-α or Tnfa), forward 5′-GTCCCCAAAGGGATGAGAAGT-3′ and reverse 5′-GACGTGGGCTACAGGCTT-3′; chemokine (C-C motif) ligand 2 (CCL2 or Ccl2), forward 5′-GCTGTAGTTTTTGTCACCAAGC-3′ and reverse 5′-GTGCTGAAGACCTTAGGGCA-3′; chemokine (C-X3-C motif) ligand 1 (CX3CL1 or Cx3cl1), forward 5′-CTACTAGGAGCTGCGACAGC-3′ and reverse 5′-TGTCGTCxTCCAGGACAATGG-3′; transforming growth factor-β (TGF-β or Tgfb1), forward 5′- ACGTGGAAATCAACGGGATCA-3′ and reverse 5′- AGAAGTTGGCATGGTAGCCC-3′; and ALOX15, forward 5′- GATGGAGAAGCTACAGGCCC-3′ and reverse 5′- CAGTTCGAGCTGGATGGCTA-3′.
Western Blot Analysis
Snap-frozen tissues were homogenized in mammalian protein extraction reagent buffer (Thermo Fisher) with protease inhibitor cocktail (Milipore Sigma). Solubilized proteins were centrifuged at 18,000 g in a microcentrifuge (4°C) for 15 min. The protein concentration of supernatants was determined using a Bradford assay (Bio-Rad). Protein was separated using 10% SDS-PAGE and transferred to Immobilon-P membranes (Milipore Sigma). Membranes were blocked for 1 h at room temperature in Tris-buffered saline [10 mM Tris·HCl (pH 7.4) and 140 mM NaCl] containing 0.1% Tween 20 (TTBS) and 5% BSA (Milipore Sigma) and then incubated with BSA in TTBS containing primary antibodies for 16 h at 4°C. Membranes were washed in TTBS, and bound antibodies were visualized with horseradish peroxidase-coupled secondary antibodies and ECL reagent (Thermo Fisher) according to the manufacturer’s instructions. The antibodies used were as follows: rabbit anti-fibronectin (clone 23750, Abcam, Cambridge, MA, 1:20,000), rabbit anti-α-SMA (clone 1A4, Abcam, 1:20,000), rabbit anti-15-LO (ab80221, Abcam, 1:1,000), and rabbit anti-GAPDH (clone 14C10, Cell Signaling, Danvers, MA, 1:5,000). Goat anti-rabbit IgG-horseradish peroxidase (clone sc-2004, Santa Cruz Biotechnology, San Diego, CA, 1:5,000) was used as secondary antibody.
Lipidomic Analysis
Flash-frozen specimens were homogenized similarly to RNA and protein specimens using a 1:1 (vol:vol) mixture of methanol and homogenization buffer [0.1 M phosphate (pH 7.4), 1 mM EDTA, and 10 μM indomethacin], which was normalized to tissue weight. Samples were centrifuged at 18,400 g for 10 min and transferred into HPLC vials. Upon addition of the internal standard solution, 500 μL of the supernatants were injected onto a 3.0 × 5-mm guard column (Halo, C8, 2.7 μM, Advanced Materials Technology, Wilmington, DE) and back flushed with 100% acetonitrile-methanol [1:1 (vol/vol)] onto a 3.0 × 1,000-mm analytical column (Halo C8, 2.7 μM, Advanced Materials Technology). For HPLC separation, the starting mobile phase consisted of 40% water supplemented with 0.1% formic acid (buffer A) and 60% acetonitrile-methanol [1:1 (vol/vol); buffer B] with a flow of 0.8 mL/min for the first minute. After 2.5 min, the gradient increased to 53% buffer B and further to 70% buffer B within 8.5 min. At 11.5 min, buffer B was at 95% and was held for 1 min. The column was reequilibrated for 2 min to starting conditions for a total of 14.5 min of analysis time. The API5500 mass spectrometer (AB Sciex, Concord, ON, Canada) was run in the negative ESI multiple reaction monitoring mode. The following hydroxy-fatty acids were quantified: 12-(S)-HETE, 15-(S)-HETE, 9- and 13-hydroxyoctadecatetraenoic acids, 5-(S)-HETE, leukotriene B4 (LB4), leukotriene C4 (LC4), leukotriene D4 (LD4), and leukotriene E4 (LE4). All quantifications were performed using freshly prepared calibration curves; the performance of the assay was monitored by inclusion of multiple quality control samples. Deuterated standards were used for all hydroxy-fatty acids. All compounds were purchased from Cayman Chemicals. No chiral analysis of hydroxylated fatty acids was performed; thus, no information about the enzymatic source can be determined using this method.
Flow Cytometry
Kidneys were placed in DMEM-F-12 medium (Mediatech, Manassas, VA), mechanically dissociated, and incubated in Liberase TL and DNase (both Millipore Sigma) for 30 min. The reaction was then terminated with ice-cold FA3 buffer (PBS, 10 mM HEPES, 2 mM EDTA, and 1% FBS). Contralateral unobstructed kidneys and spleens were used for negative and positive flow cytometry, respectively. Samples were washed, passed through 100- and 70-μm cell strainers, and then treated with RBC lysis buffer [4.01 g NH4Cl2, 500.6 mg KHCO2, 2.5 mL 0.5 M NaEDTA, and deionized water (pH 7.2)] for 3 min. Cells were suspended at a final concentration of 1.0 × 10⁶ cells/mL in FA3 buffer. Cells were stained for 1 h at 4°C with the following antibodies: Live/Dead Viability dye violet Ghost510 (Tonobo Biosciences, San Diego, CA), CD45-FITC clone 30-F11 (BioLegend, San Diego, CA), Ly6g-PECy7 clone 1A8 (BioLegend), CD11b-PE clone M1/70 (BioLegend), Ly6C-BV785 clone HK1.4 (BioLegend), and CX3CR1-APC clone SA011F11 (BioLegend). Cells were analyzed for flow cytometry using a Beckman Cytoflex Flow Cytometer (Beckman Coulter Life Sciences, Indianapolis, IN). Data were analyzed using Flowjo (BD Life Sciences, Franklin Lakes, NJ) software.
Metabolomics Analysis
Sample preparation.
Kidney tissues (12–20 mg) were collected and stored at −80°C. Frozen kidney specimens were weighed, and metabolites were then extracted using ice-cold methanol-acetonitrile-water [5:3:2 (vol:vol:vol)] at 15 mg/mL in the presence of GB10 (Next Advance) glass beads. Samples were homogenized in a Bullet Blender (Next Advance, Troy, NY) for 5 min at setting 4 and 4°C and then vortexed vigorously for 30 min at 4°C. Insoluble material was pelleted via centrifugation at 18,000 g for 10 min at 4°C, and supernatants were analyzed by ultra-high performance liquid chromatograophy-tandem mass spectometry (UHPLC-MS).
UHPLC-MS analysis.
High-throughput metabolomics analyses were performed as previously described in detail (20) using a Thermo Vanquish UHPLC (San Jose, CA) coupled online to a Thermo Q Exactive mass spectrometer (Bremen, Germany). Extracts (10 μL) were randomized and then resolved over a Kinetex C18 column (2.1 × 150 mm, 1.7 μm, Phenomenex, Torrance, CA) with a 5-min gradient in positive and negative ion modes (separate runs) exactly as previously described (21). The Q Exactive MS scanned in full MS mode from 65 to 950 mass-to-charge ratio (m/z) at 70,000 resolution with 4 kV spray voltage (ESI), 45 sheath gas, and 15 auxiliary gas. A technical mixture was injected after every 15 runs to verify instrument performance. Acquired data were converted from .raw to .mzXML file format using RawConverter. Metabolites were assigned and peaks were integrated using Maven (Princeton, NJ) (22) in conjunction with the Kyoto Encyclopedia of Genes and Genomes database. Raw peak areas were normalized to contralateral control kidneys by dividing each peak area by the median peak area of the controls. Statistical analysis, including ANOVA and preparation of principal component analyses, was performed using MetaboAnalyst 5.0 (23) sum normalization and autoscaling of data. Hierarchical clustering analysis was performed using GENE-E (Broad Institute). Metabolite dot plots of normalized data were prepared using GraphPad Prism 9.0.
Statistics
Values are means ± SE. Student’s t tests were used to compare two groups. One-way ANOVA with Tukey’s multiple comparison test was used to compare three or more groups. Two-way ANOVA with Sidak’s multiple-comparison test was used to compare grouped data. Statistical analysis was performed using GraphPad Prism 9.1.0.
RESULTS
15-LO Is Upregulated in the Kidney After UUO
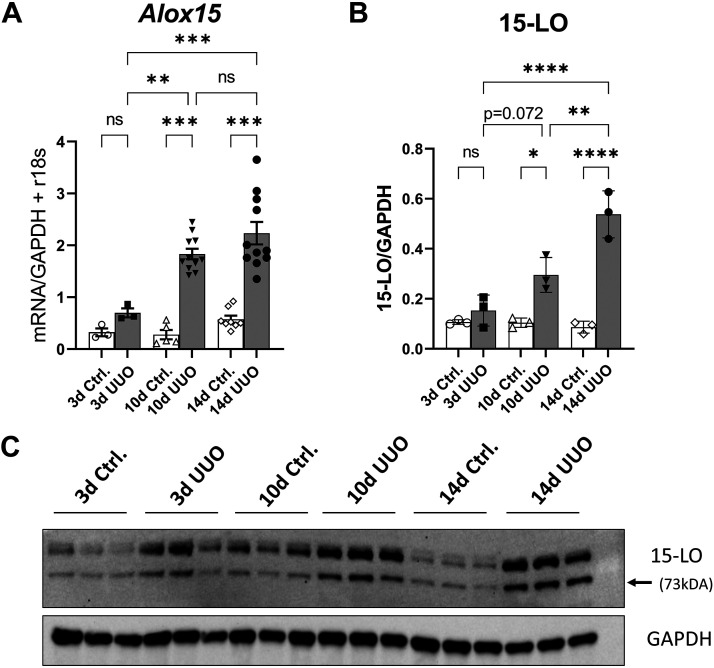
Wild-type (WT) male mice underwent UUO and were euthanized at 3, 10, and 14 days postsurgery. Contralateral control and UUO kidneys underwent RNA extraction and cDNA amplification. Quantitative RT-PCR for Alox15 revealed a modest increase in expression at 3 days and higher increases at 10 and 14 days after UUO relative to controls (2.23- vs. 0.70-fold change, 14- vs. 3-day UUO, P < 0.001; Fig. 1A). Separate frozen tissues were analyzed by Western blot analysis for 15-LO and mirrored these findings, with most of the increased expression occurring by 14 days post-UUO (Fig. 1, B and C).
Figure 1.
15-Lipoxygenase (15-LO or Alox15) is upregulated after unilateral ureteral obstruction (UUO). A: Alox15 expression was quantified by quantitative RT-PCR at 3, 10, and 14 days (d) after UUO. Data were normalized to the average of GAPDH + r18S expression. *P < 0.05, **P <0.01, and ***P < 0.001 by one-way ANOVA. B: 15-LO protein (73 kDa) was quantified by densitometry normalized to GAPDH (37 kDA) 3, 10, and 14 days after UUO. *P < 0.05, **P < 0.01, ***P < 0.001, and ****P < 0.0001 by one-way ANOVA. C: corresponding Western blots showing control (Ctrl) and matched UUO kidney specimens. ns, not significant.
Genetic Silencing of 15-LO Reduces mRNA for Proinflammatory Cytokines and Fibrosis After UUO
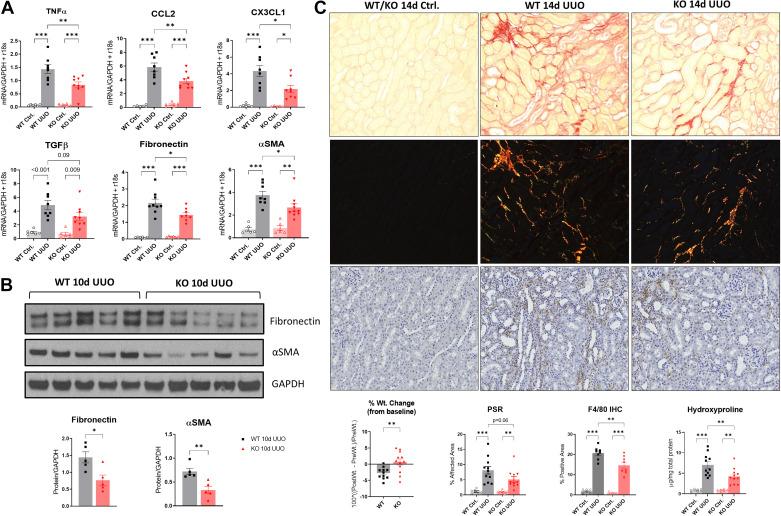
WT (n = 8) and Alox15−/− [knockout (KO); n = 9)] mice underwent UUO and were euthanized at 10 days postinjury, and organs were collected as described. KO UUO-injured kidneys showed a significant reduction in proinflammatory cytokines Tnfa (TNF-α; 0.84 vs. 1.44 mean difference, KO vs. WT, respectively, P = 0.003), Ccl2 (monocyte chemoattractant protein-1; 3.82 vs. 5.86, P = 0.004), and Cx3cl1 (fractalkine; 2.18 vs. 4.33, P = 0.01) and profibrotic markers fibronectin (1.44 vs. 2.19, P = 0.01) and Acta2 (α-SMA; 2.67 vs. 3.76, P = 0.04) and a trend toward a reduction in Tgfb1 (TGF-β; 3.23 vs. 4.90, P = 0.09) (Fig. 2A). After 10 days of UUO, a time when fibrosis is advancing, protein levels of α-SMA (0.33- vs. 0.72-fold change, KO vs. WT, respectively, P = 0.005) and fibronectin (0.77- vs. 1.44-fold change, P = 0.016) were diminished (Fig. 2B).
Figure 2.
Genetic silencing of 15-lipoxygenase (15-LO) is protective during unilateral ureteral obstruction (UUO) progression. A: quantitative RT-PCR for tumor necrosis factor-α (TNF-α), monocyte chemoattractant protein-1 [chemokine (C-C motif) ligand 2 (CCL2)], fractalkine [chemokine (C-X3-C motif) ligand 1 (CX3CL1)], transforming growth factor-β (TGF-β), fibronectin, and α-smooth muscle actin (α-SMA) at 10 days (d) after UUO vs. respective controls (Ctrl) from wild-type (WT) and knockout (KO) animals. Data were normalized to the average of GAPDH + r18S. *P < 0.05, **P < 0.01, and ***P < 0.001 by one-way ANOVA. B: Western blots of fibronectin and α-SMA protein expression at 10 days after UUO. *P < 0.05 and **P < 0.01 by t test. C: fibrosis was quantified 14 days after UUO using picrosirius red (PSR) staining for collagen. Shown are representative ×20 light microscopic and corresponding polarized images (top), which were quantified according to the percent affected cortical area. The control specimens shown represent the typical appearance of WT or KO control kidneys. F4/80 immunohistochemistry (IHC) was performed on 14-day UUO specimens (bottom), and the corresponding quantification of the percent positive area is shown. *P < 0.05, **P < 0.01, and ***P < 0.001 by one-way ANOVA. Separately, hydroxyproline content for fibrosis was determined using a colorimetric assay from these same animals and then normalized to total protein concentration (bottom right graph). Animal weight changes at the time of euthanasia were also obtained (bottom left graph). **P < 0.01 by t test.
We next performed UUO to evaluate kidney fibrosis at 14 days after UUO, a time point that we have previously demonstrated is most optimal to detect differences in fibrosis by histology (24) (n = 12 male WT mice and n = 11 male KO mice). By the time of euthanasia, KO animals had significantly less weight loss than WT animals relative to presurgical weights (0.68% vs. −2.76% weight loss, P = 0.005; Fig. 2C, bottom graphs). Compared with WT UUO-injured kidneys, KO-injured kidneys had a strong trend toward less interstitial fibrosis by PSR polarized microscopy (5.13% vs. 8.15% fibrosis, KO vs. WT UUO, P = 0.06; Fig. 2C). We determined hydroxyproline content, a biochemical method for quantifying cross-linked collagen content in unfixed, unstained tissues, which were analyzed from the same kidneys. KO animals had significant attenuation of the increased hydroxyproline content after UUO versus WT mice (4.23 vs. 7.04 µg/mg, KO vs. WT UUO, P = 0.007; Fig. 2C). In addition, F4/80 expression, a surface marker of macrophages, was determined at 14 days by immunohistochemistry. Compared with WT UUO kidneys, KO kidneys showed diminished macrophage numbers in cortical histological sections (20.72% vs. 14.64% positive area, WT vs. KO UUO, P = 0.003; Fig. 2C, bottom images and graphs).
PD146176, a Specific ALOX15 Inhibitor, Mirrors the Antifibrotic Effects of Genetic Silencing During UUO
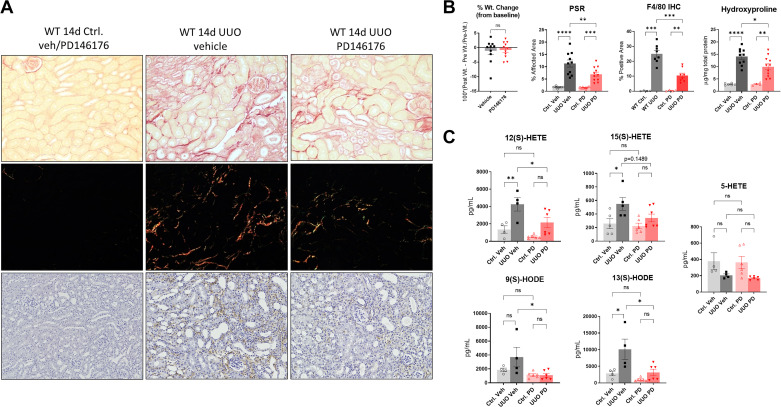
To complement the genetic experiments, we used PD146176, a specific ALOX15 inhibitor (25–27), to pharmacologically block 15-LO after UUO in WT mice. We treated mice with 5 mg/kg/day of PD146176 (n = 11 male WT mice) or vehicle solution (n = 10 male WT mice) via osmotic minipumps starting at day −1 before UUO. Specimens were collected at 14 days postinjury. Compared with vehicle-treated controls, PD146176 treatment significantly reduced renal fibrosis in PSR-stained histological sections (6.96% vs. 11.32% fibrosis, KO vs. WT UUO, P = 0.0037) and by bioassay for hydroxyproline content (9.94 vs. 14.06 µg/mg total protein, KO vs. WT UUO, P = 0.0278; Fig. 3, A and B). F4/80 immunostaining was performed, which paralleled results from KO animals, albeit with an even more dramatic reduction in macrophages with inhibitor treatment (25.01% vs. 10.49% positive area, vehicle- vs. PD146176-treated UUO, P < 0.001).
Figure 3.
PD146176, a specific 15-lipoxygenase (LO) inhibitor, effectively blunts 15-LO eicosanoid production and reverses renal fibrosis after unilateral ureteral obstruction (UUO). A: C57BL/6 wild-type (WT) vehicle (veh)-treated and PD146176-treated UUO-injured kidneys and controls (Ctrl) underwent histological staining for picrosirius red (PSR) and F4/80 immunohistochemistry (IHC). Representative ×20 images are shown. B: corresponding quantification of PSR-polarized images and F4/80 immunostained images. Also shown is the hydroxyproline assessment for fibrosis (normalized to mg total protein) and percent weight changes from baseline between the two groups. *P < 0.05, **P < 0.01, ***P < 0.001, and ****P < 0.0001 by one-way ANOVA. C: WT and PD146176-treated kidneys were analyzed by LC-MS/MS for 15-LO and 5-LO-derived oxylipins. Data were quantified as pg/mL of homogenized tissue. Plots are means ± SE. *P < 0.05 and **P < 0.01 by one-way ANOVA. HETE, hydroxyeicosatetraenoic acid; HODE, hydroxyeicosaoctadecaenoic acid; ns, not significant.
We next performed LC-MS/MS from frozen kidneys and found a significant reduction in the 15-LO product 12(S)-HETE (2,168 vs. 4,260 pg/mL, P = 0.0461) and 13-HODE (3,159 vs. 10,116 pg/mL, P = 0.01) and a strong trend in the reduction of 15(S)-HETE (342.3 vs. 549.3 pg/mL, P = 0.1489) in UUO-injured kidneys in the PD146176-treated group versus the vehicle-treated group, respectively (Fig. 3C). In contralateral control kidney specimens, PD146176 nonsignificantly blunted 12(S)-HETE (522 vs. 1,354 pg/mL, P = 0.66) and 13-HODE levels (988 vs. 2,869 pg/mL, P = 0.77) and had no effect on 15(S)-HETE. We also analyzed species derived from the 5-LO pathway, including LTB4, 5-HETE, 9-HODE, and cysteinyl leukotrienes (LC4, D4, and E4) in these same specimens to determine if PD146176 had 5-LO inhibitory effects. The only consistently detectable 5-LO-derived oxylipins in kidney tissues were 5-HETE and 9-HODE, and only 9-HODE showed a significant reduction in PD146176-treated UUO kidneys (1,093 vs. 3,702 pg/mL, P = 0.03).
Transgenic Overexpression of Alox15 Worsens Renal Inflammation and Fibrosis After UUO
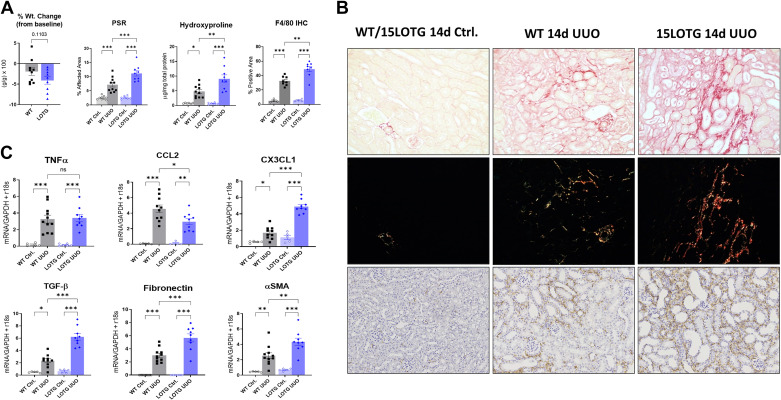
We next determined if 15-LO overexpression would reverse the phenotype we appreciated with 15-LO genetic and pharmacological blockade. 15LOTG mice were obtained as previously described. UUO surgeries were performed with separate WT control mice, and animals were euthanized at 10 and 14 days after injury. We first confirmed that Alox15 mRNA expression was increased in control kidneys from 15LOTG mice at 10 days post-UUO (Supplemental Fig. S1; see https://doi.org/10.6084/m9.figshare.14711241). In a 14-day study of kidney fibrosis (n = 10 male WT mice and n = 9 male 15LOTG mice), we observed that 15LOTG mice had a nonsignificant trend in weight loss versus WT mice (Fig. 4, A and B). By light microscopy at 14 days post-UUO, PSR-stained sections showed significantly more fibrosis in 15LOTG versus WT kidneys (11.16% vs. 7.17% fibrosis, respectively, P < 0.001). Hydroxyproline assessment was performed on these affected kidneys and showed a twofold increase versus kidneys from WT mice (8.89 vs. 4.54 µg/mg total protein, P = 0.004). F4/80 immunostaining was performed as in prior experiments and showed opposite results compared with KO and PD146176 inhibitor-treated animals (32.56% vs. 48.99% positive area, WT vs. 15LOTG UUO, P = 0.001).
Figure 4.
Transgenic overexpression of 15-lipoxygenase (15-LO) reverses the anti-inflammatory, antifibrotic phenotype observed in knockout animals after unilateral ureteral obstruction (UUO). 15-LO transgenic overexpressing (15LOTG) mice and wild-type (WT) mice were subjected to UUO, and kidneys were collected at 14 days (d) as previously described. A: percent weight changes between WT and 15LOTG mice, quantification of picrosirius red (PSR) polarized images, quantification of F4/80 immunostained images, and hydroxyproline assessment normalized to total protein. *P < 0.05, **P < 0.01, ***P < 0.001, and ****P < 0.0001 by one-way ANOVA. B: representative PSR-stained specimens from 14-day UUO kidneys with respective polarized images at ×20 magnification, indicating worsening of fibrosis and inflammation in 15LOTG mice. C: quantitative RT-PCR was performed on separate animals, and animals were euthanized 10 days after UUO. 15-LO overexpression increased transforming growth factor-β (TGF-β), α-smooth muscle actin (α-SMA), and chemokine (C-X3-C motif) ligand 1 (CX3CL1) expression but did not change tumor necrosis factor-α (TNF-α) expression and diminished chemokine (C-C motif) ligand 2 (CCL2) expression. *P < 0.05, **P < 0.01, and ***P < 0.001 by one-way ANOVA. IHC, immunohistochemistry; ns, not significant.
A profile of proinflammatory cytokines message levels at 10 days post-UUO (n = 11 male WT mice and n = 9 male 15LOTG mice) showed mixed results, with no significant differences in TNF-α expression between 15LOTG and WT kidneys, attenuated CCL2 signaling (2.90 vs. 4.55 mean difference, 15LOTG vs. WT, P = 0.006), and significantly increased CX3CL1 expression (4.89 vs. 1.69 mean difference, P < 0.0001). Profibrotic messages for fibronectin (5.67 vs. 3.01 mean difference, P < 0.0001), α-SMA (4.34 vs. 2.52 mean difference, P = 0.0013), and TGF-β (6.22 vs. 2.35 mean difference, P < 0.0001) were all significantly higher in 15LOTG versus WT injured kidneys, respectively.
Kidney Leukocyte Populations Are Altered in a Time-Dependent Fashion After UUO in 15-LO KO Mice
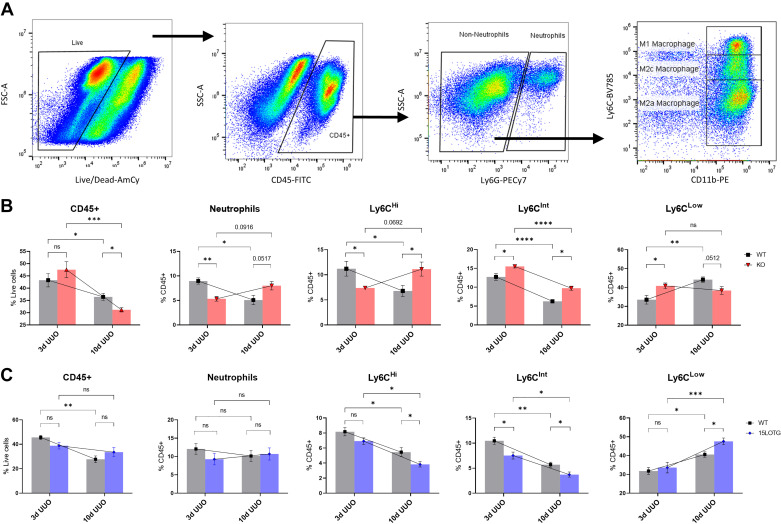
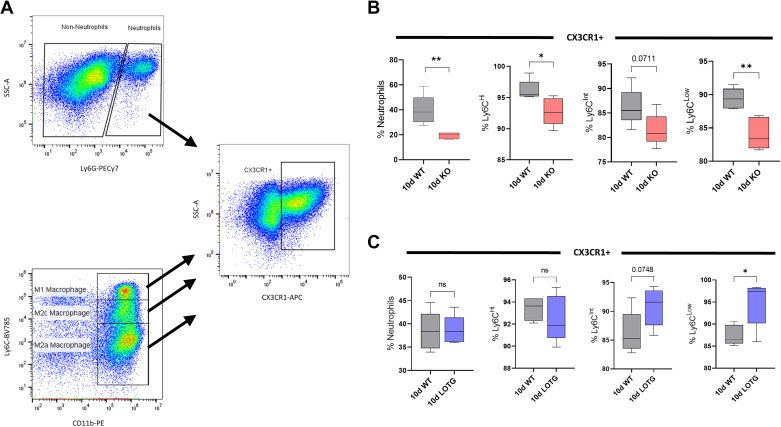
Given that 15-LO has been implicated in both pro- and anti-inflammatory responses to injury (15), we next examined neutrophil and macrophage populations by flow cytometry in our KO and 15LOTG genetically manipulated mice. We examined these leukocytes at 3 and 10 days post-UUO based on our own experience and previously published data (2) demonstrating that drastic changes in kidney macrophage populations occur from early to late periods after UUO, reflecting a shift from a proinflammatory phase to a profibrotic phase of the model. All experiments involved n = 5 WT mice versus n = 5 genetically manipulated mice. After we excluded doublets, CD45+ cells were gated off live populations and then separated into neutrophils and non-neutrophil populations using Ly6G. Non-neutrophil (Ly6G−) CD11b+ monocyte populations were then separated according to Ly6C expression: CD11bHiLy6CHi “M1-like” macrophages, CD11bHiLy6CInt “M2c-like” macrophages, and CD11bHiLy6CLow “M2a-like” macrophages, a strategy for subtyping macrophages after UUO that we have previously described (18, 24) and has been supported by other investigators (2, 3) (Fig. 5A). Neutrophil and Ly6C macrophage populations were then analyzed for CX3CR1 expression (Fig. 6A).
Figure 5.
15-Lipoxygenase (15-LO) polarizes macrophages toward a proinflammatory, profibrotic phenotype. A: gating strategy for flow cytometry. Live cells → CD45+ cells → neutrophils and non-neutrophil populations (sorted by Ly6G expression) → non-neutrophil populations gated by Ly6C expression, revealing three distinct CD11b+ populations (Ly6CHi “M1” macrophages, Ly6CInt “M2c” macrophages, and Ly6CLow “M2a” macrophages). B: 3-day (3d) and 10-day (10d) unilateral ureteral obstruction (UUO) experiments [both n = 5 wild-type (WT) kidneys and n = 5 knockout (KO) kidneys] are presented in leukocyte populations as percent live (CD45) or percent CD45+ (all others). C: 3- and 10-day UUO experiments [separate n = 5 WT kidneys and n = 5 15-LO transgenic overexpressing (15LOTG) kidneys] are similarly displayed. Data are shown as means ± SE. t Tests were used to compare WT vs. KO/15LOTG within each individual time point. Two-way ANOVA for grouped data are overlayed and compared 3- and 10-day time points within the same genetic background. *P < 0.05, **P < 0.01, ***P < 0.001, and ****P < 0.0001. FSC and SSC, forward scatter and side scatter, respectively; ns, not significant.
Figure 6.
Leukocyte expression of chemokine (C-X3-C motif) receptor 1 (CX3CR1) is altered 10 days (d) after unilateral ureteral obstruction (UUO) with 15-lipoxygenase (15-LO) genetic manipulation. A: gating strategy for CX3CR1+ cells. B: among knockout (KO) UUO-injured kidneys vs. wild-type (WT) controls, there was significantly reduced CX3CR expression in neutrophils and Ly6CHi and Ly6CLow populations and a trend toward a reduction in Ly6CInt populations. C: among 15-LO transgenic overexpressing (15LOTG) UUO-injured kidneys vs. WT controls, there was significantly increased CX3CR expression in Ly6CLow populations and a trend toward an increase in Ly6CInt populations. *P < 0.05 and **P < 0.01 by t tests. ns, not significant; SSC, side scatter.
Three days after UUO, an early time point when injury is potentially reversible, KO specimens showed overall similar numbers of total CD45+ leukocytes compared with WT specimens (43.25% vs. 47.55% live, KO vs. WT, P = 0.34; Fig. 5B). However, a more granular look at specific populations revealed significant reductions in KO UUO kidney neutrophils (8.96% vs. 5.32% CD45, P = 0.0017) and Ly6CHi “M1-like” proinflammatory macrophages (11.21% vs. 7.37% CD45+, P = 0.0325) versus WT UUO specimens, respectively. Furthermore, Ly6CInt “M2c-like” anti-inflammatory macrophages were significantly higher in KO versus WT specimens (15.52% vs. 12.74% CD45+, P = 0.0213). Interestingly, Ly6CLow “M2a-like” macrophages were also significantly increased in KO versus WT specimens at this earlier time point (40.85% vs. 33.51% CD45+, P = 0.0291).
By 10 days after UUO, a time when fibrosis is progressing, many of these dynamics changed, with KO mice now having significantly reduced CD45+ cells (31.08% vs. 36.43% live, P = 0.018), a strong trend toward increased neutrophils (8.0% vs. 5.08% CD45+, P = 0.052), and significant increases in Ly6CHi macrophages versus WT mice (11.13 vs. 6.78% CD45+, P = 0.0392; Fig. 5B). Ly6CLow profibrotic macrophages also had reversed dynamics, with a strong trend toward lower cell numbers in KO kidneys (38.39% vs. 44.14% CD45+, P = 0.051). The only relationship between KO and WT kidneys that remained consistent across time in this model was Ly6CInt macrophages, being again significantly increased in KO mice versus WT mice (9.74% vs. 6.28% CD45+, P = 0.001). Of note, the macrophage data at both 3 and 10 days post-UUO were consistent whether these cells were gated off total CD45+ cells, as previously reported, or as a percentage of non-neutrophils (Supplemental Fig. S2; see https://doi.org/10.6084/m9.figshare.14711238).
In addition, at 10 days after UUO, we profiled neutrophil and macrophage populations for CX3CR1 expression. Most profiled leukocytes in KO kidneys had diminished CX3CR1 expression with neutrophils and Ly6CLow macrophages having the strongest reductions versus WT kidneys (19.30% vs. 39.73% neutrophils, P = 0.005; 84.10 vs. 89.41% Ly6CLow, P = 0.003; Fig. 6B).
Overexpression of 15-LO Worsens Fibrosis and Increases Profibrotic Macrophages After UUO
To complement these experiments, leukocyte populations were analyzed by flow cytometry at 3 and 10 days after UUO in separate WT versus 15LOTG mice (Fig. 5C). At 3 days after UUO, 15LOTG mice had similar leukocyte trends to WT mice with the notable exception of Ly6CInt macrophages being significantly reduced (7.53% vs. 10.47% CD45+, P = 0.018). Similarly, by 10 days after UUO, Ly6CInt macrophages remained significantly diminished (3.72% vs. 5.69% CD45+, P = 0.025) and Ly6CLow profibrotic macrophages were significantly increased versus WT controls (47.58% vs. 40.58% CD45+, P = 0.016). Ly6CHi macrophages showed opposite data at 10 days post-UUO compared with KO experiments, being significantly depressed versus WT experiments (3.83% vs. 5.45% CD45+, P = 0.048). Overall trends in CD45+ cells and flux of neutrophils and macrophages showed similar dynamics compared with WT mice, unlike the altered dynamics appreciated in WT versus KO mice from early to late time points (Fig. 5B vs. Fig. 5C). As before, trends in macrophage subtypes were consistent whether they were gated off total CD45+ cells or non-neutrophil populations (Supplemental Fig. S3; see https://doi.org/10.6084/m9.figshare.14711250).
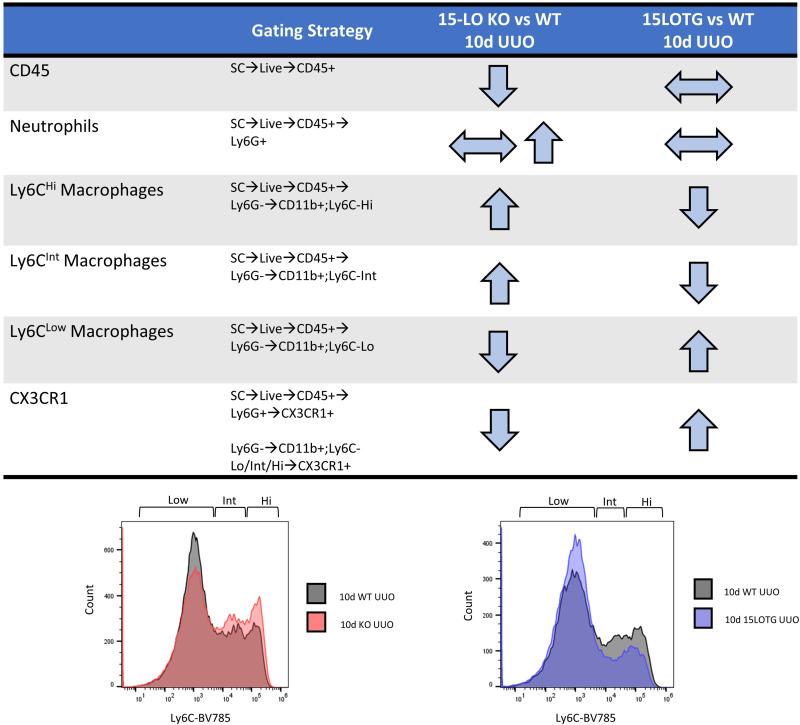
CX3CR1 expression was again determined in all 10-day leukocyte populations from 15LOTG mouse kidneys and was significantly increased in Ly6CLow macrophages (94.83% vs. 87.47% Ly6CLow, P = 0.019). A similar trend was observed in Ly6CInt populations from 15LOTG versus WT samples (90.81% vs. 86.28% Ly6Cint, P = 0.075; Fig. 6C). Figure 7 shows the major differences in KO versus WT and 15LOTG versus WT 10-day UUO leukocyte populations.
Figure 7.
Major changes in leukocyte populations by flow cytometry at 10 days (d) after unilateral ureteral obstruction (UUO) in knockout (KO) and 15-lipoxygenase (15-LO) transgenic overexpressing (15LOTG) mice. The gating strategy and directional changes in 10-day UUO specimen leukocyte populations vs. wild-type (WT) UUO-injured controls are shown. Separate histograms are shown for 10-day macrophage populations for each set of experiments. CX3CR1, chemokine (C-X3-C motif) receptor 1.
Silencing 15-LO Expression Alters Kidney Metabolism After UUO
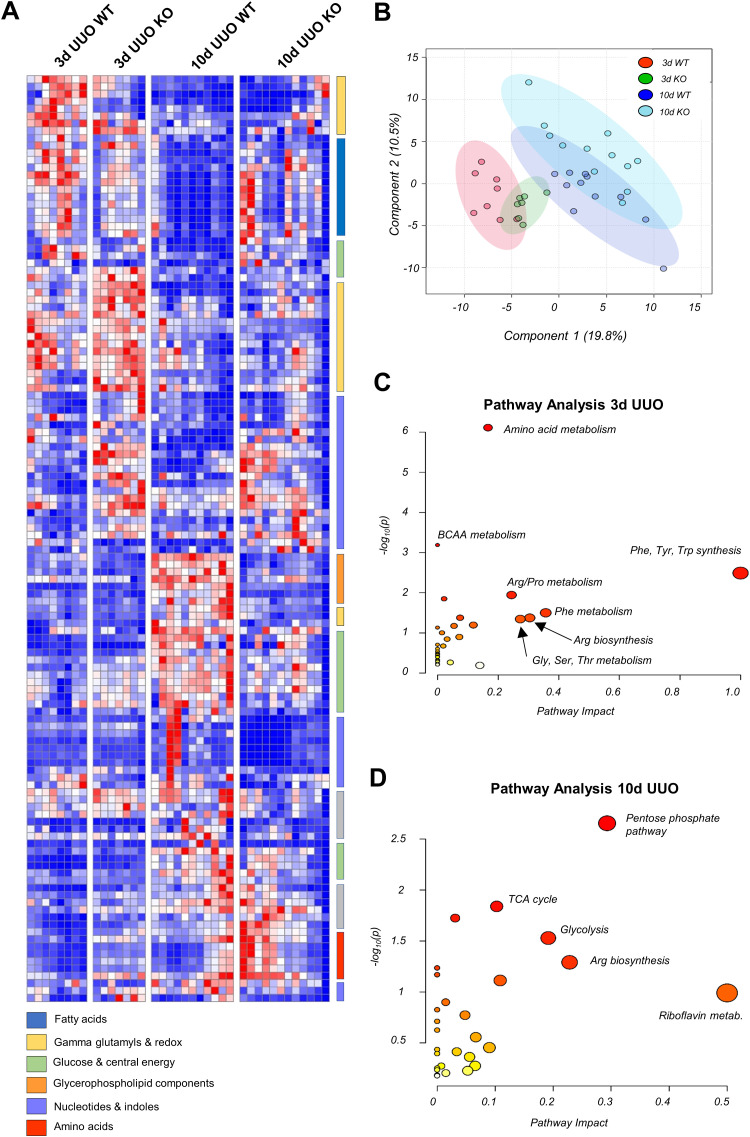
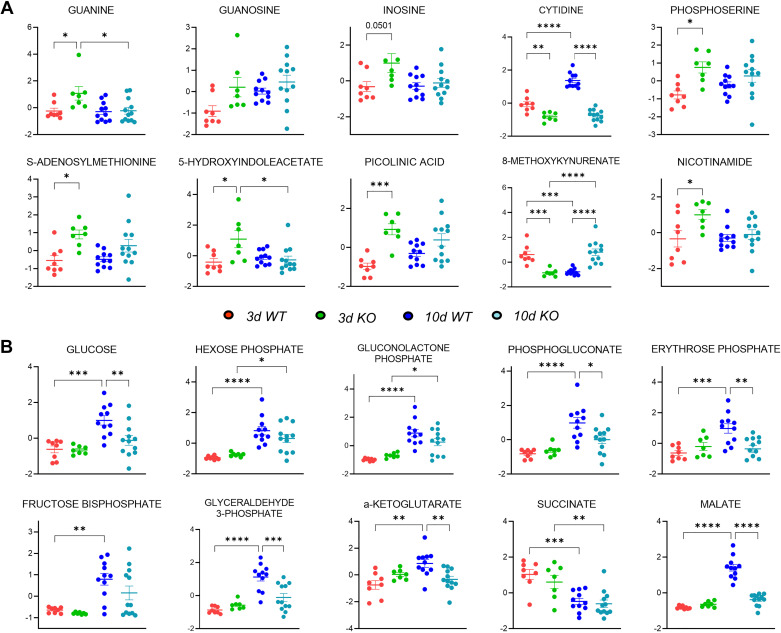
Given that 15-LO has been implicated in many different pathways controlling cell proliferation, apoptosis, and ferroptosis, we next sought to determine if 15-LO genetic silencing would alter metabolism globally in the kidney after UUO. Metabolites were extracted from frozen tissues harvested from 3- and 10-day UUO experiments and analyzed by high-throughput LC-MS with targeted data analysis focusing on amino acid, energy, redox, and glucose metabolism. 15-LO KO kidneys had altered metabolism at both early and later time periods compared with WT kidneys (Fig. 8, A and B). Three days after UUO in KO mice, there were several significantly increased metabolites from nucleotide, indole, and tryptophan pathways indicating increased steady-state pools [e.g., guanine fold change (KO/WT): 2.80, inosine fold change: 1.96, S-adenosylmethionine fold change: 1.74, phosphoserine fold change: 1.49, nicotinamide fold change: 1.56, picolinic acid fold change: 2.90, and 5-hydroxyindoleacetate fold change: 2.30; Figs. 8C and 9A).
Figure 8.
Metabolomics changes induced by unilateral ureteral obstruction (UUO) on kidneys from wild-type (WT) and 15-lipoxygenase-deficient (Alox15−/−) mice at 3 and 10 days (d). Metabolite levels are presented relative to respective control (contralateral) kidneys and were then sum normalized and autoscaled using MetaboAnalyst v 5.0. A: hierarchical clustering analysis of metabolites with statistically significant changes (P < 0.05 by ANOVA). B: partial least squares-discriminant analysis (PLS-DA) illustrating changes in metabolic phenotype in WT vs. Alox15−/− [knockout (KO)] mouse kidneys as a function of time. C: pathway analysis of 3-day WT vs. Alox15−/− kidneys revealing prominent changes in amino acid, nucleotide, and indole metabolism. D: pathway analysis of 10-day WT vs. Alox15−/− kidneys revealing prominent changes in sulfur metabolism, glucose metabolism, and the tricarboxylic acid (TCA) cycle. BCAA, branched chain amino acid.
Figure 9.
Individual metabolite changes induced by unilateral ureteral obstruction (UUO) on kidneys from wild-type (WT) and 15-lipoxygenase-deficient (Alox15−/−) mice at 3 and 10 days (d). Shown are dot plots of metabolites from pathways most altered among 3-day (A) and 10-day (B) UUO kidneys in WT and Alox15−/− [knockout (KO)] mice. *P < 0.05, **P < 0.01, ***P < 0.001, and ****P < 0.0001 by one-way ANOVA.
Conversely, by 10 days after UUO, metabolites from glycerophospholipid, glucose, and redox pathways were significantly altered (Fig. 8D). Chiefly, glycolytic intermediates such as glucose [fold change (KO/WT): 0.61], hexose phosphate (fold change: 0.93), glyceraldehyde 3-phosphate (fold change: 0.43), and tricarboxylic acid cycle metabolites α-ketoglutarate (fold change: 0.68), and malate (fold change: 0.39) were diminished in KO specimens, indicating a dampened utilization of glucose in 10-day KO versus 10-day WT kidneys (Fig. 9B).
DISCUSSION
These data suggest that manipulation of 15-LO has potent effects in altering fibrosis, immune cell recruitment/polarization, and metabolism in a murine model of UUO-induced renal injury. A recent study of mice undergoing remnant nephrectomy also found evidence of 15-LO upregulation, and genetic silencing partially reversed albuminuria, renal failure, and fibrosis (12). A previous study of mice with diabetic nephropathy showed similar results, with 15-LO KO mice exhibiting protection (28). Other data indicate that silencing 15-LO in the setting of sepsis-induced acute kidney injury appears to be similarly protective (13). Mechanistically, 15-LO has been shown to alter neutrophil and macrophage phenotype in cardiac tissues in a model of acute coronary ischemia (29). Our study adds to the literature by showing that 15-LO plays a crucial role in modifying macrophage phenotype and metabolism during UUO progression, which likely influence its profibrotic nature in this model of renal fibrosis.
Flow cytometry of leukocyte populations revealed substantial and dynamic changes in recruited cells during UUO progression. 15-LO genetic KO significantly altered this dynamic. Neutrophils contribute to early proinflammatory events after UUO (30), and 15-LO KO significantly attenuated early neutrophil influx in injured kidneys. The paradoxical changes in Ly6CHi and Ly6CLow macrophages from 3 to 10 days post-UUO in KO mice are an intriguing finding and warrant further study. Although the eventual diminution in Ly6CLow in KO animals is consistent with an antifibrotic phenotype (1), the initial rise in this population earlier in UUO is of unclear significance. The Ly6CLow population is not thought to represent “M2a-like” macrophages until later in the course of UUO (2). Thus, it may not be accurate to refer to this population as “profibrotic” early after UUO. One possibility is that this earlier expanded population of Ly6CLow cells could reflect macrophages in transition between a M1 to M2 state or wound-healing dendritic cells.
Ly6CHi cells are thought to represent bone marrow-recruited, T-helper 1-stimulated, “M1-like” macrophages, and these were significantly reduced early after UUO in KO kidneys, a phenotype that has supported an anti-inflammatory, antifibrotic outcome after injury in other published literature (1). However, this population failed to diminish later in UUO in KO animals. The fact that fibrosis was improved in KO versus WT kidneys suggests that a late increase in Ly6CHi macrophages is not deleterious at engendering fibrosis during UUO progression. Given the relative decline in message levels of various proinflammatory cytokines at 10 days post-UUO in KO animals (Fig. 2A), we suspect that this population of late-peaking Ly6CHi cells may be phenotypically different than earlier-peaking Ly6CHi “M1-like” macrophages. Further evidence supporting this conclusion lies in the opposite phenotype noted in 10-day UUO Ly6CHi macrophages from 15LOTG versus WT mice (both message for CCL2 and Ly6CHi macrophage numbers were reduced, with worsened fibrosis). We know of no studies that have examined the phenotype or function of this population later in the course of renal injury.
Ly6CInt macrophages are a small but distinct population in the injured kidney and are thought to represent proresolving anti-inflammatory “M2c-like” macrophages that contribute to wound healing (1, 3, 31). The fact that these populations were significantly increased in KO versus WT animals and decreased in 15LOTG versus WT animals at all time points after UUO is a consistent finding and correlated with the overall profibrotic phenotype of 15-LO we have previously described. As a result, this population may be of significant interest for the future study of 15-LO in kidney injury.
Neutrophils and macrophages were also gated for CX3CR1 expression, given the significantly reduced and increased message expression of CX3CL1 in KO (Fig. 2A) and 15LOTG kidneys (Fig. 4A) versus WT controls, respectively. The flow cytometry data correlated with these findings, whereby KO leukocytes had reduced and 15LOTG leukocytes had elevated CX3CR1 expression in leukocyte populations, respectively (Fig. 6). Other published data have demonstrated that infiltrating Ly6CHiCX3CR1+ monocytes robustly express 15-LO after postoperative ileus in the intestinal mucosa (32). Another study showed that Ly6CLowCX3CR1+ macrophages isolated from livers in a murine APAP-induced hepatitis model had strong upregulation of Alox15 by RNA sequencing, and ablating this population of macrophages using CX3CR1-DTR mice was protective (10).
Our results are interesting given other published data supporting that CX3CR1 deletion worsens UUO-induced injury using CX3CR1GFP/GFP mice (33). Thus, it is unclear if blunting 15-LO expression alters CX3CL1-CX3CR1 signaling, diminishes recruitment/polarization of certain CX3CR1-positive cells but not others, or some combination given the clear need for global CX3CR1 expression in the kidney after UUO. Nevertheless, the diminished levels of Cx3cl1 mRNA, reduction in CX3CR1- and Ly6CLow-expressing macrophages by flow cytometry, and diminished F4/80 macrophage expression by histology in KO versus WT animals (with opposing phenotype in 15LOTG mice) support the possibility that 15-LO exerts its profibrotic effects specifically by controlling M2a macrophage polarization.
By comprehensive metabolomics, there was evidence of increased amino acid, nucleotide, and indole turnover early after UUO. This points toward overall increased cell metabolism, which might reflect the phenotypic differences in infiltrating leukocytes observed by flow cytometry at this early time point or an altered response in tubular epithelial cells. These changes were transient, and later during UUO evolution, we observed more broad changes in glycolysis. Other published data indicate that a “metabolic shift” occurs from the early to late/repair phases after acute kidney injury, with substantially increased anerobic glycolysis appreciated at later time points that is directly linked to failed tubular redifferentiation and progression of injury (34). Furthermore, we have previously published data demonstrating that silencing 5-LO induces a protective shift toward oxidative phosphorylation in renal tubules after UUO (18). Most mediators of glycolysis were blunted in KO UUO-injured kidneys versus WT injured kidneys by 10 days after UUO (Fig. 8D), consistent with overall inhibition of anerobic glycolysis at the organ level, which is likely a harmful process late after injury. This effect may be the cause or a consequence of reduced kidney fibrosis appreciated in KO mice at 14 days postinjury, and further study is needed to determine the significance of these findings.
Our study has some limitations. UUO is a high-throughput model of accelerated renal inflammation and fibrosis, but renal failure is not appreciated in affected mice. Also, contralateral control kidneys are generally accepted as suitable biological and histological controls, but these kidneys undergo compensatory hyperfiltration, which has the possibility to alter certain biological measurements.
Our data demonstrating altered macrophage populations in 15-LO KO and overexpressing mice is compelling, but we cannot infer that similar results would be obtained with another injury model that involves different resident and infiltrating cell populations (e.g., ischemia-reperfusion injury or glomerulonephritis). We also did not examine B and T cell populations in the UUO model by flow cytometry and thus cannot speculate if alterations in these populations could be responsible for some of the effects on renal fibrosis.
PD146176 is a highly specific inhibitor of 15-LO, although previously published data suggest that it can also trap free radicals (35). Profiled eicosanoids from kidneys of PD146176-treated mice undergoing UUO confirmed specific 15-LO inhibitory activity, with little evidence of 5-LO inhibition (Fig. 3A). 5-HETE expression was unaltered with administration of the drug, although 9-HODE, a 5-LO product of linoleic acid metabolism, was blunted in PD146176-treated mice. 9(S)-HODE has a very similar m/z as 13(S)-HODE, and thus some overlap in measurement could be present to explain these results. We have previously reported a significant reductions in renal fibrosis from antagonism of the 5-LO/5-LO-activating protein (FLAP)/cysteinyl leukotriene pathway using multiple genetic and pharmacological approaches (18), and these published experiments failed to show significant alterations in neutrophil and macrophage populations using a similar flow cytometry strategy in UUO. These data suggest that off-target 5-LO inhibition is unlikely to be responsible for the dramatic effects of this drug at altering immune populations and diminishing renal fibrosis.
We did not perform flow cytometry on PD146176-treated mice and thus cannot determine if drug inhibition of 15-LO would mirror the similar dynamic changes in kidney leukocyte populations observed with genetic silencing. By F4/80 immunostaining, PD146176 treatment had more potent effects to lower macrophage numbers versus KO animals (14.5 vs. 5.5 mean reduction, WT PD146176/WT vehicle vs. KO/WT, respectively; Figs. 2C and 3B). These data indicate that this compound could have other off-target beneficial effects.
Finally, we cannot determine from our data if manipulation of 15-LO affects levels of non-arachidonate mediators such as eicosapentaenoic and docosahexaenoic acids, which could have effects in altering inflammation and/or fibrosis after injury. Eicosapentaenoic and docosahexaenoic acids are known substrates of 15-LO, creating proresolving mediators such as resolvins, protectins, and maresins, and our lipidomic and metabolomic analyses were not particularly suited to detect these mediators.
Perspectives and Significance
The results of our study demonstrate that 15-LO is a crucial enzyme that regulates fibrinogenesis in the kidney predominantly by altering macrophage phenotype in a highly complex fashion. The significance of the dynamic changes in leukocyte phenotype from early to late in the setting of 15-LO manipulation provides a strong preclinical basis for further exploration of this pathway in CKD. Given that CKD is a global health epidemic with many different causes, understanding how the propagation of CKD occurs is of vital importance to develop new biomarkers and therapeutics for human use.
SUPPLEMENTAL DATA
Supplemental Fig. S1: https://doi.org/10.6084/m9.figshare.14711241.
Supplemental Fig. S2: https://doi.org/10.6084/m9.figshare.14711238.
Supplemental Fig. S3: https://doi.org/10.6084/m9.figshare.14711250.
GRANTS
This work was supported by a Veterans Heath Administration Career Development Award (VHA BLR&D IK2BX003839, to J.R.M.).
DISCLOSURES
No conflicts of interest, financial or otherwise, are declared by the authors.
AUTHOR CONTRIBUTIONS
J.R.M., K.H., R.N., and S.B.F. conceived and designed research; J.R.M., C.B., J.R., J.A.R., D.F., and J.K. performed experiments; J.R.M. and J.A.R. analyzed data; J.R.M., J.A.R., K.H., D.E.S., M.C.M.W.-E., R.N., S.F., and S.B.F. interpreted results of experiments; J.R.M. prepared figures; J.R.M. drafted manuscript; J.R.M., J.A.R., K.H., D.E.S., M.C.M.W.-E., R.N., S.F., and S.B.F. edited and revised manuscript; J.R.M. and S.B.F. approved final version of manuscript.
ACKNOWLEDGMENTS
The authors thank Yuri Miller (University of California, San Diego, CA) for the provision of 15LOTG mice for our study.
REFERENCES
- 1.Tang PM, Nikolic-Paterson DJ, Lan HY. Macrophages: versatile players in renal inflammation and fibrosis. Nat Rev Nephrol 15: 144–158, 2019. doi: 10.1038/s41581-019-0110-2. [DOI] [PubMed] [Google Scholar]
- 2.Lin SL, Castaño AP, Nowlin BT, Lupher ML Jr, Duffield JS. Bone marrow Ly6Chigh monocytes are selectively recruited to injured kidney and differentiate into functionally distinct populations. J Immunol 183: 6733–6743, 2009. doi: 10.4049/jimmunol.0901473. [DOI] [PubMed] [Google Scholar]
- 3.Clements M, Gershenovich M, Chaber C, Campos-Rivera J, Du P, Zhang M, Ledbetter S, Zuk A. Differential Ly6C expression after renal ischemia-reperfusion identifies unique macrophage populations. J Am Soc Nephrol 27: 159–170, 2016. doi: 10.1681/ASN.2014111138. [DOI] [PMC free article] [PubMed] [Google Scholar]
- 4.Wilson HM, Chettibi S, Jobin C, Walbaum D, Rees AJ, Kluth DC. Inhibition of macrophage nuclear factor-κB leads to a dominant anti-inflammatory phenotype that attenuates glomerular inflammation in vivo. Am J Pathol 167: 27–37, 2005. doi: 10.1016/S0002-9440(10)62950-1. [DOI] [PMC free article] [PubMed] [Google Scholar]
- 5.Ikezumi Y, Hurst L, Atkins RC, Nikolic-Paterson DJ. Macrophage-mediated renal injury is dependent on signaling via the JNK pathway. J Am Soc Nephrol 15: 1775–1784, 2004. doi: 10.1097/01.ASN.0000131272.06958.DE. [DOI] [PubMed] [Google Scholar]
- 6.Ikezumi Y, Suzuki T, Yamada T, Hasegawa H, Kaneko U, Hara M, Yanagihara T, Nikolic-Paterson DJ, Saitoh A. Alternatively activated macrophages in the pathogenesis of chronic kidney allograft injury. Pediatr Nephrol 30: 1007–1017, 2015. doi: 10.1007/s00467-014-3023-0. [DOI] [PubMed] [Google Scholar]
- 7.Kim MG, Kim SC, Ko YS, Lee HY, Jo SK, Cho W. The role of M2 macrophages in the progression of chronic kidney disease following acute kidney injury. PLoS One 10: e0143961, 2015. doi: 10.1371/journal.pone.0143961. [DOI] [PMC free article] [PubMed] [Google Scholar]
- 8.Lu J, Cao Q, Zheng D, Sun Y, Wang C, Yu X, Wang Y, Lee VW, Zheng G, Tan TK, Wang X, Alexander SI, Harris DC, Wang Y. Discrete functions of M2a and M2c macrophage subsets determine their relative efficacy in treating chronic kidney disease. Kidney Int 84: 745–755, 2013. doi: 10.1038/ki.2013.135. [DOI] [PubMed] [Google Scholar]
- 9.Snodgrass RG, Brüne B. Regulation and functions of 15-lipoxygenases in human macrophages. Front Pharmacol 10: 719, 2019. doi: 10.3389/fphar.2019.00719. [DOI] [PMC free article] [PubMed] [Google Scholar]
- 10.Yang W, Zhao X, Tao Y, Wu Y, He F, Tang L. Proteomic analysis reveals a protective role of specific macrophage subsets in liver repair. Sci Rep 9: 2953, 2019. doi: 10.1038/s41598-019-39007-6. [DOI] [PMC free article] [PubMed] [Google Scholar]
- 11.Jim K, Hassid A, Sun F, Dunn MJ. Lipoxygenase activity in rat kidney glomeruli, glomerular epithelial cells, and cortical tubules. J Biol Chem 257: 10294–10299, 1982. doi: 10.1016/S0021-9258(18)34018-3. [DOI] [PubMed] [Google Scholar]
- 12.Takahashi N, Kikuchi H, Usui A, Furusho T, Fujimaru T, Fujiki T, Yanagi T, Matsuura Y, Asano K, Yamamoto K, Ando F, Susa K, Mandai S, Mori T, Rai T, Uchida S, Arita M, Sohara E. Deletion of Alox15 improves kidney dysfunction and inhibits fibrosis by increased PGD2 in the kidney. Clin Exp Nephrol 25: 445–455, 2021. doi: 10.1007/s10157-021-02021-y. [DOI] [PMC free article] [PubMed] [Google Scholar]
- 13.Elmarakby AA, Ibrahim AS, Katary MA, Elsherbiny NM, El-Shafey M, Abd-Elrazik AM, Abdelsayed RA, Maddipati KR, Al-Shabrawey M. A dual role of 12/15-lipoxygenase in LPS-induced acute renal inflammation and injury. Biochim Biophys Acta Mol Cell Biol Lipids 1864: 1669–1680, 2019. doi: 10.1016/j.bbalip.2019.07.009. [DOI] [PMC free article] [PubMed] [Google Scholar]
- 14.Xu ZG, Yuan H, Lanting L, Li SL, Wang M, Shanmugam N, Kato M, Adler SG, Reddy MA, Natarajan R. Products of 12/15-lipoxygenase upregulate the angiotensin II receptor. J Am Soc Nephrol 19: 559–569, 2008. doi: 10.1681/ASN.2007080939. [DOI] [PMC free article] [PubMed] [Google Scholar]
- 15.Ackermann JA, Hofheinz K, Zaiss MM, Krönke G. The double-edged role of 12/15-lipoxygenase during inflammation and immunity. Biochim Biophys Acta Mol Cell Biol Lipids 1862: 371–381, 2017. doi: 10.1016/j.bbalip.2016.07.014. [DOI] [PubMed] [Google Scholar]
- 16.Ivanov I, Kuhn H, Heydeck D. Structural and functional biology of arachidonic acid 15-lipoxygenase-1 (ALOX15). Gene 573: 1–32, 2015. doi: 10.1016/j.gene.2015.07.073. [DOI] [PMC free article] [PubMed] [Google Scholar]
- 17.Serhan CN. Discovery of specialized pro-resolving mediators marks the dawn of resolution physiology and pharmacology. Mol Aspects Med 58: 1–11, 2017. doi: 10.1016/j.mam.2017.03.001. [DOI] [PMC free article] [PubMed] [Google Scholar]
- 18.Montford JR, Bauer C, Dobrinskikh E, Hopp K, Levi M, Weiser-Evans M, Nemenoff R, Furgeson SB. Inhibition of 5-lipoxygenase decreases renal fibrosis and progression of chronic kidney disease. Am J Physiol Renal Physiol 316: F732–F742, 2019. doi: 10.1152/ajprenal.00262.2018. [DOI] [PMC free article] [PubMed] [Google Scholar]
- 19.Ranjit S, Dobrinskikh E, Montford J, Dvornikov A, Lehman A, Orlicky DJ, Nemenoff R, Gratton E, Levi M, Furgeson S. Label-free fluorescence lifetime and second harmonic generation imaging microscopy improves quantification of experimental renal fibrosis. Kidney Int 90: 1123–1128, 2016. doi: 10.1016/j.kint.2016.06.030. [DOI] [PMC free article] [PubMed] [Google Scholar]
- 20.Nemkov T, Hansen KC, D’Alessandro A. A three-minute method for high-throughput quantitative metabolomics and quantitative tracing experiments of central carbon and nitrogen pathways. Rapid Commun Mass Spectrom 31: 663–673, 2017. doi: 10.1002/rcm.7834. [DOI] [PMC free article] [PubMed] [Google Scholar]
- 21.Nemkov T, Reisz JA, Gehrke S, Hansen KC, D’Alessandro A. High-throughput metabolomics: isocratic and gradient mass spectrometry-based methods. Methods Mol Biol 1978: 13–26, 2019. doi: 10.1007/978-1-4939-9236-2_2. [DOI] [PubMed] [Google Scholar]
- 22.Clasquin MF, Melamud E, Rabinowitz JD. LC-MS data processing with MAVEN: a metabolomic analysis and visualization engine. Curr Protoc Bioinformatics Chapter 14: Unit14.11, 2012. doi: 10.1002/0471250953.bi1411s37. [DOI] [PMC free article] [PubMed] [Google Scholar]
- 23.Xia J, Wishart DS. Using MetaboAnalyst 3.0 for comprehensive metabolomics data analysis. Curr Protoc Bioinformatics 55: 14.10.1–14.10.91, 2016. doi: 10.1002/cpbi.11. [DOI] [PubMed] [Google Scholar]
- 24.Montford JR, Lehman AMB, Bauer CD, Klawitter J, Klawitter J, Poczobutt JM, Scobey M, Weiser-Evans M, Nemenoff RA, Furgeson SB. Bone marrow-derived cPLA2α contributes to renal fibrosis progression. J Lipid Res 59: 380–390, 2018. doi: 10.1194/jlr.M082362. [DOI] [PMC free article] [PubMed] [Google Scholar]
- 25.Orafaie A, Matin MM, Sadeghian H. The importance of 15-lipoxygenase inhibitors in cancer treatment. Cancer metastasis Rev 37: 397–408, 2018. doi: 10.1007/s10555-018-9738-9. [DOI] [PubMed] [Google Scholar]
- 26.Bocan TM, Rosebury WS, Mueller SB, Kuchera S, Welch K, Daugherty A, Cornicelli JA. A specific 15-lipoxygenase inhibitor limits the progression and monocyte-macrophage enrichment of hypercholesterolemia-induced atherosclerosis in the rabbit. Atherosclerosis 136: 203–216, 1998. [Erratum in Atherosclerosis 139: 201, 1998]. doi: 10.1016/S0021-9150(97)00204-9. [DOI] [PubMed] [Google Scholar]
- 27.Nair DG, Funk CD. A cell-based assay for screening lipoxygenase inhibitors. Prostaglandins Other Lipid Mediat 90: 98–104, 2009. doi: 10.1016/j.prostaglandins.2009.09.006. [DOI] [PubMed] [Google Scholar]
- 28.Yuan H, Reddy MA, Deshpande S, Jia Y, Park JT, Lanting LL, Jin W, Kato M, Xu ZG, Das S, Natarajan R. Epigenetic histone modifications involved in profibrotic gene regulation by 12/15-lipoxygenase and its oxidized lipid products in diabetic nephropathy. Antioxid Redox Signal 24: 361–375, 2016. doi: 10.1089/ars.2015.6372. [DOI] [PMC free article] [PubMed] [Google Scholar]
- 29.Kain V, Ingle KA, Kabarowski J, Barnes S, Limdi NA, Prabhu SD, Halade GV. Genetic deletion of 12/15 lipoxygenase promotes effective resolution of inflammation following myocardial infarction. J Mol Cell Cardiol 118: 70–80, 2018. doi: 10.1016/j.yjmcc.2018.03.004. [DOI] [PMC free article] [PubMed] [Google Scholar]
- 30.Wang H, Gao M, Li J, Sun J, Wu R, Han D, Tan J, Wang J, Wang B, Zhang L, Dong Y. MMP-9-positive neutrophils are essential for establishing profibrotic microenvironment in the obstructed kidney of UUO mice. Acta Physiol (Oxf) 227: e13317, 2019. doi: 10.1111/apha.13317. [DOI] [PubMed] [Google Scholar]
- 31.Meng XM, Tang PM, Li J, Lan HY. Macrophage phenotype in kidney injury and repair. Kidney Dis (Basel) 1: 138–146, 2015. doi: 10.1159/000431214. [DOI] [PMC free article] [PubMed] [Google Scholar]
- 32.Stein K, Stoffels M, Lysson M, Schneiker B, Dewald O, Krönke G, Kalff JC, Wehner S. A role for 12/15-lipoxygenase-derived proresolving mediators in postoperative ileus: protectin DX-regulated neutrophil extravasation. J Leukoc Biol 99: 231–239, 2016. doi: 10.1189/jlb.3HI0515-189R. [DOI] [PubMed] [Google Scholar]
- 33.Engel DR, Krause TA, Snelgrove SL, Thiebes S, Hickey MJ, Boor P, Kitching AR, Kurts C. CX3CR1 reduces kidney fibrosis by inhibiting local proliferation of profibrotic macrophages. J Immunol 194: 1628–1638, 2015. doi: 10.4049/jimmunol.1402149. [DOI] [PubMed] [Google Scholar]
- 34.Lan R, Geng H, Singha PK, Saikumar P, Bottinger EP, Weinberg JM, Venkatachalam MA. Mitochondrial pathology and glycolytic shift during proximal tubule atrophy after ischemic AKI. J Am Soc Nephrol 27: 3356–3367, 2016. doi: 10.1681/ASN.2015020177. [DOI] [PMC free article] [PubMed] [Google Scholar]
- 35.Shah R, Shchepinov MS, Pratt DA. Resolving the role of lipoxygenases in the initiation and execution of ferroptosis. ACS Cent Sci 4: 387–396, 2018. doi: 10.1021/acscentsci.7b00589. [DOI] [PMC free article] [PubMed] [Google Scholar]


