

Abstract
Background:
Long-term prognostication is important to inform preventive care in older adults. Existing prediction indices incorporate age and comorbidities. Frailty is another important factor in prognostication. In this project, we aimed to develop life expectancy estimates that incorporate both comorbidities and frailty.
Methods:
In this retrospective cohort study, we used data from a 5% sample of Medicare beneficiaries with and without history of cancer from Surveillance, Epidemiology, and End Results (SEER) cancer registry areas. We included adults aged 66–95 who were continuously enrolled in fee-for-service Medicare for ≥1 year from 1998–2014. Participants were followed for survival until 12/31/2015, death, or disenrollment. Comorbidity (none, low/medium, high) and frailty categories (low, high) were defined using established methods for claims. We estimated 5-and 10-year survival probabilities and median life expectancies by age, sex, comorbidities and frailty.
Results:
Study included 479,646 individuals (4,128,316 person-years), of whom most were women (58.7%). Frailty scores varied widely among participants in the same comorbidity category. In Cox models, both comorbidities and frailty were independent predictors of mortality. Individuals with high comorbidities (HR 3.24, 95% CI 3.20–3.28) and low/medium comorbidities (HR 1.36, 95% CI 1.34–1.39) had higher risks of death than those with no comorbidities. Compared to low frailty, high frailty was associated with higher risk of death (HR 1.55, 95% CI 1.52–1.58). Frailty affected life expectancy estimates in ways relevant to preventive care (i.e. distinguishing <10-year versus >10-year life expectancy) in multiple subgroups.
Conclusion:
Incorporating both comorbidities and frailty may be important in estimating long-term life expectancies of older adults. Our life expectancy tables can aid clinicians’ prognostication and inform simulation models and population health management.
Keywords: prognostication, comorbidities, frailty
INTRODUCTION
Predicting patients’ long-term health trajectories is important to inform preventive care decisions in older adults.1–12 Specifically, a life expectancy of less than 10 years is a commonly used threshold for defining “limited life expectancy” and for de-intensifying certain preventive care tests that have a long lag-time to benefit.5–11 For example, national guidelines recommend against routine screening for breast, colorectal, and prostate cancers in older adults who are expected to live less than 10 years because the short-terms harms and burdens of screening outweigh the delayed benefits.5–9 Similarly, guidelines recommend a less intensive glycemic goal for diabetes mellitus treatment in older adults with less than 10-year life expectancy.11,12
A robust body of evidence suggests that age alone, while important, is an insufficient marker of prognosis in older adults; older adults of the same age can have very heterogeneous health trajectories.3,13 Literature also suggests that clinicians are uncomfortable with prognostication and often inaccurate in their estimates,14,15 highlighting the importance of tools that can help estimate life expectancy in older adults. Several predictive algorithms have been developed to predict mortality or life expectancy over 10 or more years in older adults. All of these incorporate information about chronic conditions (we use the term comorbidities in this paper) in addition to age to aid in prognostication.1,16–21
Frailty, a common medical syndrome in older adults associated with decline in reserve and function across multiple physiologic systems, has been shown to be predictive of multiple adverse outcomes including mortality, hospitalization, and institutionalization; it has in particular been highlighted as a significant risk factor during the COVID-19 pandemic.22–26 The physical frailty phenotype characterizes a state of increased vulnerability to stressors resulting from depleted physiologic reserves and is conceptualized as a distinct entity from comorbidities or multimorbidity - the concurrent presence of two or more medically diagnosed diseases.27,28 Despite evidence suggesting that incorporating both comorbidities and frailty in mortality prediction can be valuable,29 we found no published studies that predicted long-term mortality (greater than 10 years) of older adults while incorporating both comorbidities and frailty. Thus, we aimed to build upon previous work to develop life expectancy estimates that incorporate both comorbidities and frailty status.
METHODS
Data source and study population
We identified a cohort from a random 5% sample of Medicare beneficiaries from the Surveillance, Epidemiology, and End Results (SEER)-Medicare linked database. Briefly, a 5% sample of Medicare beneficiaries residing in the SEER areas are drawn at random; these include beneficiaries with cancer per the SEER cancer registry data and beneficiaries who are cancer-free.30 We included adults aged 66–95 who were continuously enrolled in fee-for-service Medicare Parts A and B for at least one year between January 1, 1998 and December 31, 2014. We chose to exclude individuals who were > 95 years of age at time of enrollment because the involved sample size was small and predicting 5- and 10-year mortality risks was less relevant for this age group in clinical practice. We excluded individuals whose reason for Medicare qualification was not old age because these individuals mostly qualified for Medicare due to disabilities or end-stage renal disease and likely had distinct differences in long-term life expectancies than the other Medicare beneficiaries. We also excluded those with invalid death date or unknown race. Participants were followed for survival until end of study period (December 31, 2015), death, or dis-enrollment from fee-for-service Medicare. Unit of analysis was an episode of care defined as each 12-month period that a beneficiary was continuously enrolled in fee-for-service Medicare before the beneficiary’s birthday. The final study cohort included 479,646 individuals and 4,128,316 12-month episodes (Supplementary Figure S1).
Comorbidity and Frailty Measures
Comorbidities and frailty were both defined using established methods from Medicare claims (inpatient, outpatient, physician billing).1,31,32 We assessed comorbidity status and frailty status for each episode of care included in the study cohort from 1998–2014.
Comorbidity status was assessed using the method by Cho et al using a modified Charlson index.1,32 We excluded diagnoses on outpatient or physician supplier claims that did not appear more than once over time span exceeding 30 days so as to exclude work up of suspected diagnoses.33 After the list of comorbidities were identified in claims using diagnosis codes,32 we assigned a weighted score for each condition using the estimated effect of each condition on survival that has been reported previously (e.g. coefficient of each condition on overall survival in Cox model). 1 The list of conditions and associated weighted scores are included in Supplementary Table S1. We summed the individual scores of each condition into a total comorbidity score for each 12-month episode of care. We then classified each episode of care into 3 comorbidity categories based on the total comorbidity score using the cut points established by Cho et al: “no comorbidities” (total score = 0), “low/medium comorbidities” (0 < total score ≤ 0.56), and “high comorbidities” (total score > 0.56).1
Frailty status was assessed using a validated claims-based algorithm that estimates the probability of having the physical frailty phenotype by Segal et al.31 A frailty score ranging from 0 to 1, denoting the probability of having physical frailty phenotype, was calculated for each episode of care. We then classified each episode of care into 2 frailty categories: we defined “low frailty” as a score of ≤ 0.15 and “high frailty” as a score > 0.15. To identify the optimal cutoff, we examined different cutoffs of the frailty score at 0.05 intervals and estimated, for each potential cutoff, the hazard ratio (HR) associated with higher frailty on mortality, which was our outcome of interest. We chose the cutoff of 0.15 at which the highest HR was found, suggesting that this cutoff was most able to discriminate the effect of frailty on mortality. The conditions that are used to define frailty are listed in Supplementary Table S2.
Analysis
Our primary outcome of interest was time-to-death from any cause during the study period. The two main predictors of interest were the comorbidity and frailty categories. First, using a time-dependent Cox proportional hazards model with age as the time scale and the comorbidity and frailty categories as time-varying independent variables, we estimated the association between comorbidities and frailty with all-cause mortality, while adjusting for sex, race, year of initial enrollment and SEER region. Then, we generated separate actuarial (Kaplan-Meier) estimates of 5- and 10-year survival probabilities starting at specific ages from 66–90 for subgroups defined by age, sex, and the comorbidity and frailty categories at the given starting age. Median life expectancy for each subgroup was estimated as the corresponding median overall survival in years.
We used Kaplan-Meier estimates of survival probabilities rather than model-based estimates for two reasons. Prognostication of individual survival is fraught with difficulties in time-dependent Cox models and would entail strong modeling assumptions.34 In contrast, actuarial (Kaplan-Meier) estimates do not entail any modeling assumptions. Further, our approach minimizes selection bias due to left truncation in the study cohort. Left truncation occurs when those who entered the study cohort at older ages were represented in the analysis but their counterparts who died at younger ages were not included in the cohort; using model estimates, when left truncation is present, could lead to significantly more favorable estimates of survival than the Kaplan-Meier estimates. We chose not to estimate race-specific survival probabilities because of the potential of inadvertently exacerbating health inequities if these estimates were used to inform receipt of preventive care services.35
As sensitivity analyses to explore the generalizability of survival estimates from our study cohort, we compared the survival at different ages between our cohort to the general U.S. older adults using the U.S. life tables at two time points during the study period (2000 and 2010).36
All analyses were conducted using SAS version 9.4 (Cary, NC) and R version 4.0.0 (www.R-project.org). This study was considered exempt from human subject research by the Institutional Review Board because study involved secondary analysis of de-identified data.
RESULTS
The study cohort was predominantly women (58.7%) and white (82.3%) (Table 1); 29.7% of participants died during the study period and 22.5% were administratively censored for disenrollment from fee-for-service Medicare. Follow up time, defined as the number of 12-month episodes per person, ranged from 1 to 17 with a median of 8 years.
Table 1.
Demographic characteristics, comorbidity and frailty categories in the study cohort of Medicare beneficiaries in SEER areas (1998–2014)
| Beneficiaries N = 479,646 | Episodes a N = 4,128,316 | |
|---|---|---|
| Age – n (%) | ||
| 66–69 y | 287036 (59.8) | 903862 (21.9) |
| 70–74 y | 80554 (16.8) | 1006736 (24.4) |
| 75–79 y | 57580 (12.0) | 842014 (20.4) |
| 80–84 y | 33441 (7.0) | 628414 (15.2) |
| 85–89 y | 15630 (3.3) | 369553 (9.0) |
| 90–95 y | 5405 (1.1) | 377737 (9.1) |
|
| ||
| Sex – n (%) | ||
| Female | 281526 (58.7) | 2510578 (60.8) |
| Male | 198120 (41.3) | 1617738 (39.2) |
|
| ||
| Race – n (%) | ||
| White | 394637 (82.3) | 3483511 (84.4) |
| Black | 36494 (7.6) | 279896 (6.8) |
| Other | 48515 (10.1) | 364909 (8.8) |
|
| ||
| Status at end of follow up – n (%) | ||
| Alive and not censored | 229698 (47.9) | 2189636 (53.0) |
| Dead and not censored | 142267 (29.7) | 1316568 (31.9) |
| Administratively censored | 107681 (22.5) | 622112 (15.1) |
|
| ||
| Comorbidity categories b | ||
| None | - | 2623066 (63.5) |
| Low/medium | - | 646753 (15.7) |
| High | - | 858497 (20.8) |
|
| ||
| Frailty score – mean (SD) | - | 0.14 (0.14) |
|
| ||
| Frailty category– n (%) | ||
| Low frailty (score < 0.15) | - | 2879256 (69.7) |
| High frailty (score ≥ 0.15) | - | 1249060 (30.3) |
|
| ||
| Personal history of cancer – n (%) | 75490 (15.7) | 664883 (16.1) |
|
| ||
| SEER Region– n (%) | ||
| California c | 158746 (33.1) | |
| Connecticut | 26121 (5.4) | |
| Detroit | 28714 (6.0) | |
| Hawaii | 7423 (1.5) | |
| Iowa | 26665 (5.6) | |
| New Mexico | 12912 (2.7) | |
| Seattle | 26258 (5.5) | |
| Utah | 12471 (2.6) | |
| Atlanta and rural Georgia | 56139 (11.7) | |
| Kentucky | 31516 (6.6) | |
| Louisiana | 28086 (5.9) | |
| New Jersey | 64595 (13.5) | |
|
| ||
| Year of entry to study cohort– n (%) | ||
| 1998–2000 | 218131 (45.5) | |
| 2001–2003 | 68177 (14.2) | |
| 2004–2006 | 55919 (11.7) | |
| 2007–2009 | 56444 (11.8) | |
| 2010–2012 | 60615 (12.6) | |
| 2013 | 20360 (4.2) | |
Note: Abbreviations: y = years
An episode of care was defined as each 12-month period that a beneficiary was continuously enrolled in fee-for-service Medicare before a beneficiary’s birthday.
“None” denotes having no comorbidities from the modified Charlson index used in this study.
Includes greater California, San Francisco, San Jose, and Los Angeles registries
Across all person-years (episodes) of data, 63.5% had none of the comorbidities from the modified Charlson index, 15.7% were classified as having low/medium comorbidities, and 20.8% were classified as having high comorbidities. The median frailty score (ranges from 0–1) was 0.09 for the entire study cohort and most (69.7%) were considered to have low frailty. Figure 1 illustrates the wide range of frailty scores among participants within the same comorbidity category at a given age and that these frailty score ranges were overlapping across age and comorbidity categories so that neither age nor comorbidities sufficiently predicted frailty status. Specifically, among those with no comorbidities, the median (first quartile [Q1], third quartile [Q3]) of the frailty score was 0.07 (0.04, 0.12); among those with low/medium comorbidities, median (Q1, Q3) of the frailty score was 0.12 (0.07, 0.21); among those with high comorbidities, median (Q1, Q3) of the frailty score was 0.20 (0.12, 0.38).
Figure 1.
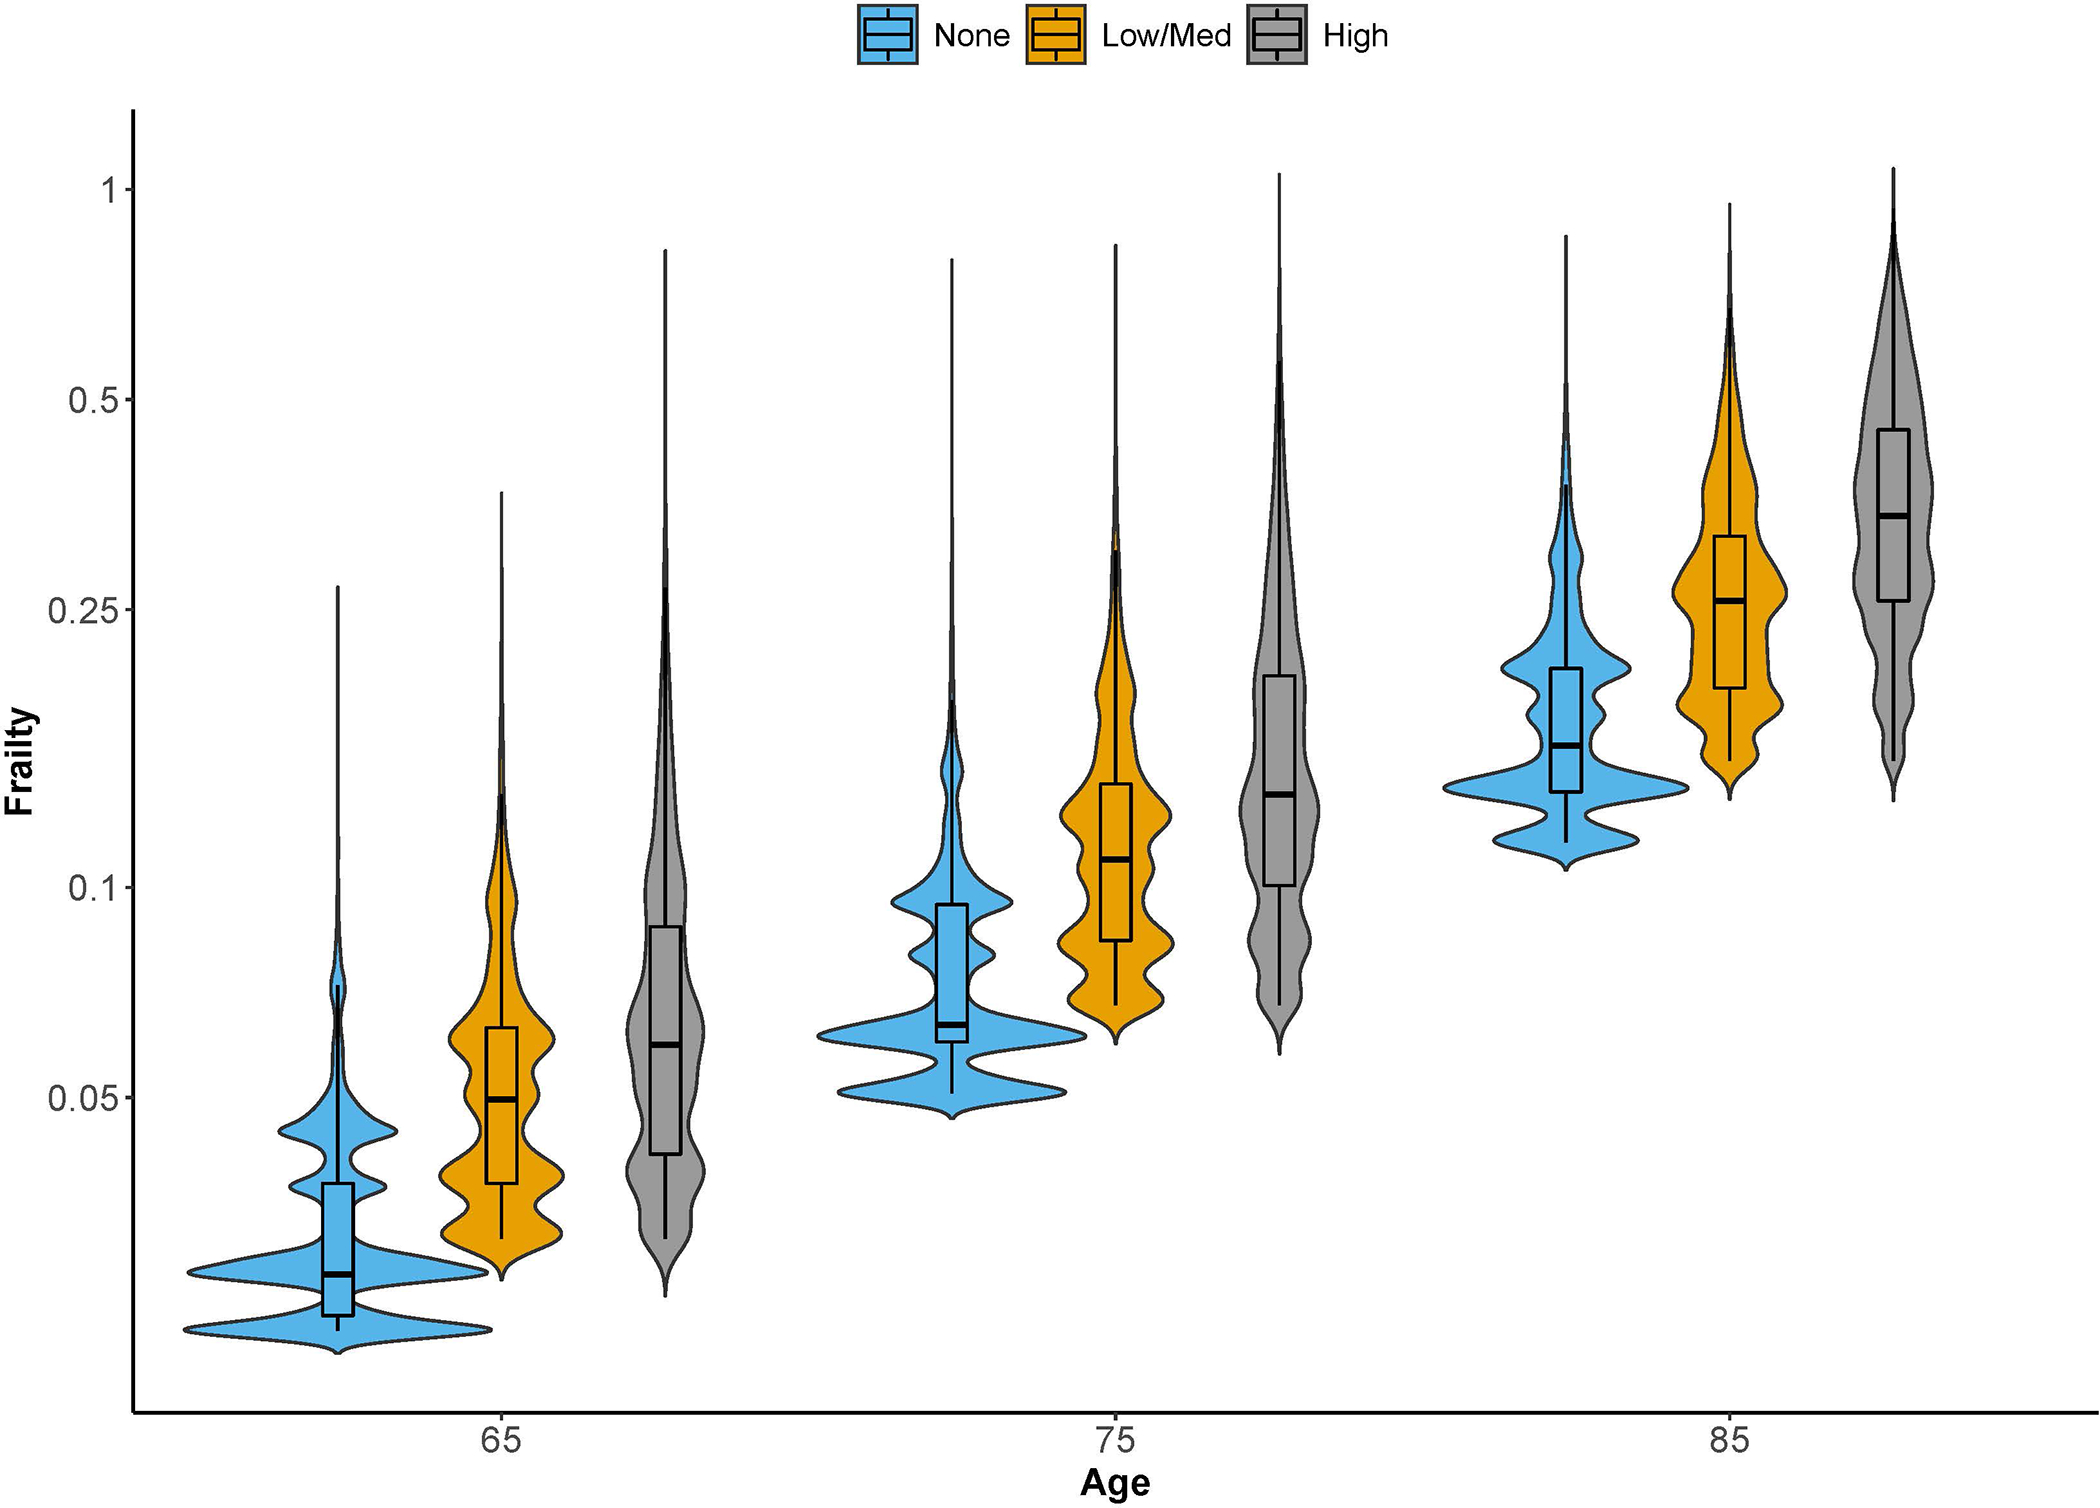
The violin plot shows the distribution of frailty scores (ranges from 0–1) across the three comorbidity categories at ages 65, 75, and 85 years. The Y-axis is on log-scale. The violin plot is a combination of box plot and density plot. Similar to a box plot, it shows the range of the frailty scores vertically including the median and interquartile range; at the same time, it also shows the kernel density estimate of the data horizontally as would a histogram.
We found that both comorbidities and frailty were independently associated with all-cause mortality in the Cox model, after adjusting for sex, race, year of initial enrollment and SEER region (Supplementary Table S3). Having high comorbidities category (Hazard Ratio [HR] 3.24, 95% Confidence Interval [CI] 3.20–3.28) and low/medium comorbidities category (HR 1.36, 95% CI 1.34–1.39) were both associated with higher risks of death than having no comorbidities. Compared to low frailty, high frailty category was associated with a higher risk of death (HR 1.55, 95% CI 1.52–1.58).
Table 2 shows the Kaplan-Meier estimates of 5-year and 10-year survival probabilities stratified by age, sex, comorbidity and frailty categories, with associated sample sizes for each subgroup. Survival probabilities generally decreased with age within each subgroup; for example, 10-year survival probabilities for males with low/medium comorbidities and low frailty ranged from 79% at age 66 to 39% at age 80. Survival probabilities decreased as comorbidities increased and as frailty increased. For example, a 70-year-old male with low/medium comorbidities and low frailty had a 10-year survival probability of 70%. If he were to have high frailty instead of low frailty, the 10-year survival probability is lowered to 55%. If he were to have high comorbidities instead of low/medium comorbidities, the 10-year survival probability is lowered to 48%. The overall survival of our study cohort closely matched that of the U.S. older adults in sensitivity analyses (Supplementary Figure S2).
Table 2.
Five-year and ten-year survival probabilities (%) by age, sex, comorbidity and frailty categories.
| Male | Female | |||||
|---|---|---|---|---|---|---|
|
| ||||||
| N | Survival Probability a (%) |
N | Survival Probability a (%) |
|||
| 5 years |
10 years |
5 years |
10 years |
|||
| All persons | ||||||
| 66y | 87498 | 93 [93, 94] | 82 [81, 82] | 111587 | 96 [96, 96] | 88 [87, 88] |
| 70y | 95711 | 90 [90, 90] | 73 [73, 74] | 123206 | 93 [93, 93] | 80 [80, 81] |
| 75y | 77412 | 84 [83, 84] | 58 [57, 58] | 111086 | 88 [88, 89] | 67 [67, 68] |
| 80y | 57367 | 73 [72, 73] | 39 [38, 39] | 95616 | 79 [79, 80] | 48 [48, 49] |
| 85y | 35175 | 57 [56, 57] | 19 [18, 20] | 70676 | 65 [64, 65] | 27 [26, 27] |
| 90y | 15095 | 36 [35, 37] | 6 [5, 7] | 38393 | 45 [44, 45] | 10 [10, 11] |
|
| ||||||
| No comorbidities, b Low frailty | ||||||
| 66y | 67284 | 95 [95, 95] | 85 [85, 85] | 86364 | 97 [97, 97] | 91 [90, 91] |
| 70y | 67480 | 93 [93, 93] | 79 [78, 79] | 87894 | 96 [96, 96] | 85 [85, 86] |
| 75y | 48721 | 89 [89, 90] | 66 [65, 66] | 69149 | 93 [93, 93] | 75 [75, 76] |
| 80y | 30411 | 82 [81, 82] | 48 [47, 49] | 44963 | 88 [88, 88] | 59 [58, 60] |
| 85y | 10775 | 70 [69, 71] | 27 [26, 28] | 15783 | 78 [78, 79] | 37 [36, 38] |
| 90y | 0 | 0 | ||||
|
| ||||||
| No comorbidities, b High frailty | ||||||
| 66y | - c | - c | - c | 34 | 86 [73, 100] | 76 [61, 95] |
| 70y | 49 | 81 [70, 94] | 81 [70, 94] | 454 | 91 [88, 94] | 76 [71, 82] |
| 75y | 417 | 76 [71, 81] | 47 [41, 55] | 3595 | 90 [89, 91] | 70 [68, 72] |
| 80y | 2378 | 73 [71, 75] | 40 [37, 42] | 11965 | 84 [83, 84] | 52 [51, 53] |
| 85y | 7361 | 65 [64, 66] | 22 [21, 24] | 22114 | 73 [72, 74] | 32 [31, 33] |
| 90y | 7072 | 47 [46, 48] | 9 [8, 10] | 18172 | 57 [56, 58] | 15 [14, 16] |
|
| ||||||
| Low/Med comorbidities, Low frailty | ||||||
| 66y | 11441 | 93 [92, 93] | 79 [78, 80] | 13838 | 95 [94, 95] | 84 [83, 85] |
| 70y | 14518 | 90 [89, 90] | 70 [69, 71] | 16892 | 93 [93, 94] | 78 [77, 79] |
| 75y | 11460 | 85 [84, 86] | 57 [55, 58] | 13218 | 89 [89, 90] | 65 [64, 66] |
| 80y | 5152 | 77 [75, 78] | 39 [37, 41] | 5093 | 83 [82, 84] | 48 [46, 50] |
| 85y | 0 | 0 | ||||
| 90y | 0 | 0 | ||||
|
| ||||||
| Low/Med comorbidities, High frailty | ||||||
| 66y | 33 | 81 [68, 98] | 70 [49, 98] | 211 | 90 [85, 95] | 73 [64, 83] |
| 70y | 234 | 81 [75, 87] | 55 [46, 66] | 1255 | 87 [85, 89] | 69 [65, 73] |
| 75y | 1471 | 77 [74, 79] | 47 [43, 51] | 4959 | 86 [85, 87] | 60 [58, 62] |
| 80y | 4527 | 72 [71, 74] | 36 [34, 38] | 10980 | 78 [77, 79] | 44 [43, 45] |
| 85y | 5686 | 59 [58, 61] | 18 [17, 20] | 11665 | 67 [66, 68] | 26 [25, 27] |
| 90y | 2289 | 39 [37, 42] | 6 [5, 8] | 6077 | 47 [46, 49] | 10 [9, 11] |
|
| ||||||
| High comorbidities, Low frailty | ||||||
| 66y | 8404 | 81 [80, 82] | 57 [55, 58] | 10172 | 87 [86, 87] | 68 [67, 70] |
| 70y | 11948 | 77 [76, 78] | 48 [47, 50] | 13162 | 83 [83, 84] | 61 [59, 62] |
| 75y | 10532 | 71 [70, 72] | 36 [35, 38] | 10019 | 78 [77, 79] | 49 [48, 50] |
| 80y | 4002 | 62 [60, 64] | 25 [23, 27] | 3298 | 72 [70, 74] | 35 [32, 37] |
| 85y | 0 | 0 | ||||
| 90y | 0 | 0 | ||||
|
| ||||||
| High comorbidities, High frailty | ||||||
| 66y | 333 | 59 [53, 65] | 29 [22, 38] | 968 | 67 [64, 71] | 41 [37, 47] |
| 70y | 1482 | 54 [51, 57] | 23 [20, 27] | 3549 | 66 [64, 68] | 39 [37, 42] |
| 75y | 4811 | 55 [53, 56] | 24 [22, 26] | 10146 | 65 [64, 66] | 34 [33, 35] |
| 80y | 10897 | 49 [48, 50] | 16 [15, 17] | 19317 | 58 [57, 59] | 24 [23, 25] |
| 85y | 11353 | 38 [37, 39] | 8 [7, 9] | 21114 | 44 [44, 45] | 12 [12, 13] |
| 90y | 5734 | 22 [21, 23] | 2 [2, 3] | 14144 | 29 [28, 30] | 4 [4, 5] |
Survival probabilities and 95% confidence intervals are calculated using the Kaplan-Meier method for each subgroup defined by age, sex, comorbidity, and frailty.
“No comorbidities” denotes having no comorbidities from the modified Charlson index used in this study.
Suppressed to protect confidentiality due to small sample size
The corresponding median life expectancies stratified by age, sex, comorbidity and frailty categories are shown in Table 3. For some subgroups at younger ages (66 to 70) with no comorbidities or low/medium comorbidities and/or low frailty, survival over the study period was too high to estimate median life expectancies (Not Reached [NR]). The corresponding 5- and 10-year survival probabilities could be used to inform clinical decisions in these cases. Conversely, for certain subgroups at older ages, there were insufficient sample size to make estimates. Within the same comorbidity categories, frailty status (high versus low frailty) changed estimated life expectancies, ranging from 0.4 years for 80-year-old males with low/medium comorbidities to as much as 7.2 years for 66-year-old females with high comorbidities. For a number of these subgroups, the change in estimated life expectancies altered whether the individual would be categorized as having “limited life expectancy” of <10 years versus >10 years and would potentially lead to different preventive care decisions. For example, a 70-year-old female with high comorbidities and low frailty would still have a median life expectancy of 12.5 years, whereas an individual with the same age and comorbidity status but high frailty would have a median life expectancy of 7.8 years. In the latter individual, routine screening for breast and colorectal cancers may no longer be recommended even though she is well below the age of 75 years, which is normally considered as the threshold for cessation of screening. We illustrate the effect of frailty status on survival in a hypothetical 70-year-old woman by showing the Kaplan-Meier analyses for each possible combination of comorbidity and frailty categories in Figure 2.
Table 3.
Life expectancy in years by age, sex, comorbidity and frailty categories.
| Male, by Age | All persons | No Comorbidities a | Low/Med Comorbidities | High Comorbidities | |||
|---|---|---|---|---|---|---|---|
| Low Frailty | High Frailty | Low Frailty | High Frailty | Low Frailty | High Frailty | ||
| 66 70 75 80 85 90 |
NR 15.1 [14.9, 15.3] 11.4 [11.3, 11.5] 8.3 [8.2, 8.3] 5.7 [5.7, 5.8] 3.7 [3.7, 3.8] |
NR 16.1 [15.9, 16.4] 12.6 [12.5, 12.7] 9.7 [9.6, 9.8] 7.2 [7.1, 7.4] - b |
- b NR 9.1 [8.7, 11.9] 8.1 [7.8, 8.9] 6.6 [6.4, 6.7] 4.7 [4.6, 4.8] |
NR 14.0 [13.8, 14.5] 11.3 [10.9, 11.5] 8.5 [8.3, 8.8] - b - b |
NR 11.2 [9.4, NR] 9.4 [8.8, 10.3] 8.0 [7.8, 8.3] 5.9 [5.8, 6.0] 4.1 [3.8, 4.3] |
11.5 [11.1, 12.2] 9.8 [9.5, 10.0] 7.8 [7.6, 8.0] 6.5 [6.2, 6.7] - b - b |
6.1 [5.5, 7.0] 5.6 [5.2, 5.9] 5.5 [5.3, 5.8] 4.8 [4.7, 5.0] 3.8 [3.7, 3.9] 2.7 [2.6, 2.8] |
| Female, by Age | |||||||
| 66 70 75 80 85 90 |
NR NR 13.4 [13.3, 13.5] 9.8 [9.7, 9.8] 6.8 [6.7, 6.8] 4.5 [4.5, 4.6] |
NR NR 14.7 [14.6, 14.8] 11.3 [11.2, 11.4] 8.4 [8.3, 8.6] - b |
NR NR 13.4 [13.1, 13.7] 10.3 [10.1, 10.6] 7.7 [7.6, 7.8] 5.6 [5.6, 5.7] |
NR 15.7 [15.6, 16.3] 12.7 [12.5, 13.0] 9.7 [9.4, 9.9] - b - b |
14.8 [12.1, NR] 13.9 [12.8, 15.8] 11.8 [11.3, 12.3] 9.1 [8.9, 9.3] 6.9 [6.7, 7.0] 4.8 [4.7, 4.9] |
14.8 [14.4, 15.4] 12.5 [12.1, 12.9] 9.8 [9.6, 10.1] 7.7 [7.5, 7.9] - b - b |
7.6 [7.0, 8.8] 7.8 [7.4, 8.2] 7.1 [7.0, 7.4] 5.9 [5.8, 6.0] 4.4 [4.3, 4.5] 3.1 [3.1, 3.2] |
Notes: Abbreviations: NR = Median overall survival time not reached or the upper 95% confidence interval limit not reached.
Life expectancy in years is calculated as the median overall survival time using the Kaplan-Meier method for each subgroup defined by age, sex, comorbidity, and frailty
“No comorbidities” denotes having no comorbidities from the modified Charlson index used in this study.
Values denoted by a dash (“-“) are for subgroups where the sample size was too small to report estimates
Figure 2.
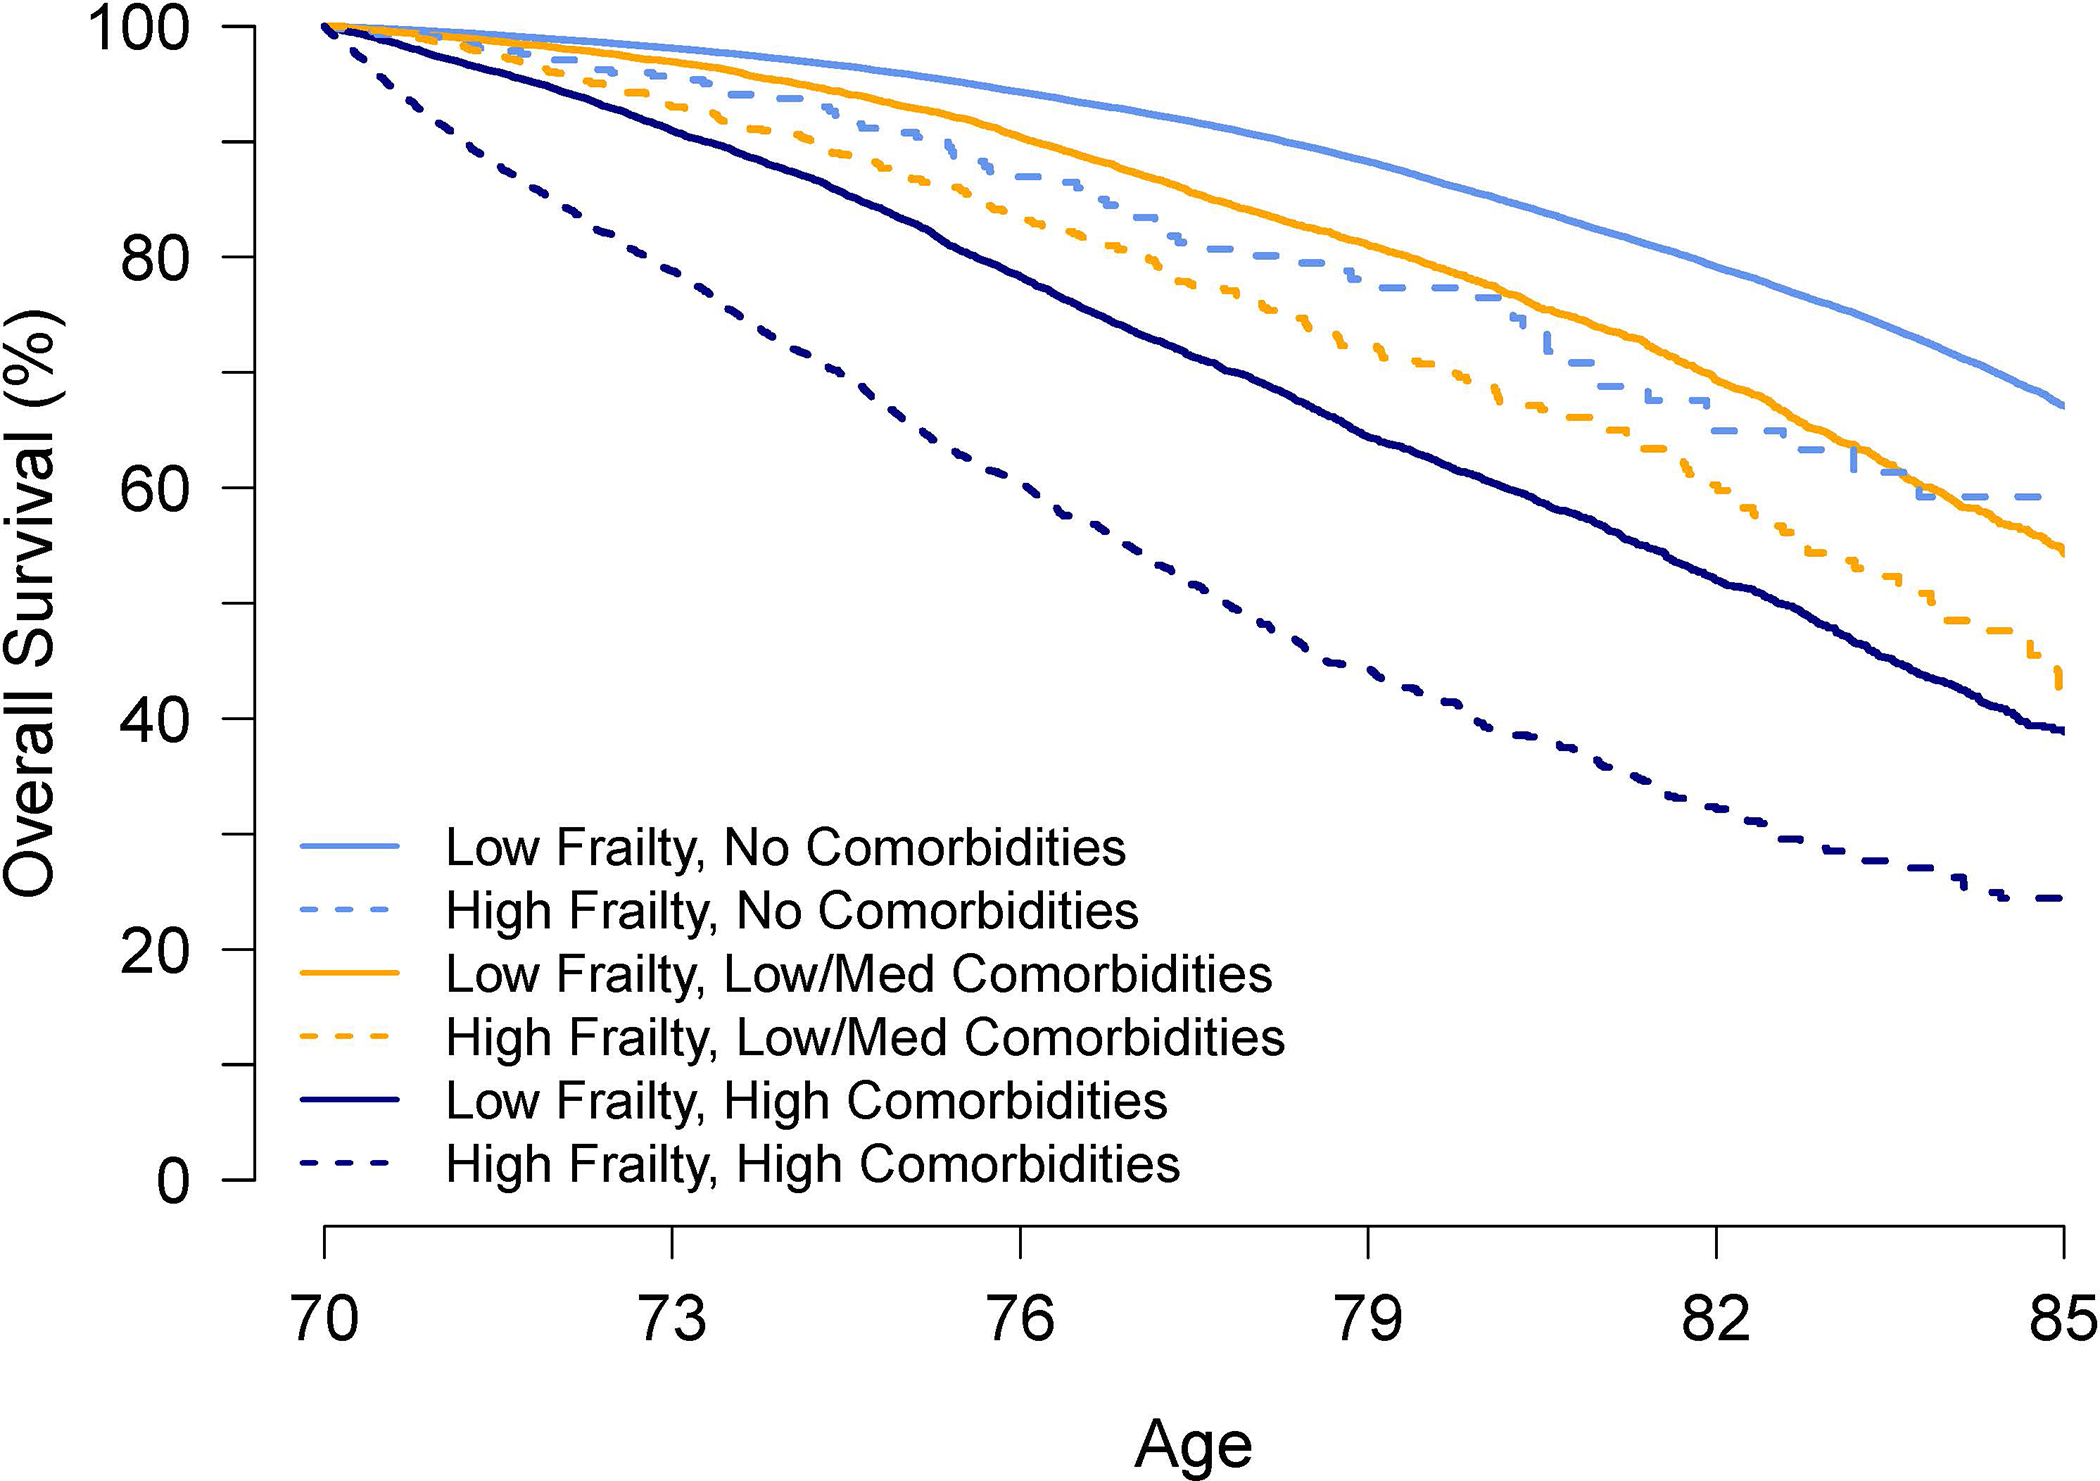
Kaplan-Meier analyses for a hypothetical 70-year-old woman for each possible combination of comorbidities (none, low/medium, high) and frailty (low, high).
DISCUSSION
We incorporated both comorbidities and frailty to estimate 5- and 10-year survival probabilities and median life expectancies for adults aged 66–95. Although a few previous studies compared the discriminative ability of comorbidities and frailty in mortality prediction, these studies focused on shorter time frames ranging from 1–5 years and none focused on incorporating both comorbidities and frailty in life expectancy estimates.29, 37–39 These prior works found that comorbidities and frailty were independent predictors of mortality in the shorter time frames. Our results extend this body of research by showing that for a longer time frame of over 10 years – an important threshold in preventive care decisions for older adults – both comorbidities and frailty remain independent and significant predictors of mortality.
Prior work showed various degrees of overlap between comorbidities and frailty in older adults.28,29 Our results found that although both comorbidities and frailty increased in prevalence with increasing age, there was significant heterogeneity in frailty status among participants with the same age and comorbidity status, again highlighting that the two constructs - comorbidities and frailty – although related, capture different information about an individual’s health status and health trajectory. Existing literature has found that frailty is an important predictor of multiple adverse outcomes such as institutionalization, hospitalization, and mortality.22–26 We add to this literature to show that frailty, independent of comorbidities, contributed substantially to the estimation of life expectancy in older adults. The higher hazard for mortality associated with frailty found in our study is comparable to what has been previously reported in the literature.40
Our results have several important implications. As clinical practice guidelines increasingly recognize and recommend the consideration of 10-year life expectancy to inform preventive care decisions in older adults,1–12 the results from this project highlight the importance of considering older adults’ frailty status in addition to comorbidities in prognostication. For example, all adults in our study who had high comorbidities and high frailty had less than 10 years of estimated life expectancy across a wide age range of 66–90 and was true for both males and females. This could be a rule-of-thumb to consider in clinical practice to inform recommendations about preventive care, especially in the relatively younger patients. Although we organized the life expectancy predictions by comorbidity and frailty categories for ease of interpretation and have provided information for clinicians to assign patients into these categories, we recognize that busy clinicians may not have the time to apply the exact definitions for comorbidity and frailty categories as used in the study, which could be a barrier to use or lead to misclassification errors. One remedy could be to leverage electronic medical records to automatically extract diagnoses, generate estimates of patients’ comorbidity and frailty scores and corresponding life expectancies, and link these directly with preventive care reminders or recommendations within the electronic medical record. By incorporating both frailty and comorbidities, our results allow for more individualized estimates of life expectancy to inform preventive care decisions; however, how to best communicate these results directly to patients is beyond the scope of this project and warrants further study. This is an important area as previous studies demonstrated that directly referring to one’s limited life expectancy or being frail does not resonate readily with older adults and may have associated negative connotations.41–44
Secondly, simulation modeling is a commonly used method to inform population-level recommendations about preventive care such as cancer screening, 45,46 including specifically about screening cessation in older adults.45 Frailty is not currently included in published microsimulation models.45,46 Our results can be used to update the modeling parameters and assumptions in these models to develop more personalized estimates regarding the effectiveness and cost-effectiveness of different types of cancer screenings in older adults.
Thirdly, in the context of population health management and research, our results may help provide more tailored risk adjustment when examining the effect of interventions and/or help identify individuals for more targeted interventions. For example, several decision support interventions for cancer screening incorporate patients’ estimated life expectancies;47,48 adding frailty to refine those estimates could make the decision support even more individualized. Further, although advance care planning is increasingly recommended for all older adults, the uptake in clinical practice is still suboptimal and multiple interventions aim to improve its implementation.49 Being able to identify older adult with poorer prognosis can help prioritize and target such interventions, especially when interventions may be time- or resources-intensive.
Our study’s strengths include the very large sample size inclusive of individuals across the U.S. and the long follow up of up to 17 years. The study also has several limitations. First, the study cohort was limited to Medicare beneficiaries residing in SEER regions and may not represent older adults in other regions. However, our sensitivity analyses showed that the survival at various ages in our study cohort closely matched that of the U.S. older adult population, which supports the generalizability of our survival estimates. Second, compared to the U.S. life tables that report life expectancy as the mean number of years of life remaining,36 we reported median, rather than mean, life expectancies because the latter was not estimable due to curtailed follow-up. It could be argued that median life expectancy is a better estimate due to the left skewed distribution of life times. The median life expectancy at birth is about 3.5 years more than the mean life expectancy. However, the remaining life times after 65 years of age is much less skewed, and there is not much difference between mean and median life expectancies. We estimated the median and mean life expectancies from the US life tables in various years (2001 – 2017) and have found that they differ by less than 1 year in adults older than 65-years (data not shown).36 Third, although we used established methods to assess comorbidity and frailty,1,31 these methods are subject to measurement errors inherent to claims data. Specifically for the frailty score, we chose a cutoff threshold that was most able to discriminate the effect of frailty on mortality but may not be the cutoff with the highest predictive value when compared to the gold standard of the physical frailty phenotype; this could lead to mis-classification errors if other methods to assess the physical frailty phenotype or other definitions of frailty were used. Similarly, our results may not be generalizable if other definitions of comorbidities were used. Further, comorbidity and frailty are related to disability and functional impairment but are distinct entities.27,28 Therefore, although the frailty score used in our study includes inputs such as impaired mobility, falls, and cognitive impairment that are related to functional status and the frailty score has been shown to be associated with dependence in activities of daily living (ADL),50 it may not fully capture individuals’ functional status which have been shown to be important to predicting life expectancy but is not available in claims data. Lastly, we chose to stratify both comorbidities and frailty into discrete categories as opposed to using either or both as a continuous measure, a decision which may negatively affect the precision of the predictions. Specifically, for individuals who have higher comorbidity or frailty scores within a category, their life expectancies are potentially over-estimated whereas for those who have lower scores within the same category, their life expectancies are potentially under-estimated. However, we believe that the stratified approach significantly improves the ease of interpretation and use for busy clinicians.
In summary, frailty adds unique and important information than considering comorbidities alone in the context of long-term prognostication of older adults. This study incorporated frailty in addition to comorbidities in estimating long-term life expectancies of older adults to enhance individualized estimates.
Supplementary Material
- Supplementary Figure S1: Study flow diagram
- Supplementary Figure S2: Kaplan-Meier survival curves comparing study cohort to U.S
- Supplementary Table S1: Prevalence of conditions used to define comorbidity categories
- Supplementary Table S2: Prevalence of conditions used to define frailty categories
- Supplementary Table S3: Multivariable model output
Key Points.
Using SEER-Medicare, we estimated 5-/10-year survival probabilities and median life expectancies by age, sex, comorbidities and frailty.
Adding frailty changed life expectancy estimates by up to 7.2 years in subgroups.
Why does this matter?
Incorporating both comorbidities and frailty is important in prognostication.
ACKNOWLEDGEMENTS
Funding/support: This project was made possible by the K76AG059984 grant from the National Institute on Aging and a Cancer Control Career Development Award from the American Cancer Society (CCCDA-16–002-01). In addition, Dr. Boyd was supported by 1K24AG056578 from the National Institute on Aging and Dr. Varadhan was supported by P30CA006973 from National Cancer Institute. The funding sources had no role in the design, methods, subject recruitment, data collections, analysis, and preparation of paper.
Footnotes
Conflict of interest: No author had any conflict of interest.
Prior presentations: Plenary oral presentation at the annual meeting of the American Geriatrics Society 2021; poster presentation at the annual meeting of the Society of General Internal Medicine 2021.
REFERENCES
- 1.Cho H, Klabunde CN, Yabroff KR, Wang Z, Meekins A, Lansdorp-Vogelaar I, et al. Comorbidity-adjusted life expectancy: A new tool to inform recommendations for optimal screening strategies. Ann Intern Med. 2013; 159:667–676. [DOI] [PubMed] [Google Scholar]
- 2.Taksler GB, Keshner M, Fagerlin A, Hajizadeh N, Braithwaite RS. Personalized estimates of benefit from preventive care guidelines: A proof of concept. Ann Intern Med. 2013;159(3):161–168. [DOI] [PubMed] [Google Scholar]
- 3.Walter LC, Covinsky KE. Cancer screening in elderly patients: A framework for individualized decision making. JAMA. 2001;285(21):2750–2756. [DOI] [PubMed] [Google Scholar]
- 4.Lee SJ, Leipzig RM, Walter LC. Incorporating lag time to benefit into prevention decisions for older adults. JAMA. 2013; 310:2609–2610. [DOI] [PMC free article] [PubMed] [Google Scholar]
- 5.Qaseem A, Barry MJ, Denberg TD, Owens DK, Shekelle P, Clinical Guidelines Committee of the American College of Physicians. Screening for prostate cancer: a guidance statement from the clinical guidelines committee of the American College Of Physicians. Ann Intern Med. 2013;158(10):761–769 [DOI] [PubMed] [Google Scholar]
- 6.Qaseem A, Denberg TD, Hopkins RH Jr, Humphrey LL, Levine J, Sweet DE, et al. Screening for colorectal cancer: a guidance statement from the American College of Physicians. Ann Intern Med. 2012;156(5):378–86. [DOI] [PubMed] [Google Scholar]
- 7.Rex DK, Boland CR, Dominitz JA, Giardiello FM, Johnson DA, Kaltenbach T, et al. Colorectal cancer screening: recommendations for physicians and patients from the U.S. multi-society task force on colorectal cancer. Am J Gastroenterol. 2017;112(7): 1016–1030. [DOI] [PubMed] [Google Scholar]
- 8.Wilt TJ, Harris RP, Qaseem A, High Value Care Task Force of the American College of Physicians. Screening for Cancer: Advice for High-Value Care From the American College of Physicians. Ann Intern Med. 2015;162(10):718–25. [DOI] [PubMed] [Google Scholar]
- 9.Oeffinger KC, Fontham ET, Etzioni R, Herzig A, Michaelson JS, Shih YC, et al. Breast cancer screening for women at average risk: 2015 guideline update from the American Cancer Society. JAMA. 2015;314(15):1599–614. [DOI] [PMC free article] [PubMed] [Google Scholar]
- 10.Bibbins-Domingo K, US Preventive Services Task Force. Aspirin use for the primary prevention of cardiovascular disease and colorectal cancer: U.S. Preventive Services Task Force Recommendation Statement. Ann Intern Med. 2016;164(12):836–45. [DOI] [PubMed] [Google Scholar]
- 11.American Diabetes Association. Standards of medical care in diabetes-2017 abridged for primary care providers. Clin Diabetes. 2017;35(1): 5–26. [DOI] [PMC free article] [PubMed] [Google Scholar]
- 12.American Geriatrics Society Expert Panel on the Care of Older Adults with Diabetes Mellitus. Guidelines abstracted from the american geriatrics society guidelines for improving the care of older adults with diabetes mellitus: 2013 update. J Am Geriatr Soc. 2013;61(11):2020–2026. [DOI] [PMC free article] [PubMed] [Google Scholar]
- 13.Reuben DB. Medical care for the final years of life: “when you’re 83, it’s not going to be 20 years”. JAMA. 2009;302(24):2686–2694. [DOI] [PMC free article] [PubMed] [Google Scholar]
- 14.Christakis NA, Lamont EB. Extent and determinants of error in doctors’ prognoses in terminally ill patients: prospective cohort study. BMJ. 2000;320(7233):469–472. [DOI] [PMC free article] [PubMed] [Google Scholar]
- 15.Schoenborn NL, Bowman TL, Cayea D, Pollack CE, Feeser S, Boyd C. Primary care clinicians’ views on incorporating long-term prognosis in the care of older adults. JAMA Intern Med. 2016. May 1;176(5):671–8. [DOI] [PMC free article] [PubMed] [Google Scholar]
- 16.Yourman LC, Lee SJ, Schonberg MA, Widera EW, Smith AK. Prognostic indices for older adults: A systematic review. JAMA. 2012;307(2):182–192. [DOI] [PMC free article] [PubMed] [Google Scholar]
- 17.Cruz M, Covinsky K, Widera EW, Stijacic-Cenzer I, Lee SJ. Predicting 10-year mortality for older adults. JAMA. 2013;309(9):874–876. [DOI] [PMC free article] [PubMed] [Google Scholar]
- 18.Schonberg MA, Li V, Marcantonio ER, Davis RB, McCarthy EP. Predicting mortality up to 14 years among community-dwelling adults aged 65 and older. J Am Geriatr Soc. 2017;65(6):1310–1315. [DOI] [PMC free article] [PubMed] [Google Scholar]
- 19.Tan A, Kuo YF, Goodwin JS. Predicting life expectancy for community-dwelling older adults from Medicare claims data. Am J Epidemiol. September 15 2013;178(6):974–983. [DOI] [PMC free article] [PubMed] [Google Scholar]
- 20.DuGoff EH, Canudas-Romo V, Buttorff C, Leff B, Anderson GF. Multiple chronic conditions and life expectancy: a life table analysis. Med Care. 2014;52(8):688–94. [DOI] [PubMed] [Google Scholar]
- 21.Suemoto CK, Ueda P, Beltran-Sanchez H, et al. Development and validation of a 10-year mortality prediction model: meta-analysis of individual participant data from five cohorts of older adults in developed and developing countries. J Gerontol A Biol Sci Med Sci. 2017;72(3):410–416. [DOI] [PMC free article] [PubMed] [Google Scholar]
- 22.Fried LP, Tangen CM, Walston J, et al. Frailty in older adults: evidence for a phenotype. J Gerontol A Biol Sci Med Sci. 2001;56(3):M146–56. [DOI] [PubMed] [Google Scholar]
- 23.Bandeen-Roche K, Xue QL, Ferrucci L, et al. Phenotype of frailty: Characterization in the women’s health and aging studies. J Gerontol A Biol Sci Med Sci. 2006;61(3):262–266. [DOI] [PubMed] [Google Scholar]
- 24.Morley JE, Vellas B, van Kan GA, et al. Frailty consensus: A call to action. J Am Med Dir Assoc. 2013;14(6):392–397. [DOI] [PMC free article] [PubMed] [Google Scholar]
- 25.Shamliyan T, Talley KMC, Ramakrishnan R, Kane RL. Association of frailty with survival: a systematic literature review. Ageing Res Rev. 2013;12(2):719–36. [DOI] [PubMed] [Google Scholar]
- 26.Hewitt J, Carter B, Vilches-Moraga A, et al. The effect of frailty on survival in patients with COVID-19 (COPE): a multicenter, European, observational cohort study. Lancet Public Health. 2020;5(8):e444–e451. [DOI] [PMC free article] [PubMed] [Google Scholar]
- 27.Fried LP, Cohen AA, Xue QL, et al. The physical frailty syndrome as a transition from homeostatic symphony to cacophony. Nat Aging. 2021;1:36–46. [DOI] [PMC free article] [PubMed] [Google Scholar]
- 28.Fried LP, Ferrucci L, Darer J, Williamson JD, Anderson G. Untangling the concepts of disability, frailty, and comorbidity: implications for improved targeting and care. J Gerontol A Biol Sci Med. 2004;59(3):255–63. [DOI] [PubMed] [Google Scholar]
- 29.Theou O, Rockwood MRH, Mitnitski A, Rockwood K. Disability and co-morbidity in relation to frailty: how much do they overlap? Arch Gerontol Geriatr. 2012;55(2):e1–8. [DOI] [PubMed] [Google Scholar]
- 30.SEER-Medicare: About the data files. https://healthcaredelivery.cancer.gov/seermedicare/aboutdata/. Accessed December 2020.
- 31.Segal JB, Chang H-Y, Du Y, et al. Development of a claims-based frailty indicator anchored to a well-established frailty phenotype. Med Care. 2017;55(7):716–722. [DOI] [PMC free article] [PubMed] [Google Scholar]
- 32.National Cancer Institute. NCI Comorbidity Index Overview. https://healthcaredelivery.cancer.gov/seermedicare/considerations/comorbidity.html, accessed March 2021.
- 33.Klabunde CN, Potoskyy AL, Legler JM, Warren JL. Development of a comorbidity index using physician claims data. J Clin Epidemiol. 2000;53(12):1258–67. [DOI] [PubMed] [Google Scholar]
- 34.Fisher LD, Lin DY. Time-dependent covariates in the Cox proportional –hazards regression model. Annu Rev Public Health. 1999;20:145–57. [DOI] [PubMed] [Google Scholar]
- 35.Obermeyer Z, Powers B, Vogeli C, Mullainathan S. Dissecting racial bias in an algorithm used to manage the health of populations. Science. 2019;366(6464):447–453. [DOI] [PubMed] [Google Scholar]
- 36.Centers for Disease Control and Prevention. Life Tables. https://www.cdc.gov/nchs/products/life_tables.htm, accessed March 2021.
- 37.Ritt M, Ritt JI, Sieber CC, GaBmann KG. Comparing the predictive accuracy of frailty, comorbidity, and disability for mortality: a 1-year follow-up in patients hospitalized in geriatric wards. Clin Interv Aging. 2017;12:293–304. [DOI] [PMC free article] [PubMed] [Google Scholar]
- 38.Kusumastuti S, Gerds TA, Lund R, Mortensen EL, Westendorp RGJ. Discrimination ability of comorbidity, frailty, and subjective health to predict mortality in community-dwelling older people: population based prospective cohort study. Eur J Intern Med. 2017;42:29–38. [DOI] [PubMed] [Google Scholar]
- 39.Kim DH, Schneeweiss S, Glynn RJ, et al. Measuring frailty in Medicare data: development and validation of a claims-based frailty index. J Gerontol A Biol Sci Med Sci. 2018;73(7):980–987. [DOI] [PMC free article] [PubMed] [Google Scholar]
- 40.Shamliyan T, Talley KMC, Ramakrishnan R, Kane RL. Association of frailty with survival: a systematic literature review. Ageing Res Rev. 2013;12(2):719–36. [DOI] [PubMed] [Google Scholar]
- 41.Schoenborn NL, Lee K, Pollack CE, et al. Older adults’ views and communication preferences around cancer screening cessation JAMA Intern Med. 2017;177(8): 1121–1128. [DOI] [PMC free article] [PubMed] [Google Scholar]
- 42.Schoenborn NL, Janssen EM, Boyd CM, et al. Older adults’ preferences for discussing long-term life expectancy - results from a national survey. Ann Fam Med. 2018;16(6):530–537. [DOI] [PMC free article] [PubMed] [Google Scholar]
- 43.Schoenborn NL, Van Pilsum Rasmussen SE, Xue QL, et al. Older adults’ perceptions and informational needs regarding frailty. BMC Geriatr. 2018;18(1):46. [DOI] [PMC free article] [PubMed] [Google Scholar]
- 44.Nicholson C, Gordon AL, Tinker A. Changing the way “we” view and talk about frailty… Age Ageing. 2017;46(3):349–351. [DOI] [PubMed] [Google Scholar]
- 45.Lansdorp-Vogelaar I, Gulati R, Mariotto AB, et al. Personalizing age of cancer screening cessation based on comorbidity: model estimates of harms and benefits. Ann Intern Med. 2014;161(2):104–112. [DOI] [PMC free article] [PubMed] [Google Scholar]
- 46.Knudsen AB, Zauber AG, Rutter Cm, et al. Estimation of benefits, burden, and harms of colorectal cancer screening strategies: modeling study for the US Preventive Services Task Force. JAMA. 2016;315(23):2595–609. [DOI] [PMC free article] [PubMed] [Google Scholar]
- 47.Schonberg MA, Kistler CE, Pinheiro A, et al. Effect of a mammography screening decision aid for women 75 years and older: a cluster randomized clinical trial. JAMA Intern Med. 2020;180(6):831–842. [DOI] [PMC free article] [PubMed] [Google Scholar]
- 48.Lewis CL, Kistler CE, Dalton AF, et al. A decision aid to promote appropriate colorectal cancer screening among older adults: a randomized controlled trial. Med Decis Making. 2018;38(5):614–624. [DOI] [PubMed] [Google Scholar]
- 49.Houben CHM, Spruit MA, Groenen MTJ, Wouters EFM, Janssen DJA. Efficacy of advance care planning: a systematic review and meta-analysis. J Am Med Dir Assoc. 2014;15(7):477–489. [DOI] [PubMed] [Google Scholar]
- 50.Kim DH, Patorno E, Pawar A, et al. Comparative performance of four claims-based frailty measures in the U.S. Medicare data. J Gerontol A Biol Sci Med Sci. 2020;75(6):1120–1125. [DOI] [PMC free article] [PubMed] [Google Scholar]
Associated Data
This section collects any data citations, data availability statements, or supplementary materials included in this article.
Supplementary Materials
- Supplementary Figure S1: Study flow diagram
- Supplementary Figure S2: Kaplan-Meier survival curves comparing study cohort to U.S
- Supplementary Table S1: Prevalence of conditions used to define comorbidity categories
- Supplementary Table S2: Prevalence of conditions used to define frailty categories
- Supplementary Table S3: Multivariable model output