

Abstract
Background:
Maintenance of function during cancer treatment is important to older adults. Characteristics associated with pretreatment life-space mobility and changes during non-small cell lung cancer (NSCLC) treatment remain unknown.
Methods:
This mixed methods cohort study recruited adults age ≥65 with advanced NSCLC starting palliative chemotherapy, immunotherapy, and/or targeted therapy from a Comprehensive Cancer Center, Veterans Affairs, and safety-net clinic. Patients completed geriatric assessments including Life-Space Assessment (LSA) pretreatment and at one, two, four, and six months after treatment initiation. LSA scores range from 0-120 (greater mobility); LSA <60 is considered restricted. We used mixed-effects models to examine pretreatment LSA, change from 0-1 month, and change from 1-6 months. A subgroup participated in semi-structured interviews pretreatment and at two and six months to understand the patient experience of life-space change. For each interview participant, we created joint displays of longitudinal LSA scores juxtaposed with illustrative quotes.
Results:
Among 93 patients, median age was 73 (range 65-94). Mean pretreatment LSA score was 67.1. On average, LSA declined 10.1 points from pretreatment to one month and remained stable at six months. Pretreatment LSA score was associated with several demographic, clinical, geriatric assessment, and symptom characteristics. LSA decline at one month was greater among patients with high anxiety (slope −12.6 versus −2.3, P=0.048). Pretreatment body mass index <21 kg/m2 was associated with LSA improvement from 1-6 months (slope 4.1 vs −0.04, P=0.003). Joint displays illustrated the impact of different life-space trajectories on patients’ lives in their words.
Conclusion:
Older adults with NSCLC have low pretreatment life space with many developing restricted life space during treatment. Incorporating life-space assessments into clinical cancer care may help older adults concretely visualize how treatment might impact their daily function to allow for informed decision making and identify early changes in mobility to implement supportive interventions.
Keywords: geriatric oncology, lung cancer, life-space mobility, cancer treatment, mixed methods
INTRODUCTION
Non-small cell lung cancer (NSCLC), the leading cause of cancer mortality worldwide, largely affects older adults.1, 2 NSCLC and its treatments are associated with a high symptom burden3, 4 and functional impairment.5 Maintenance of function during treatment is critically important to older adults with cancer.6 Yet, studies of functional changes during NSCLC treatment among older adults remain limited.7
Life-space mobility (LSM) is the ability to move within one’s environment from the home to the greater community.8, 9 Because mobility through the community incorporates physical, psychosocial, and environmental factors, LSM moves beyond traditional measures of function such as activities of daily living (ADL), which focus on performance of individual activities in isolation. In the general older population, lower LSM is associated with higher mortality, worse quality of life (QOL), and greater healthcare utilization.9–11 Despite the growing literature linking LSM to important outcomes, there is a dearth of information among older adults with cancer.12–14
To address this gap, we aimed to characterize the trajectory of LSM during systemic NSCLC treatment among older adults, identify characteristics associated with pretreatment LSM and changes over time, and illustrate how changes in LSM during treatment impact older adults’ daily lives in their own words.
METHODS
Study design and participants
The “Treatment Toxicity Through the Patient’s Lens” study is a prospective, mixed methods cohort study. We recruited older adults with NSCLC from a Comprehensive Cancer Center, Veterans Affairs, and safety-net oncology clinics. Eligible patients were age ≥65, had stage III-IV15 or recurrent NSCLC, starting a new palliative systemic treatment (chemotherapy, immunotherapy, and/or targeted therapy), able to speak English and/or a Chinese dialect, and provide informed consent. Treating oncologists determined treatment eligibility as part of routine care. Treatment was continued until progression or intolerance. Patients undergoing surgery and/or thoracic radiation were excluded. Radiation to metastases was allowed. We followed patients for six months or until treatment discontinuation, whichever occurred earlier.
To minimize missing data, participants were asked to identify proxy respondents who were age ≥18, able to speak English and/or a Chinese dialect, and provide informed consent. Proxys completed non-symptom assessments if patients became unable to continue active participation.
A subgroup of English-speaking patients participated in a qualitative substudy to understand the lived experience of LSM during NSCLC treatment. Participants were purposively sampled to represent a diverse range of pretreatment function based on the oncologist’s overall impression of function. Participants underwent three in-depth, semi-structured interviews prior to treatment initiation and at two and six months. They were asked open-ended questions that explored their baseline LSM and changes during treatment (see Supplemental Materials for interview guides). Interviews were audio recorded and transcribed.
The study was approved by the University of California, San Francisco Institutional Review Board and the San Francisco Veterans Affairs. From 8/2017 through 2/2020, 120 eligible patients were approached and 93 consented (78% enrollment rate). The most common reason for declining participation was being overwhelmed with cancer care.
Measures
Dependent variable
LSM was measured using the Life-Space Assessment8 (LSA, Supplemental Material) prior to initiation of treatment, and at one, two, four, and six months after treatment initiation, or until treatment discontinuation, whichever occurred earlier. The LSA measures mobility during the past four weeks across five life-space levels. For each level, patients report whether they had been to that level, how frequently, and how independently. Composite scores range from 0-120 (greater mobility). As points of reference, a LSA score <60 is considered restricted LSM16, 17 and a change of ≥5 is clinically important based on its association with walking status.18
Due to COVID-19 shelter-in-place orders, data collected after 2/29/2020 were excluded since LSM no longer primarily reflected participants’ abilities.
Independent variables
Demographics included age, gender, patient-reported race, primary language, education, partner status, and living situation. Clinical characteristics were abstracted from the medical record (i.e., smoking history, histology, stage, metastases, prior NSCLC treatment).
Prior to initiation of the new systemic treatment, participants completed the Cancer and Aging Research Group geriatric assessment19 with validated measures to assess six domains (Supplemental Table S1): function,20–24 comorbidity,22 cognition,25 nutrition,26 mood,27 and social support.28 Symptom assessment included morning and evening fatigue and energy,29, 30 pain,31 and shortness of breath.31
Data analysis
Statistical analysis
We summarized patient characteristics with descriptive statistics. To determine our model design, we reviewed a spaghetti plot of LSA scores along with a plot of adjusted means from a model treating timepoint as an arbitrary categorical predictor (Supplemental Figure S1). To model pretreatment LSA scores, change from pretreatment to one month, and change from one to six months, we used linear mixed-effects models with fixed effects for time (modeled as a linear spline with a knot at one month), the characteristic of interest (e.g., age), and the interaction of the time spline and the characteristic. Models included a random intercept for each participant to account for intrasubject correlation of repeated measurements. Patients who died within six months were assigned an LSA score of zero for the next assessment. Unadjusted mixed-effects models of LSA scores were conducted for each characteristic. Models examining primary language and smoking status were adjusted for race based on a priori associations.32 We included only pretreatment predictors in these models to mimic information available to oncologists risk stratifying older adults during decision making.
To identify geriatric assessment and symptom characteristics independently associated with our outcomes, each geriatric assessment and symptom characteristic was tested in a separate mixed-effects model adjusted for demographic and clinical characteristics associated with LSA score. To address missing covariates, we used multiple imputation to estimate education for 12 patients.
Given the complex relationship between body mass index (BMI) and cancer outcomes,33 we conducted additional analyses to further explore the associations between pretreatment BMI and LSA. Pretreatment BMI was reexamined in tertiles to evaluate for a U-shaped association with LSA. To examine the associations of pretreatment BMI with pretreatment LSA score and different measures of physical function, we used t-tests and chi-square tests. We used a mixed-effects model to examine changes in weight during treatment according to pretreatment BMI.
All statistical analyses were performed using Stata/SE 15.1 (StataCorp, Texas). Two-sided tests with P<0.05 were considered statistically significant.
Mixed methods analysis
Interview transcripts were analyzed using the constant comparative method and thematic analysis.34 Codes and themes were iteratively discussed by a multidisciplinary team (oncology, geriatrics, palliative medicine, nursing, psychology) to refine coding, resolve disagreements through consensus, and identify overarching themes. Saturation was reached when no new themes emerged. To integrate the quantitative and qualitative data, we used a convergent mixed methods design with joint displays.35 LSA scores were plotted for each interview participant juxtaposed with representative quotes describing LSM for each interview timepoint. Joint displays for all interview participants were compared and four were selected to represent different trajectories during treatment (i.e., stable, decline, decline then recovery). To qualitatively describe quantitative findings, we identified patient quotes illustrating characteristics associated with LSA score.
RESULTS
Demographic and clinical characteristics
We enrolled 93 patients with NSCLC with a median age of 73 (IQR 68-80, range 65-94). A quarter were age ≥80 (Table 1). The cohort was 63.4% White, 25.8% Asian, 5.6% Black, and 5.6% other races. The majority completed college or graduate education. Many had received prior NSCLC treatment (71.0%). During the study, 35.5% received immunotherapy, 31.2% targeted therapy, 22.6% chemoimmunotherapy, and 10.7% chemotherapy. Six patients died during follow up.
Table 1.
Patient characteristics (N=93).
| Characteristic | n (%) | |
|---|---|---|
| Demographic and clinical characteristics | ||
| Age, years | 65-69 | 29 (31.2) |
| 70-74 | 26 (28.0) | |
| 75-79 | 14 (15.1) | |
| 80+ | 24 (25.8) | |
| Female | 53 (57.0) | |
| Race | White | 59 (63.4) |
| Asian | 24 (25.8) | |
| Black | 5 (5.6) | |
| Other | 5 (5.6) | |
| Primary language | English | 79 (85.0) |
| Chinese | 14 (15.0) | |
| Education | ≤High school | 19 (23.5) |
| College | 37 (45.7) | |
| Graduate level | 25 (30.9) | |
| Partnered | 53 (60.2) | |
| Lives alone | 18 (19.4) | |
| Smoking status | Former smoker | 59 (63.4) |
| Never smoker | 29 (31.2) | |
| Current smoker | 5 (5.4) | |
| Histology | Adenocarcinoma | 77 (82.8) |
| Squamous cell | 12 (12.9) | |
| Other | 4 (4.3) | |
| Stage | IIIA-C | 6 (6.5) |
| IVA | 36 (38.7) | |
| IVB | 51 (54.8) | |
| Brain metastasis | 24 (25.8) | |
| Prior lung cancer treatment | Any prior lung cancer treatment | 66 (71.0) |
| Prior radiation | 40 (43.0) | |
| Prior chemotherapy | 35 (37.6) | |
| Prior targeted therapy | 26 (28.0) | |
| Prior immunotherapy | 17 (18.3) | |
| Prior surgery | 16 (17.2) | |
| Current treatment | Immunotherapy | 33 (35.5) |
| Targeted therapy | 29 (31.2) | |
| Chemotherapy and immunotherapy | 21 (22.6) | |
| Chemotherapy | 10 (10.8) | |
| Pretreatment geriatric assessment and symptom characteristics | ||
| Provider-rated Karnofsky Performance Status <70 | 13 (14.0) | |
| Dependent in ≥1 ADL | 18 (19.4) | |
| Dependent in ≥1 IADL | 55 (66.3) | |
| TUG ≥13.5 sec | 29 (33.3) | |
| SPPB ≤9 | 43 (46.2) | |
| Fall(s) in last 6 months | 12 (14.8) | |
| ≥3 comorbidities | 36 (38.7) | |
| Low hemoglobin (<10 g/dL for women, <11 g/dL for men) | 11 (12.0) | |
| Creatinine clearance <60 ml/min | 33 (36.3) | |
| MoCA score <26 | 63 (67.7) | |
| Involuntary weight loss in last 6 months | 47 (58.0) | |
| BMI <21 kg/m2 | 20 (21.5) | |
| MHI-13 depression score ≥12 | 29 (39.2) | |
| MHI-13 anxiety score ≥6 | 53 (71.6) | |
| Poor tangible social support | 32 (41.0) | |
| High morning fatigue | 30 (38.5) | |
| High evening fatigue | 23 (29.9) | |
| Low morning energy | 61 (78.2) | |
| Low evening energy | 35 (45.5) | |
| Pain (quite a bit or very much) | 20 (26.7) | |
| Shortness of breath (quite a bit or very much) | 19 (25.0) | |
Abbreviations: ADL, activities of daily living; BMI, body mass index; g/dL, gram per deciliter; IADL, instrumental activities of daily living; kg/m2, kilogram per meter square; MHI, Mental Health Inventory; ml/min, milliliters per minute; MoCA, Montreal Cognitive Assessment; TUG, Timed Up and Go; SPPB, Short Physical Performance Battery.
Missing data: education n=12, partner status n=5, IADL n=10, TUG n=6, falls n=12, hemoglobin n=1, creatinine clearance n=2, weight loss n=12, depression n=19, anxiety n=19, social support n=15, morning fatigue/energy n=15, evening fatigue/energy n=16, pain n=18, shortness of breath n=17
Pretreatment geriatric and symptom assessment results
Prior to initiation of treatment, 14.0% had a Karnofsky Performance Status (KPS) <70% (Table 1). Dependence in instrumental ADL (IADL) was common (66.3%). Two-thirds had a low Montreal Cognitive Assessment (MoCA) score and 21.5% had a pretreatment BMI <21 kg/m2. Using the Mental Health Inventory-13, 39.2% had a high depression score and 71.6% had a high anxiety score. For symptoms, 38.5% reported high morning fatigue and a quarter reported pain or shortness of breath.
Pretreatment LSA results
Mean pretreatment LSA score was 67.1 (95% CI 60.9, 73.2; range 4-120; 37.6% restricted LSM; Figure 1A). Pretreatment LSA was not associated with age or gender (Supplemental Table S2). Lower pretreatment LSA was associated with Asian (P<0.001) and other non-White races (P=0.02), Chinese language (P<0.001), high school education or less (P=0.001), and non-adenocarcinoma histology (P=0.02; Table 2). Never smokers had a lower pretreatment LSA compared with former smokers (P=0.02; Table 2). The associations of language and smoking status with pretreatment LSA were no longer statistically significant after adjustment for race. Patients without prior lung cancer surgery had lower pretreatment LSA than those who had undergone surgery (P=0.045). There was no difference in pretreatment LSA by current treatment group (Supplemental Table S2).
Figure 1. Unadjusted Life-Space Assessment (LSA) plots.
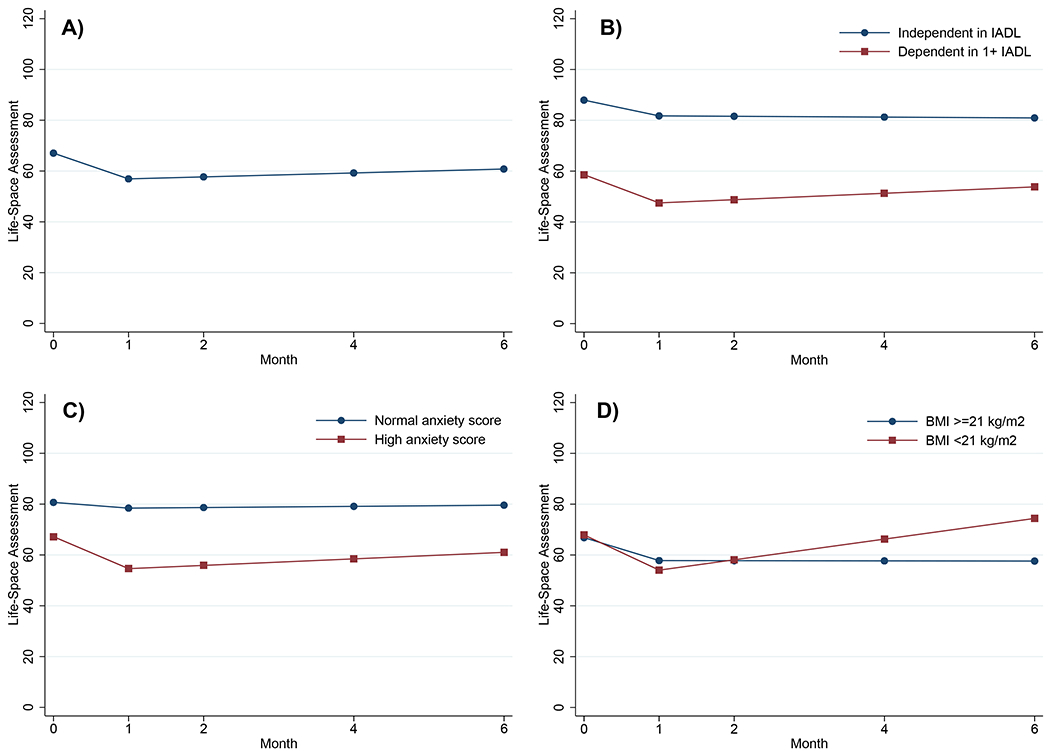
A) Overall LSA results from pretreatment to six months after systemic NSCLC treatment initiation (N=93).
B) Pretreatment dependence in ≥1 instrumental activities of daily living (IADL) is associated with lower pretreatment LSA scores. Although IADL is not associated with change in LSA score during NSCLC treatment, patients with a low pretreatment LSA score may spend their entire time during treatment with restricted life space (LSA score <60).
C) High pretreatment Mental Health Inventory-13 anxiety score is associated with steeper decline in LSA score from pretreatment to one month.
D) Pretreatment body mass index (BMI) <21 kg/m2 is associated with improvement in LSA score from one to six months after systemic NSCLC treatment initiation.
Table 2.
Unadjusted results: Characteristics associated with pretreatment LSA score and monthly changes from 0-1 mo and 1-6 mo after initiation of NSCLC treatment (N=93).
| Characteristic | Mean pretreatment LSA score (95% CI) | P a | Pretreatment to 1 mo change in LSA score (95% CI) | P a | 1-6 months change/month in LSA score (95% CI) | P a |
|---|---|---|---|---|---|---|
| Demographic and clinical characteristics | ||||||
| Race | ||||||
| White | 77.8 (70.9, 84.6) | Ref | −11.6 (−16.8, −6.4) | Ref | 1.3 (−0.17, 2.7) | Ref |
| Asian | 45.5 (34.7, 56.3) | <0.001 | −8.1 (−16.3, 0.1) | 0.48 | 0.9 (−1.2, 3.0) | 0.78 |
| Other | 55.9 (39.2, 72.7) | 0.02 | −6.3 (−19.1, 6.5) | 0.44 | −1.5 (−4.7, 1.7) | 0.13 |
| Primary language | ||||||
| English | 72.1 (65.9, 78.4) | Ref | −10.8 (−15.3, −6.2) | Ref | 0.7 (−0.5, 1.9) | Ref |
| Chinese | 38.4 (23.6, 53.2) | <0.001 | −6.2 (−16.8, 4.5) | 0.44 | 1.4 (−1.5, 4.3) | 0.66 |
| Education | ||||||
| ≤High school | 48.9 (37.1, 60.8) | Ref | −15.0 (−24.2, −5.8) | Ref | 2.0 (−0.6, 4.7) | Ref |
| College | 72.8 (64.3, 81.3) | 0.001 | −4.6 (−10.8, 1.6) | 0.07 | 0.9 (−0.6, 2.4) | 0.47 |
| Graduate | 75.9 (65.5, 86.2) | 0.001 | −11.8 (−19.6, −4.0) | 0.60 | −1.0 (−3.3, 1.3) | 0.09 |
| Smoking status | ||||||
| Former | 72.6 (65.1, 80.0) | Ref | −10.9 (−16.0, −5.7) | Ref | 1.4 (−0.1, 2.5) | Ref |
| Never | 57.2 (46.5, 67.8) | 0.02 | −7.4 (−14.9, −0.03) | 0.46 | −0.8 (−2.8, 1.2) | 0.07 |
| Current | 59.6 (33.9, 85.3) | 0.34 | −21.1 (−41.8, −0.3) | 0.35 | 9.6 (−18.1, 37.4) | 0.56 |
| Adenocarcinoma histology | ||||||
| No | 50.9 (36.5, 65.4) | Ref | −10.3 (−20.3, −0.4) | Ref | 2.5 (−0.2, 5.2) | Ref |
| Yes | 70.4 (63.8, 77.0) | 0.02 | −10.0 (−14.6, −5.5) | 0.96 | 0.4 (−0.8, 1.7) | 0.18 |
| Prior surgery | ||||||
| No | 64.2 (57.6, 70.9) | Ref | −9.8 (−14.4, −5.2) | Ref | 0.8 (−0.5, 2.0) | Ref |
| Yes | 80.6 (66.1, 95.2) | 0.045 | −11.8 (−21.7, −2.0) | 0.71 | 0.9 (−1.7, 3.4) | 0.93 |
| Pretreatment geriatrics assessment and symptom characteristics | ||||||
| Provider-rated Karnofsky Performance Status <70 | ||||||
| No | 71.0 (64.7, 77.3) | Ref | −10.2 (−14.7, −5.7) | Ref | 0.9 (−0.3, 2.1) | Ref |
| Yes | 42.8 (27.2, 58.4) | 0.001 | −9.8 (−21.0, 1.4) | 0.95 | 0.1 (−3.0, 3.3) | 0.67 |
| Dependent in ≥1 activities of daily living | ||||||
| No | 72.0 (65.5, 78.4) | Ref | −9.4 (−14.1, −4.8) | Ref | 0.5 (−0.7, 1.7) | Ref |
| Yes | 46.7 (33.5, 59.8) | 0.001 | −13.4 (−23.0, −3.7) | 0.47 | 2.1 (−1.0, 5.2) | 0.35 |
| Dependent in ≥1 instrumental activities of daily living | ||||||
| No | 87.9 (78.7, 97.2) | Ref | −6.2 (−13.7, 1.3) | Ref | −0.2 (−2.0, 1.7) | Ref |
| Yes | 58.6 (52.0, 65.2) | <0.001 | −11.1 (−16.4, −5.9) | 0.30 | 1.3 (−0.1, 2.7) | 0.24 |
| Timed Up and Go ≥13.5 seconds | ||||||
| No | 74.8 (67.9, 81.7) | Ref | −7.6 (−12.8, −2.5) | Ref | 1.2 (−0.2, 2.5) | Ref |
| Yes | 58.8 (49.1, 68.6) | 0.01 | −15.9 (−23.2, −8.5) | 0.07 | −0.2 (−2.1, 1.8) | 0.28 |
| Short Physical Performance Battery ≤9 | ||||||
| No | 77.8 (70.1, 85.5) | Ref | −9.8 (−15.4, −4.2) | Ref | 0.9 (−0.5, 2.3) | Ref |
| Yes | 54.6 (46.3, 62.9) | <0.001 | −10.7 (−16.9, −4.5) | 0.83 | 0.5 (−1.3, 2.3) | 0.73 |
| ≥3 comorbidities | ||||||
| No | 75.0 (67.8, 82.2) | Ref | −7.2 (−12.4, −1.9) | Ref | 0.3 (−1.1, 1.6) | Ref |
| Yes | 54.5 (45.4, 63.5) | 0.001 | −15.4 (−22.2, −8.6) | 0.06 | 1.7 (−0.2, 3.7) | 0.23 |
| Low hemoglobin (<10 g/dL for women, <11 g/dL for men) | ||||||
| No | 70.0 (63.8, 76.2) | Ref | −10.0 (−14.5, −5.6) | Ref | 0.7 (−0.4, 1.9) | Ref |
| Yes | 42.6 (25.8, 59.4) | 0.003 | −12.7 (−24.8, −0.6) | 0.69 | 0.9 (−3.5, 5.3) | 0.96 |
| Body mass index <21 kg/m2 | ||||||
| No | 66.8 (59.9, 73.7) | Ref | −9.0 (−13.7, −4.3) | Ref | −0.04 (−1.3, 1.2) | Ref |
| Yes | 67.9 (54.7, 81.1) | 0.89 | −13.9 (−22.5, −5.2) | 0.34 | 4.1 (1.6, 6.5) | 0.003 |
| Involuntary weight loss in last 6 months | ||||||
| No | 77.5 (68.0, 87.0) | Ref | −9.2 (−16.0, −2.4) | Ref | 0.4 (−1.2, 2.1) | Ref |
| Yes | 62.3 (54.2, 70.3) | 0.02 | −10.0 (−15.7, −4.2) | 0.87 | 1.1 (−0.5, 2.6) | 0.59 |
| MHI-13 depression score ≥12 | ||||||
| No | 77.2 (69.3, 85.1) | Ref | −6.5 (−12.4, −0.6) | Ref | 0.5 (−0.9, 1.9) | Ref |
| Yes | 61.4 (51.6, 71.3) | 0.01 | −14.8 (−22.1, −7.5) | 0.08 | 1.8 (−0.4, 3.9) | 0.33 |
| MHI-13 anxiety score ≥6 | ||||||
| No | 80.7 (69.0, 92.3) | Ref | −2.3 (−11.0, 6.4) | Ref | 0.2 (−2.0, 2.4) | Ref |
| Yes | 67.2 (59.9, 74.5) | 0.06 | −12.6 (−18.0, −7.2) | 0.048 | 1.3 (−0.1, 2.7) | 0.43 |
| High morning fatigue | ||||||
| No | 79.4 (72.2, 86.5) | Ref | −7.5 (−13.3, −2.0) | Ref | 0.1 (−1.2, 1.7) | Ref |
| Yes | 52.4 (43.4, 61.4) | <0.001 | −12.5 (−19.7, −5.3) | 0.30 | 1.8 (−0.1, 3.7) | 0.20 |
| Pain | ||||||
| No | 74.0 (66.7, 81.3) | Ref | −8.9 (−14.3, −3.5) | Ref | 0.7 (−0.6, 2.0) | Ref |
| Yes | 54.8 (42.6, 66.9) | 0.008 | −10.7 (−19.6, −1.8) | 0.74 | 0.7 (−2.0, 3.5) | 0.99 |
Abbreviations: CI, confidence interval; g/dL, gram per deciliter; kg/m2, kilogram per meter squared; MHI, Mental Health Inventory; Ref, reference.
P-values <0.05 are in bold.
In unadjusted analyses, 11 geriatric assessment and symptom characteristics were associated with lower pretreatment LSA including KPS <70, dependence in ≥1 ADL or IADL (Figure 1B), slow Timed Up and Go (TUG), low Short Physical Performance Battery (SPPB), having ≥3 comorbidities or low hemoglobin, involuntary weight loss, high depression score, high morning fatigue, and pain (all P<0.05; Table 2).
After adjusting for race, education, histology, and prior surgery; dependence in ≥1 ADL (P=0.03) or IADL (P<0.001), low SPPB (P=0.001), ≥3 comorbidities (P=0.049), high depression score (P=0.03), high morning fatigue (P=0.002), and pain (P=0.01) remained associated with lower pretreatment LSA (Table 3).
Table 3.
Adjusteda associations with pretreatment LSA score and monthly changes from 0-1 mo and 1-6 mo after initiation of NSCLC treatment (N=93).
| Characteristic | Mean pretreatment LSA score (95% CI) | P b | Pretreatment to 1 mo change in LSA score (95% CI) | P b | 1-6 mo change/mo in LSA score (95% CI) | P b |
|---|---|---|---|---|---|---|
| Provider-rated Karnofsky Performance Status <70 | ||||||
| No | 84.3 (75.5, 93.1) | Ref | −10.3 (−14.8, −5.8) | Ref | 0.9 (−0.3, 2.1) | Ref |
| Yes | 70.9 (53.6, 88.2) | 0.10 | −9.3 (−20.5, 2.0) | 0.86 | 0.3 (−2.8, 3.4) | 0.72 |
| Dependent in ≥1 activities of daily living | ||||||
| No | 85.0 (76.3, 93.6) | Ref | −9.6 (−14.2, −4.9) | Ref | 0.5 (−0.7, 1.7) | Ref |
| Yes | 70.0 (55.1, 84.8) | 0.03 | −13.2 (−22.8, −3.5) | 0.51 | 2.3 (−0.7, 5.4) | 0.28 |
| Dependent in ≥1 instrumental activities of daily living | ||||||
| No | 97.2 (87.6, 106.9) | Ref | −6.6 (−14.1, 1.0) | Ref | −0.2 (−2.1, 1.7) | Ref |
| Yes | 73.9 (65.3, 82.5) | <0.001 | −11.2 (−16.5, −5.9) | 0.32 | 1.4 (−0.04, 2.8) | 0.19 |
| Timed Up and Go ≥13.5 seconds | ||||||
| No | 84.9 (76.5, 93.4) | Ref | −7.7 (−12.9, −2.5) | Ref | 1.2 (−0.2, 2.5) | Ref |
| Yes | 75.9 (63.9, 87.8) | 0.11 | −16.2 (−23.5, −8.9) | 0.06 | −0.1 (−2.0, 1.9) | 0.31 |
| Short Physical Performance Battery ≤9 | ||||||
| No | 89.1 (80.0, 98.2) | Ref | −10.0 (−15.6, −4.4) | Ref | 1.0 (−0.5, 2.4) | Ref |
| Yes | 73.2 (62.8, 83.7) | 0.002 | −10.6 (−16.8, −4.3) | 0.89 | 0.5 (−1.2, 2.3) | 0.71 |
| ≥3 comorbidities | ||||||
| No | 87.2 (78.5, 95.9) | Ref | −7.5 (−12.7, −2.2) | Ref | 0.2 (−1.1, 1.6) | Ref |
| Yes | 73.1 (62.1, 84.1) | 0.01 | −15.1 (−21.9, −8.3) | 0.08 | 1.8 (−0.1, 3.8) | 0.19 |
| Low hemoglobin (<10 g/dL for women, <11 g/dL for men) | ||||||
| No | 84.5 (75.9, 93.1) | Ref | −9.4 (−14.7, −5.7) | Ref | 0.8 (−0.4, 1.9) | Ref |
| Yes | 68.5 (50.7, 86.2) | 0.05 | −10.4 (−24.6, −0.4) | 0.72 | 1.2 (−3.2, 5.6) | 0.84 |
| Involuntary weight loss in last 6 months | ||||||
| No | 88.9 (78.3, 99.5) | Ref | −9.6 (−16.3, −2.8) | Ref | 0.4 (−1.3, 2.0) | Ref |
| Yes | 81.2 (71.2, 91.1) | 0.19 | −10.0 (−15.8, −4.3) | 0.92 | 1.2 (−0.4, 2.8) | 0.47 |
| Body mass index <21 kg/m2 | ||||||
| No | 83.3 (73.4, 93.3) | Ref | −9.1 (−13.8, −4.4) | Ref | 0.02 (−1.2, 1.2) | Ref |
| Yes | 83.8 (71.5, 96.0) | 0.95 | −13.9 (−22.5, −5.2) | 0.34 | 3.7 (1.5, 6.5) | 0.004 |
| MHI-13 depression score ≥12 | ||||||
| No | 90.6 (82.3, 99.0) | Ref | −6.8 (−12.7, −1.0) | Ref | 0.5 (−1.0, 1.9) | Ref |
| Yes | 79.9 (69.6, 90.3) | 0.04 | −15.0 (−22.3, −7.6) | 0.09 | 1.7 (−0.4, 3.9) | 0.33 |
| MHI-13 anxiety score ≥6 | ||||||
| No | 88.3 (77.2, 99.4) | Ref | −2.2 (−11.0, 6.5) | Ref | 0.2 (−2.0, 2.4) | Ref |
| Yes | 86.7 (77.5, 95.9) | 0.79 | −13.0 (−18.4, −7.6) | 0.04 | 1.3 (−0.1, 2.7) | 0.45 |
| High morning fatigue | ||||||
| No | 89.9 (81.6, 98.1) | Ref | −8.0 (−13.7, −2.4) | Ref | 0.2 (−1.2, 1.7) | Ref |
| Yes | 72.2 (61.5, 82.9) | 0.001 | −12.6 (−19.8, −5.4) | 0.33 | 1.9 (−0.004, 3.7) | 0.18 |
| Pain | ||||||
| No | 89.2 (80.6, 97.9) | Ref | −9.3 (−14.7, −3.9) | Ref | 0.7 (−0.6, 2.0) | Ref |
| Yes | 74.4 (62.3, 86.5) | 0.02 | −10.5 (−19.4, −1.6) | 0.83 | 0.7 (−2.0, 3.4) | 1.00 |
Abbreviations: CI, confidence interval; g/dL, gram per deciliter; kg/m2, kilogram per meter squared; LSA, life-space assessment; MHI, Mental Health Inventory; ml/min, milliliters per minute; mo, month; NSCLC, non-small cell lung cancer.
Each geriatric assessment characteristic is tested in a separate linear mixed-effects model adjusted for race, education, histology, and prior surgery. Multiple imputation was used to estimate education for 12 patients. Results shown set covariates to the following values: white race, college education, adenocarcinoma histology, no prior surgery.
P-values <0.05 are in bold.
Pretreatment to one month: Change in LSA score results
Overall, the average LSA score declined 10.1 points at one month after treatment initiation (95% CI −14.3, −6.0; P<0.001; Figure 1A). Only anxiety score was associated with change in LSA score from pretreatment to one month (P=0.048; Table 2). In unadjusted analysis, patients with a high pretreatment anxiety score experienced a 12.6-point decline in LSA score from pretreatment to one month (95% CI −18.0, −7.2; Figure 1C). In contrast, patients with a normal anxiety score had stable LSA scores from pretreatment to one month (slope −2.3, 95% CI −11.0, 6.4). After adjusting for race, education, histology, and prior surgery, the association between high anxiety score and decline in LSA score from pretreatment to one month remained statistically significant (P=0.04; Table 3).
One to six months: Change in LSA score results
Overall, the average LSA score was stable from one to six months after treatment initiation (slope 0.8 points per month; 95% CI −0.3, 1.9; P=0.17; Figure 1A). Only BMI <21 kg/m2 was associated with change in LSA score from one to six months (P=0.003; Table 2). Patients with a BMI <21 kg/m2 experienced a 4.1-point increase in LSA score per month from one to six months (95% CI 1.6, 6.5; Figure 1D). In contrast, patients with a BMI ≥21 kg/m2 had stable LSA scores (slope −0.04 points per month, 95% CI −1.3, 1.2). After adjusting for race, education, histology, and prior surgery, the association between BMI <21 kg/m2 and improvement in LSA score from one to six months remained statistically significant (P=0.004; Table 3).
Additional analyses were performed to further explore the association between low BMI and improvement in LSA. When pretreatment BMI was recategorized as tertiles, the lowest tertile (BMI 16.5-22.5 kg/m2) remained associated with improvement in LSA from one to six months. During NSCLC treatment, weight remained relatively stable regardless of pretreatment BMI. There were no differences in pretreatment LSA, KPS, ADL, IADL, TUG, SPPB, or falls by pretreatment BMI group.
Mixed methods results
Twenty patients participated in the qualitative substudy (Supplemental Table S3). Joint displays representing different LSM trajectories during NSCLC treatment are shown in Figure 2 (stable, decline, decline then recovery). These examples were selected because these patients received the same combination of chemoimmunotherapy (carboplatin, pemetrexed, pembrolizumab) but experienced different changes in their LSM. Decreased LSM was experienced as exhaustion to the point that “one flight up the stairs to my bedroom was like walking five miles” (Figure 2C) and wanting to “stay in bed all day long because you are just wiped out” (Figure 2D). In Figure 2D at the six-month interview, the patient described how using a wheelchair actually helped her improve her LSM because she otherwise “didn’t have the energy to get to the car.”
Figure 2. Joint displays.

Joint displays integrating quantitative plots of Life-Space Assessment scores with qualitative patient descriptions of life-space mobility. All four patients shown received the same chemoimmunotherapy non-small cell lung cancer treatment.
Abbreviations: F, female; M, male; yo, year old.
The association between IADL dependence and low pretreatment LSA score was a prominent theme in the qualitative substudy:
“No energy. […] I literally couldn’t do much of anything–fix food. I couldn’t even get up and fix me a sandwich if I wanted to.” (74-year-old woman starting chemotherapy, pretreatment interview describing prior chemotherapy)
Several patients described high morning fatigue and restricted LSM:
“I got up, felt weary, laid there on the couch and slept for about 6 hours.” (87-year-old man starting chemotherapy, pretreatment interview)
Anxiety influenced LSM in various ways including a fear of infection and fear of needing help when away from home:
“I just didn’t go outside. I didn’t want to get an infection from other people who’ve got something.” (73-year-old man on chemoimmunotherapy, two-month interview)
“I just felt like […] you shouldn’t drive because you go out and get weak and then need somebody to come and get you. And I didn’t have anybody at that time that I felt would just run over and come get me.” (79-year-old woman starting chemoimmunotherapy, pretreatment interview)
DISCUSSION
In a diverse cohort of older adults starting a new systemic NSCLC treatment, mean pretreatment LSA was 67.1, which declined, on average, 10.1 points at one month and did not recover at six months after treatment initiation. This prospective cohort study is the first to identify characteristics associated with pretreatment LSM and changes during NSCLC treatment among older adults. In fact, this study is one of only a handful of studies on LSM among patients with cancer12–14 and the first focused on NSCLC.
Overall, our cohort began with a high prevalence of IADL dependence (66.3%), low MoCA scores (67.7%), and high anxiety scores (71.6%). The mean pretreatment LSA score of 67.1 is worse than normative population data for older adults without cancer (e.g., median LSA score for 70- to 74-year-olds is 86).36 To illustrate, an LSA score of 67 may reflect a person who can travel within their neighborhood independently but needs personal assistance to travel to places within their town. Further, the 10.1-point decline that these patients experienced is greater than the minimal important change of 5, which is associated with worsening walking ability.18
High pretreatment anxiety score was the only characteristic associated with decline in LSM at one month. Among patients with NSCLC, anxiety is associated with higher symptom severity, depression, lower QOL, and lung cancer stigma.37 Studies on the role of anxiety in life-space decline in the general older adult population are limited. While fear of falling specifically has been linked to life-space decline among community-dwelling older adults,38 there are no other studies on anxiety or fear of infection and LSM among older adults with cancer.
Our finding that older adults with NSCLC with high pretreatment anxiety, sometimes due to fear of infection, are more likely to experience life-space decline when starting chemotherapy, immunotherapy, and/or targeted therapy has clinical implications for anticipatory guidance. While some chemotherapy regimens do result in neutropenia, which increases an older adult’s risk for serious infection, immunotherapy and targeted therapy for NSCLC do not commonly increase infection risk.39, 40 For patients starting immunotherapy and targeted therapy, reassurance can be provided that patients, in general, do not need to limit their LSM during the initial month of treatment and should be encouraged to maintain their mobility to minimize deconditioning. Older adults with high anxiety symptoms should receive psycho-oncology resources to provide additional support as they begin NSCLC treatment.41
The only characteristic associated with change in LSM from one to six months after treatment initiation was a pretreatment BMI <21 kg/m2. This association was unexpected since a lower BMI is considered a risk factor for malnutrition among older adults42 and is associated with worse survival among patients with NSCLC.43 In our study, older adults with a low pretreatment BMI had similar pretreatment LSA scores, were not more fit at enrollment, and were not more likely to gain weight during treatment. In contrast to a study of community-dwelling older adults without cancer where involuntary weight loss was associated with more rapid decline in LSM,44 we did not find an association between pretreatment involuntary weight loss and change in LSM. To understand this complex relationship between BMI and LSM, further research is needed to move beyond the poor surrogate measure of BMI to evaluate the role of body composition33 including sarcopenic obesity45 and myosteatosis,46 both of which are not captured by BMI.
In addition, we found that neither pretreatment LSM nor change during treatment were independently associated with chronological age or pretreatment KPS, which are routinely relied upon to risk stratify patients with cancer. In a systematic review of functional status during systemic cancer treatment among older adults, results were mixed with many studies reporting no association between age or performance status with functional decline and a few studies reporting an association.7 In studies of chemotherapy toxicity among older adults, KPS does not predict severe adverse events whereas a geriatric assessment-based risk score that includes age is predictive.47 Our results highlight the need to assess older adults beyond age and performance status to understand baseline LSM and risk for decline.
While high pretreatment morning fatigue was associated with lower pretreatment LSM, it was not associated with change in LSA score during NSCLC treatment. In contrast, interview participants described feeling “exhausted” or “wiped out” when their LSA score declined. This difference between our quantitative and qualitative findings may be related to changes in fatigue during treatment, which were not included in this analysis given our focus on pretreatment characteristics for risk stratification prior to treatment initiation. Additionally, future research should explore measures of other aspects of fatigue such as fatigability48 to determine if a different pretreatment measure of fatigue might be associated with life-space decline.
Whereas many prior studies on functional decline during cancer treatment among older adults focused on chemotherapy,7 our study also included immunotherapy and targeted therapy, which are common NSCLC treatments with more favorable toxicity profiles on average than chemotherapy.49 Interestingly, type of systemic NSCLC treatment was not associated with change in LSA score during treatment, meaning that older adults who received immunotherapy and/or targeted therapy experienced decline in their LSM similar to older adults who received chemotherapy. It is important to counsel older adults and their caregivers on the potential impact of all of these systemic treatments on their LSM in order to inform shared decision making, plan for possible life-space decline, and minimize any negative impacts if they occur.
Through our innovative longitudinal mixed methods design, our joint displays provided a unique lens into how quantitative changes in LSM are experienced qualitatively by older adults with NSCLC. These joint displays help put LSA scores and treatment toxicity into the context of patients’ lives. Our findings provide support for LSM as a relevant, patient-centered measure of function that should be considered for inclusion in clinical cancer care and geriatric oncology research on the impact of cancer treatment on older adults. Further research is warranted to study joint displays as potential tools to enhance discussions of treatment toxicity during shared decision making and patient education. In addition, it will be important to understand how older adults with cancer prioritize maximizing LSM compared to other related but distinct priorities such as maintaining functional independence or QOL.
With the COVID-19 pandemic, LSM was abruptly restricted globally for people of all ages as shelter-in-place and social distancing guidelines were implemented. In general, frail older adults without cancer with a restricted LSM experience a greater negative impact on their QOL compared with non-frail older adults.50 During the COVID-19 pandemic, older adults with cancer were more likely to report LSM decline than older adults without cancer.12 While we used a data cut-off date of 2/29/2020 for this analysis to remove the effect of the pandemic and instead focus on patients’ underlying LSM, the pandemic has served as a reminder of the importance of LSM on our physical and mental health.
This study has several limitations. Although the broad eligibility criteria allowed for enrollment of a diverse participant population from diverse practice settings, all recruitment sites were in San Francisco, which may limit generalizability to other regions. In our longitudinal models, we chose to include only pretreatment characteristics to mimic information available to oncologists risk stratifying patients before treatment initiation. Therefore, we did not include change in function or symptoms during treatment as predictors of LSM. While our longitudinal mixed methods design uniquely allowed us to examine how older adults with NSCLC experience changes in LSM, we only included English-speaking in the qualitative substudy. Lastly, the third interview at six months after treatment initiation was added to the study after the first seven patients had already completed their participation, so some important longer-term perspectives may have been missed initially.
In conclusion, many older adults with NSCLC have low pretreatment LSM and experience further declines in mobility during treatment. Incorporating LSA into clinical cancer care and research may help older adults concretely visualize how treatment might impact their daily function to allow for informed decision making and identify early changes in mobility to implement supportive interventions.
Supplementary Material
KEY POINTS.
Key Points:
Among older adults with lung cancer, average pretreatment life-space mobility was low.
High anxiety and low BMI were associated with life-space decline and improvement during treatment, respectively.
Why does this matter?
Life-space assessments may help older adults better understand how treatment impacts their lives.
ACKNOWLEDGMENTS
We thank Amy J. Markowitz, JD (scientific writing specialist for the University of California, San Francisco Clinical & Translational Science Institute K Scholars Program) for her assistance with this manuscript. In addition, we thank clinical research coordinators Evelyn Badua, Evelin Trejo, Ivan Leung, and Paul Couey for their support of this study.
Funding sources
This work was supported by the National Institutes of Health [R03AG056439 to MLW, K76AG064431 to MLW, P30AG044281 to MLW and LCM, KL2TR001870 to MLW, K24AG068312 to AKS, T32CA225617 to MM, P30CA196521 to MM, R03AG064374 to CJP, P30CA016058 to CJP, K08CA234225 to GRW, K99CA237744 to KPL]; the University of California, San Francisco Helen Diller Family Comprehensive Cancer Center [to MLW]; and the Wilmot Research Fellowship Award [to KPL].
Sponsor’s Role
The sponsors had no role in the design, methods, subject recruitment, data collection, analysis, or preparation of the paper.
Conflict of Interest
MLW reported that an immediate family member is an employee of Genentech with stock ownership. MLW receives royalties from UpToDate. KPL has served as a consultant for Pfizer and Seattle Genetics, and has received speaker fees from Pfizer.
Footnotes
Prior presentation: A portion of this work was presented as a poster at the 2019 American Geriatrics Society Annual Meeting in Portland, OR and as a Clinician-Scientists Transdisciplinary Aging Research (Clin-STAR) oral presentation at the 2021 American Geriatrics Society Annual Meeting (virtual).
REFERENCES
- [1].Howlader N, Noone AM, Krapcho M, et al. SEER Cancer Statistics Review, 1975-2018, National Cancer Institute. Bethesda, MD. [Google Scholar]
- [2].Sung H, Ferlay J, Siegel RL, et al. Global Cancer Statistics 2020: GLOBOCAN Estimates of Incidence and Mortality Worldwide for 36 Cancers in 185 Countries. CA Cancer J Clin. 2021;71: 209–249. [DOI] [PubMed] [Google Scholar]
- [3].Wong ML, Paul SM, Cooper BA, et al. Predictors of the multidimensional symptom experience of lung cancer patients receiving chemotherapy. Support Care Cancer. 2017;25: 1931–1939. [DOI] [PMC free article] [PubMed] [Google Scholar]
- [4].Wong ML, Cooper BA, Paul SM, et al. Differences in Symptom Clusters Identified Using Ratings of Symptom Occurrence vs. Severity in Lung Cancer Patients Receiving Chemotherapy. J Pain Symptom Manage. 2017;54: 194–203. [DOI] [PMC free article] [PubMed] [Google Scholar]
- [5].Presley CJ, Arrato NA, Janse S, et al. Functional disability among older vs. younger adults with advanced non-small cell lung cancer. JCO Oncol Pract. 2021: (In press). [DOI] [PMC free article] [PubMed] [Google Scholar]
- [6].Fried TR, Bradley EH, Towle VR, Allore H. Understanding the treatment preferences of seriously ill patients. N Engl J Med. 2002;346: 1061–1066. [DOI] [PubMed] [Google Scholar]
- [7].Loh KP, Lam V, Webber K, et al. Characteristics Associated With Functional Changes During Systemic Cancer Treatments: A Systematic Review Focused on Older Adults. Journal of the National Comprehensive Cancer Network : JNCCN. 2021: 1–8. [DOI] [PMC free article] [PubMed] [Google Scholar]
- [8].Peel C, Sawyer Baker P, Roth DL, Brown CJ, Brodner EV, Allman RM. Assessing mobility in older adults: the UAB Study of Aging Life-Space Assessment. Phys Ther. 2005;85: 1008–1119. [PubMed] [Google Scholar]
- [9].Johnson J, Rodriguez MA, Al Snih S. Life-Space Mobility in the Elderly: Current Perspectives. Clinical interventions in aging. 2020;15: 1665–1674. [DOI] [PMC free article] [PubMed] [Google Scholar]
- [10].Kennedy RE, Sawyer P, Williams CP, et al. Life-Space Mobility Change Predicts 6-Month Mortality. J Am Geriatr Soc. 2017;65: 833–838. [DOI] [PMC free article] [PubMed] [Google Scholar]
- [11].Rantakokko M, Portegijs E, Viljanen A, Iwarsson S, Rantanen T. Life-space mobility and quality of life in community-dwelling older people. J Am Geriatr Soc. 2013;61: 1830–1832. [DOI] [PubMed] [Google Scholar]
- [12].Gattás-Vernaglia IF, Ramos PT, Perini MLL, et al. Impact of the COVID-19 pandemic on the life-space mobility of older adults with cancer. Journal of geriatric oncology. 2021. [DOI] [PMC free article] [PubMed] [Google Scholar]
- [13].Stewart CM, Wheeler TL 2nd, Markland AD, Straughn JM Jr., Richter HE. Life-space assessment in urogynecology and gynecological oncology surgery patients: a measure of perioperative mobility and function. J Am Geriatr Soc. 2009;57: 2263–2268. [DOI] [PMC free article] [PubMed] [Google Scholar]
- [14].Yee J, Davis GM, Beith JM, et al. Physical activity and fitness in women with metastatic breast cancer. Journal of cancer survivorship : research and practice. 2014;8: 647–656. [DOI] [PubMed] [Google Scholar]
- [15].American Joint Commitee on Cancer. AJCC Cancer Staging Manual. 8th edn: Springer International Publishing, 2017. [Google Scholar]
- [16].Loyd C, Beasley TM, Miltner RS, Clark D, King B, Brown CJ. Trajectories of Community Mobility Recovery After Hospitalization in Older Adults. J Am Geriatr Soc. 2018;66: 1399–1403. [DOI] [PMC free article] [PubMed] [Google Scholar]
- [17].Sheppard KD, Sawyer P, Ritchie CS, Allman RM, Brown CJ. Life-space mobility predicts nursing home admission over 6 years. J Aging Health. 2013;25: 907–920. [DOI] [PMC free article] [PubMed] [Google Scholar]
- [18].Kennedy RE, Almutairi M, Williams CP, Sawyer P, Allman RM, Brown CJ. Determination of the Minimal Important Change in the Life-Space Assessment. J Am Geriatr Soc. 2019;67: 565–569. [DOI] [PubMed] [Google Scholar]
- [19].Hurria A, Cirrincione CT, Muss HB, et al. Implementing a geriatric assessment in cooperative group clinical cancer trials: CALGB 360401. J Clin Oncol. 2011;29: 1290–1296. [DOI] [PMC free article] [PubMed] [Google Scholar]
- [20].Karnofsky D Performance scale. New York: Plenum Press, 1977. [Google Scholar]
- [21].Katz S, Ford AB, Moskowitz RW, Jackson BA, Jaffe MW. Studies of illness in the aged. The index of ADL: A standardized measure of biological and psycosocial function. JAMA. 1963;185: 914–919. [DOI] [PubMed] [Google Scholar]
- [22].Fillenbaum GG, Smyer MA. The development, validity, and reliability of the OARS multidimensional functional assessment questionnaire. J Gerontol. 1981;36: 428–434. [DOI] [PubMed] [Google Scholar]
- [23].Podsiadlo D, Richardson S. The timed “Up & Go”: a test of basic functional mobility for frail elderly persons. J Am Geriatr Soc. 1991;39: 142–148. [DOI] [PubMed] [Google Scholar]
- [24].Guralnik JM, Simonsick EM, Ferrucci L, et al. A short physical performance battery assessing lower extremity function: association with self-reported disability and prediction of mortality and nursing home admission. J Gerontol. 1994;49: M85–94. [DOI] [PubMed] [Google Scholar]
- [25].Nasreddine ZS, Phillips NA, Bedirian V, et al. The Montreal Cognitive Assessment, MoCA: a brief screening tool for mild cognitive impairment. J Am Geriatr Soc. 2005;53: 695–699. [DOI] [PubMed] [Google Scholar]
- [26].Mohile SG, Epstein RM, Hurria A, et al. Communication With Older Patients With Cancer Using Geriatric Assessment: A Cluster-Randomized Clinical Trial From the National Cancer Institute Community Oncology Research Program. JAMA Oncol. 2019: 1–9. [DOI] [PMC free article] [PubMed] [Google Scholar]
- [27].Pergolotti M, Langer MM, Deal AM, Muss HB, Nyrop K, Williams G. Mental status evaluation in older adults with cancer: Development of the Mental Health Index-13. Journal of geriatric oncology. 2019;10: 241–245. [DOI] [PMC free article] [PubMed] [Google Scholar]
- [28].Sherbourne CD, Stewart AL. The MOS social support survey. Soc Sci Med. 1991;32: 705–714. [DOI] [PubMed] [Google Scholar]
- [29].Bischel LE, Ritchie C, Kober KM, et al. Age differences in fatigue, decrements in energy, and sleep disturbance in oncology patients receiving chemotherapy. Eur J Oncol Nurs. 2016;23: 115–123. [DOI] [PMC free article] [PubMed] [Google Scholar]
- [30].Lee KA, Hicks G, Nino-Murcia G. Validity and reliability of a scale to assess fatigue. Psychiatry research. 1991;36: 291–298. [DOI] [PubMed] [Google Scholar]
- [31].Aaronson NK, Ahmedzai S, Bergman B. The European Organization for Research and Treatment of Cancer QLQ-C30: a quality-of-life instrument for use in international clinical trials in oncology. Journal of the National Cancer Institute. 1993;85. [DOI] [PubMed] [Google Scholar]
- [32].Rivera GA, Wakelee H. Lung Cancer in Never Smokers. Advances in experimental medicine and biology. 2016;893: 43–57. [DOI] [PubMed] [Google Scholar]
- [33].Strulov Shachar S, Williams GR. The Obesity Paradox in Cancer-Moving Beyond BMI. Cancer epidemiology, biomarkers & prevention : a publication of the American Association for Cancer Research, cosponsored by the American Society of Preventive Oncology. 2017;26: 13–16. [DOI] [PMC free article] [PubMed] [Google Scholar]
- [34].Vaismoradi M, Turunen H, Bondas T. Content analysis and thematic analysis: Implications for conducting a qualitative descriptive study. Nursing & Health Sciences. 2013;15: 398–405. [DOI] [PubMed] [Google Scholar]
- [35].Creswell J A concise introduction to mixed methods research. Los Angeles, CA: SAGE Publications, Inc, 2015. [Google Scholar]
- [36].Phillips J, Dal Grande E, Ritchie C, Abemethy AP, Currow DC. A Population-Based Cross-Sectional Study That Defined Normative Population Data for the Life-Space Mobility Assessment-Composite Score. Journal of Pain and Symptom Management. 2015;49: 885–893. [DOI] [PubMed] [Google Scholar]
- [37].Brown Johnson CG, Brodsky JL, Cataldo JK. Lung cancer stigma, anxiety, depression, and quality of life. Journal of psychosocial oncology. 2014;32: 59–73. [DOI] [PMC free article] [PubMed] [Google Scholar]
- [38].Auais M, Alvarado B, Guerra R, et al. Fear of falling and its association with life-space mobility of older adults: a cross-sectional analysis using data from five international sites. Age Ageing. 2017;46: 459–465. [DOI] [PMC free article] [PubMed] [Google Scholar]
- [39].Soria J-C, Ohe Y, Vansteenkiste J, et al. Osimertinib in Untreated EGFR-Mutated Advanced Non–Small-Cell Lung Cancer. New England Journal of Medicine. 2018;378: 113–125. [DOI] [PubMed] [Google Scholar]
- [40].Gandhi L, Rodriguez-Abreu D, Gadgeel S, et al. Pembrolizumab plus Chemotherapy in Metastatic Non-Small-Cell Lung Cancer. N Engl J Med. 2018;378: 2078–2092. [DOI] [PubMed] [Google Scholar]
- [41].Trevino KM, Saracino RM, Roth AJ. Symptomatology, assessment, and treatment of anxiety in older adults with cancer. Journal of geriatric oncology. 2021;12: 316–319. [DOI] [PMC free article] [PubMed] [Google Scholar]
- [42].Vellas B, Villars H, Abellan G, et al. Overview of the MNA--Its history and challenges. J Nutr Health Aging. 2006;10: 456–463; discussion 463-455. [PubMed] [Google Scholar]
- [43].Shepshelovich D, Xu W, Lu L, et al. Body Mass Index (BMI), BMI Change, and Overall Survival in Patients With SCLC and NSCLC: A Pooled Analysis of the International Lung Cancer Consortium. J Thorac Oncol. 2019;14: 1594–1607. [DOI] [PMC free article] [PubMed] [Google Scholar]
- [44].Ritchie CS, Locher JL, Roth DL, McVie T, Sawyer P, Allman R. Unintentional weight loss predicts decline in activities of daily living function and life-space mobility over 4 years among community-dwelling older adults. J Gerontol A Biol Sci Med Sci. 2008;63: 67–75. [DOI] [PubMed] [Google Scholar]
- [45].Batsis JA, Villareal DT. Sarcopenic obesity in older adults: aetiology, epidemiology and treatment strategies. Nature Reviews Endocrinology. 2018;14: 513–537. [DOI] [PMC free article] [PubMed] [Google Scholar]
- [46].Correa-de-Araujo R, Addison O, Miljkovic I, et al. Myosteatosis in the Context of Skeletal Muscle Function Deficit: An Interdisciplinary Workshop at the National Institute on Aging. Frontiers in Physiology. 2020; 11. [DOI] [PMC free article] [PubMed] [Google Scholar]
- [47].Hurria A, Togawa K, Mohile SG, et al. Predicting chemotherapy toxicity in older adults with cancer: A prospective multicenter study. J Clin Oncol. 2011;29: 3457–3465. [DOI] [PMC free article] [PubMed] [Google Scholar]
- [48].Glynn NW, Santanasto AJ, Simonsick EM, et al. The Pittsburgh Fatigability scale for older adults: development and validation. J Am Geriatr Soc. 2015;63: 130–135. [DOI] [PMC free article] [PubMed] [Google Scholar]
- [49].Gomes F, Tay R, Chiramel J, Califano R. The Role of Targeted Agents and Immunotherapy in Older Patients with Non-small Cell Lung Cancer. Drugs Aging. 2018;35: 819–834. [DOI] [PubMed] [Google Scholar]
- [50].Saraiva MD, Apolinario D, Avelino-Silva TJ, et al. The Impact of Frailty on the Relationship between Life-Space Mobility and Quality of Life in Older Adults during the COVID-19 Pandemic. The journal of nutrition, health & aging. 2021;25: 440–447. [DOI] [PMC free article] [PubMed] [Google Scholar]
Associated Data
This section collects any data citations, data availability statements, or supplementary materials included in this article.