Abstract
Statistical data pertaining to anatomic variations of the human talus contain valuable information for advances in biological anthropology, diagnosis of the talar pathologies, and designing talar prostheses. A statistical shape model (SSM) can be a powerful data analysis tool for the anatomic variations of the talus. The main concern in constructing an SSM for the talus is establishing the true geometric correspondence between the talar geometries. The true correspondence complies with biological and/or mathematical homologies on the talar surfaces. In this study, we proposed a semi‐automatic approach to establish a dense correspondence between talar surfaces discretized by triangular meshes. Through our approach, homologous salient surface features in the form of crest lines were detected on 49 talar surfaces. Then, the point‐wise correspondence information of the crest lines was recruited to create posterior Gaussian process morphable models that non‐rigidly registered the talar meshes and consequently established inter‐mesh dense correspondence. The resultant correspondence perceptually represented the true correspondence as per our visual assessments. Having established the correspondence, we computed the mean shape using full generalized Procrustes analysis and constructed an SSM by means of principal component analysis. Anatomical variations and the mean shape of the talus were predicted by the SSM. As a clinically related application, we considered the mean shape and investigated the feasibility of designing universal talar prostheses. Our results suggest that the mean shape of (the shapes of) tali can be used as a scalable shape template for designing universal talar prostheses.
Keywords: crest lines, human talus, statistical shape modeling, universal talar prostheses
The surface of the talus is irregular with concave and convex regions. These regions contain salient surface features in the form of ridge and valley lines, that is, crest lines. The crest lines can be classified and considered as anatomic features of the talus.

1. INTRODUCTION
The human ankle joint complex is comprised of tibio‐talar, talo‐calcaneal, and talo‐calcaneonavicular joints. Articulating with all these joints, the talus plays a principal role in completion of the leg‐foot force transmission chain directly affecting the postural form and locomotion in humans (Brockett & Chapman, 2016). In addition to the detailed anatomy of the talus, the anatomic variations of the bone have received considerable attention in several areas of research and practice. In biological anthropology, it is believed that anatomic variations of the talus provide information on foot function, postural and locomotor adaptations, and timing/sequence of functional evolution in the foot of human‐like terrestrials (Knigge et al., 2015; Parr et al., 2014; Püschel et al., 2017; Sorrentino et al., 2020; Turley & Frost, 2013). From diagnostic perspectives, knowledge of anatomic variations of normal tali helps diagnosis of the bone pathologies (Feng et al., 2018; Seki et al., 2019; Tümer et al., 2016; Tümer, Vuurberg, et al., 2019). Traumatic and atraumatic causes, complications of total ankle arthroplasty, tumor resection, and talectomy may severely affect the integrity of the talus up to total loss of the bone (Fang et al., 2018; Pearce et al., 2005; Regauer et al., 2017). Besides few treatment methods being available for total/partial loss of talus (Taniguchi et al., 2012), a more recent and so far promising approach is implantation of talar body or total talar prostheses (Ando et al., 2016; Angthong, 2014; Bowes et al., 2019; Harnroongroj & Harnroongroj, 2014; Harnroongroj & Vanadurongwan, 1997; Islam et al., 2014; Magnan et al., 2004; Regauer et al., 2017; Ruatti et al., 2017; Stevens et al., 2007; Taniguchi et al., 2012; Trovato et al., 2017; Tsukamoto et al., 2010). Designing talar prostheses, particularly non‐custom‐made or universal prostheses for total talar replacement, requires understanding of anatomic variations of the talus (Bowes et al., 2019; Islam et al., 2014; Lenz et al., 2021; Liu et al., 2020; Trovato et al., 2017; Tümer, Arbabi, et al., 2019).
Referred to as shape variations, anatomic variations of bones can be studied through statistical shape models (SSMs) of landmark (LM) configurations (Dryden & Mardia, 2016). Also called landmark‐based geometric morphometrics (Webster & Sheets, 2010), this approach relies on approximating the outlines (surface/curve) of the shapes of the same class by discrete LM configurations, that is, point sets. Constructing an SSM requires that the LMs in any two different configurations are in correspondence, that is, a one‐to‐one mapping between the LMs. Establishing the true correspondence is the main challenge in creating an SSM (Chui et al., 2004). The true correspondence is achieved if the correspondence is strictly established based on biologically homologous LMs. In practice, inter‐specimen biological homology is detected by visualization and only a limited number of biologically homologous LMs are usually detectable. Therefore, this biological constraint is relaxed by defining mathematical/geometric homology. In this regard, LMs (on different specimen) satisfying particular pure mathematical/geometric properties are also considered as homologous and hence in true correspondence (Cooke & Terhune, 2015; Webster & Sheets, 2010).
Visual recognition of biological LMs, that is, juxtapositions of tissues (denoted as type‐I Bookstein, 1991; Cooke & Terhune, 2015) on the three‐dimensional (3D) surface (particularly a digitized/scanned surface) of the talus is difficult and non‐reliable. Therefore, mathematical LMs and/or semi (pseudo) LMs have been utilized (Bookstein, 1991; Knigge et al., 2015; Püschel et al., 2017; Sorrentino et al., 2020; Turley & Frost, 2013). Mathematical LMs include type‐II (extrema of curvature), type‐III (extremal points or points defined based on the locations of other points); and semi LMs are points that are distributed (typically equally spaced) between the biological or mathematical LMs (Cooke & Terhune, 2015).
Since the process of visually identifying and manually locating mathematical LMs is subjective, laborious, and the resultant configurations cannot densely discretize/sample the talar geometry, other researchers (Liu et al., 2020; Tümer, Arbabi, et al., 2019; Tümer et al., 2016; Tümer, Vuurberg, et al., 2019) have implemented so‐called “homology‐free” methods. Through a homology‐free method, inter‐sample corresponding LMs are automatically identified through non‐rigid registration/alignment of the discretized surfaces of the samples (i.e. triangular meshes), and thereby dense correspondence across all the samples is established. Non‐rigid registration generates LM configurations whose LMs are in correspondence, and the number of LMs in the configurations is in the order of the cardinality of the point sets (i.e. triangular mesh nodes) approximating the outline of the shapes.
Although automatic LM identification through non‐rigid registration of surfaces generates a (discretely) dense correspondence, it does not guarantee that the correspondence complies with biological and/or mathematical homologies at every point (Gunz & Mitteroecker, 2013; Klingenberg, 2008). Therefore, an SSM based on automatic LM identification may predict local shape variations and the mean shape that are not necessarily biologically interpretable (Gonzalez et al., 2016; Gunz & Mitteroecker, 2013). This issue becomes even more significant if local anatomic novelties exist in some shapes in the set under study (Klingenberg, 2008). Consequently, implementation of an SSM (based on a homology‐free method) for designing universal talar prostheses may lead to erroneous talar geometries due to appearance of non‐biological shape variations.
In the present study, we hypothesized that the shape of the talus contains geometric features in the form of crest lines defined by particular mathematical definitions. By visual investigation, we then demonstrated that relative anatomic novelties manifested by regions of different surface curvatures existed among tali, and not all tali had similar types of geometric features, that is, crest lines. We then attempted to achieve the purposes of this study as follows. (1) Identifying and classifying common crest lines of the talar samples for establishing a geometric feature‐to‐feature dense correspondence. (2) Introducing the feature‐to‐feature correspondence information (as a prior) into a non‐rigid registration process automatically establishing a dense correspondence between the talar surfaces (meshes). (3) Constructing an SSM estimating the mean shape and shape variations (modes) of the talus. (4) Computing the average deviations of the talar shapes from their mean shape to investigate the viability of the mean shape as a shape template of universal talar prostheses.
2. MATERIALS AND METHODS
The irregular anatomy of the talus contains salient geometric features in the form of convex and concave regions running along curves (paths) that can be visually detected by an observer; meaning that one can intuitively draw curves along the loci of points with relatively higher/lower curvatures (Figure 1). We hypothesized that these curves can be identified as either ridge or valley lines with specific mathematical definitions. Both types of the feature lines are referred to as crest lines.
FIGURE 1.
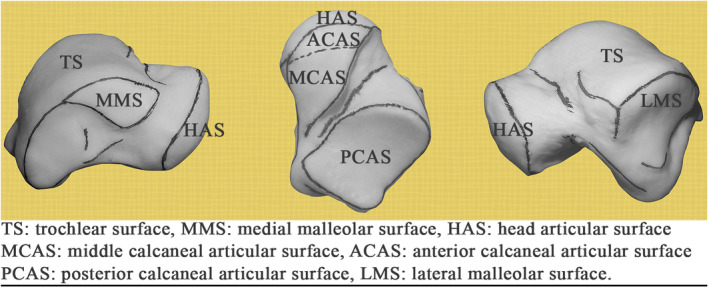
Crest lines visually detected and marked by the authors on a three‐dimensional print of a (left) talus [Colour figure can be viewed at wileyonlinelibrary.com]
The talar crest lines can indicate boundaries of the talar articular surfaces (Figure 1); therefore, it is natural to regard anatomically similar crest lines on tali as homologous geometric features. In this regard, we established crest‐line correspondence prior to automatically establishing talar surface correspondence. This not only assured a true feature‐to‐feature correspondence but provided prior information for estimating dense point‐to‐point correspondence between the surfaces of each talar pair. Our approach to construct an SSM of the talus is delineated as follows.
2.1. Data collection, segmentation, and reconstruction of geometric bone surfaces
Computer tomography (CT) data of healthy and intact tali of 49 adult subjects (with average age of 37.6 ± 15.1) were anonymously provided by the University of Alberta Hospital after ethics approval. The CT data contained images with slice thickness of 1 mm and pixel matrix of 512 × 512 with 0.36 × 0.36 mm2 in‐plane resolution. Automatic segmentation of the CT data and geometric reconstruction of the talar (closed) surfaces in the form of triangular meshes were performed in Mimics (Materialise Mimics 20.0). The triangular meshes were processed (in Geomagic Studio 2015.3) to remove mesh defects (small holes, non‐manifold edges, etc.). The meshes were then re‐meshed to obtain uniform meshes. The deviations emerged from the mesh processing were negligible. The remeshing process was accompanied by mesh smoothing. By limiting the intensity of mesh smoothing we preserved the sharpness of the surface details and later observed that a slight degree of mesh smoothing led to more quality and detailed detection of the talar crest lines (see supplemental material Sec. 1 for instances of the mesh sensitivity analysis). The average size of the triangles, number of the nodes/triangles, and triangle density of the processed meshes were 1 mm, 7600/15,000, and 2 elements/mm2 respectively.
The talar meshes represented the right talar bone or mirrored to this side. Each mesh was initially translated, by its centroid (average coordinates of the nodes), to the origin of the coordinate system.
2.2. Detection of crest lines
Let be a smooth orientable surface, a point of the surface, TpS the tangent plane (of S) at p, and the unit normal vector to S at p. At any point , a tangent vector and define a normal plane intersecting the surface (Figure 2a). The intersection is a curve, referred to as the normal section of the surface at p (Figure 2a). The normal curvature, , of the surface at p is the signed curvature of the normal section of the surface at p (Pressley, 2010). If where t is the parameter of the normal section , then such that kp is considered positive if and negative if . This convention leads to kp > 0 and kp < 0 for convex and concave regions of a surface respectively.
FIGURE 2.
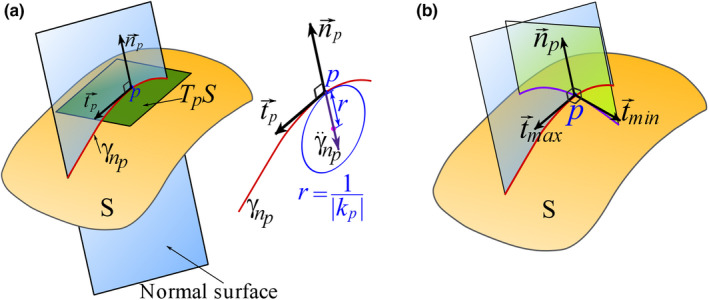
Geometric demonstrations of (a) tangent plane, tangent and normal vectors, normal plane, and normal curvature, (b) principal directions [Colour figure can be viewed at wileyonlinelibrary.com]
The normal curvature kp is a function of , i.e. , because determines an orientation for the intersecting plane containing a particular (Figure 2a). The extrema of at p, denoted as k max (p) and k min (p), are called the principal curvatures, and the directions and at which the function attains the extremum values are called the principal directions (Figure 2b). The principal directions are orthogonal (Pressley, 2010).
Crest lines are mathematically identified as loci of points at which the (scalar fields of) principal curvatures attain their local extremum along their corresponding principal directions (Yoshizawa et al., 2005). This definition can be separately written in a mathematical form for ridge and valley lines. Let k max (x) and k min (x) be the scalar fields over S such that k max (x) > k min (x), and positive and negative values of curvature be associated with convex and concave regions respectively. Then, the definition implies that a point x is a crest‐line point if it satisfies either of the following conditions (Yoshizawa et al., 2005).
is a ridge‐line point iff
is a valley‐line point iff
where, is the gradient operator. The terms e max and e min are directional derivatives of k max (x) and k min (x) in the directions of and respectively.
The criteria defining a crest‐line point requires a smooth surface (at least twice differentiable here). A triangular mesh representing a talar surface, however, is not a smooth surface. To detect the crest lines of a mesh, we mainly followed the method by Yoshizawa et al. (2005) on fitting local cubic polynomials on mesh points and estimating the principal curvature fields and their derivatives. The method was implemented by developing custom Python code by the author (BV). Each detected crest line was expressed as a piecewise linear function, that is, a set of discrete points sequentially connected by line segments.
2.3. Anatomic identification and selection of crest lines and their landmarks
Based on our observations, we classified the detected crest lines into three types: Type A was referred to crest lines that could be (almost) frequently detected on all the meshes and they represented noticeable anatomic features. Type B represented crest lines that their ends and shapes could not be identically traced on all the talar meshes, however, they had anatomic interpretations. Type C denoted crest lines that did not present noticeable anatomic features, but they were rather generated due to mesh artifacts. Figure 3 depicts instances of the three types of crest lines on two different talar surfaces. Only type‐A crest lines were considered as potentially common features of the tali.
FIGURE 3.
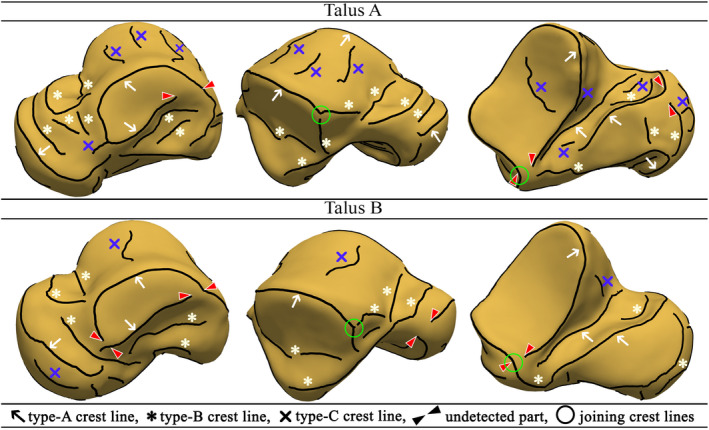
Classification of the detected crest lines [Colour figure can be viewed at wileyonlinelibrary.com]
Our inter‐model observations led to the recognition of two concerns with the detected type‐A crest lines. Firstly, some of the crest lines contained undetected parts that would have completed circumferential boundaries of articular surfaces (Figure 3). Secondly, some type‐A crest lines joined/intersected other crest lines (Figure 3). Since our SSM required a crest line on a mesh to have a unique correspondence on any other mesh, we defined an ideal or a homologous set of type‐A crest lines that all tali had to contain. This set of crest lines were defined based on our visual judgment. Depicted in Figure 4, the ideal set of crest lines contained seven classified crest lines as:
PCAS‐CL: the crest line (CL) enclosing the posterior calcaneal articular surface (PCAS) of the talar body.
LMS‐CL: the superior crest line of the lateral malleolar surface (LMS). The end points (I and II) of this crest line was defined based on finding the intersection of each end of the crest line with two other crest lines. The intersections were either explicitly observed or readily inferred on all the tali.
TC‐CL: the crest line of the tarsal canal (TC). The end points (III and IV) of the crest line were automatically determined based on the crest line detection.
MMS‐CL: the enclosing crest line of the articular surface of the medial malleolar surface (MMS).
MMS‐ECL: extended crest line (ECL) of the superior edge of the MMS along with the connecting posteromedial tubercle (PMT) crest line. The end point (V) of the crest line on the edge of MMS was the point where the extension attached to the enclosing MMS‐CL, and the end point on the PMT (VI) was located by the automatic crest line detection.
TN‐CL: posterior crest line of the (middle and/or anterior) calcaneal articular surface (CAS) of the talar neck (TN). The end point (VII) of the crest line on the neck was automatically detected, and its other end point connected to the crest line of the head articular surface (HAS).
HAS‐CL: the crest line of the head articular surface. This crest line joined TN‐CL on one end and its other end (VIII) terminated at the intersection with the anterior crest line of the middle calcaneal articular surface of the talar neck.
FIGURE 4.
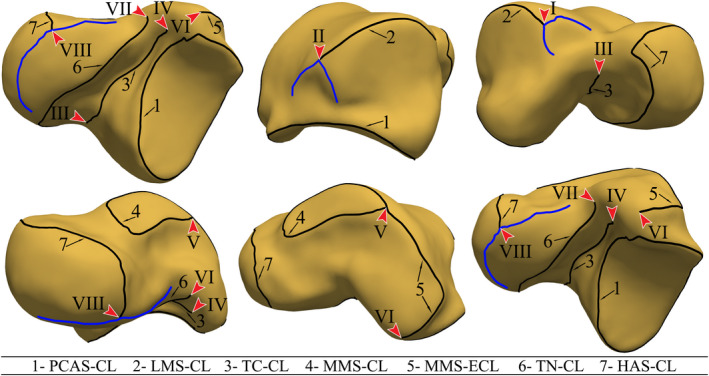
The ideal set of crest lines. The arrows point at the crest‐line LMs. The blue crest lines are type‐B crest lines intersecting with the ideal crest lines and defining end‐point LMs [Colour figure can be viewed at wileyonlinelibrary.com]
The end points of the ideal crest lines defined landmarks and were referred to as the crest‐line landmarks in this study. For a set of ideal crest lines, there were eight crest‐line LMs as demonstrated in Figure 4.
To refine the detected crest lines of each mesh in accordance with the ideal set of crest lines, we performed automatic and manual filtering, trimming, and completing broken crest lines. The automatic and manual filtering of the crest lines were based on a length threshold and type matching of crest lines respectively.
Completing a crest line was performed for the crest lines with some part(s) not automatically detected by the detection algorithm. Although some regions of a talar surface (in the vicinity of expected crest lines) were locally convex/concave along a path, the principal curvatures were not extremum there (e.g. locally flat, cylindrical, and spherical regions). Consequently, those points were not marked as crest‐line points by the algorithm. Also, some relatively small (and unconnected) pieces of crest lines could have been filtered during the automatic filtering. Figure 5a depicts a considerable case of partially undetected/broken MMS‐CL.
FIGURE 5.
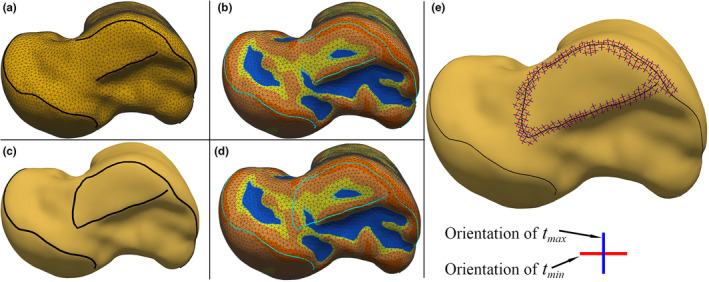
(a), (b) Considerable case of undetected/broken MMS‐CL on a talar mesh and the color map of the principal curvatures on the talar mesh, (c), (d) the completed MMS‐CL and the color map of the mean curvature, (e) orientations of the principal curvatures in the vicinity of the completed MMS‐CL [Colour figure can be viewed at wileyonlinelibrary.com]
A gap within a broken crest line was filled by a piecewise continuous curve whose points tended to align with the direction of minimum principal curvature in the convex regions and the direction of the maximum principal curvature in the concave regions. The filling curves then (approximately) followed the curvature lines passing through the surface points with locally higher/lower principal curvatures along the convex/concave regions. To find such curves, we followed the approach of using anisotropic geodesics presented by Zhuang et al. (2014). The implementation of anisotropic geodesic in this study was based on Campen's metric (Campen et al., 2012; Zhuang et al., 2014), and the method proposed by Kanai and Suzuki (2000) for calculating geodesics on triangular meshes.
In some cases, the utilized method of anisotropic geodesics failed to generate anatomically desired curves on the triangular meshes. This could be due to local alternation between convex regions and concave regions in the path of a gap, or accumulation of error as the algorithm of anisotropic geodesics traced the curvature lines on a mesh (Kanai & Suzuki, 2000; Zhuang et al., 2014). To observe/check the anatomic validity of the generated curvature lines, a color map of the mean curvature (k min + k max)/2, was utilized. The color map assigned warm colors to the convex regions and cold colors to the concave regions. Figure 5b depicted the color map of the mean curvature on an instance of the talar meshes. The curvature line produced by the anisotropic geodesics to fill the gap in the MMS‐CL on the mesh is shown in Figure 5c. Figure 5d shows that the curvature line falls along a convex region and, by our judgment, it approximately marks the boundary of the corresponding articular surface. The orientations of the principal curvatures in the vicinity of the completed MMS‐CL are shown in Figure 5e.
The idealized crest lines of each mesh were resampled for uniformly distributed points and mildly smoothened (Laplace smoothing). The aforementioned geodesic detection, and mesh operations on crest lines were performed using custom Python code and an ad hoc graphical user interface (GUI) prepared by the author (BV) using PyVista (Sullivan & Kaszynski, 2019). The generated ideal crest lines of instances of the talar meshes are demonstrated in supplemental material Sec. 2.
2.4. Non‐rigid registration of crest lines and surfaces for establishing dense correspondences
As a requirement of constructing an SSM, a dense point‐to‐point correspondence was established between each pair of the talar meshes through non‐rigid registrations. To this end, we used Gaussian process morphable models (GPMMs) (Luthi et al., 2018). A GPMM is a probabilistic point distribution model (PDM) in which geometries are represented by sets of points and their admissible deformations are modeled using a Gaussian process (GP). The fundamentals of the method are briefly explained in this section and readers can review the details in the work by Luthi et al (Luthi et al., 2018).
Registering a geometric object onto another object is performed by finding a deformation field u(x) such that,
| (1) |
where and are, respectively, referred to as the reference and target objects, is an open set, and u(x) is a (smooth) vector field that transforms onto .
The deformation field is not unique and may not be readily found by analytic solutions. The approach of a GPMM is based on estimating a deformation field by imposing a prior probability distribution over admissible transformations of the reference object using a GP defined as (Luthi et al., 2018),
| (2) |
where μ(x) and are the mean and kernel (covariance function) respectively.
Seeking the transformation morphing onto by a GPMM is formulated through a Bayesian inference problem. The Bayes’ rule for the linear model states that where p(u) represents the GP prior which is a joint Gaussian probability density function (pdf) for its argument evaluated at a finite number of points. For a fixed and , that is, observed data, the terms are the likelihood (function of u) and a constant respectively. A deformation field such that , is inferred by resorting to a maximum a posteriori (MAP) probability estimate as (Luthi et al., 2018),
| (3) |
where is called the registered/fitted object, and the likelihood function is defined as , with , , and D, respectively, being a weighting parameter, a normalizing factor, and a distance/metric function measuring the similarity of and (Luthi et al., 2018; Paragios et al., 2003). Thereby, Eq. 3 is equivalently expressed as,
| (4) |
To computationally implement this optimization problem (Eq. 4), the GP is (approximately) expressed by a finite sum of r basis (stochastic) functions. This approximation is called the low‐rank approximation of the Karhunen‐Loève expansion of the GP and is formulated as (Luthi et al., 2018),
| (5) |
in which has the normal distribution such that any two difference ’s are uncorrelated, each pair contains an Eigenvalue and Eigenvector of the Hilbert–Schmidt integral operator associated with the kernel of the GP. By this expansion, the optimization problem (MAP) is solved for ’s. The accuracy of the calculated depends on the number of the terms (r) in the low‐rank approximation.
A transformation, u(x), registering a reference object onto a target object is not unique; any smooth transformation is legitimate. Although being legitimate, a transformation does not necessarily map the points of the reference object to their biologically/mathematically homologous points of the target object. Nevertheless, a transformation that at least satisfies the correspondence of known biological/mathematical homologous LMs can be found. To this end, the inference of the transformation must incorporate our knowledge of the deformation vectors constructed between known homologous LMs of the reference and the target object.
If is a discrete set of the coordinate pairs of n visually identifiable homologous LMs on the geometries of the reference and target objects, the known deformation vectors at for can be collected in a discrete set as (Luthi et al., 2018),
| (6) |
Consequently, the inference problem (Eq. 3) can incorporate the known deformation vectors by letting the prior term, p(u) in Eq. 3, become conditional on . In this regard, a conditional (or posterior) PDF is defined as (Luthi et al., 2018),
| (7) |
where can be proved to be a GP, that is, , over and it is called the posterior GP. All deformation fields presented by contain known/pre‐determined deformation vectors at some finite number of points of . The mean and kernel functions of differ from those of the prior GP, , in Eq. 2 and can be written in closed‐form expression involving the mean and kernel of the prior, and the data provided by (see Luthi et al., 2018 for details).
In this study, the implementation of GPMMs was performed through our custom coding in Scala programming language and using Scalismo, an open source library for statistical shape modeling and model‐based image analysis in Scala (Scalismo, 2020). We carried out the registration of the talar meshes through two steps:
2.4.1. Step 1: Registration of crest lines
A talar mesh was randomly selected to be the reference mesh. The ideal crest lines (section 2, 2.1) of the reference mesh were collected in a set denoted as the reference crest‐line object. Each set of the ideal crest lines of other meshes formed a target crest‐line object (Figure 6).
FIGURE 6.

The reference and instances of target crest‐line objects [Colour figure can be viewed at wileyonlinelibrary.com]
The reference crest‐line object contained 843 points out of which eight points where the LMs of its ideal crest lines (section 2, 2.1). Other crest‐line objects had different numbers of points but contained eight LMs being in correspondence with those in the reference and other crest‐line objects (Figure 6).
The vectors from the LMs of the reference crest‐line object to the corresponding LMs of a target crest‐line object defined a set of known deformation vectors (Eq. 6) recruited to obtain a posterior GP (Eq. 7) over the reference crest‐line object. We employed a zero‐mean prior GP (Eq. 2) with a multi‐scale isotropic Gaussian kernel for generating a GPMM. The multi‐scale Gaussian kernel was defined as (Luthi et al., 2018),
| (8) |
where is the scale, denotes the bandwidth parameter defining the spatial range over which deformations are correlated, and is the identity matrix. The values of the parameters were obtained by trial and error (considering the size of the reference object and permissible magnitudes of its deformations) as .
Using the multi‐scale kernel allowed modeling different scales of deformations needed for registration of different‐scale geometric details (Luthi et al., 2018). To relieve the model from including global translations and rotations, each crest‐line object was already aligned to the reference set of crest line through a partial ordinary Procrustes analysis (Dryden & Mardia, 2016) involving translations and rotations. It is worth mentioning that each deformation field generated by the GPMM model was a smooth vector field and it would deform the entire reference crest‐line object.
The quality of the registrations was visually assessed and it demonstrated high accuracy of fit. In some cases, local discrepancies of relatively moderate orders were observed. To achieve a perfect fit, the registered object (the deformed reference object) was projected onto the target object. The projection was based on finding the closest‐point on the target object.
The non‐rigid registration, morphing the reference crest‐line object onto each target crest‐line object, resulted in fitted crest‐line objects each having 835 pseudo LMs in addition to the end‐point LMs. This established dense correspondence between each pair of the crest‐line objects.
2.4.2. Step 2: Registration of the triangular meshes
To establish dense correspondence across the talar meshes, the randomly selected talar mesh was set as the reference mesh and non‐rigidly registered onto the rest of the meshes. The registration followed the same procedure performed for the registration of the crest‐line objects.
A set of known deformation vectors (from the reference mesh to a target mesh) needed for defining a posterior deformation field was determined based on the established dense correspondence between the reference crest‐line object and the crest‐line object associated with a target mesh. The points of a crest‐line object (of a mesh) defines 835 pseudo LMs and 8 end‐point LMs (end points of the crest lines) on the mesh. Figure 7 demonstrates an instance of the known deformation field directed from the crest‐line LMs of the reference mesh to the crest‐line LMs of a target mesh.
FIGURE 7.
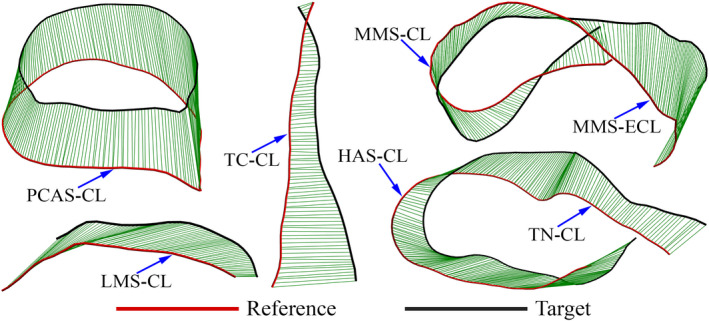
An instance of the known deformation field directed from the crest‐line LMs of the reference mesh to the crest‐line LMs of a target mesh [Colour figure can be viewed at wileyonlinelibrary.com]
Prior to determining the kernel of a GPMM for non‐rigid registration of the meshes, each (target mesh) was rigidly aligned to the reference mesh. The rigid alignment of each mesh used the crest‐line LMs (roughly outlining the global boundaries of the mesh) in partial ordinary Procrustes analysis (Dryden & Mardia, 2016). The rigid alignment brought two meshes close enough so that the non‐rigid registration would dominantly include (local) deformations (of the reference mesh) rather than translations and rotations. The kernel of the GPMM, generating dominantly local deformation fields over the reference mesh, was defined by multiplication of two Gaussian isotropic kernels as,
| (9) |
where denotes element‐wise multiplication, ( .
The quality of each fit was first assessed visually by scrolling through the cross sections of the fitted mesh displayed over the corresponding target mesh. Additionally, the Hausdorff distance (Alt & Scharf, 2008) between a fitted mesh and the corresponding target mesh was obtained. The average Hausdorff distance taken over all the cases was 0.01 ± 0.004 mm. This value was far less than 1 mm being the average size of the triangles.
Non‐rigid registration of the reference mesh onto each talar mesh created a fitted mesh whose nodes were in correspondence with the nodes of the reference mesh. This consequently established a point‐wise correspondence (with nodes as LMs) between each pair of meshes.
To assess the registration in terms of establishing the true biologic/mathematical correspondence, we manually collected 44 LMs on the reference mesh and observed their post‐registration locations on each fitted mesh. It was attempted to use observable salient anatomic features (Turley & Frost, 2013) for locating the LMs.
2.5. Constructing an SSM
An SSM is based on a set of training shapes with known inter‐shape geometric correspondence; here, point‐wise correspondence. By definition, the shape of a geometric object is all the geometrical information modulo location, rotation, scale. We performed full generalized Procrustes analysis (GPA) (Dryden & Mardia, 2016) on the non‐rigidly registered talar meshes (i.e. the fitted meshes), to obtain their shapes as the training shapes in the form of triangular meshes each having N = 17424 nodes. Moreover, the analysis determined the mean shape/mesh of the training shapes (Dryden & Mardia, 2016). As a technical remark, our application of the full GPA did not include normalizing the (centroid) sizes of the meshes, therefore, the size of the resultant mean shape was in the order of the average size of the meshes in the data set.
We constructed a Gaussian PDM‐type SSM of the talus expressed as (Cootes et al., 1995a; Luthi et al., 2018),
| (10) |
where contained the coordinates of the points of a predicted talar shape, and collected the coordinates of the points of the mean shape () of the training talar shapes. Obtained from the principal component analysis (PCA) of the training shape data, the terms and are, respectively, an eigenvalue and its corresponding eigenvector of the covariance matrix of the training data, and t is the number of non‐zero eigenvalues of . The covariance matrix is defined as,
| (11) |
in which denotes the coordinate vector of a training shape, and is the number of the training shapes.
According to the model (Eq. 10), is a deformation mode and quantifies the variance associated with the i‐th deformation mode. The significance of the shape variation produced by a single or collectively by deformation modes is expressed by (Cootes et al., 1995b),
| (12) |
where the denominator is the total variance associated with all modes.
By defining a modal shape parameter (weight) as , associated with the i‐th deformation mode , the vector of the i‐th shape mode can be written as (Cootes et al., 1995a; Dryden & Mardia, 2016),
| (13) |
where is left to vary three‐times of its standard deviation (SD) about its mean, that is, . Since has a Gaussian distribution, this range encompasses nearly hundred percent of the possible values of . The shape modes are sorted from the largest to the smallest variances (significance values).
2.6. Average shape deviation
In order to measure and visualize the deviations of the shapes of the tali from their mean shape, the following average magnitude field of shape deviation (in millimeters) was computed over the domain of the mean shape/mesh ,
| (14) |
where and are, respectively, the coordinate vectors of the i‐th node of the mean shape /mesh and its corresponding node/LM of the j‐th training shape/mesh in the data set. Each was already rigidly aligned onto by full ordinary Procrustes analysis (OPA) (Dryden & Mardia, 2016). The constant is the number of the meshes. In addition to translation and rotation, the full OPA scaled each mesh to reach the closest alignment with the mean mesh.
Moreover, the average shape deviation was relatively expressed by normalizing the average field () as,
| (15) |
where is the centroid size of . The centroid size of a mesh is defined as (Dryden & Mardia, 2016),
| (16) |
in which , and n are respectively the coordinate vector of the i‐th node, the coordinate vector of the centroid, and the number of the nodes of the mesh. Having the unit of length, the centroid size is in fact the root mean square of the distances of the nodes of the mesh from its centroid.
2.7. Inter‐study comparison of mean shapes
As our data set was merely a limited sample of the population, we compared the talar mean shape of this study with few available mean shapes presented by other researchers. By the comparison, we attempted to demonstrate instances of methodological and sample effects on the calculated mean shapes. The mean shapes obtained by the works of Liu et al. (2020), Trovato et al. (2017), and Lenz et al. (2021) were available to us. The data set of our study intersected with the data set used by Liu et al and Trovato et al, however, they utilized different shape registration methods to establish correspondence and obtain the mean shape. Liu et al followed the shape registration method proposed by van de Giessen et al. (2012). Trovato et al attempted to define and find the “best talar shape,” which is the geometry of the talus whose surface had the lowest average deviation from the surface of other tali in the data set. To find the best talar shape, they merely recruited a rigid registration method (iterative closest point method). The data set of the study by Lenz et al was completely different from ours and they used the registration method proposed by Cates et al. (2007).
Using a GPMM followed by full OPA, we registered each mean shape onto our calculated mean shape. Then, the magnitude fields of shape deviation between our mean shape and the other mean shapes were obtained and plotted over the domain of our mean shape. The deviation fields were presented as both percentage of the centroid size of our mean shape and as absolute magnitude in millimeters.
3. RESULTS
3.1. Geometric features and anatomic novelties in talar samples
The detected (type‐A and type‐B) crest lines of four instances of talar meshes are demonstrated in Figure 8. Color maps of the mean curvatures providing clear visualization of the concave (cold colors) and convex (warm colors) areas of the tali are also depicted on the surfaces. The results clearly indicated that the curvature‐based geometric features (crest lines, concave, and convex areas) appeared differently in (class of) shape and local occurrence. We interpreted a geometric feature as an anatomic novelty when its shape or its occurrence could not be traced on different tali. For clarification, some instances of regions containing noticeable anatomic novelties are as follows.
The medial crest line of the talar neck. As indicated by an arrow(s) in Figure 8 medial view, the crest line is broken and missing parts in talar samples A, C, and D.
The inferior crest line of the LMS. The lateral view in Figure 8 shows that this crest line, denoted by an arrow(s), loses parts in tali B, C, and D due to interference with concave regions.
Anterior CAS of the talar head and middle CAS of the talar neck. The inferior view of talus A in Figure 8 shows that the anterior CAS and HAS are fused into a whole surface (arrow), while these two surfaces (pointed by arrows) are separated by a crest line (of a ridge) in the other tali.
PMT (marked by a dashed ellipse). The inferior view of the tali in Figure 8 shows that PMT of talus D can have a different class (type) of shape compared with the PMT of the other tali.
FIGURE 8.
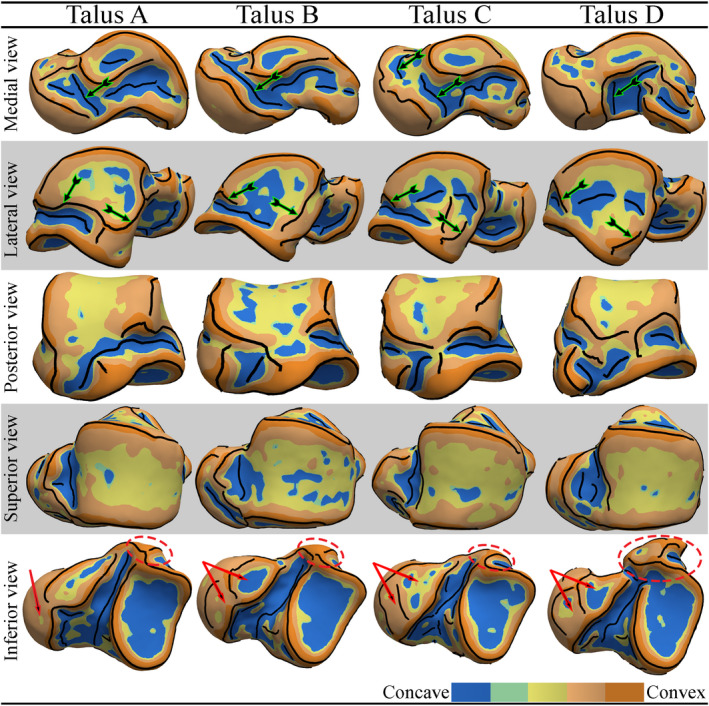
The detected (type‐A and type‐B) crest lines and color maps of the mean curvatures of four instances of talar meshes [Colour figure can be viewed at wileyonlinelibrary.com]
3.2. Assessing the true correspondence
The 44 manually selected LMs on the reference surface and their corresponding LMs on a fitted surface are demonstrated in Figure 9. Two LMs with the same color are in correspondence (supplemental material Sec. 3 presents more instances of comparison). Our judgment, through visualization, suggested that the non‐rigid registration produced a perceptually true biologic and/or mathematical correspondence to the extent that could be visually and qualitatively assessed.
FIGURE 9.
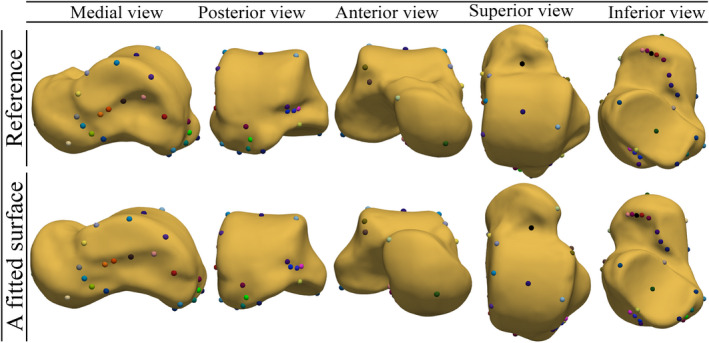
Manually selected LMs on the reference surface (mesh) and their corresponding LMs on a fitted surface. Two LMs with the same color are in correspondence [Colour figure can be viewed at wileyonlinelibrary.com]
3.3. The mean shape
Figure 10 depicts the mean shape of the 49 talar meshes. The crest lines (all types and with no manual gap filling) and the mean curvature map of the mean shape surface were also computed and visualized. Compared with other tali (e.g. instances shown in Figure 8), the mean shape contained mild local curvature fluctuations and smoother crest lines with fewer gaps.
FIGURE 10.
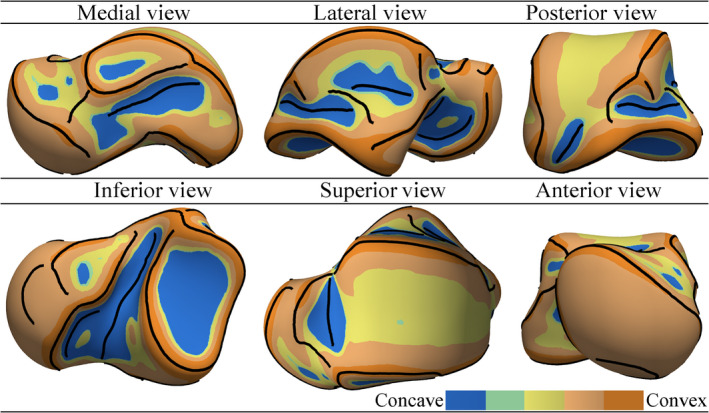
The mean shape of 49 talar meshes [Colour figure can be viewed at wileyonlinelibrary.com]
3.4. Shape modes
The PCA‐based SSM contained 48 shape modes (as defined by Eq. 13). The first seven shape modes plus the 10th mode are demonstrated in Figure 11. For each mode, two limits of the deformed mean shape are demonstrated. The parameters of the limit shapes are equal to and of the values of modal shape parameters. Calculated by Eq. 12 and expressed in percentage, the significance of each mode is also shown beside each mode.
FIGURE 11.
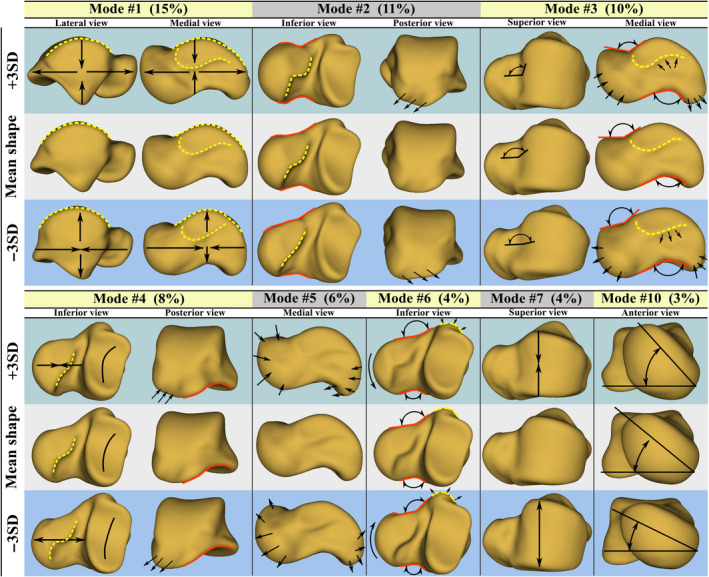
Shape modes of the talus. The number between the parentheses denotes the significance of each mode [Colour figure can be viewed at wileyonlinelibrary.com]
The first seven modes described 58% of the total shape variation of the talus. Other modes, not demonstrated here, individually described relatively localized shape variations gaining less than 4% of significance of a mode. Exceptionally, we illustrated the 10th mode describing lateral/medial rotation of the talar head. The depicted modes were described as follows.
Mode 1: overall ovalization/spherization of the talus through elongation/contraction of the length and contraction/elongation of the height of the talus.
Mode 2: change in the sphericity of the talar head, and variation in neck‐head transition region including the CAS of the talar neck; the posterior edge of the CAS demonstrated a significant deformation. Additionally, the posterior process medially/laterally deformed in this mode.
Mode 3: change in the inclination angle of the talar neck, and local shape changes in PMT and MMS.
Mode 4: variation in the overall curvature of PCAS and the length of the talar neck (the deeper the articular surface the shorter the neck). The shape of the posterior edge of the CAS also experienced deformation.
Mode 5: simultaneous local expansion/contraction of the talar head and posterior process regions.
Mode 6: concurrent lateral/medial bending of the talar neck and local contraction/expansion of PMT.
Mode 7: change in the width of the trochlear surface (along with some local variations in the HAS region).
Mode 10: lateral/medial rotation of the talar head.
3.5. Average magnitude field of shape deviations
Figure 12 shows the deviation fields and (Eqs. 14 and 15) contour‐plotted with different scales on the mean shape/mesh. The values of and are expressed in millimeters and percentage respectively. The results showed that the average deviations of the talar shapes from their mean shape varied from 0.45 mm to 2.23 mm (i.e. 2–10% of the size of the mean shape). The deviation notably attained smaller magnitudes on the articular surfaces (except at small region of ACAS) in comparison with the deviation magnitudes on non‐articular surfaces, that is, the articular boundary regions and talar processes. This became distinctively observable upon setting a deviation threshold of 1.34 mm or 6% of the size of the mean shape.
FIGURE 12.
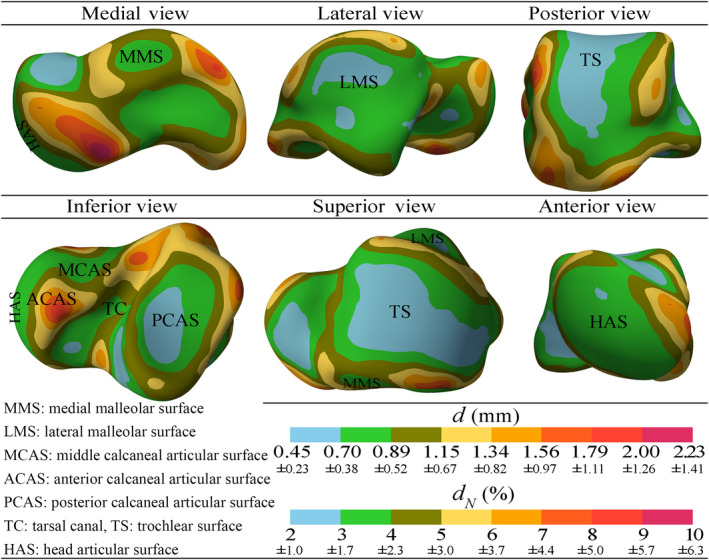
Average magnitude field of shape deviations of the tali from their mean shape [Colour figure can be viewed at wileyonlinelibrary.com]
3.6. Inter‐study comparison of mean shapes
Figure 13 demonstrates the magnitude fields of shape deviations between our mean shape and the best talar shape found by Trovato et al. (2017), and the mean shapes obtained by Liu et al. (2020) and Lenz et al. (2021). The deviation fields indicated that the best talar shape presented by Trovato et al was more deviated from our predicted mean shape than the mean shapes predicted by Liu et al and Lenz et al. Both mean shapes by Liu et al and Lenz et al demonstrated magnitudes of deviation to be <1.84 mm or 8.2% from our mean shape; particularly the deviations of the articular surfaces were <1.34 mm (6%) and mostly <0.67 mm (3%).
FIGURE 13.
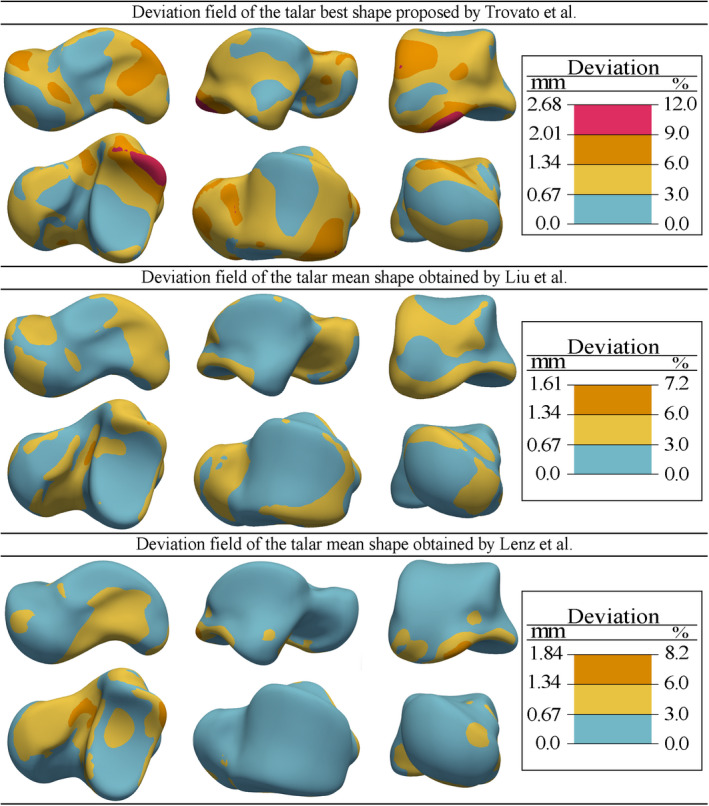
Shape deviations of the best talar shape presented by Trovato et al. (2017), and the mean shapes obtained by Liu et al. (2020) and Lenz et al. (2021) from the mean shape predicted in this study [Colour figure can be viewed at wileyonlinelibrary.com]
4. DISCUSSION
In this study, geometric features in the form of crest lines (ridge and valley lines) were detected on talar surfaces. Our results indicate the repeatability of the crest lines detection for different tali, and therefore, confirm that crest lines can be regarded as anatomic features manifested in the form of ridge and valley lines. Displaying the crest lines and curvature maps of the talar geometries (Figure 8), the results support our initial hypothesis suggesting the existence of anatomic novelties (i.e. anatomic features observable in some tali but not all) in talar shapes. This, in fact, agrees with anatomical observations on cadaveric samples (Kelikian, 2011). For instance, the fusion of the articular surfaces and severe change in the shape of the PMT are also reported in Ref. (Kelikian, 2011).
Appearance of anatomic novelties should raise a caveat regarding studies based on talar homology‐free SSMs in which dense correspondences are automatically established without prior inclusion of known homologous data. To mitigate this potential issue, we, for the first time, proposed the recruitment of classified crest lines (Figure 4) whose inter‐sample correspondence provided a (true) feature‐to‐feature correspondence between the samples. The prior inclusion of the crest‐line correspondence (using a GPMM) in the process of establishing a dense point‐wise correspondence between the talar meshes successfully led to a correspondence that could perceptually represent the true correspondence as per our visual assessments (Figure 9 and supplemental material Sec. 3). We should emphasize that the fidelity of visual assessments of the true correspondence can be argued; particularly where there is no conspicuous biological (type‐I) LMs or other loci, for example, crest lines, and where there exist local anatomic novelties. However, as inevitably followed in this study, the approximate and qualitative assessments of the correspondence regarding the selected LMs suggest that the established correspondence is reasonably consistent with visible geometric features of the talar surfaces.
Having established the dense correspondence, we computed the mean shape and the shape modes regarding the talar data set. As expected, averaging the shapes led to geometric regulations in the sense of removing local curvature fluctuations. This in turn resulted in (qualitatively) smoother articular surfaces and peripheral processes.
The shape variations about the mean shape were described by the shape modes. The pattern of the seven modes and the 10th mode, describing more than 60% of the shape variations, could be clearly recognized. The main reason for not reporting other modes was that describing higher modes with relatively small variance was difficult, if not impossible, as they contained rather localized deformations containing noise (mainly due to segmentation and discretization errors).
Shape modes revealed in this study agree in shape with modes reported by other studies on statistical shape variations of the human talus (Lenz et al., 2021; Tümer, Arbabi, et al., 2019; Tümer et al., 2016; Tümer, Vuurberg, et al., 2019). However, the significance values of the modes, hence their relative participations in describing the talar shape variations are different among studies including the present study. For example, Tümer et al reported the rotation of the talar head as the first mode (highest significance) in two different studies (Tümer, Arbabi, et al., 2019; Tümer, Vuurberg, et al., 2019) whereas this shape mode was not reported in another study (Tümer et al., 2016) by the same group. The latter study only reported modes with significance values larger than 5%; therefore, this mode had less significance as seen in the present study (mode 10 with 3% of significance). It is worth mentioning that despite showing a small modal significance, the rotation of the talar head is a realistic biological mode which is clinically observed (Kelikian, 2011). Another example can be the shape mode describing the change in the length of the talus (mode 1 in this study). This mode was accompanied by different significance values in this study and in the works of Tümer, Arbabi, et al. (2019), Tümer et al. (2016), Tümer, Vuurberg and et al., (2019) and study by Lenz et al. (2021).
The diversity in the mode shapes and their significance values in particular, suggests that the talar sample groups involved in different studies have not fully represented the population; most probably due to their limited sizes and the part of the population available for the sampling. The registration methods used in different studies for establishing the geometric correspondence may also affect the mode shapes and the mean shape as well. The significance of this concern needs further investigations; particularly considering the method proposed in this study and the methods recruited by works of Tümer, Arbabi, et al. (2019), Tümer et al. (2016), Tümer, Vuurberg, et al. (2019) and Lenz et al. (2021). Tümer et al and Lenz et al followed probabilistic methods of non‐rigid registration, respectively, proposed by van de Giessen et al. (2012) and Cates et al. (2007, 2017).
One application of an SSM of the talus is to explore the possibility of designing universal talar prostheses having a few different shapes and sizes matching the majority of the population. Compared with custom‐made prostheses (Fang et al., 2018; Ruatti et al., 2017; Taniguchi et al., 2012), the main benefit of the universal prostheses will be reduction in the surgery cost and preoperative waiting time (Bowes et al., 2019). The first choice for the shape template of universal talar prostheses can be the mean shape which is also proposed by other researchers (Liu et al., 2020; Trovato et al., 2017).
Maintaining the joint congruency is the foremost factor determining whether the mean shape of a talar population can be served as a scalable template for universal talar prostheses or not. Our results, demonstrating the average deviation magnitudes of the talar shapes from their mean shape (Figure 12), state that uniform scaling of the mean shape to generate different sizes of the universal prosthesis may introduce some degrees of incongruency between the prosthesis and its correspondent natural talus. However, we can speculate that incongruency due to the shape deviations may be regarded as negligible and amenable when considering the mean shape as the shape template for the universal prostheses.
The first issue that an incongruent prosthesis may cause is difficulty of implantation due to excess (outward) shape deviations from the shape template, that is, the mean shape. Our results showed that generating the geometry of a talus by scaling the mean shape could averagely produce up to 1.34 mm, but mainly <1.15 mm, of shape deviation at the articular surfaces (Figure 12). These values are rather conservative since the predicted shape deviations only included bone‐to‐bone deviations and did not account for the cartilage thickness. Therefore, scaling the mean shape to obtain the geometry of a prosthesis that has no cartilage will leave space of tolerance for excess (outward) shape deviations. Considering the average cartilage thickness of the talus as 1.1 ± 0.18 mm (Millington et al., 2007) and comparing it with the maximum shape deviation of 1.34 mm, we can conclude that the major part of the excess deviations falls within the cartilage thickness and hence reduces to an order of 0.24 mm (on average). This highly mitigates the difficulty of implantation that may arise due to uniform scaling of the mean shape. Shape deviations at non‐articular surfaces may lead to implantation difficulty as well. The results predicted a maximum shape deviation of 2.23 mm on non‐articular regions. Non‐articular shape deviations do not affect the joint congruency and can be locally rectified when designing the shape template for universal prostheses.
Congruency of a prosthesis can also be considered in terms of articular surface curvatures. Therefore, the second concern on generating the geometry of a prosthesis by uniformly scaling the mean shape is maintaining the natural articular curvatures. In this regard, Lenz et al. (2021) used a curvature‐based congruency index and demonstrated that inter‐individual talar shape variations (i.e. deviations) with respect to the mean shape had minimal effect on the joint congruency at the articular surfaces.
Further justifications of our speculation on the congruency of a talar prosthesis was designed by scaling the mean shape needs evidence from clinical practices. To our knowledge, there is no study but only one that implicitly justifies our speculation. In an innovative attempt by Bowes et al. (2019), a shape template for universal talar prostheses was initially chosen based on the work of Trovato et al. (2017) defining the “best talar shape” The defined best talar shape (i.e. the talus that its surface had the lowest average deviation from the surface of other tali under study) can be regarded as an approximation to the mean shape defined in our work. The shape template was then scaled to generate the geometries of ten universal prostheses with different sizes. For a particular patient whose both tali were collapsed, a proper size of the prosthesis was chosen. Then, prior to manufacturing and clinical implantation, geometric modifications had to be made on the geometry of the prosthesis to remove larger peripheral prominences from non‐articular surfaces to facilitate easier insertion. Except the adjustments that had to be made on the non‐articular regions, they did not encounter joint incongruency issues upon obtaining the geometry of the prosthesis by scaling the shape template. This agrees with our speculation stating that a universal prosthesis designed through scaling the mean shape may need local rectification of non‐articular surfaces, and will have minimal and hence negligible incongruency at the articular surfaces.
Although our justification for the viability of the mean shape as a shape template of the universal prostheses is based on our limited data set and the SSM, the inter‐study compression results, shown in Figure 13, suggest that different samples and approaches for obtaining the mean shape can have minimal effect on the resultant mean shape.
The mean shape comparisons (Figure 13) showed that the best talar shape presented by Trovato et al. deviated much more from our mean shape than the mean shapes obtained by Liu et al. and Lenz et al. did. This observation was in fact expected since the best talar shape suggested by Trovato et al was one of the (scaled) tali geometry in the data set rather than being a statistically computed mean shape. Our work and the works by Liu et al. and Lenz et al. established dense correspondences between the talar shapes in their data sets by using three different methods of shape registration. Moreover, our data set intersected with data set in the work of Liu et al., and yet completely differed from the data set of Lenz et al. Despite the differences in the methods and data sets, the mean shapes predicted by Liu et al. and Lenz et al are close to our mean shape by <1.34 mm and 0.67 mm of overall and articular surface deviations respectively.
Although limited, this inter‐study comparison may indicate that talar shapes have relatively small variations about their population mean shape and hence the mean shape can definitely be a promising shape template for universal talar prostheses. This assertion can be further confirmed by SSMs of talar data sets that are large enough to present at least particular target populations.
To this date, there are only few and limited studies investigating the geometry of the talus with the intention of prosthetic design. Our study is another step contributing to this new area although it has some limitations to be considered. As the first limitation, the data set did not contain large number of talar shapes from different target populations. Definitely, using a larger data set would have led to more comprehensive prediction of the mean shape and shape modes. Second, detection of the end points defining the crest‐line landmarks (Figure 4) might depend on parameters of the crest‐line detection algorithm and mesh attributes (e.g. smoothness). Not rejecting this limitation though, based on our sensitivity analysis (e.g. supplemental material Sec. 1) on the detection algorithm, we deduce that this is not a major source of error that can globally affect the mean shape and the mode shapes. Third, our approach contained some manual and subjective steps (i.e. filtering, trimming, and completing crest lines) for setting idealized crest lines on each mesh. This reduced the model preparation speed and might introduce some local error in shape variations.
Detecting and identifying homologous crest lines of the talus can also be extended to other bones with surface irregularities. For instance the calcaneus, pelvis, and femur contain potentially homologous crest lines. By the same method employed for the talus, we detected the crest lines of the aforementioned bones and demonstrated them in supplemental material Sec. 4. In general, crest lines manifest higher order anatomic features when compared with LMs that are merely points. Other than being considered as homologous loci in shape registration and SSMs, they can have pure applications in descriptive anatomical studies as well.
5. CONCLUSIONS
This study demonstrated that the talus has surface complexities in the form of salient crest lines which can be repeatedly detected and utilized as homologous features of tali. As the novelty of this study, we recruited (posterior) GPMMs to incorporate the correspondence data of the crest lines in the process of establishing the correspondence between talar surfaces (meshes). Based on our visual judgment, this approach can conduct the registration method (GPMM) toward establishing the true correspondence.
As a clinically related aspect of this study, the SSM of the talus revealed geometric information that can be beneficial for designing universal talar prostheses. The mean shape of the talar shapes in a data set can be recommended as a scalable shape template for universal talar prostheses.
CONFLICTS OF INTEREST
The authors have no conflicts of interest to report.
AUTHOR CONTRIBUTIONS
SA and BV conceived and designed the study. NJ gave access to CT data and verified the anatomic validity of the data. Geometric computations, statistical modeling, visualization, and drafting the manuscript/figures were performed by BV. Interpretation of the results and critical revision of the article for intellectual content were performed by BV, HTR, HA, and SA. Absolute insight to the clinical application of this study was delivered by NJ. All authors participated in revising the manuscript and approving the final article.
Supporting information
Fig S1‐S6
ACKNOWLEDGMENTS
We gratefully thank Marcel Lüthi (department of mathematics and computer science, university of Basel, Switzerland) for generously providing substantial help with understanding GPMMs and the API of Scalismo.
Vafaeian, B. , Riahi, H.T. , Amoushahi, H. , Jomha, N.M. & Adeeb, S. (2022) A feature‐based statistical shape model for geometric analysis of the human talus and development of universal talar prostheses. Journal of Anatomy, 240, 305–322. 10.1111/joa.13552
Funding information
Financial support to Behzad Vafaeian was through a post‐doctoral research fellowship awarded by the Iranian Center for International Science and Technology Cooperation.
DATA AVAILABILITY STATEMENT
The raw and processed mesh data used in this study and source code regarding feature detection and registration are available from the corresponding author upon reasonable request.
REFERENCES
- Feng, Y. , Bishop, A. , Farley, D. , Mitchell, J. , Noonan, K. , Qian, X. et al. (2018) Statistical shape modelling to analyse the talus in paediatric clubfoot. Lecture Notes in Bioengineering, January, 235–243. 10.1007/978-3-319-59764-5_29 [DOI] [PubMed] [Google Scholar]
- Alt, H. & Scharf, L. (2008) Computing the Hausdorff distance between curved objects. International Journal of Computational Geometry and Applications, 18(4), 307–320. 10.1142/S0218195908002647 [DOI] [Google Scholar]
- Ando, Y. , Yasui, T. , Isawa, K. , Tanaka, S. , Tanaka, Y. & Takakura, Y. (2016) Total talar replacement for idiopathic necrosis of the talus: A case report. The Journal of Foot and Ankle Surgery: Official Publication of the American College of Foot and Ankle Surgeons, 55(6), 1292–1296. 10.1053/j.jfas.2015.07.015 [DOI] [PubMed] [Google Scholar]
- Angthong, C. (2014) Anatomic total talar prosthesis replacement surgery and ankle arthroplasty: An early case series in Thailand. Orthopedic Reviews, 6(3), 5486. 10.4081/or.2014.5486 [DOI] [PMC free article] [PubMed] [Google Scholar]
- Bookstein, F.L. (1991) Morphometric tools for landmark data: Geometry and biology. Cambridge University Press. [Google Scholar]
- Bowes, J. , Adeeb, S. , Grosvenor, A. , Beaupre, L. & Jomha, N.M. (2019) Development and implantation of a universal talar prosthesis. Frontiers in Surgery, 6(November), 1–7. 10.3389/fsurg.2019.00063 [DOI] [PMC free article] [PubMed] [Google Scholar]
- Brockett, C.L. & Chapman, G.J. (2016) Biomechanics of the ankle. Orthopaedics and Trauma, 30(3), 232–238. 10.1016/j.mporth.2016.04.015 [DOI] [PMC free article] [PubMed] [Google Scholar]
- Campen, M. , Bommes, D. & Kobbelt, L. (2012) Dual loops meshing: Quality quad layouts on manifolds. ACM Transactions on Graphics, 31(4), 10.1145/2185520.2185606 [DOI] [Google Scholar]
- Cates, J. , Elhabian, S. & Whitaker, R. (2017) Shapeworks: particle‐based shape correspondence and visualization software. Statistical Shape and Deformation Analysis. Academic Press, 257–298. 10.1016/B978-0-12-810493-4.00021-3 [DOI] [Google Scholar]
- Cates, J. , Fletcher, P.T. , Styner, M. , Shenton, M. & Whitaker, R. (2007) Shape modeling and analysis with entropy‐based particle systems. Information Processing in Medical Imaging, 20, 333–345). [DOI] [PMC free article] [PubMed] [Google Scholar]
- Chui, H. , Rangarajan, A. , Zhang, J. & Leonard, C.M. (2004) Unsupervised learning of an atlas from unlabeled point‐sets. IEEE Transactions on Pattern Analysis and Machine Intelligence, 26(2), 160–172. 10.1109/TPAMI.2004.1262178 [DOI] [PubMed] [Google Scholar]
- Cooke, S.B. & Terhune, C.E. (2015) Form, function, and geometric morphometrics. Anatomical Record, 298(1), 5–28. 10.1002/ar.23065 [DOI] [PubMed] [Google Scholar]
- Cootes, T.F. , Taylor, C.J. , Cooper, D.H. & Graham, J. (1995a) Computer vision and image understanding active shape models—Their training and application. Computer Vision and Image Understanding, 61(1), 38–59. [Google Scholar]
- Cootes, T.F. , Taylor, C.J. , Cooper, D.H. & Graham, J. (1995b) Active shape models—Their training and application. Computer Vision and Image Understanding, 61(1), 38–59. 10.1006/cviu.1995.1004 [DOI] [Google Scholar]
- Dryden, I.L. & Mardia, K.V. (2016) Statistical shape analysis with applications in R (2nd edition). John Wiley and Sons Ltd Registered. [Google Scholar]
- Fang, X. , Liu, H. , Xiong, Y. , Zhang, W. , Luo, Y. , Wu, F. et al. (2018) Total talar replacement with a novel 3D printed modular prosthesis for tumors. Therapeutics and Clinical Risk Management, 14, 1897–1905. 10.2147/TCRM.S172442 [DOI] [PMC free article] [PubMed] [Google Scholar]
- Gonzalez, P.N. , Barbeito‐Andrés, J. , D’Addona, L.A. , Bernal, V. & Perez, S.I. (2016) Technical note: Performance of semi and fully automated approaches for registration of 3D surface coordinates in geometric morphometric studies. American Journal of Physical Anthropology, 160(1), 169–178. 10.1002/ajpa.22934 [DOI] [PubMed] [Google Scholar]
- Gunz, P. & Mitteroecker, P. (2013) Semilandmarks: A method for quantifying curves and surfaces. Hystrix, 24(1), 103–109. 10.4404/hystrix-24.1-6292 [DOI] [Google Scholar]
- Harnroongroj, T. & Harnroongroj, T. (2014) The talar body prosthesis: Results at ten to thirty‐six years of follow‐up. The Journal of Bone and Joint Surgery. American, 96(14), 1211–1218. 10.2106/JBJS.M.00377. [DOI] [PubMed] [Google Scholar]
- Harnroongroj, T. & Vanadurongwan, V. (1997) The talar body prosthesis. The Journal of Bone and Joint Surgery. American Volume, 79(9), 1313–1322. 10.2106/00004623-199709000-00005 [DOI] [PubMed] [Google Scholar]
- Islam, K. , Dobbe, A. , Duke, K. , El‐Rich, M. , Dhillon, S. , Adeeb, S. et al. (2014) Three‐dimensional geometric analysis of the talus for designing talar prosthetics. Proceedings of the Institution of Mechanical Engineers, Part H: Journal of Engineering in Medicine, 228(4), 371–378. 10.1177/0954411914527741. [DOI] [PubMed] [Google Scholar]
- Kanai, T. & Suzuki, H. (2000) Approximate shortest path on a polyhedral surface based on selective refinement of the discrete graph and its applications. Proceedings—Geometric Modeling and Processing 2000: Theory and Applications. pp. 241–250. 10.1109/GMAP.2000.838256 [DOI]
- Kelikian, A.S. (Ed.). (2011) Talus. In Sarrafian’s anatomy of the foot and ankle: Descriptive, topographic, functional (3rd edition, pp. 48–61). LIPPINCOTT WILLIAMS & WILKINS. [Google Scholar]
- Klingenberg, C.P. (2008) Novelty and “homology‐free” morphometrics: What’s in a name? Evolutionary Biology, 35(3), 186–190. 10.1007/s11692-008-9029-4 [DOI] [Google Scholar]
- Knigge, R.P. , Tocheri, M.W. , Orr, C.M. & Mcnulty, K.P. (2015) Three‐dimensional geometric morphometric analysis of talar morphology in extant gorilla taxa from highland and lowland habitats. Anatomical Record, 298(1), 277–290. 10.1002/ar.23069 [DOI] [PubMed] [Google Scholar]
- Lenz, A.L. , Krähenbühl, N. , Peterson, A.C. , Lisonbee, R.J. , Hintermann, B. , Saltzman, C.L. et al. (2021) Statistical shape modeling of the talocrural joint using a hybrid multi‐articulation joint approach. Scientific Reports, 11(1), 7314. 10.1038/s41598-021-86567-7 [DOI] [PMC free article] [PubMed] [Google Scholar]
- Liu, T. , Jomha, N.M. , Adeeb, S. , El‐Rich, M. & Westover, L. (2020) Investigation of the average shape and principal variations of the human talus bone using statistic shape model. Frontiers in Bioengineering and Biotechnology, 8(July), 1–12. 10.3389/fbioe.2020.00656 [DOI] [PMC free article] [PubMed] [Google Scholar]
- Luthi, M. , Gerig, T. , Jud, C. & Vetter, T. (2018) Gaussian process morphable models. IEEE Transactions on Pattern Analysis and Machine Intelligence, 40(8), 1860–1873. 10.1109/TPAMI.2017.2739743 [DOI] [PubMed] [Google Scholar]
- Magnan, B. , Facci, E. & Bartolozzi, P. (2004) Traumatic loss of the talus treated with a talar body prosthesis and total ankle arthroplasty. A case report. The Journal of Bone and Joint Surgery. American Volume, 86(8), 1778–1782. 10.2106/00004623-200408000-00024 [DOI] [PubMed] [Google Scholar]
- Millington, S.A. , Grabner, M. , Wozelka, R. , Anderson, D.D. , Hurwitz, S.R. & Crandall, J.R. (2007) Quantification of ankle articular cartilage topography and thickness using a high resolution stereophotography system. Osteoarthritis and Cartilage, 15(2), 205–211. 10.1016/j.joca.2006.07.008 [DOI] [PubMed] [Google Scholar]
- Paragios, N. , Rousson, M. & Ramesh, V. (2003) Non‐rigid registration using distance functions. Computer Vision and Image Understanding, 89(2–3), 142–165. 10.1016/S1077-3142(03)00010-9 [DOI] [Google Scholar]
- Parr, W.C.H. , Soligo, C. , Smaers, J. , Chatterjee, H.J. , Ruto, A. , Cornish, L. et al. (2014) Three‐dimensional shape variation of talar surface morphology in hominoid primates. Journal of Anatomy, 225(1), 42–59. 10.1111/joa.12195 [DOI] [PMC free article] [PubMed] [Google Scholar]
- Pearce, D.H. , Mongiardi, C.N. , Fornasier, V.L. & Daniels, T.R. (2005) Avascular necrosis of the talus: A pictorial essay. Radiographics, 25(2), 399–410. 10.1148/rg.252045709 [DOI] [PubMed] [Google Scholar]
- Pressley, A. (2010) Elementary differential geometry. Springer London. 10.1007/978-1-84882-891-9 [DOI] [Google Scholar]
- Püschel, T.A. , Gladman, J.T. , Bobe, R. & Sellers, W.I. (2017) The evolution of the platyrrhine talus: A comparative analysis of the phenetic affinities of the Miocene platyrrhines with their modern relatives. Journal of Human Evolution, 111(August), 179–201. 10.1016/j.jhevol.2017.07.015 [DOI] [PMC free article] [PubMed] [Google Scholar]
- Regauer, M. , Lange, M. , Baumbach, S. , Böcker, W. , Polzer, H. , Soldan, K. et al. (2017) Development of an internally braced prosthesis for total talus replacement. World Journal of Orthopaedics, 8(3), 221–228. 10.5312/wjo.v8.i3.221 [DOI] [PMC free article] [PubMed] [Google Scholar]
- Ruatti, S. , Corbet, C. , Boudissa, M. , Kerschbaumer, G. , Milaire, M. , Merloz, P. et al. (2017) Total talar prosthesis replacement after talar extrusion. Journal of Foot and Ankle Surgery, 56(4), 905–909. 10.1053/j.jfas.2017.04.005 [DOI] [PubMed] [Google Scholar]
- Scalismo (0.18). (2020) https://scalismo.org/
- Seki, H. , Ogihara, N. , Kokubo, T. , Suda, Y. , Ishii, K. & Nagura, T. (2019) Visualization and quantification of the degenerative pattern of the talus in unilateral varus ankle osteoarthritis. Scientific Reports, 1–9, 10.1038/s41598-019-53746-6 [DOI] [PMC free article] [PubMed] [Google Scholar]
- Sorrentino, R. , Belcastro, M.G. , Figus, C. , Stephens, N.B. , Turley, K. , Harcourt‐smith, W. et al. (2020) Exploring sexual dimorphism of the modern human talus through geometric morphometric methods. PLoS One, 15(2), 1–17. 10.1371/journal.pone.0229255 [DOI] [PMC free article] [PubMed] [Google Scholar]
- Stevens, B.W. , Dolan, C.M. , Anderson, J.G. & Bukrey, C.D. (2007) Custom talar prosthesis after open talar extrusion in a pediatric patient. Foot & Ankle International, 28(8), 933–938. 10.3113/FAI.2007.0933 [DOI] [PubMed] [Google Scholar]
- Sullivan, C. & Kaszynski, A. (2019) PyVista: 3D plotting and mesh analysis through a streamlined interface for the Visualization Toolkit (VTK). Journal of Open Source Software, 4(37), 1450. 10.21105/joss.01450 [DOI] [Google Scholar]
- Taniguchi, A. , Takakura, Y. , Sugimoto, K. , Hayashi, K. , Ouchi, K. , Kumai, T. et al. (2012) The use of a ceramic talar body prosthesis in patients with aseptic necrosis of the talus. Journal of Bone and Joint Surgery ‐ Series B, 94 B(11), 1529–1533. 10.1302/0301-620X.94B11.29543 [DOI] [PubMed] [Google Scholar]
- Trovato, A. , El‐Rich, M. , Adeeb, S. , Dhillon, S. & Jomha, N. (2017) Geometric analysis of the talus and development of a generic talar prosthetic. Foot and Ankle Surgery, 23(2), 89–94. 10.1016/j.fas.2016.12.002 [DOI] [PubMed] [Google Scholar]
- Tsukamoto, S. , Tanaka, Y. , Maegawa, N. , Shinohara, Y. , Taniguchi, A. , Kumai, T. et al. (2010) Total talar replacement following collapse of the talar body as a complication of total ankle arthroplasty: a case report. The Journal of Bone and Joint Surgery. American, 92(11), 2115–2120. 10.2106/JBJS.I.01005 [DOI] [PubMed] [Google Scholar]
- Tümer, N. , Arbabi, V. , Gielis, W.P. , de Jong, P.A. , Weinans, H. , Tuijthof, G.J.M. et al. (2019) Three‐dimensional analysis of shape variations and symmetry of the fibula, tibia, calcaneus and talus. Journal of Anatomy, 234(1), 132–144. 10.1111/joa.12900 [DOI] [PMC free article] [PubMed] [Google Scholar]
- Tümer, N. , Blankevoort, L. , van de Giessen, M. , Terra, M.P. , de Jong, P.A. , Weinans, H. et al. (2016) Bone shape difference between control and osteochondral defect groups of the ankle joint. Osteoarthritis and Cartilage, 24(12), 2108–2115. 10.1016/j.joca.2016.07.015 [DOI] [PubMed] [Google Scholar]
- Tümer, N. , Vuurberg, G. , Blankevoort, L. , Kerkhoffs, G.M.M.J. , Tuijthof, G.J.M. & Zadpoor, A.A. (2019) Typical shape differences in the subtalar joint bones between subjects with chronic ankle instability and controls. Journal of Orthopaedic Research, 37(9), 1892–1902. 10.1002/jor.24336 [DOI] [PMC free article] [PubMed] [Google Scholar]
- Turley, K. & Frost, S.R. (2013) The shape and presentation of the catarrhine talus: A geometric morphometric analysis. Anatomical Record, 296(6), 877–890. 10.1002/ar.22696 [DOI] [PubMed] [Google Scholar]
- van de Giessen, M. , Vos, F.M. , Grimbergen, C.A. , van Vliet, L.J. & Streekstra, G.J. (2012) An efficient and robust algorithm for parallel groupwise registration of bone surfaces (pp. 164–171). 10.1007/978-3-642-33454-2_21 [DOI] [PubMed] [Google Scholar]
- Webster, M. & Sheets, H.D. (2010) A practical introduction to landmark‐based geometric morphometrics. The Paleontological Society Papers, 16, 163–188. 10.1017/s1089332600001868. [DOI] [Google Scholar]
- Yoshizawa, S. , Belyaev, A. & Seidel, H.P. (2005) Fast and robust detection of crest lines on meshes. ACM Symposium on Solid Modeling and Applications, SM, 227–232, 10.1145/1060244.1060270. [DOI] [Google Scholar]
- Zhuang, Y. , Zou, M. , Carr, N. & Ju, T. (2014) Anisotropic geodesics for live‐wire mesh segmentation. Computer Graphics Forum, 33(7), 111–120. 10.1111/cgf.12479 [DOI] [Google Scholar]
Associated Data
This section collects any data citations, data availability statements, or supplementary materials included in this article.
Supplementary Materials
Fig S1‐S6
Data Availability Statement
The raw and processed mesh data used in this study and source code regarding feature detection and registration are available from the corresponding author upon reasonable request.


