Abstract
Background
Protein kinase membrane associated tyrosine/threonine 1 (PKMYT1) regulates cell cycle and is a part of DNA damage repair (DDR)-related signaling. Recent studies have identified a role for PKMYT1 in tumor immunity and DDR. Thus, we initiated this study aiming to characterize the molecular and immunological portrait of PKMYT1 in cancer.
Methods
Transcriptomic data extrapolated from Genotype-Tissue Expression (GTEx), The Cancer Genome Atlas (TCGA), and Cancer Cell Line Encyclopedia (CCLE) datasets were used to determine the mRNA expression levels of PKMYT1. PKMYT1 mRNA expression status was correlated with patients’ prognosis as well as immune neoantigens, and immune checkpoints in 34 different tumors. The Tumor Immune Estimation Resource (TIMER) dataset was used to analyze immune infiltrating scores.
Results
PKMYT1 mRNA is differentially expressed in common tumors and high expression levels of PKMYT1 mRNA is associated with poor prognosis except for malignant thymoma (THYM). In addition, PKMYT1 mRNA expression was correlated with tumor-infiltrating immune cells particularly in lung squamous cell carcinoma, esophageal carcinoma, THYM, and lung adenocarcinoma. An upregulation of immune checkpoints and neoantigens was observed in tumors with a high PKMYT1 mRNA expression. Data from gene set enrichment analysis (GSEA) revealed that PKMYT1 is involved in tumor immunogenicity, metabolism, and cell cycle progression.
Conclusions
PKMYT1 is differentially expressed in various cancers and exerts an important effect on tumor immunity and progression. The PKMYT1 gene holds the potential as a new potential biomarker. Therefore, further studies are clearly needed to elaborate our findings.
Keywords: Protein kinase membrane associated tyrosine/threonine 1 (PKMYT1), DNA damage repair (DDR), pan-cancer analysis, immunity
Introduction
Cancer is the second leading cause of death worldwide (1) and due to its vast prevalence, there is an urgent need for more effective therapies. Despite great advances in current therapeutic strategies such as surgery, radiotherapy, chemotherapy, targeted therapies and more recently, immunotherapy, the prognosis of tumor patients, such as lung cancer remains poor (2-4). As such, there is an urgent unmet need to further explore underlying molecular mechanisms driving the development of lung cancer and other cancer types, in addition to identifying novel therapeutic regimens. Cancer is a genetic disease where genome instability and gene mutations confer this malignant phenotypes (5). The DNA damage can occur in different ways and it is now well documented that the accumulations of DNA damages can result in genome instability and ultimately tumorigenesis (6,7). Thus, DNA damage repair (DDR) complex prevents accumulations of DNA damages which could keep genome stability. DDR includes signaling pathways or enzymes related to cell cycle arrest, detection of DNA, repair, and replication of DNA (8).
In both normal and malignant cells, DDR is responsible for preventing the accumulations of DNA damages and genome instability; however, in different contexts, diverse effects are respectively exerted (9). In normal cells, DDR can protect cells from carcinogenesis by maintaining genome stability (10), while in malignant cells, DDR-deficient colorectal cancers was reported to be associated with conspicuously infiltrated immune cells especially effector memory T cells, which improved the prognosis of patients (11). Deficient DDR can lead to genetic alterations and further encode mounting pieces of molecules which can be divided into small peptides by the proteasome and loaded to major histocompatibility complexes (MHCs). This ultimately increases the number of neoantigens which have been shown to enhance the immune response to immunotherapy (12,13). Moreover, recent, studies have reported that protein kinase membrane associated tyrosine/threonine 1 (PKMYT1), a regulator of the cell cycle, plays a crucial role in DDR (14).
The PKMYT1 gene belongs to the WEE kinase family that includes PKMYT1, WEE1 G2 Checkpoint Kinase (WEE1), and WEE2 oocyte meiosis inhibiting kinase (WEE1B) (15). It is involved in the regulation of cyclin-dependent kinase 1 (CDK1)-CyclinB1 complex, also known as mitotic-promoting factor (MPF) by phosphorylatingTyr15 and Thr14 (16). This phosphorylation by PKMYT1 could exert inhibited effect on MPF until such time as cells undergo mitosis. As the G2/M phase, PKMYT1 phosphorylation is removed by CDC25C only if DNA damage is undetected and ultimately, the cell cycle continues as normal (17). That is, PKMYT1 could prevent cell cycle progression of cells with DNA damages and may eliminate DNA damages by control the transition of cell cycle. Moreover, as a DDR-related kinase, PKMYT1 also exerts different effects on normal cells and tumor cells (18), and a high PKMYT1 expression has been detected in several tumors, including esophageal carcinoma (ESCA) (19), non-small cell lung cancer (NSCLC) (20), breast cancer (BRCA) (21), gastric cancer (GC) (22), ovarian serous cystadenocarcinoma (OV) (23), kidney renal clear cell carcinoma (RCC) (24), hepatocellular carcinoma (HCC) (25), neuroblastoma (NB) (26). Recently, PKMYT1 was reported to be associated with malignancy especially with prostate adenocarcinoma (PRAD) (27). However, the underlying mechanisms and role of PKMYT1 in tumor immunity and proliferation remain largely elusive and comprehensive analyses of PKMYT1 are urgently needed.
In this study, we analyzed the mRNA expression and the prognostic role of PKMYT1 in common tumors using data of Genotype-Tissue Expression (GTEx) data, The Cancer Genome Atlas (TCGA), and Cancer Cell Line Encyclopedia (CCLE) datasets. In addition, we performed correlation analysis between PKMYT1 mRNA expression and tumor-infiltrating immune cells, immune checkpoints, microsatellite instability (MSI), and tumor mutational burden (TMB) in multiple malignancies. Furthermore, we analyzed gene sets enriched by PKMYT1 upregulated tumors.
We present the following article in accordance with the REMARK reporting checklist (available at https://dx.doi.org/10.21037/tlcr-21-973).
Methods
Data acquisition
We explored data GTEx dataset (https://commonfund.nih.gov/GTEx/) and TCGA database (https://portal.gdc.cancer.gov/) for PKMYT1 mRNA expression status in 31 different types of normal tissues and 34 different tumor types. These two databases have collected mRNA sequencing data of normal and tumor tissues as well as related clinical data, respectively. In addition, the mRNA expression data of cell lines of 21 different tumor types were obtained from the CCLE database (https://portals.broadinstitute.org) The Tumor Immune Estimation Resource (TIMER) dataset was used to calculate cancer immune infiltrating scores to analyze tumor immune infiltration. The study was conducted in accordance with the Declaration of Helsinki (as revised in 2013).
PKMYT1 mRNA expression analysis
Kruskal-Wallis test line analysis was used to compare PKMYT1 mRNA expression in 31 different normal tissues and in 21 different cancer cell lines. An evaluation of PKMYT1 mRNA expression between tumor tissues and normal tissues in TCGA database was performed afterwards. Since the small sample size of normal non-cancerous tissue in the TCGA database, we further explored PKMYT1 mRNA expression on normal tissue using the GTEx database.
Correlation of PKMYT1 mRNA expression with prognosis
To correlate the association of PKMYT1 mRNA expression and prognosis, we used the univariate Cox proportional hazards regression analysis and survival analysis, including disease-free survival (DFS), overall survival (OS) rate, disease-specific survival (DSS), and progression-free survival (PFS). PKMYT1 mRNA expression was splited into high mRNA expression group and low expression group by median expression levels.
Gene set enrichment analyses (GSEA)
We performed GSEA to assess the differentially enriched signaling pathways between PKMYT1 high and low mRNA expression groups. In this part, The Kyoto Encyclopedia of Genes and Genomes database (KEGG; https://www.kegg.jp.) and Hallmark gene set were used. Normalized enrichment score (NES) >1.5, P<0.01, and false discovery rate (FDR) <0.25 were considered significant.
Correlation analysis of PKMYT1 with immune checkpoints and immune neoantigens
Spearman’s rank correlation coefficient was applied to evaluate the correlation between PKMYT1 mRNA expression and 60 common immune-related molecules, including immune activation proteins, immunosuppressive proteins, chemokine, and chemokine receptor proteins. The relation of PKMYT1 mRNA expression level and neoantigens was also analyzed.
Correlation analysis of PKMYT1 with the tumor microenvironment
Based on the RNA-sequencing data obtained from the TCGA database, the Estimation of STromal and Immune cells in MAlignant Tumors using Expression data (ESTIMATE) algorithm (28) was performed to obtain the ImmuneScore, StromalScore, and further ESTIMATEScore. Additionally, Spearman’s rank correlation coefficient was employed to assess the role of PKMYT1 in 6 types of immune cell infiltration, including B cells, CD4+ T cells, CD8+ T cells, neutrophils, macrophages, and dendritic cells (DC).
Correlation analysis of PKMYT1 with TMB and MSI
We performed a correlation analysis of PKMYT1 expression with TMB and microsatellite instability (MSI) using the Pearson correlation coefficient.
Statistical analysis
Data shown in this study were analyzed with R software (version 4.0.2; https://www.R-project.org) and the plots were obtained using the R packages, including limma (29), clusterprofiler (30), survival (31), ggplot2 (32). A P value <0.01 was considered as statistically significant.
Results
PKMYT1 is highly expressed in various malignancies
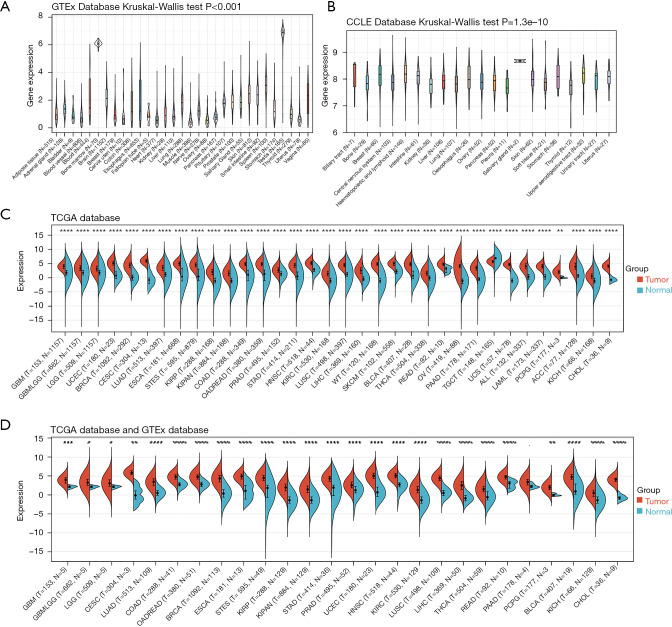
To assess the mRNA expression levels of PKMYT1 in normal non-cancerous and tumor tissues, data from TCGA, GTEx, and CCLE were analyzed. As shown in Figure 1A, PKMYT1 was basically expressed in 31 normal tissues with the highest mRNA expression in testis and the lowest expression rate in muscle. The CCLE analysis demonstrated that PKMYT1 is most highly expressed in the salivary gland (Figure 1B). Because of the small size of matched groups (normal and tumor tissues) solely from the TCGA database (Figure 1C), we further compared the PKMYT1 mRNA expression of tumor tissues from the TCGA database and normal tissues from the GTEx dataset (Figure 1D). Except for testicular germ cell tumors (TGCT), PKMYT1 was more highly expressed in 33 different tumor tissues than in normal tissues. Above results indicated that compared with normal tissues. PKMYT1 was upregulated in almost all solid tumors.
Figure 1.
Differential expression of PKMYT1 in pan-cancer. (A) Expression analysis of PKMYT1 in 31 kinds of normal tissues using data from GTEx database. (B) Expression analysis of PKMYT1 in tumor cell lines of 21kinds of tumors using data from CCLE dataset. (C) Expression analysis of PKMYT1 in matched tumor and normal tissues using data from TCGA database. (D) Expression analysis of PKMYT1 in tumor tissues from TCGA database and matched normal tissues from the GTEx database. *P<0.05, **, P<0.01; ***, P<0.001; ****, P<0.0001. PKMYT1, protein kinase membrane associated tyrosine/threonine 1; GTEx, Data of Genotype-Tissue Expression; CCLE, Cancer Cell Line Encyclopedia; TCGA, The Cancer, Genome Atlas.
The prognostic role of PKMYT1 mRNA expression in cancer
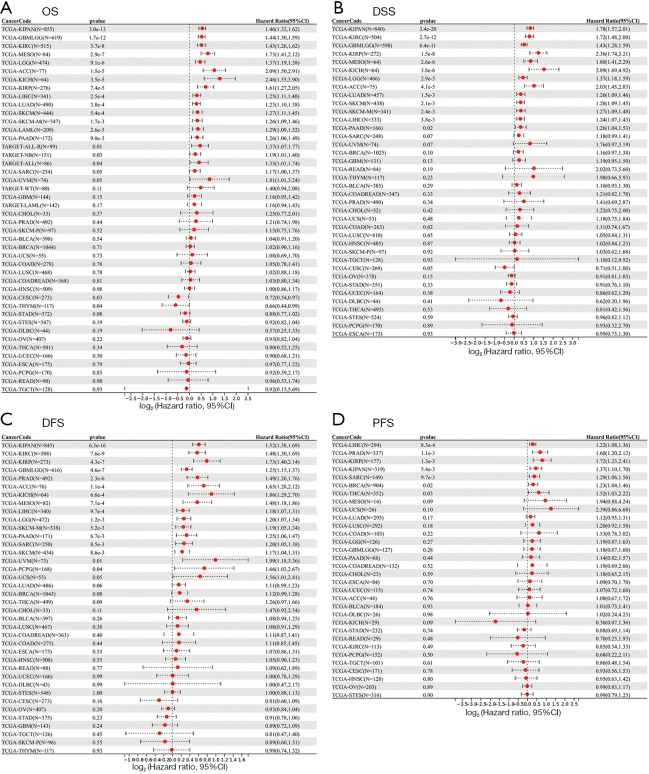
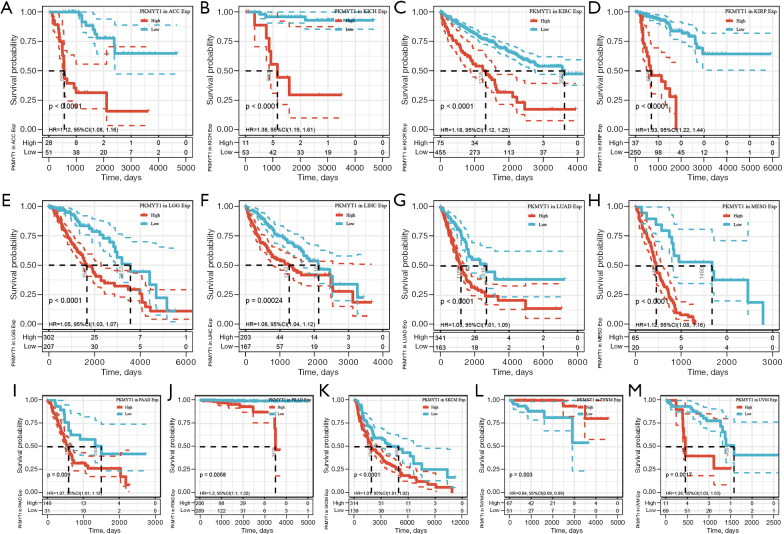
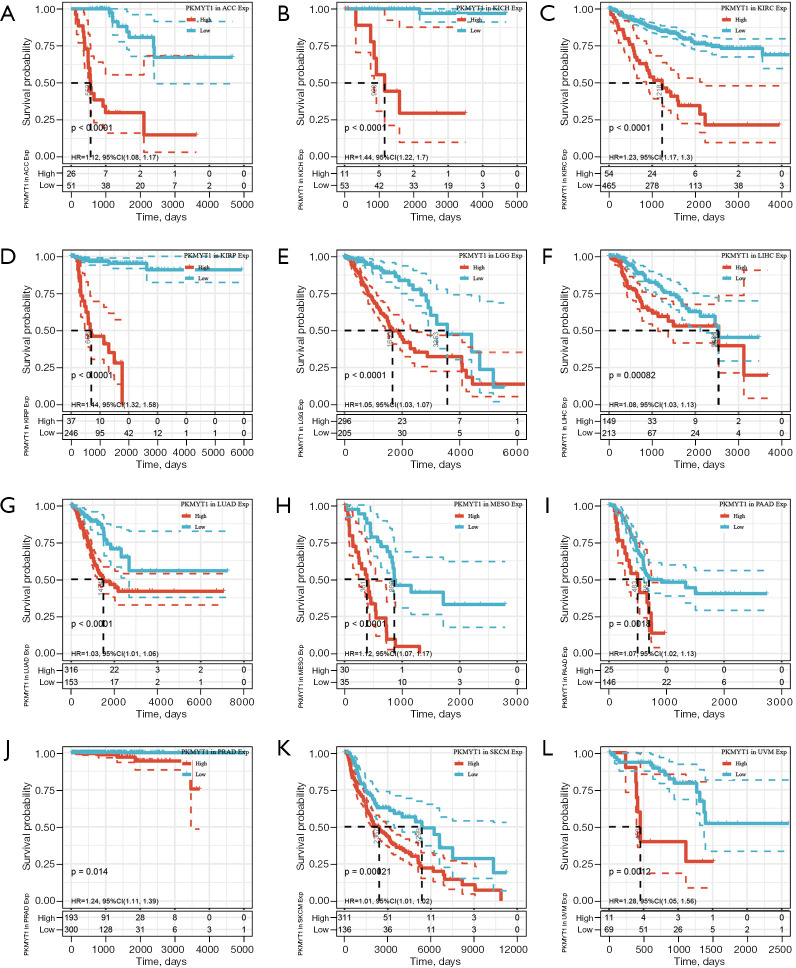
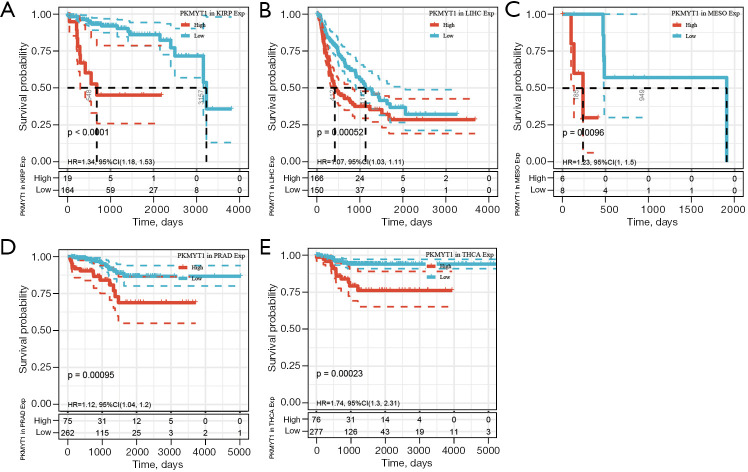
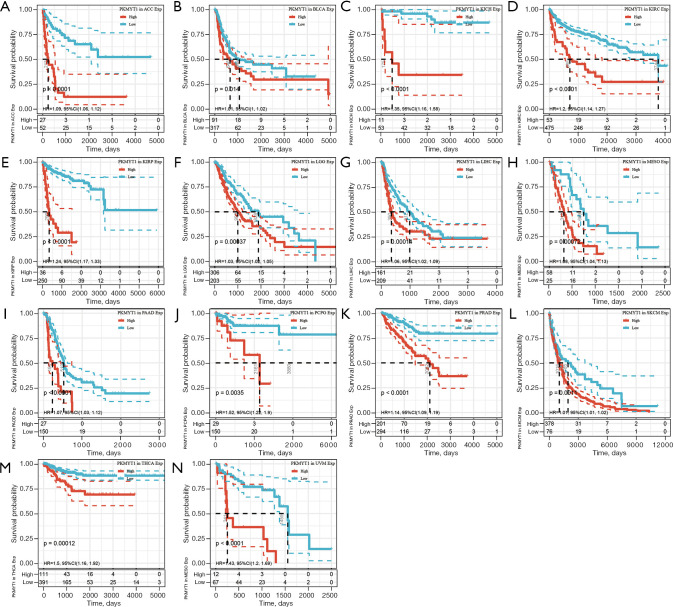
Survival analysis and univariate Cox proportional hazards regression analysis were performed to evaluate the prognostic role of PKMYT1 in different cancers using the data of PKMYT1 mRNA expression levels and associated clinical information. As shown in Figure 2A, results suggested that PKMYT1 mRNA expression was markedly associated with OS in LUAD (P<0.001), KIPAN (P<0.001), glioma (GBMLGG) (P<0.001), kidney renal clear cell carcinoma (KIRC) (P<0.001), mesothelioma (MESO) (P<0.001), lower grade glioma (LGG) (P<0.001), adrenocortical carcinoma (ACC) (P<0.001), kidney chromophobe (KICH) (P<0.001), kidney renal papillary cell carcinoma (KIRP) (P<0.001), liver hepatocellular carcinoma (LIHC) (P<0.001), skin cutaneous melanoma (SKCM) (P<0.001), SKCM-M (P=0.0017), acute myeloid leukemia (LAML) (P=0.0026), and pancreatic adenocarcinoma (PAAD) (P=0.009) (Figure 2A). Similarly, when DSS was examined, PKMYT1 was significantly linked to LUAD (P=0.0015), KIPAN (P<0.001), KIRC (P<0.001), GBMLGG (P<0.001), KIRP (P<0.001), MESO (P<0.001), KICH (P<0.001), LGG (P<0.001), ACC (P<0.001), SKCM (P=0.0021), SKCM-M (P=0.0024), and LIHC (P=0.0038) (Figure 2B). Additionally, the mRNA expression status of PKMYT1 was significantly related with DFS in KIPAN (P<0.001), KIRC (P<0.001), KIRP (P<0.001), GBMLGG (P<0.001), PRAD (P<0.001), ACC (P<0.001), KICH (P<0.001), MESO (P<0.001), LIHC (P<0.001), LGG (P=0.0012), SKCM-M (P=0.0052), PAAD (P=0.0067), SARC (P=0.0085), SKCM (P=0.0086), and UVM (P=0.01) (Figure 2C). We could observe that PKMYT1affects PFS in LIHC (P<0.001), PRAD (P=0.0011), KIRP (P=0.0013), KIPAN (P=0.0054), and sarcoma (SARC) (P=0.0097) (Figure 2D). Furthermore, Kaplan-Meier (KM) curves of PKMYT1 mRNA expression and OS, DSS, DFS and PFS were obtained. In ACC, KICH, KIRC, KIRP, LGG, LIHC, LUAD, MESO, PAAD, PRAD, SKCM, and UVM, a higher PKMYT1 mRNA expression status was related to shorter OS; whereas a higher PKMYT1 mRNA expression was related to longer OS in thymoma (THYM) (Figure 3). DSS analysis was carried out to eliminate the confounding effects of deaths of other reasons and results confirmed that high level of PKMYT1 mRNA expression was associated with inferior outcomes in several tumors same as OS except for THYM (Figure 4). DFS results showed that high PKMYT1 mRNA expression was correlated with poor prognosis in KIRP, LIHC, MESO, PRAD and THCA (Figure 5). A similar correlation was observed between PKMYT1 mRNA expression and PFS (Figure 6).
Figure 2.
Correlation analysis between PKMYT1 expression and OS, DSS, DFS, and PFS across common tumors. (A) Forest plot of associations between PKMYT1 expression and OS; (B) forest plot of associations between PKMYT1 expression and DSS; (C) forest plot of associations between PKMYT1 expression and DFS; (D) forest plot of associations between PKMYT1 expression and PFS. PKMYT1, protein kinase membrane associated tyrosine/threonine 1; OS, overall survival; DSS, disease-specific survival; DFS, disease-free survival; PFS, progression-free survival.
Figure 3.
Kaplan Meier curves of OS in PKMYT1 high and low-expressing tumors in (A) ACC, (B) KICH, (C) KIRC, (D) KIRP, (E) LGG, (F) LIHC, (G) LUAD, (H) MESO, (I) PAAD, (J) PRAD, (K) SKCM, (L) THYM, (M) UVM. KM, Kaplan-Meier; OS, overall survival; PKMYT1, protein kinase membrane associated tyrosine/threonine 1; ACC, adrenocortical carcinoma; KICH, kidney chromophobe; KIRC, kidney renal clear cell carcinoma; KIRP, kidney renal papillary cell carcinoma; LGG, lower grade glioma; LIHC, liver hepatocellular carcinoma; LUAD, lung adenocarcinoma; MESO, mesothelioma; PAAD, pancreatic adenocarcinoma; PRAD, prostate adenocarcinoma; SKCM, skin cutaneous melanoma; THYM, thymoma; UVM, uveal melanoma.
Figure 4.
Kaplan Meier curves of DSS in PKMYT1 high and low-expressing tumors in (A) ACC, (B) KICH, (C) KIRC, (D) KIRP, (E) LGG, (F) LIHC, (G) LUAD, (H) MESO, (I) PAAD, (J) PRAD, (K) SKCM, (L) UVM. KM, Kaplan-Meier; DSS, disease-specific survival; PKMYT1, protein kinase membrane associated tyrosine/threonine 1; ACC, adrenocortical carcinoma; KICH, kidney chromophobe; KIRC, kidney renal clear cell carcinoma; KIRP, kidney renal papillary cell carcinoma; LGG, lower grade glioma; LIHC, liver hepatocellular carcinoma; LUAD, lung adenocarcinoma; MESO, mesothelioma; PAAD, pancreatic adenocarcinoma; PRAD, prostate adenocarcinoma; SKCM, skin cutaneous melanoma; UVM, uveal melanoma.
Figure 5.
Kaplan Meier curves of DFS in PKMYT1 high and low-expressing tumors in (A) KIRP, (B) LIHC, (C) MESO, (D) PRAD, (E)THCA. KM, Kaplan-Meier; DFS, disease-free survival; PKMYT1, protein kinase membrane associated tyrosine/threonine 1; KIRP, kidney renal papillary cell carcinoma; LIHC, liver hepatocellular carcinoma; MESO, mesothelioma; PAAD, pancreatic adenocarcinoma; THCA, thyroid carcinoma.
Figure 6.
Kaplan Meier curves of PFS in PKMYT1 high and low-expressing tumors in (A) ACC, (B) BLCA, (C) KICH, (D) KIRC, (E) KIRP, (F) LGG, (G) LIHC, (H) MESO, (I) PAAD, (J) PCPG, (K) PRAD, (L) SKCM, (M) THCA and (N) UVM. KM, Kaplan-Meier; PFS, progression-free survival; PKMYT1, protein kinase membrane associated tyrosine/threonine 1; ACC, adrenocortical carcinoma; BLCA, bladder urothelial carcinoma; KICH, kidney chromophobe; KIRC, kidney renal clear cell carcinoma; KIRP, kidney renal papillary cell carcinoma; LGG, lower grade glioma; LIHC, liver hepatocellular carcinoma; MESO, mesothelioma; PAAD, pancreatic adenocarcinoma; PRAD, prostate adenocarcinoma; SKCM, skin cutaneous melanoma; THCA, thyroid carcinoma; UVM, uveal melanoma.
Correlation analysis of PKMYT1 mRNA expression and tumor immune infiltration
To evaluate the role of PKMYT1 in the recruitment of tumor-infiltrating immune cells, correlation analysis of PKMYT1 mRNA expression and different types of immune cells was performed. These included B cells, CD4+ T cells, CD8+ T cells, neutrophils, macrophages, and dendritic cells (DC) (20). Our data demonstrated correlations between PKMYT1 mRNA expression levels and infiltration of CD8+ T cells in PRAD (negatively), of DCs in diffuse large B-cell lymphoma (DLBC) (negatively), and of macrophages in cholangiocarcinoma (CHOL) (negatively). A higher PKMYT1 mRNA expression was associated with high CD4+ T cells in KICH. Among thoracic cancers, positive correlations between the infiltration of CD4+ T cells, CD8+ T cells and DCs and PKMYT1 mRNA expression combined with negative correlations of expression level and macrophages were identified in THYM. The expression level of PKMYT1 was negatively correlated with CD8+ T cells and macrophages infiltration in LUSC, B cells and macrophages infiltration in ESCA, and B cells infiltration in LUAD (Figure 7A). To further explore the effect of PKMYT1 on the tumor microenvironment (TME), the association between PKMYT1 mRNA expression and immune score, stromal score, and ESTIMATE score were assessed using the ESTIMATE algorithm (33). Results of the top tumors are shown in Figure 7B. The mRNA expression status of PKMYT1 was negatively correlated with the stromal score in BRCA, LUAD, STES and LUSC (Figure 7B). These results indicate that PKMYT1 may negatively influence immune cells infiltration in the TME.
Figure 7.
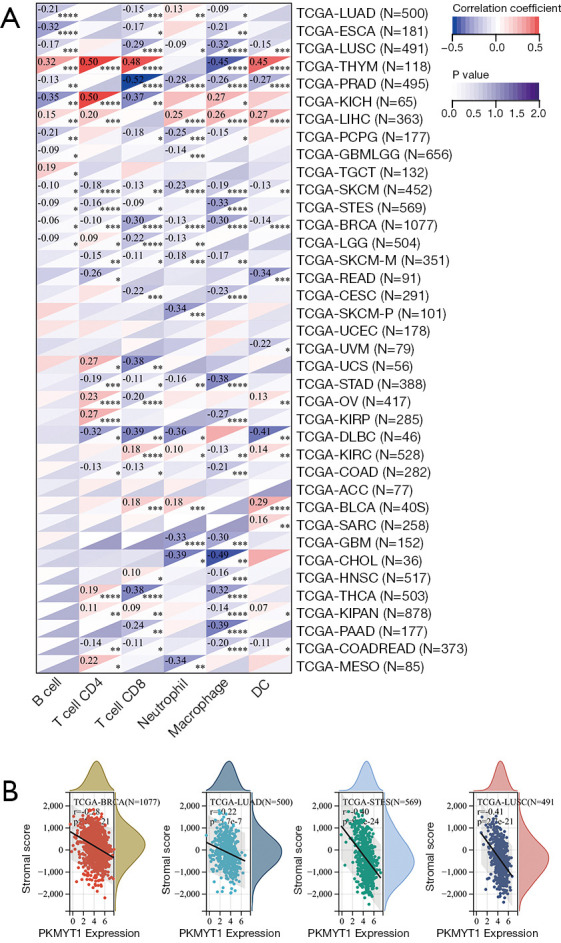
Correlation analysis between PKMYT1 expression and tumor-infiltrating immune cells and tumor microenvironment. (A) Correlation analysis across pan-cancer between PKMYT1 expression and six kinds of immune cells including B cells, CD4+ T cells, CD8+ T cells, neutrophils, macrophages, and DC; (B) representative results of correlation analysis between PKMYT1 expression and stromal score. *, P<0.05; **, P<0.01; ***, P<0.001; ****, P<0.0001. PKMYT1, protein kinase membrane associated tyrosine/threonine 1; DC, dendritic cells.
Correlation analysis of PKMYT1 mRNA expression levels with immune checkpoints and immune neoantigens
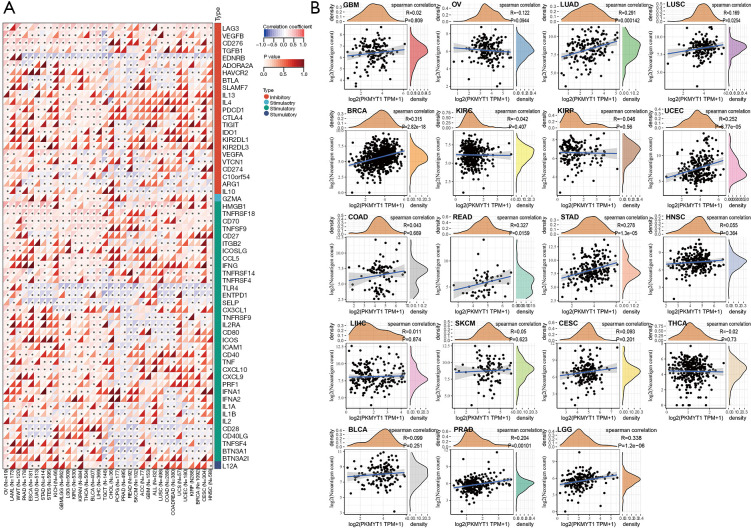
The data presented above highlight a potential role for PKMYT1 in tumor immunity. Based on these findings, further correlation analysis of PKMYT1 mRNA expression was examined in 60 common immune checkpoints across 34 different tumor types. Positive correlations between PKMYT1 and lymphocyte activating 3 (LAG3) was found in 28 tumors, CD276 in 23 tumors, TNF receptor superfamily member 18 (TNFRSF18) in 23 tumors, vascular endothelial growth factor B (VEGFB) in 21 tumors, and CD70 in 20 tumors. Negative correlations were also detected between PKMYT1 and endothelin receptor type B (EDNRB) in 31 tumors, Toll-like receptor 4 (TLR4) in 28 tumors, CD28 in 20 tumors, and CD40 ligand (CD40LG) in 19 tumors. We also found expression of 47/60 immune checkpoints in OV, 35 in bladder urothelial carcinoma (BLCA), and 25 in LUAD which were positively related to PKMYT1, while 40 immune checkpoints in PRAD and 25 in rectum adenocarcinoma (READ) negatively correlated with PKMYT1 mRNA expression (Figure 8A). These findings indicate that PKMYT1 may influence immunity by regulating these specific immune checkpoints. Furthermore, we obtained the number of neoantigens in each cancer type, with results showing positive correlations between PKMYT1 mRNA expression and LUAD, BRCA, UCEC, READ, stomach adenocarcinoma (STAD), LGG, and PRAD (Figure 8B).
Figure 8.
Correlation analysis between PKMYT1 expression and immune checkpoints and neoantigens. (A) Correlation analysis across pan-cancer between PKMYT1 expression and 60 common immune checkpoints; (B) correlation analysis between PKMYT1 expression and number of neoantigens across pan-cancer. PKMYT1, protein kinase membrane associated tyrosine/threonine 1.
Correlation analysis of PKMYT1 mRNA expression levels with TMB and MSI
Next, we analyzed the correlation between PKMYT1 mRNA expression status and TMB and MSI (34). Results revealed that PKMYT1 mRNA was positively associated with MSI-H in STAD, DLBC, KICH, and uterine carcinoma (UCS) (Figure 9A) and positively correlated with TMB-H in ACC, STAD, UCEC, KICH, and LUAD (Figure 9B).
Figure 9.
Correlation analysis between PKMYT1 expression and TMB and MSI. Bubble chart of correlation between PKMYT1 expression and (A) MSI and (B) TMB. PKMYT1, protein kinase membrane associated tyrosine/threonine 1; TMB, tumor mutational burden; MSI, microsatellite instability.
Functional effects of PKMYT1 associated with immunity, metabolism, and proliferation
To better understand the underlying mechanisms of PKMYT1 mRNA expression in tumors, protein-protein interaction (PPI) analysis was carried out (Figure 10A). Using String analysis, PKMYT1 was shown to be largely related to cell cycle proteins, including CCNA1, CCNA2, CCNB1, CCNB2, CDC20, CDC25A, CDC25B, CDC25C, CDK1, and PLK1. PKMYT1 was further stratified into high and low-expressing groups based on the median mRNA expression level. GSEA analysis was then performed in both groups to evaluate the possible biological processes in which PKMYT1 may be involved in tumors. Data show that PKMYT1 is highly expressed in KEGG_CELL_CYCLE (P<0.001), HALLMARK_MYC_TARGETS_V2 (P<0.001), KEGG_MISMATCH_REPAIR (P<0.001), HALLMARK_DNA_REPAIR (P<0.001), thereby identifying a possible role for PKMYT1 in tumor immunity and proliferation (Figure 10B-10E).
Figure 10.
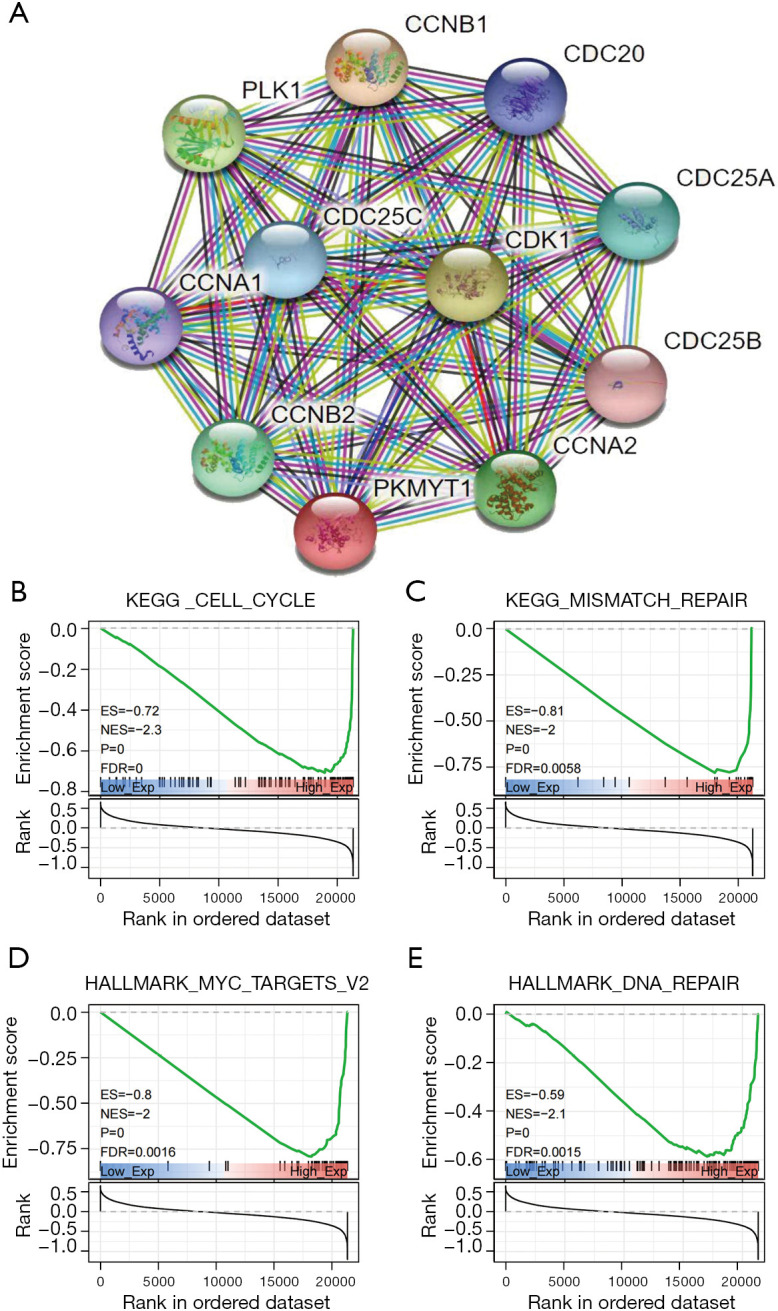
Results of GSEA analysis. (A) PPI analysis of PKMYT. Representative results of KEGG/HALLMARK analysis of PKMYT1; (B) CELL-CYCLE; (C) MISMATCH REPAIR; (D) MYC-TARGETS; (E) DNA REPAIR. GSEA, gene set enrichment analysis; PPI, protein-protein interaction; KEGG, Kyoto Encyclopedia of Genes and Genomes.
Discussion
Cancer is the second leading cause of death globally (1). Thus, there is an urgent need to explore the underlying mechanisms of cancer and seek effective therapeutic approaches. With the advent of precision medicine and immuno therapies, immune checkpoint inhibitor strategies have been approved and demonstrated improved response and survival in subsets of cancer patients (2). However, there remains a significant unmet need for alternative therapies in a larger number of patients with cancer (3). Recently, the application of WEE1/PKMYT1 inhibitors such as adavosertib, in the treatment of solid tumors such as sarcoma, glioma, head & neck and ovarian cancers has gained considerable interest (35).
The MYT1 kinase PKMYT1and WEE1 play a vital role in cell cycle regulation (15). As reported in previous studies, PKMYT1/WEE1 control the G2/M phase transition via phosphorylation of the MPF-CDK1/Cyclin B complex (16). Similar to other DDR-related kinases, if cells entering mitosis have no DNA damages detected, phosphorylation of PKMYT1/WEE1 was eliminated. This function role of PKMYT1/WEE1 is essential for normal cells to control DNA damage during mitosis (tumor-suppressor) and for malignant cells to prevent excessive accumulation of DNA damages (pseudo-oncogene) (18). As WEE1 inhibitors continue to be successful in clinical trials, the application of PKMYT1 inhibitor has come to the fore (36), however, the underlying mechanisms have remained unclear.
We therefore analyzed the mRNA expression of PKMYT1 and prognosis in 34 common tumors. Among normal tissues, PKMYT1 was expressed at the lowest level in testis. Considering the high rate of cell proliferation in testis, high PKMYT1 mRNA expression may be linked to cell cycle regulation and prevention of DNA damages during meiosis (37). Moreover, PKMYT1 mRNA expression in TGCT was lower compared to that in normal testis tissues, of which the underlying mechanisms remain obscure and warrant further study. With the exception of TGCT, the mRNA expression of PKMYT1 was upregulated in all additional 33 other tumors compared to normal tissues. Previous studies have reported high PKMYT1 expression in ESCA (19), NSCLC (20), BRCA (21), GC (22), OV (23), KIRC (24), hepatocellular carcinoma (HCC) (25), NB (26), and PRAD (27), which is in line in part with our findings. Within these studies, PKMYT1 could promote cancer progression by facilitating the growth, migration and epithelial mesenchymal transition (EMT) and elevated PKMYT1 mRNA expression was reported to be related to negative prognostic factors including lymph node metastasis, clinical stage, and differentiation in ESCA (19), NSCLC (20), and PRAD (27). Furthermore, this expression was also associated with relapse in PRAD (27) and triple-negative BRCA (21). Similar to the abovementioned studies, survival analysis in our study determined that upregulated PKMYT1 mRNA expression was correlated to inferior outcomes (OS, DSS, DFS, PFS) in a series of tumors, suggesting a prognostic role for PKMYT1 in cancer.
We then evaluated the role of PKMYT1 in immune cells infiltration and correlation with TME. Heterogeneous cells, including cancer cells, infiltrating immune cells and stromal cells, comprised the TME (5). Immune cells such as effector T cells (including CD8+ cytotoxic T cells and effector CD4+ T cells), natural killer (NK) cells, DCs, macrophages, and B cells infiltrate the TME where they play a role in immunosurveillance and modulation of tumor progression (38). Our results revealed, depending on the tumor entity, a positive/negative correlation of PKMYT1 mRNA expression and immune cells. Interestingly, PKMYT1 mRNA expression was positively related with CD4+ T cells, CD8+ T cells, and DC in THYM, and we suspected that this may account for the significant association of high PKMYT1 mRNA expression with longer OS. Moreover, negative correlations of PKMYT1 mRNA expression and stromal score were observed in LUSC, in line with recent improvements in immune therapies in lung cancer and other cancer types which have been shown to enhance the immune response and eliminate cancer cells (39). Although the role of stromal cells remains uncertain (40,41), our findings indicate the need for further studies to explore the potential of PKMYT1 as a therapeutic target in immune-oncology setting, particularly in LUAD, LUSC, and THYM.
Immune checkpoints, including but not confined to PD-1, PD-L1, CTLA4, and LAG3, are molecules that directly affect the function of immune cells (particularly T cells) and immune response to malignant cells (42). For further understanding the role of PKMYT1 in immune microenvironment, we performed a correlation analysis of PKMYT1 mRNA expression with 60 common immune checkpoints. The expression levels of PKMYT1 were positively related to LAG3, CD276 TNFRSF18 and CD70 in a significant number of tumors. Among these checkpoints: (I) LAG3 was reported to be expressed on activated T cells and exert suppressive effect (43,44); (II) CD276 was recently reported to be involved in T cells inhibition (45); (III) in contrast, CD70 and TNFRSF18 could boost the immune response to cancer (46,47). Conversely, we identified negative correlations of PKMYT1 mRNA expression and a series of immune checkpoints. Among these immune checkpoints: (I) TLR4 was identified as a promoter of innate immunity (48); (II) CD28, an archetypal co-stimulatory molecule, was reported to activate T cells by binding to either CD80 or CD86 (49); (III) CD40LG/CD40 interaction was reported to promote the cross-presentation of antigen to DC and T cells activation (50); (IV) conversely, EDNRB was shown to suppress tumor immune therapy by preventing T cells homing (51,52). Taken together, PKMYT1 may be an immune regulator and targeting PKMYT1 may be an effective therapeutic strategy for enhancing the anti-cancer immune response.
We further performed PPI analysis and GSEA analysis to confirm the role of PKMYT1 in the cell function network. The PKMYT1 protein co-expression network revealed that 10 related proteins all play an important role in cell cycle progression. This conclusion was verified by the results of GSEA analysis. The MYC gene family consists of 3 main members: C-MYC, N-MYC, and L-MYC and is one of the most amplified genes in human tumors (53). Previous studies have reported that MYC mainly acts as a transcription factor and is involved in cell cycle, DNA repair, cell growth, differentiation, apoptosis, angiogenesis, metabolism, protein translation, and immune response (54). In cell cycle, MYC was indicated as a promoter of Cyclin D1, CDK4, and CDK6 in early G1 phase to enhance cell proliferation (10). In addition, in an MYCN amplified neuroblastoma model, PKMYT1 could stabilize MYCN protein by phosphorylating and inhibiting CDK1/Cyclin B complex (26). Taken together, targeting PKMYT1-Myc-CDK may be a novel therapeutic strategy worthy of further confirmation. Moreover, we also found that high PKMYT1 is involved in the positive regulation of DDR and MMR. DDR pathways consisted of cell cycle arrest and replication of DNA and defect in DDR genes could lead to genome instability, carcinogenesis, and tumor growth (55,56). Previous studies have demonstrated that PKMYT1 is a regulator of DDR that may prevent replication of cells with damaged DNA (16). Additionally, in cancer immunotherapy, defects in DDR lead to somatic mutations which may give rise to neoantigens and enhance the effect (13). Considering that the defect in DDR could also improve the effect of radiotherapy and chemotherapy (57) together with our findings that PKMYT1 was positively related to DDR, we propose that targeting PKMYT1-DDR may hold potential as a strategy for improving the effects of immunotherapies.
In conclusion, our study revealed the differential mRNA expression status of PKMYT1 in various malignancies and its potential as a therapeutic and prognostic biomarker. However, there are still limitations to our work. Only bioinformatical analyses of open accessible databases were performed with no further validations available. Thus, further studies are needed to verify our findings.
Supplementary
The article’s supplementary files as
Acknowledgments
The authors appreciate the academic support from the AME Lung Cancer Collaborative Group.
Funding: This work was supported by the National Natural Science Foundation of China (82103508, 81871866, 82173252), Shaanxi Special Support Plan-Program for Leading Talents of Science and Technology Innovation (No. 2019 Special Support Plan), the Natural Science Foundation of Shaanxi Province (2019SF- 033, 2021SF-158) and Project of Tangdu Hospital, the Fourth Military Medical University (No. 2018 Key Talents).
Ethical Statement: The authors are accountable for all aspects of the work in ensuring that questions related to the accuracy or integrity of any part of the work are appropriately investigated and resolved. The study was conducted in accordance with the Declaration of Helsinki (as revised in 2013).
Footnotes
Reporting Checklist: The authors have completed the REMARK reporting checklist. Available at https://dx.doi.org/10.21037/tlcr-21-973
Conflicts of Interest: All authors have completed the ICMJE uniform disclosure form (available at https://dx.doi.org/10.21037/tlcr-21-973). XY serves as an unpaid editorial board member of Translational Lung Cancer Research from July 2021 to June 2023. The other authors have no conflicts of interest to declare.
References
- 1.Siegel RL, Miller KD, Fuchs HE, et al. Cancer Statistics, 2021. CA Cancer J Clin 2021;71:7-33. 10.3322/caac.21654 [DOI] [PubMed] [Google Scholar]
- 2.Duan H, Wang T, Luo Z, et al. Neoadjuvant programmed cell death protein 1 inhibitors combined with chemotherapy in resectable non-small cell lung cancer: an open-label, multicenter, single-arm study. Transl Lung Cancer Res 2021;10:1020-8. 10.21037/tlcr-21-130 [DOI] [PMC free article] [PubMed] [Google Scholar]
- 3.Ancona E, Ruol A, Santi S, et al. Only pathologic complete response to neoadjuvant chemotherapy improves significantly the long term survival of patients with resectable esophageal squamous cell carcinoma: final report of a randomized, controlled trial of preoperative chemotherapy versus surgery alone. Cancer 2001;91:2165-74. [DOI] [PubMed] [Google Scholar]
- 4.Molnar TF, Szipocs A, Szalai Z. Neoadjuvant Crizotinib for ALK Re-arranged NSCLC? J Thorac Oncol 2019;14:574-6. 10.1016/j.jtho.2019.01.004 [DOI] [PubMed] [Google Scholar]
- 5.Hanahan D, Weinberg RA. Hallmarks of cancer: the next generation. Cell 2011;144:646-74. 10.1016/j.cell.2011.02.013 [DOI] [PubMed] [Google Scholar]
- 6.Vassilopoulos A, Tominaga Y, Kim HS, et al. WEE1 murine deficiency induces hyper-activation of APC/C and results in genomic instability and carcinogenesis. Oncogene 2015;34:3023-35. 10.1038/onc.2014.239 [DOI] [PMC free article] [PubMed] [Google Scholar]
- 7.Le DT, Uram JN, Wang H, et al. PD-1 Blockade in Tumors with Mismatch-Repair Deficiency. N Engl J Med 2015;372:2509-20. 10.1056/NEJMoa1500596 [DOI] [PMC free article] [PubMed] [Google Scholar]
- 8.Kang C, Xu Q, Martin TD, et al. The DNA damage response induces inflammation and senescence by inhibiting autophagy of GATA4. Science 2015;349:aaa5612. 10.1126/science.aaa5612 [DOI] [PMC free article] [PubMed] [Google Scholar]
- 9.Curtin NJ. DNA repair dysregulation from cancer driver to therapeutic target. Nat Rev Cancer 2012;12:801-17. 10.1038/nrc3399 [DOI] [PubMed] [Google Scholar]
- 10.Bretones G, Delgado MD, León J. Myc and cell cycle control. Biochim Biophys Acta 2015;1849:506-16. 10.1016/j.bbagrm.2014.03.013 [DOI] [PubMed] [Google Scholar]
- 11.IJsselsteijn ME, Sanz-Pamplona R, Hermitte F, et al. Colorectal cancer: A paradigmatic model for cancer immunology and immunotherapy. Mol Aspects Med 2019;69:123-9. 10.1016/j.mam.2019.05.003 [DOI] [PubMed] [Google Scholar]
- 12.McGranahan N, Furness AJ, Rosenthal R, et al. Clonal neoantigens elicit T cell immunoreactivity and sensitivity to immune checkpoint blockade. Science 2016;351:1463-9. 10.1126/science.aaf1490 [DOI] [PMC free article] [PubMed] [Google Scholar]
- 13.Chan TA, Yarchoan M, Jaffee E, et al. Development of tumor mutation burden as an immunotherapy biomarker: utility for the oncology clinic. Ann Oncol 2019;30:44-56. 10.1093/annonc/mdy495 [DOI] [PMC free article] [PubMed] [Google Scholar]
- 14.Solc P, Schultz RM, Motlik J. Prophase I arrest and progression to metaphase I in mouse oocytes: comparison of resumption of meiosis and recovery from G2-arrest in somatic cells. Mol Hum Reprod 2010;16:654-64. 10.1093/molehr/gaq034 [DOI] [PMC free article] [PubMed] [Google Scholar]
- 15.Schmidt M, Rohe A, Platzer C, et al. Regulation of G2/M Transition by Inhibition of WEE1 and PKMYT1 Kinases. Molecules 2017;22:2045. 10.3390/molecules22122045 [DOI] [PMC free article] [PubMed] [Google Scholar]
- 16.Mueller PR, Coleman TR, Kumagai A, et al. Myt1: a membrane-associated inhibitory kinase that phosphorylates Cdc2 on both threonine-14 and tyrosine-15. Science 1995;270:86-90. 10.1126/science.270.5233.86 [DOI] [PubMed] [Google Scholar]
- 17.Lolli G, Johnson LN. CAK-Cyclin-dependent Activating Kinase: a key kinase in cell cycle control and a target for drugs? Cell Cycle 2005;4:572-7. 10.4161/cc.4.4.1607 [DOI] [PubMed] [Google Scholar]
- 18.Ghelli Luserna di Rorà A, Cerchione C, Martinelli G, et al. A WEE1 family business: regulation of mitosis, cancer progression, and therapeutic target. J Hematol Oncol 2020;13:126. 10.1186/s13045-020-00959-2 [DOI] [PMC free article] [PubMed] [Google Scholar]
- 19.Zhang Q, Zhao X, Zhang C, et al. Overexpressed PKMYT1 promotes tumor progression and associates with poor survival in esophageal squamous cell carcinoma. Cancer Manag Res 2019;11:7813-24. 10.2147/CMAR.S214243 [DOI] [PMC free article] [PubMed] [Google Scholar]
- 20.Sun QS, Luo M, Zhao HM, et al. Overexpression of PKMYT1 indicates the poor prognosis and enhances proliferation and tumorigenesis in non-small cell lung cancer via activation of Notch signal pathway. Eur Rev Med Pharmacol Sci 2019;23:4210-9. [DOI] [PubMed] [Google Scholar]
- 21.Liu Y, Qi J, Dou Z, et al. Systematic expression analysis of WEE family kinases reveals the importance of PKMYT1 in breast carcinogenesis. Cell Prolif 2020;53:e12741. 10.1111/cpr.12741 [DOI] [PMC free article] [PubMed] [Google Scholar]
- 22.Zhang QY, Chen XQ, Liu XC, et al. PKMYT1 Promotes Gastric Cancer Cell Proliferation and Apoptosis Resistance. Onco Targets Ther 2020;13:7747-57. 10.2147/OTT.S255746 [DOI] [PMC free article] [PubMed] [Google Scholar]
- 23.Xuan ZH, Wang HP, Zhang XN, et al. PKMYT1 aggravates the progression of ovarian cancer by targeting SIRT3. Eur Rev Med Pharmacol Sci 2020;24:5259-66. [DOI] [PubMed] [Google Scholar]
- 24.Chen P, Zhang Z, Chen X. Overexpression of PKMYT1 Facilitates Tumor Development and Is Correlated with Poor Prognosis in Clear Cell Renal Cell Carcinoma. Med Sci Monit 2020;26:e926755. 10.12659/MSM.926755 [DOI] [PMC free article] [PubMed] [Google Scholar]
- 25.Liu L, Wu J, Wang S, et al. PKMYT1 promoted the growth and motility of hepatocellular carcinoma cells by activating beta-catenin/TCF signaling. Exp Cell Res 2017;358:209-16. 10.1016/j.yexcr.2017.06.014 [DOI] [PubMed] [Google Scholar]
- 26.Chayka O, D'Acunto CW, Middleton O, et al. Identification and pharmacological inactivation of the MYCN gene network as a therapeutic strategy for neuroblastic tumor cells. J Biol Chem 2015;290:2198-212. 10.1074/jbc.M114.624056 [DOI] [PMC free article] [PubMed] [Google Scholar]
- 27.Wang J, Wang L, Chen S, et al. PKMYT1 is associated with prostate cancer malignancy and may serve as a therapeutic target. Gene 2020;744:144608. 10.1016/j.gene.2020.144608 [DOI] [PubMed] [Google Scholar]
- 28.Yoshihara K, Shahmoradgoli M, Martínez E, et al. Inferring tumour purity and stromal and immune cell admixture from expression data. Nat Commun 2013;4:2612. 10.1038/ncomms3612 [DOI] [PMC free article] [PubMed] [Google Scholar]
- 29.Ritchie ME, Phipson B, Wu D, et al. limma powers differential expression analyses for RNA-sequencing and microarray studies. Nucleic Acids Res 2015;43:e47. 10.1093/nar/gkv007 [DOI] [PMC free article] [PubMed] [Google Scholar]
- 30.Yu G, Wang LG, Han Y, et al. clusterProfiler: an R package for comparing biological themes among gene clusters. OMICS 2012;16:284-7. 10.1089/omi.2011.0118 [DOI] [PMC free article] [PubMed] [Google Scholar]
- 31.Rizvi AA, Karaesmen E, Morgan M, et al. gwasurvivr: an R package for genome-wide survival analysis. Bioinformatics 2019;35:1968-70. 10.1093/bioinformatics/bty920 [DOI] [PMC free article] [PubMed] [Google Scholar]
- 32.Ito K, Murphy D. Application of ggplot2 to Pharmacometric Graphics. CPT Pharmacometrics Syst Pharmacol 2013;2:e79. 10.1038/psp.2013.56 [DOI] [PMC free article] [PubMed] [Google Scholar]
- 33.Mao M, Yu Q, Huang R, et al. Stromal score as a prognostic factor in primary gastric cancer and close association with tumor immune microenvironment. Cancer Med 2020;9:4980-90. 10.1002/cam4.2801 [DOI] [PMC free article] [PubMed] [Google Scholar]
- 34.Wu W, Liu Y, Zeng S, et al. Intratumor heterogeneity: the hidden barrier to immunotherapy against MSI tumors from the perspective of IFN-γ signaling and tumor-infiltrating lymphocytes. J Hematol Oncol 2021;14:160. 10.1186/s13045-021-01166-3 [DOI] [PMC free article] [PubMed] [Google Scholar]
- 35.Lewis CW, Bukhari AB, Xiao EJ, et al. Upregulation of Myt1 Promotes Acquired Resistance of Cancer Cells to Wee1 Inhibition. Cancer Res 2019;79:5971-85. 10.1158/0008-5472.CAN-19-1961 [DOI] [PubMed] [Google Scholar]
- 36.Ghelli Luserna Di Rorà A, Beeharry N, Imbrogno E, et al. Targeting WEE1 to enhance conventional therapies for acute lymphoblastic leukemia. J Hematol Oncol 2018;11:99. 10.1186/s13045-018-0641-1 [DOI] [PMC free article] [PubMed] [Google Scholar]
- 37.Hanna CB, Yao S, Patta MC, et al. WEE2 is an oocyte-specific meiosis inhibitor in rhesus macaque monkeys. Biol Reprod 2010;82:1190-7. 10.1095/biolreprod.109.081984 [DOI] [PMC free article] [PubMed] [Google Scholar]
- 38.Lei X, Lei Y, Li JK, et al. Immune cells within the tumor microenvironment: Biological functions and roles in cancer immunotherapy. Cancer Lett 2020;470:126-33. 10.1016/j.canlet.2019.11.009 [DOI] [PubMed] [Google Scholar]
- 39.Darvin P, Toor SM, Sasidharan Nair V, et al. Immune checkpoint inhibitors: recent progress and potential biomarkers. Exp Mol Med 2018;50:1-11. 10.1038/s12276-018-0191-1 [DOI] [PMC free article] [PubMed] [Google Scholar]
- 40.Zeltz C, Primac I, Erusappan P, et al. Cancer-associated fibroblasts in desmoplastic tumors: emerging role of integrins. Semin Cancer Biol 2020;62:166-81. 10.1016/j.semcancer.2019.08.004 [DOI] [PubMed] [Google Scholar]
- 41.Hessmann E, Buchholz SM, Demir IE, et al. Microenvironmental Determinants of Pancreatic Cancer. Physiol Rev 2020;100:1707-51. 10.1152/physrev.00042.2019 [DOI] [PubMed] [Google Scholar]
- 42.Bernard D, Hansen JD, Du Pasquier L, et al. Costimulatory receptors in jawed vertebrates: conserved CD28, odd CTLA4 and multiple BTLAs. Dev Comp Immunol 2007;31:255-71. 10.1016/j.dci.2006.06.003 [DOI] [PubMed] [Google Scholar]
- 43.Maçon-Lemaître L, Triebel F. The negative regulatory function of the lymphocyte-activation gene-3 co-receptor (CD223) on human T cells. Immunology 2005;115:170-8. 10.1111/j.1365-2567.2005.02145.x [DOI] [PMC free article] [PubMed] [Google Scholar]
- 44.Workman CJ, Dugger KJ, Vignali DA. Cutting edge: molecular analysis of the negative regulatory function of lymphocyte activation gene-3. J Immunol 2002;169:5392-5. 10.4049/jimmunol.169.10.5392 [DOI] [PubMed] [Google Scholar]
- 45.Prasad DV, Nguyen T, Li Z, et al. Murine B7-H3 is a negative regulator of T cells. J Immunol 2004;173:2500-6. 10.4049/jimmunol.173.4.2500 [DOI] [PubMed] [Google Scholar]
- 46.Sanchez PJ, McWilliams JA, Haluszczak C, et al. Combined TLR/CD40 stimulation mediates potent cellular immunity by regulating dendritic cell expression of CD70 in vivo. J Immunol 2007;178:1564-72. 10.4049/jimmunol.178.3.1564 [DOI] [PubMed] [Google Scholar]
- 47.Mei Z, Huang J, Qiao B, et al. Immune checkpoint pathways in immunotherapy for head and neck squamous cell carcinoma. Int J Oral Sci 2020;12:16. 10.1038/s41368-020-0084-8 [DOI] [PMC free article] [PubMed] [Google Scholar]
- 48.Kashani B, Zandi Z, Pourbagheri-Sigaroodi A, et al. The role of toll-like receptor 4 (TLR4) in cancer progression: A possible therapeutic target? J Cell Physiol 2021;236:4121-37. 10.1002/jcp.30166 [DOI] [PubMed] [Google Scholar]
- 49.Rowshanravan B, Halliday N, Sansom DM. CTLA-4: a moving target in immunotherapy. Blood 2018;131:58-67. 10.1182/blood-2017-06-741033 [DOI] [PMC free article] [PubMed] [Google Scholar]
- 50.Elgueta R, Benson MJ, de Vries VC, et al. Molecular mechanism and function of CD40/CD40L engagement in the immune system. Immunol Rev 2009;229:152-72. 10.1111/j.1600-065X.2009.00782.x [DOI] [PMC free article] [PubMed] [Google Scholar]
- 51.Buckanovich RJ, Facciabene A, Kim S, et al. Endothelin B receptor mediates the endothelial barrier to T cell homing to tumors and disables immune therapy. Nat Med 2008;14:28-36. 10.1038/nm1699 [DOI] [PubMed] [Google Scholar]
- 52.Rajeshkumar NV, Rai A, Gulati A. Endothelin B receptor agonist, IRL 1620, enhances the anti-tumor efficacy of paclitaxel in breast tumor rats. Breast Cancer Res Treat 2005;94:237-47. 10.1007/s10549-005-9000-3 [DOI] [PubMed] [Google Scholar]
- 53.Dang CV. MYC on the path to cancer. Cell 2012;149:22-35. 10.1016/j.cell.2012.03.003 [DOI] [PMC free article] [PubMed] [Google Scholar]
- 54.Duffy MJ, O'Grady S, Tang M, et al. MYC as a target for cancer treatment. Cancer Treat Rev 2021;94:102154. 10.1016/j.ctrv.2021.102154 [DOI] [PubMed] [Google Scholar]
- 55.Chabanon RM, Rouanne M, Lord CJ, et al. Targeting the DNA damage response in immuno-oncology: developments and opportunities. Nat Rev Cancer 2021;21:701-17. 10.1038/s41568-021-00386-6 [DOI] [PubMed] [Google Scholar]
- 56.O'Connor MJ. Targeting the DNA Damage Response in Cancer. Mol Cell 2015;60:547-60. 10.1016/j.molcel.2015.10.040 [DOI] [PubMed] [Google Scholar]
- 57.Long HP, Liu JQ, Yu YY, et al. PKMYT1 as a Potential Target to Improve the Radiosensitivity of Lung Adenocarcinoma. Front Genet 2020;11:376. 10.3389/fgene.2020.00376 [DOI] [PMC free article] [PubMed] [Google Scholar]
Associated Data
This section collects any data citations, data availability statements, or supplementary materials included in this article.
Supplementary Materials
The article’s supplementary files as


