

Abstract
The widespread use of magnetic resonance imaging (MRI) in the diagnosis of myopathies has made it possible to clarify the typical MRI pattern of dysferlinopathy. However, sufficient attention has not been given to the variability of MRI patterns in dysferlinopathy.
Materials and methods
Twenty-five patients with the clinical manifestations of dysferlinopathy were examined. For all patients, creatine phosphokinase levels were measured and molecular genetics were examined. In two patients, immunohistochemical examinations of muscle biopsies were performed. MRI scanning was included T2 multi-slice multi-echo, T1 weighted, T2 weighted and Short Tau Inversion Recovery T2 weighted sequences. Quantitative and semi-quantitative evaluations of fatty replacement and swelling of the muscles were undertaken.
Results
Variability in the MRI patterns was lowest in the pelvis and leg muscles and highest in the thigh muscles. Three main types of MRI patterns were distinguished: posterior-dominant (80%), anterior-dominant (16%), and diffuse (4%). Among patients with the anterior-dominant pattern, the collagen-like variant (4%), proximal variant (4%) and pseudo-myositis (8%) were separately distinguished.
Conclusions
Awareness of atypical MRI patterns in dysferlinopathy is important for increasing the efficiency of routine diagnostics and optimizing the search for causative gene mutations.
Key words: dysferlinopathy, LGMDR2, LGMD2B, Miyoshi myopathy, MRI pattern, T2-MSME
Introduction
Dysferlinopathy refers to a phenotypically heterogeneous group of hereditary muscular dystrophies caused by mutations in the DYSF gene (2p13), which encodes the transmembrane protein dysferlin (230 kDa) that is involved in the repair of muscle membranes 1. Five main phenotypes are distinguishable: Miyoshi distal myopathy (OMIM# 254130), limb-girdle muscular dystrophy R2 (LGMD R2, OMIM# 253601); distal myopathy of the anterior lower leg (distal, with anterior tibial onset (DMAT, OMIM# 606768); proximal-distal form (a transitional form), asymptomatic hypercreatinephosphokinasemia 2,3 and congenital phenotype 4.
Increasing the diagnostic efficiency of dysferlinopathy can be achieved through a comprehensive analysis of clinical manifestations, as well as information concerning typical and rare magnetic resonance imaging (MRI) patterns for the distribution of fatty infiltration of muscles. The predominant involvement of the posterior and medial thigh muscle groups, the soleus muscle, and the medial and lateral head of the gastrocnemius has been described in previous publications 5-7. One characteristic of dysferlinopathy is the development of edema prior to fatty replacement in the quadriceps femoris, the adductor magnus, and the posterior muscles of the thigh 8,9. However, there are a limited number of reports suggesting high heterogeneity of MRI patterns in dysferlinopathy 10,11. Hence, a more systematic description of the anatomical distribution of muscle wasting in dysferlinopathy, which has been analyzed in relation to clinical and molecular genetic investigations, would refine our understanding of disease pathology and improve diagnostic ability. Therefore, the purpose of the study was to determine the range of possible variants associated with the MRI patterns of the distribution of fatty infiltration of muscles in a cohort of Russian dysferlinopathy patients.
Materials and methods
Patients
We examined twenty-five patients from a Russian cohort that consisted of twelve Avars, nine Russians, two Azerbaijanis, one Tatar, and one Kalmyk with dysferlinopathy. There were sixteen men 64% (95% Confidence interval (CI) 42-82) and nine women 36% (CI 18-57). Assessments of each patient’s clinical status was carried out using the Vignos scale 12 and Muscular Dystrophy Score (MDS) 13. Manual assessment of muscle strength was measured using the ordinal Medical Research Council (MRC) scale. A control group of twenty healthy volunteers (eleven men 55% (CI 31-76) and nine women 45% (CI 23-68) whose average age was (Me) 31 years (CI 21-40) was also included. All patients signed a voluntary, informed consent form in accordance with the requirements of the 2013 Helsinki Declaration and the local ethics committee of the Military Medical Academy S.M. Kirov (Russia) (protocol # 219, 12/02/2020).
Laboratory studies
The examination of patients included clinical and genealogical analyses, neurological examinations, electromyography, and laboratory diagnostic methods including measurements of serum creatine phosphokinase (CK). Molecular genetic studies of DNA samples were undertaken using next generation sequencing on an Illumina HiSeq 2000 platform (Illumina Inc., San Diego, CA). Confirmation of the results was performed via Sanger sequencing.
Histological and pathomorphological analysis
Open-incision muscle biopsies were performed in three patients for confirming pathogenic of mutations. A fragment (5x5x5 mm) of the lateral part of the quadriceps femoris was taken and prepared according to standard procedure. Longitudinal and transverse sections of the samples were stained with hematoxylin and eosin, and immunohistochemistry was performed using antibodies to dysferlin, dystrophin, smooth muscle alpha actin, Ki67, CD68, CD4, and CD8.
Immunoelectrophoresis and western blotting
Polyacrylamide gel electrophoresis and western blotting were performed as described previously 14. All tissue samples were weighed, frozen and homogenized in 19 volume electrophoresis treatment buffer (e.g., 20 mg + 380 ¼l buffer) and given a loading concentration of approximately 2 mg in 30 ¼l volume 15.
Magnetic resonance imaging of the pelvic girdle and lower extremities
MRI scanning was performed from the anterior, superior, iliac spine to the lower third of the legs on an Ingenia 1.5T tomograph (Philips Healthcare, Eindhoven, Netherlands) using a body surface receiver coil. The protocol included T2-multi-slice multi-echo (T2 MSME), T1 weighted (T1w), T2 weighted (T2w) and Short Tau Inversion Recovery T2 weighted (STIR T2w) pulse sequences. The following are the acquisition parameters for:
T1w spin echo (SE) in the axial and coronal planes: echo time (TE) = 10 ms, repetition time (TR) = 600 ms, number of repetitions = 1, tilt angle = 90°, refocus angle = 120°, field-of-view (FOV) = 450 × 450 mm2, pixel size 0.6 × 0, 6 mm2, number of slices = 30, slice gap = 10 mm, slice thickness = 10 mm;
Axial T2w SE: TE = 80 ms, TR = 500 ms, number of repetitions = 1, tilt angle = 90°, refocus angle = 120°, FOV = 450 × 450 mm2, pixel size 0.6 × 0.6 mm2, number of slices = 30, distance between slices = 10 mm, thickness of slices = 10 mm;
STIR T2w SE in the axial and sagittal planes: TE = 70 ms, TR = 4000 ms, number of repetitions = 1, tilt angle = 90°, refocus angle = 120°, FOV = 450 × 450 mm2, pixel size 0.8 × 0.8 mm2, number of slices = 30, distance between slices = 10 mm, thickness of slices = 10 mm;
T2 MSME in the axial plane: TE in the range from 8 to 160 ms with a delta of 8 ms, TR = 2500 ms, number of repetitions = 1, tilt angle = 90°, refocus angle = 180°, FOV = 400 × 400 mm2, size pixel 0.7 × 0.7 mm2, number of slices = 10, distance between slices = 10 mm, thickness of the slices = 10 mm.
Image analysis
A quantitative assessment was carried out using a three-exponential calculation method with a division into water and fat signals from each muscle, according to the formula 16:
where S (TE) is the signal for a given echo time; TE is the echo time; T2fl is the long relaxation time of the fatty component; T2fs is the short relaxation time of the fat component; T2m is the relaxation time of the water component in the muscle; Af is the coefficient reflecting the proportion of fat in the signal; Am is the coefficient reflecting the proportion of water in the signal; and cl and cs are the long and short coefficients of the bi-exponential fat model, respectively. To calculate the bi-exponential model of the fatty component in skeletal muscles, a separate segmentation of the subcutaneous fat was carried out.
The fat fraction (FF) was calculated as the ratio between the fat signal and the sum of the water and fat signals at TE = 0 ms. Based on the model presented in the above equation, this was determined by the formula:
Mathematical analysis of the data was carried out using Python v.2.7.15 software. Segmentation of the muscles of the thighs and lower legs was performed manually using ITK-SNAP 3.8.0 software 17. Fatty degenerative changes were scored semi-quantitatively according to the Lamminen-Mercuri scale 18.
Statistical analysis
The quantitative results of the study are presented as mean (M) or median (Me) values with 95% confidence intervals (calculated via the Klopper-Pearson method) depending on whether the data were normally distributed. Statistical significance was evaluated using the Mann-Whitney sign-rank test (p < 0.05).
Results
Clinical and genetic data
The age of the patients at the time of the examination was (Me) 37 years (CI 31-43) and average disease duration was 10 years (CI 5-11). Miyoshi myopathy was diagnosed in 11/25 patients 44% (CI 24-65) and was characterized by the primary involvement of the calf muscles (atrophy, difficulty standing in socks, and contracture of the Achilles tendon). The LGMD phenotype was found in 14/25-56% (CI 34-76) of cases, with weakness of the proximal muscles of the lower extremities as the main clinical feature. The level of CK activity was 4547 U/L (CI 1204-8011). The functional status on the MDS was 32 points (CI 22-34), and the functional class according to Vignos was 2. Null homozygous or compound heterozygous mutations were detected in 9/25 – 36% (CI 18-57) of the cases, while in 16/25-64% (CI 42-82) of the cases at least one missense mutation was detected.
Magnetic resonance imaging characteristics of muscle fatty replacement
When assessing the frequency of involvement of the thigh and lower leg muscles in the myodystrophic process, fatty replacements of grade 1 or more was systematically observed in the semimembranosus, semitendinosus, gluteus minimus, tensor fasciae latae, and adductor magnus (100%) muscles in all patients. In these muscles, the highest degree of fatty replacement was most commonly found in the tensor fasciae latae (grade 4, 50%), gluteus minimus (grade 4, 26.4%), and semimembranosus (grade 4, 16.7%). Less often, fatty replacement was present in the gracilis (61.1%), obturator internus (64.7%), and the adductor brevis (66.7%).
In the calves, fatty replacement of grade 1 or higher was present in the soleus (100%), the medial head of the gastrocnemius (97.1%), the lateral head of the gastrocnemius (94.1%), and the peroneus longus (94.1%) muscles. Grade 4 fatty replacement was observed in the soleus (34.3%) and medial head of the gastrocnemius (32.4%) muscles. More rarely, the popliteus muscle was involved (17.6%). Muscles that were more severely affected by fatty replacement included the hamstring and adductor muscles of the thighs (Fig. 1).
Figure 1.
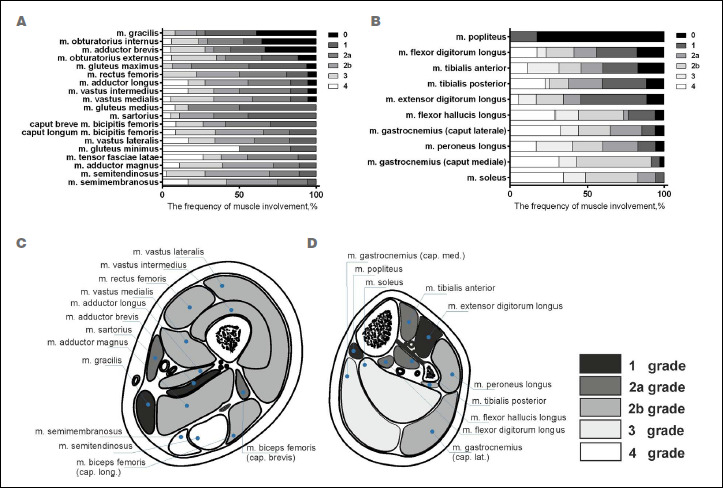
Fatty replacement in the pelvis, thigh, and lower leg muscles of patients with limb-girdle muscular dystrophy recessive type 2, n = 25 (a, thigh muscles; b, lower leg muscles). The fatty degenerative changes were scored according to the Lamminen-Mercuri scale. The colors indicate the grades of the Lamminen-Mercuri scale, presented as a stacked bar chart. Average magnetic resonance imaging distribution pattern of fatty replacement in limb-girdle muscular dystrophy recessive type 2 muscles (scoring according to Lamminen-Mercuri) in the mid thigh (C) and mid calf muscles (D).
In the pelvic muscles, edema was most often observed in the gluteus maximus (48%), obturator externus, gluteus medius, and obturator internus muscles. Maximum edema severity was characteristic in the gluteus maximus and medius muscles and was minimal (and less common) in the muscles that experienced early onset fatty infiltration (i.e., the tensor fasciae latae and gluteus minimus) (Fig. 2).
Figure 2.

The frequency and severity of edema in the muscles of the thighs (A) and lower legs (B) in patients with limb-girdle muscular dystrophy recessive type 2, n = 25.
Patients with LGMD recessive type 2 (R2) presented with edema in most of the thigh muscles, with the exception of the tensor fasciae latae, semitendinosus, and semimembranosus due to earlier and more pronounced fatty infiltrations of these muscles. Edema was most pronounced in the muscles of the anterior thigh group (the rectus femoris and the vastus lateralis, intermedius and medialis), which was quantified by water T2 relaxation time (MSME). Through visual assessment (STIR), edema was also frequently observed in the anterior thigh muscle group including the vastus lateralis (81.5%), intermedius (70.4%), and medialis (59.3%); sartorius (51.9%); long head of the biceps femoris (51.9%); and the gluteus maximus (48.3%). Edema was less frequently observed in the gluteus minimus, tensor fasciae latae (7.4%), semimembranosus, and semitendinosus (11.1%) muscles.
In the lower legs, edema was detected in the popliteus, the flexor hallucis longus, and the extensor digitorum longus muscles. STIR-T2w visual assessment uncovered frequently occurring edema in the extensor digitorum longus (59.3%), tibialis anterior (48.1%), tibialis posterior (37%), and flexor digitorum longus (37%) muscles. Edema was rarely seen in the gastrocnemius (Fig. 2).
The severity and distribution of fatty replacement in the pelvic girdle showed little variability, with the gluteus minimus muscle being the most frequently affected. In the thigh muscles, it was possible to distinguish in this study three main MRI patterns of fatty replacement: posterior dominant; anterior-dominant and diffuse. However, other rarer anterior-dominant presentation, was also observed such as the collagen-like anterior-dominant MRI pattern and the proximal variant. The pseudo-myositis pattern is a separate variant observed at the onset of dysferlinopathy (Tab. I).
Table I.
MRI patterns of dysferlinopathy.
| MRI pattern | Description | Number of cases |
|---|---|---|
| Posterior-dominant | Predominant fatty replacement of posterior thigh muscles | 20/25-80% (CI 59-93) |
| Anterior-dominant | Predominant fatty replacement of the quadriceps femoris muscle | 4/25-16% (CI 5-36) |
| Collagen-like anterior-dominant | Peripheral fatty replacement in the vastus lateralis, medialis and intermedius muscles and a central lesion in the rectus femoris | 1/25-4% (CI 0.1-20) |
| Proximal variant anterior-dominant | Severe damage to the thigh muscles, with minimal involvement of the lower leg muscles | 1/25-4% (CI 0.1-20) |
| Pseudo-myositis | Edema according to STIR without or minimal fat replacement on T1w | 2/25-8% (CI 1-26) |
| Diffuse | Mild / or moderate diffuse infiltration of the anterior and posterior thigh muscle groups equally | 1/25-4% (CI 0.1-20) |
Cases illustrating atypical MRI patterns in dysferlinopathy
Patient 1
A 47-year-old female first manifested the disease at 23 years of age with calf muscle atrophy. This was followed by difficulty in standing on the toes and an inability to run by the age of 25. At 30 years of age she began to notice weakness of the hip muscles when climbing stairs. Muscle strength was reduced in the anterior group of the thigh muscles. Extension of the lower leg was at 3/5 (MRC scale), flexion of the thigh was at 4/5, and in the calf muscles (flexion at the ankle joint) was 4/5. Achilles tendon contractures were observed up to 95°. The phenotype was Miyoshi myopathy at the grade 3 level on the Vignos scale, or 30 points according to the MDS. The CK level was 2573 U/L. A mutation was found in the DYSF c.5884C > T gene; p. (Gln1962*) in the homozygous state.
In the thigh, an atypically predominant involvement of the quadriceps (FF up to 85-90%) was noteworthy when compared with the muscles of the posterior and medial groups (FF of 10-55%) (Fig. 3). The typical preservation of the rectus femoris (60%) compared to the vastus lateralis, medialis and intermedius (FF up to 85-90%) was observed. In the posterior muscle group, the long head of the biceps femoris (FF up to 80%) was more affected than the short head (FF up to 43%), with significant asymmetry (FF up to 45% on the right and 80% on the left). The semimembranosus (FF of 35%) and semitendinosus (FF of 20%) muscles were less affected, and no edema was detected in these muscles. In the leg muscles, a typical pattern was observed with predominant involvement of the soleus and both heads of the gastrocnemius (FF up to 90%) that is characteristic of most dysferlinopathy patients. However, the tibialis anterior (FF up to 86%) was more affected than the peronei (FF up to 40%), which is in contrast to the typical pattern (Fig. 3).
Figure 3.

MRI (T1, Short Tau Inversion Recovery (STIR)) of the muscles of the pelvic girdle, thighs and legs of patient 1 with the Miyoshi phenotype (disease duration 24 years) (T1-weighted (WI) A, B, C; STIR D, E, F).
Patient 2
The disease manifested in a 45-year-old female as the pseudo-metabolic phenotype. Symptoms first began at the age of 22 with swelling of the left leg before each menstrual cycle in combination with weakness of the calf muscles. At 25, she began to notice weakness in the proximal lower extremities when climbing stairs. From the age of 31, her edema was bilateral and lasted 3-7 days per month, and her gait acquired the Trendelenburg sign, and from 43 years of age with moderate steppage gait. Muscle strength was reduced in the distal and proximal muscles of the upper limbs to 4/5 (MRC scale) (hand-grip dynamometry of 8/9 kgf). Strength in the hip flexors decreased to 4/5, while in the muscles of the extensor knee joints it was 2-3/5. In the distal areas of the lower limbs, strength was primarily reduced in the extensors of the feet to 3/5 when compared to the flexors at 4/5. Pronounced atrophy of the calf muscles was observed. The Achilles tendon flexion contracture was 102-114°. The phenotype was Miyoshi and grade 2 on the Vignos scale or 26 points on the MDS. The CK level was 1770 U/L. Mutations in the DYSF gene were detected c. 1116C > A. (p. Ser372Arg) with c.759G > C, (p. Gln253His) and was compound heterozygous.
Among the thigh muscles, there was predominant fatty replacement of the anterior thigh muscle group (up to 80-85%) with less involvement of the rectus femoris (FF up to 75%) compared to the posterior and medial muscle groups (FF of 40-70%), which was uncharacteristic for most patients with LGMDR2. The adductor group was characterized by lesser involvement (FF up to 40%) than the posterior group (FF of 50-70%) and exhibited a number of features, including the earlier involvement of the sartorius (FF of 35% - 2b st.) and an intact and hypertrophic gracilis muscle. One notable feature was the fibrotic changes in the distal semitendinosus muscle (Fig. 4B,E). In the lower leg, the triceps surae was preserved (FF of 85-95%), but the predominance of fatty infiltration in the tibialis anterior (FF of 85%) over the peronei (FF of 30%) was uncharacteristic (Fig. 4C,F).
Figure 4.

MRI pattern of fatty muscle infiltration of the pelvic girdle, thighs and legs of patient 2 (T1-WI A, B, C; Short Tau Inversion Recovery (STIR) D, E, F). Note fibrotic changes in the distal semitendinosus muscle (images B and E, marked with arrows).
Patient 3
This was a 15-year-old male who experienced disease onset at the age of 14 when he began to run more slowly, felt muscle weakness, and reported prolonged recovery after exercise. Muscle strength was slightly reduced in the flexors of the elbow joints 5/5 (MRC scale) and the flexors of the feet 5/5. The extension contractures of the Achilles tendons were 86-87°. The phenotype was Miyoshi and scored a grade 1 on the Vignos scale and 39 points on the MDS. The CK level was 8134 U/L. Mutations found in the DYSF gene were p.200_201delTGinsAT, (p.Val67Asp), in the homozygous state.
When investigating LGMDR2 at an early stage of the disease, it is possible to make a false diagnosis of inflammatory myopathy based on atypical MRI signs, including pronounced asymmetric edema on STIR-T2w images and minimal fatty infiltration in the adductor magnus and soleus muscles on T1-WI images. Such a pattern of early muscle changes in LGMDR2 is designated as pseudo-myositis or pseudo-metabolic 1,19 (Fig. 5).
Figure 5.

MRI pattern of the distribution of fatty infiltration in the muscles of the pelvic girdle, thighs and lower legs in patient 3 with a disease duration of 1 year. (T1-WI A, B, C; Short Tau Inversion Recovery (STIR) D, E, F). Arrows indicate fibrosed muscles.
Patient 4
A 35-year-old female first exhibited signs of the disease at the age of 30 with the development of pulling sensations in the calf muscles. This was followed by the acute development of weakness in the anterior thigh muscle groups and the extensors of the right foot after undergoing L5 radiculopathy. From the age of 31, the patient lost the ability to run and was unable to stand from a deep squat position on her own. Extension in the knee joint was at 3/5, flexion in the knee joint was 4/5 (MRC scale), and hip flexion was 4/5. The Achilles tendon contractures were up to 95°. The phenotype was LGMD, grade 3 on the Vignos scale, and 38 points on the MDS. The CK level was 2091 U/L. Mutations in the c.6313G > A gene DYSF (p.Ala2105Thr) were detected; c.4282C > T (p.Gln1428Ter), and was compound heterozygous.
There was the predominant fatty infiltration of the anterior thigh muscle group relative to the posterior and medial groups. The distribution of fatty replacement in the anterior thigh muscle group was similar to the lesion pattern in congenital muscular dystrophies associated with type VI collagen mutations (target-like sign) (Fig. 6E). This collagen-like MRI pattern has also been described for LGMDR1 as an atypical variant associated with a severe disease course (Fig. 6D). The muscles of the medial and posterior groups exhibited a more pronounced fatty replacement in the right limbs (FF of 45-70% on the right side and 20-40% on the left). The asymmetric muscle involvement is a fairly common feature of LGMD recessive type 2 (R2) and, in this case, was possibly related to predominant loading on the right lower limb due to chronic left radicular pain syndrome (Fig. 6A-C). In the lower legs, the pattern of fatty replacement was classic dysferlinopathy, with asymmetric destruction of the soleus (FF up to 90% - 4 st. on the right and an FF of 15% - 1 st. on the left) and the peronei (FF up to 55% - 2b st. on the right and an FF of 10% - 1 st. on the left).
Figure 6.

Collagen-like MRI pattern of muscle damage in the pelvic girdle, thighs and legs of patient 4, a 35 year old with limb-girdle muscular dystrophy recessive type 2 (LGMDR2) and a disease duration of 5 years (A, B, C). The MRI pattern of fatty replacement in the thigh muscles of a 27-year-old patient with LGMD recessive type 1 (D); and patient B, a 47 year old with congenital Bethlem myopathy (E). T1-WI, weighted; STIR, Short Tau Inversion Recovery.
Patient 5
A 64-year-old female first experienced the disease at the age of 45 with gradually increasing weakness of the thigh muscles. By the age of 55, climbing stairs had become difficult. Muscle strength was reduced in the hip flexors (4 points), the leg flexors (4 points), and the deltoid (4 points). The knee and Achilles reflexes were reduced. The Achilles tendon extensor contracture was up to 98-99°. The phenotype was LGMD, grade 1 on the Vignos scale and 39 points according to the MDS. The CK level was 290 U/L. Compound heterozygote mutations were identified in DYSF c. 6116G > A (p. Arg2039Gln), c. 1692 + 8G > A. A muscle biopsy revealed a cytoplasmic pattern of muscle fiber staining and the absence of dysferlin in individual muscle fibers.
For this patient, who experienced a long course of the disease (9 years) against the background of age-related initial fatty infiltration of most muscles, minimal involvement of all gluteal muscles was observed (FF up to 25%). In the thigh muscles, predominant involvement of the vastus lateralis, medialis and intermedius (up to 35% - 2b) is atypical for most cases of LGMDR2. The rectus femoris was preserved (FF up to 5%) and relatively hypertrophied. The calf muscles presented with a minimal involvement of the soleus (FF up to 30%) with signs of moderate hypertrophy of the medial head of the gastrocnemius (Fig. 7A-C). The diffuse and moderate muscle damage with a late disease onset was probably due to the retention of a certain amount of dysferlin protein expression, which was confirmed by immunohistochemistry and Western blot analysis of a biopsied muscle sample (Fig. 7G-I).
Figure 7.

MRI pattern of fatty replacement distribution in the muscles of the pelvic girdle, thighs and legs of patient 5, a 64-year-old female with a disease duration of 9 years (T1-WI A, B, C; Short Tau Inversion Recovery (STIR)-T2w D, E, F). Immunohistochemical study of muscle biopsy samples from patients 5 (64 years old) and patient 4 (35 years old). Normal membrane dysferlin staining is observable in the vastus lateralis of patient 5 using antibodies to dysferlin (G). Control (H). Western blot analysis showed a low level of dysferlin protein expression in patient 4 and a decrease in expression of more than 60% in patient 5 (I).
Patient 6
A 30-year-old male first experienced disease at the age of 19 when he developed weakness when rising from a sitting position. From the age of 25, there was weakness in the calf muscles. At the age of 27, he began to notice weakness in the proximal and distal parts of the limbs. Muscle strength was reduced in the proximal (4/5 points) and distal segments (hand-grip dynamometry was 12/10 kgf) of the upper limbs. In the lower extremities, reductions were observed for hip flexion (4 points), knee flexion and extension (3 points), and foot extension (4 points). Tendon reflex was reduced in the knee; however, the Achilles reflexes ware normal. Tendon flexion contractures of the Achilles tendons it was 95/93°. The phenotype was LGMD, grade 3 on the Vignos scale and 32 points on the MDS. The CK level was 1930 U/L. Mutations in the DYSF gene were detected c. 1724T > S. (p. Leu757Pro), in the homozygous state.
Substitution of adipose tissue in the muscles of the thighs was typical, with predominant involvement of the posterior muscle group (FF up to 98%). In the quadriceps, the characteristic preservation of the rectus femoris (FF up to 30%) compared with the vastus lateralis, medialis and intermedius muscles (FF of 45-50%) was observed. Damage to the adductor group was atypical, with more pronounced fatty replacement in the adductor longus (FF of 95% - 4 st.) than the adductor magnus (FF of 84% - 2b - 3 st.). In this patient, despite the long course of the disease, minimal diffuse degenerative damage in the lower legs (FF of 10-30% - 1-2a st.) contrasted with the severe fatty replacement of the thigh muscles (Fig. 8).
Figure 8.

MRI pattern of the distribution of fatty infiltration in the muscles of the pelvic girdle, thighs and lower legs of a 30-year-old patient with limb-girdle muscular dystrophy recessive type 2 and a disease duration of 11 years (T1-WI A, B, C, D; Short Tau Inversion Recovery (STIR) E, F, G, H).
Discussion
Previous MRI imaging studies conducted with small patient samples using semi-quantitative T1w sequences have determined the main characteristics of muscle fatty replacement patterns in dysferlinopathy using individual muscle Lamminen-Mercuri grades, grade frequency, and disease progression in the different muscle groups. In the largest study of 182 patients with dysferlinopathy, the idea of a typical MRI pattern and its evolution during disease progression was generalized 5. Therefore, for everyday clinical practice, it is important to describe the entire spectrum of variants observable via MRI patterns of muscle damage in dysferlinopathy.
One of the key MRI features of dysferlinopathy is muscle edema, which often leads to an erroneous diagnosis of inflammatory myopathy 20. Edema of at least two or more muscles identified either qualitatively (STIR) or quantitatively (T2 MSME) was characteristic of all of our patients. Among the pelvic muscles, the most frequent and pronounced diffuse edema (according to STIR) was observed in the gluteus maximus and medius muscles, respectively. Edema was minimal and rare in the tensor fasciae latae and the gluteus minimus, which corresponds with previously reported data 7,11,17. In our patients, most of the thigh muscles were characterized by the presence of edema, with the exception of the semitendinosus and semimembranosus muscles (11.1%). Edema occurred most frequently and was more pronounced in the anterior and medial groups of the thigh muscles including: the vastus lateralis (81.5%), intermedius (70.4%), medialis (59.3%); the sartorius and long head of the biceps femoris (51.9%); and the adductor magnus (46.6%), which is consistent with earlier studies 6,10. Diaz-Manera et al. 17 has noted that edema in the sartorius, gracilis and rectus femoris mainly develop during the late stages of the disease.
Edema was most often observed in the extensor digitorum longus (59.3%), tibialis anterior (48.1%), tibialis posterior (37%), and flexor digitorum longus (37%), while the gastrocnemius was characterized by less swelling. In a relatively small number of cases, it has been shown that, in the early stages of the disease, edema is observable in the soleus and caput mediale m. gastrocnemii and, during the later stages, in the anterior and lateral muscle groups of the lower leg 6,21. In a cohort of Chinese patients, Jin et al. 10 described the MRI pattern of thigh muscle edema in addition to the MRI pattern of fatty infiltration.
By comparing information concerning the MRI features of muscle damage during dysferlinopathy, we can confirm that severe edema occurs in muscles that are characterized by fatty infiltration and increased physical activity at this stage of the disease 17. Therefore, for patients already exhibiting fatty infiltration in the posterior group of thigh muscles, edema in the anterior group will most often be observed and, subsequent to their fat replacement, edema will occur to a greater extent in the gracilis and sartorius muscles. In presymptomatic cases, edema is often detected only in the posterior and medial groups of the thigh muscles, as well as in the medial head of the gastrocnemius. Though muscle edema is usually observed in inflammatory myopathies 22, however it can be present in other genetic muscle disorders such as FacioScapuloHumeral muscular Dystrophy 23, LGMDR12 (already known as LGMD2L) 24 and Pompe disease 25.
With hundreds of dysferlinopathy cases now reported, the most common MRI patterns of muscle involvement have been unambiguously identified. However, insufficient attention has been paid to individual variability in the muscle damage of patients from various socio-ethnic groups. In our sample, no significant lesion variability was uncovered for the muscles of the pelvic girdle. In the calves, muscle damage variability was also minimal and exhibited earlier or simultaneous involvement of the tibialis anterior and posterior muscle groups. This was in contrast to the typical variant, which is predominant in the posterior and lateral groups. A similar type of variability has been described by Illa et al. 3 as a DMAT phenotype.
In our sample, the greatest variability of the lesions was characterized by the thigh muscles, for which three main types of MRI patterns were identified: proximal in 20/25 cases, 80% (range 59-93); anterior-dominant in 4/25 cases, 16% (range 5-36); and diffuse in 1/25 cases, 4% (range 0.1-20). The prevalence of the typical posterior dominant pattern was comparable to the results of Angelini et al. 17 but significantly higher than in a cohort of patients from China (56%) and Germany (40%) despite the absence of differences in gender or age in the compared groups 9,10. Among patients with an anterior-dominant pattern, we distinguished the collagen-like variant, which was has been previously described in patients with congenital collagen VI associated myopathy and in severe LGMDR1 26,27. The diffuse MRI pattern that we identified in one case was much more common among patients in a Chinese cohort (12/57, 23%, range (13-37)) 10. It should be noted that the diffuse nature of the lesions was observable from the onset of the disease, and was not a consequence of pronounced fat replacement during the late stages of dysferlinopathy, as presented by Arrigoni 6 in a quantitative analysis of thigh muscles with equal involvement of the anterior and posterior medial groups. In addition, the rare proximal variant was characterized by gross damage to the thigh muscles, with minimal involvement of the lower leg muscles, which often leads to an erroneous diagnosis of sarcoglycanopathy, Pompe disease, or LGMD type R9.
The pseudo-myositis MRI pattern occurred in 2/25, 8% (range 1-26) patients and was characterized only by the presence of edema according to STIR. There was an absence of muscle atrophy and fatty replacement, which may be a sign of an early stage of the disease. This MRI pattern may correspond to the previously described pseudo-metabolic phenotype 19. The pseudo-metabolic variant was observed in 2% out of 193 patients from different European countries 28.
The relatively small patient sample size can be a limitation of our study. However, the diversity of ethnic groups included in the sample is a positive aspect.
Conclusions
Increasing the efficiency of routine diagnoses of dysferlinopathy using MRI depends not only on knowledge of the typical distribution of fatty infiltration and muscle edema, but also on understanding the sequence of involvement of the muscle groups, as well as taking into account individual variants from MRI patterns.
Ethical consideration
None.
Acknowledgement
None.
Funding
The study was supported by the Ministry of Science and Higher Education of Russia, agreement No. 075-15-2021-1346
Conflict of interest
The Authors declare no conflict of interest.
Author contributions
The Authors have contribuited equally to the work.
Figures and tables
References
- 1.Aoki M, Liu J, Richard I, et al. Genomic organization of the dysferlin gene and novel mutations in Miyoshi myopathy. Neurology 2001;57:271-278. https://doi.org/10.1212/wnl.57.2.271 10.1212/wnl.57.2.271 [DOI] [PubMed] [Google Scholar]
- 2.Okahashi S, Ogawa G, Suzuki M, et al. Asymptomatic sporadic dysferlinopathy presenting with elevation of serum creatine kinase. Typical distribution of muscle involvement shown by MRI but not by CT. Int. Mede (Tokyo, Japan) 2008;47:305-307. https://doi.org/10.2169/internalmedicine.47.0519 10.2169/internalmedicine.47.0519 [DOI] [PubMed] [Google Scholar]
- 3.Illa I, Serrano-Munuera C, Gallardo E, et al. Distal anterior compartment myopathy: a dysferlin mutation causing a new muscular dystrophy phenotype. Ann Neurol 2001;49:130-134. PMID: . [PubMed] [Google Scholar]
- 4.Paradas C, Gonzalez-Quereda L, De Luna N, et al. A new phenotype of dysferlinopathy with congenital onset. Neuromusc Disord 2009;19:21-25. https://doi.org/10.1016/j.nmd.2008.09.015 10.1016/j.nmd.2008.09.015 [DOI] [PubMed] [Google Scholar]
- 5.Diaz-Manera J, Fernandez-Torron R, Llauger J, et al. Muscle MRI in patients with dysferlinopathy: pattern recognition and implications for clinical trials. J Neurol Neurosurg Psychiatry 2018;89:1071-1081. https://doi.org/10.1136/jnnp-2017-317488 10.1136/jnnp-2017-317488 [DOI] [PMC free article] [PubMed] [Google Scholar]
- 6.Arrigoni F, De Luca A, Velardo D, et al. Multiparametric quantitative MRI assessment of thigh muscles in limb-girdle muscular dystrophy 2A and 2B. Muscle Nerve 2018;58:550-558. https://doi.org/10.1002/mus.26189 10.1002/mus.26189 [DOI] [PubMed] [Google Scholar]
- 7.Paradas C, Llauger J, Diaz-Manera J, et al. Redefining dysferlinopathy phenotypes based on clinical findings and muscle imaging studies. Neurology 2010;75:316-323. https://doi.org/10.1212/WNL.0b013e3181ea1564 10.1212/WNL.0b013e3181ea1564 [DOI] [PubMed] [Google Scholar]
- 8.Jethwa H, Jacques TS, Gunny R, et al. Limb girdle muscular dystrophy type 2B masquerading as inflammatory myopathy: case report. Pediatr Rheumatol Online J 2013;11:19. https://doi.org/10.1186/1546-0096-11-19 10.1186/1546-0096-11-19 [DOI] [PMC free article] [PubMed] [Google Scholar]
- 9.Fischer D, Walter MC, Kesper K, et al. Diagnostic value of muscle MRI in differentiating LGMD2I from other LGMDs. J Neurol 2005;252:538-547. https://doi.org/10.1007/s00415-005-0684-4 10.1007/s00415-005-0684-4 [DOI] [PubMed] [Google Scholar]
- 10.Jin S, Du J, Wang Z, et al. Heterogeneous characteristics of MRI changes of thigh muscles in patients with dysferlinopathy. Muscle Nerve 2016;54:1072-1079. https://doi.org/10.1002/mus.25207 10.1002/mus.25207 [DOI] [PubMed] [Google Scholar]
- 11.Kesper K, Kornblum C, Reimann J, et al. Pattern of skeletal muscle involvement in primary dysferlinopathies: a whole-body 3.0-T magnetic resonance imaging study. Acta Neurol Scand 2009;120:111-118. https://doi.org/10.1111/j.1600-0404.2008.01129.x 10.1111/j.1600-0404.2008.01129.x [DOI] [PubMed] [Google Scholar]
- 12.Vignos PJ, Jr., Archibald KC. Maintenance of ambulation in childhood muscular dystrophy. J Chron Dis 1960;12:273-290. https://doi.org/10.1016/0021-9681(60)90105-3 10.1016/0021-9681(60)90105-3 [DOI] [PubMed] [Google Scholar]
- 13.Scott OM, Hyde SA, Goddard C, Dubowitz V. Quantitation of muscle function in children: a prospective study in Duchenne muscular dystrophy. Muscle Nerve 1982;5:291-301. https://doi.org/10.1002/mus.880050405 10.1002/mus.880050405 [DOI] [PubMed] [Google Scholar]
- 14.Anderson LV, Davison K, Moss JA, et al. Characterization of monoclonal antibodies to calpain 3 and protein expression in muscle from patients with limb-girdle muscular dystrophy type 2A. Am Journal Path 1998;153:1169-1179. https://doi.org/10.1016/s0002-9440(10)65661-1 10.1016/s0002-9440(10)65661-1 [DOI] [PMC free article] [PubMed] [Google Scholar]
- 15.Nicholson LV, Davison K, Falkous G, et al. Dystrophin in skeletal muscle. I. Western blot analysis using a monoclonal antibody. J Neurol Sci 1989;94:125-136. https://doi.org/10.1016/0022-510x(89)90223-2 10.1016/0022-510x(89)90223-2 [DOI] [PubMed] [Google Scholar]
- 16.Azzabou N, Loureiro de Sousa P, et al. Validation of a generic approach to muscle water T2 determination at 3T in fat-infiltrated skeletal muscle. J Magn Reson Imaging 2015;41:645-653. https://doi.org/10.1002/jmri.24613 10.1002/jmri.24613 [DOI] [PubMed] [Google Scholar]
- 17.Diaz J, Woudt L, Suazo L, et al. Broadening the imaging phenotype of dysferlinopathy at different disease stages. Muscle Nerve 2016;54:203-210. https://doi.org/10.1002/mus.25045 10.1002/mus.25045 [DOI] [PubMed] [Google Scholar]
- 18.Mercuri E, Cini C, Pichiecchio A, et al. Muscle magnetic resonance imaging in patients with congenital muscular dystrophy and Ullrich phenotype. Neuromusc Disord 2003;13:554-558. https://doi.org/10.1016/s0960-8966(03)00091-9 10.1016/s0960-8966(03)00091-9 [DOI] [PubMed] [Google Scholar]
- 19.Nguyen K, Bassez G, Bernard R, et al. Dysferlin mutations in LGMD2B, Miyoshi myopathy, and atypical dysferlinopathies. Hum Mut 2005;26:165. https://doi.org/10.1002/humu.9355 10.1002/humu.9355 [DOI] [PubMed] [Google Scholar]
- 20.Tang J, Song X, Ji G, et al. A novel mutation in the DYSF gene in a patient with a presumed inflammatory myopathy. Neuropathology 2018;May 25. https://doi.org/10.1111/neup.12474 [Epub Ahead of Print] 10.1111/neup.12474 [DOI] [PubMed] [Google Scholar]
- 21.Diaz-Manera J, Llauger J, Gallardo E, et al. Muscle MRI in muscular dystrophies. Acta Myol 2015;34:95-108. PMID: [PMC free article] [PubMed] [Google Scholar]
- 22.Day J, Patel S, Limaye V. The role of magnetic resonance imaging techniques in evaluation and management of the idiopathic inflammatory myopathies. Semin Arthritis Rheum 2017;46:642-649. https://doi.org/10.1016/j.semarthrit.2016.11.001 10.1016/j.semarthrit.2016.11.001 [DOI] [PubMed] [Google Scholar]
- 23.Tasca G, Monforte M, Ottaviani P, et al. Magnetic resonance imaging in a large cohort of facioscapulohumeral muscular dystrophy patients: Pattern refinement and implications for clinical trials. Ann Neurol 2016;79:854-864. https://doi.org/10.1002/ana.24640 10.1002/ana.24640 [DOI] [PubMed] [Google Scholar]
- 24.Marago I, Roberts M, Roncaroli F, et al. Limb girdle muscular dystrophy R12 (LGMD 2L, anoctaminopathy) mimicking idiopathic inflammatory myopathy: key points to prevent misdiagnosis. Rheumatology (Oxford, England) 2021;Jul 15. https://doi.org/10.1093/rheumatology/keab553 [Epub Ahead of Print] 10.1093/rheumatology/keab553 [DOI] [PubMed] [Google Scholar]
- 25.Díaz-Manera J, Walter G, Straub V. Skeletal muscle magnetic resonance imaging in Pompe disease. Muscle Nerve 2021;63:640-650. https://doi.org/10.1002/mus.27099 10.1002/mus.27099 [DOI] [PubMed] [Google Scholar]
- 26.Barp A, Laforet P, Bello L, et al. European muscle MRI study in limb girdle muscular dystrophy type R1/2A (LGMDR1/LGMD2A). J Neurol 2020;267:45-56. https://doi.org/10.1007/s00415-019-09539-y 10.1007/s00415-019-09539-y [DOI] [PubMed] [Google Scholar]
- 27.Fu J, Zheng YM, Jin SQ, et al. “Target” and “Sandwich” signs in thigh muscles have high diagnostic values for collagen VI-related myopathies. Chin Med J (Engl) 2016;129:1811-1816. https://doi.org/10.4103/0366-6999.186638 10.4103/0366-6999.186638 [DOI] [PMC free article] [PubMed] [Google Scholar]
- 28.Harris E, Bladen CL, Mayhew A, et al. The clinical outcome study for dysferlinopathy: an international multicenter study. Neurol Genet 2016;2:e89. https://doi.org/10.1212/nxg.0000000000000089 10.1212/nxg.0000000000000089 [DOI] [PMC free article] [PubMed] [Google Scholar]