Abstract
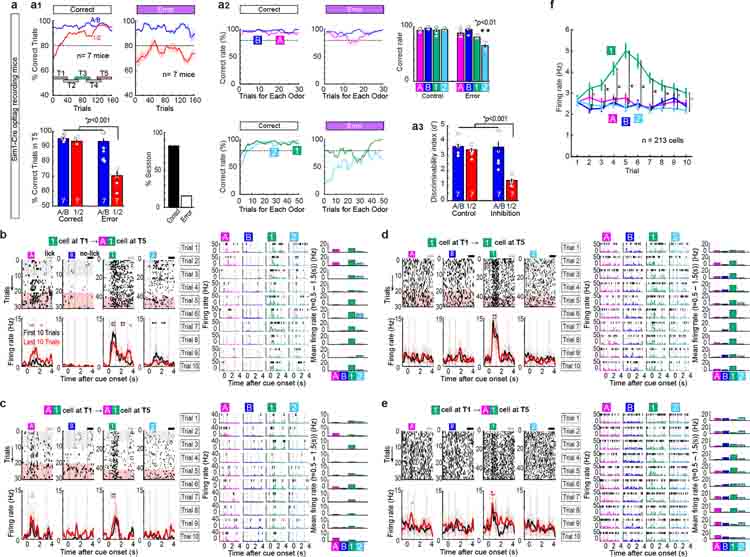
Mounting evidence shows that dopamine in the striatum is critically involved in reward-based reinforcement learning1,2. However, it remains unclear how dopamine reward signals influence the entorhinal-hippocampal circuit, another brain network critical for learning and memory3–5. Here, using cell-type-specific electrophysiological recording6, we show that dopamine signals from the ventral tegmental area/substantia nigra control encoding of cue-reward association rules in layer 2a fan cells of the lateral entorhinal cortex (LEC). When mice learned novel olfactory cue-reward associations using a pre-learned association rule, spike representations of LEC fan cells grouped newly learned rewarded cues with a pre-learned rewarded cue, but separated them from a pre-learned unrewarded cue. Optogenetic inhibition of fan cells impaired the learning of new associations while sparing the retrieval of pre-learned memory. Using fiber photometry, we found that dopamine sends novelty-induced reward expectation signals to the LEC. Inhibition of LEC dopamine signals disrupted associative encoding of fan cells and impaired learning performance. These results suggest that LEC fan cells represent a cognitive map of abstract task rules, and that LEC dopamine facilitates the incorporation of new memories into this map.
The entorhinal cortex-hippocampus circuit is critically involved in the formation of declarative memory. The entorhinal cortex is anatomically segregated7 into the medial entorhinal cortex (MEC) involved in spatial memory and navigation8, and the LEC. We previously showed the involvement of LEC in the formation of associative memory9, but underlying circuit mechanisms remained unclear.
LEC fan cells are required for associative learning
To investigate mechanisms during the formation and retrieval of associative memory, we designed a cue-reward associative learning task for mice (Fig. 1a). Mice were initially trained on lick/no-lick odor-reward associative learning (Odor-A → lick, Odor-B → no-lick). After learning (>80% correct), daily associative learning sessions were tested. First, a session with pre-learned Odors-A and -B (AB-only session), and then an AB12 session having a pair of novel odor cues (Odor-C → lick, Odor-D → no-lick) were tested. With the already acquired association rule, mice quickly learned the new association by trial and error (>80% at trial 21.9 ± 2.7, n = 10 mice). Associative learning was repeatedly tested in individual mice using novel odor cues for each session. Novel odors associated with lick (C, E, G,…) and no lick (D, F, H,…) are collectively termed as Odor-1 and Odor-2, respectively. We investigated the function of LEC layer 2 neuron types10–12 (Fig. 1b–c). Sim1+ layer 2a fan cells project to the dentate gyrus and hippocampal CA3, whereas Wfs1+ layer 2b pyramidal cells do not project to the hippocampus but instead provide cortical projections12–14. Using Sim1-Cre and Wfs1-Cre mice, we inhibited activity of fan cells or pyramidal cells (Fig. 1d–e). Adeno-associated virus encoding inhibitory protein Jaws15 in a Cre-dependent manner (AAV-flex-Jaws) was injected bilaterally in the LEC, followed by a bilateral implantation of optic fibers above the LEC (Extended Data Fig. 1). A similar number and density of fan cells and pyramidal cells was labeled in the LEC (Extended Data Fig. 2, p>0.05, Wilcoxon rank sum test; see Supplementary Table 1 for statistics details hereafter). When the activity of fan cells was inhibited with red laser, acquisition of new associations (Odors-1/2) was severely impaired (Fig 1d, p<0.001, ANOVA; p<0.001, post-hoc Tukey test; n = 10 mice). The impairment of new learning was mainly caused by increased miss trials for novel Odor-1 (Extended Data Fig. 2). Percentage of correct learning sessions also decreased by inhibition (inhibition 25.0%, control 90.9%, p<0.001). Interestingly, performance of pre-learned association (Odors-A/B) was spared during the inhibition (p>0.05), suggesting the involvement of fan cells in the acquisition of new association, but not in the retrieval of pre-learned association. By contrast, inhibition of Wfs1+ pyramidal cells did not affect new association nor pre-learned association (Fig. 1e, p>0.05). A comparison between cell types confirmed that fan cell inhibition specifically impaired new association of Odors-1/2 (Fig 1f, p<0.001). A fluorophore-only control group using AAV-flex-GFP with laser confirmed these results (Extended Data Fig. 2). We also performed inhibition of fan cells during pre-learning of Odor-A and Odor-B, which slowed the acquisition of these associations (Extended Data Fig. 2). These data indicate that LEC fan cells, but not pyramidal cells, are necessary for the acquisition of new associative memory.
Figure 1. LEC fan cells, but not pyramidal cells, were necessary for associative learning.
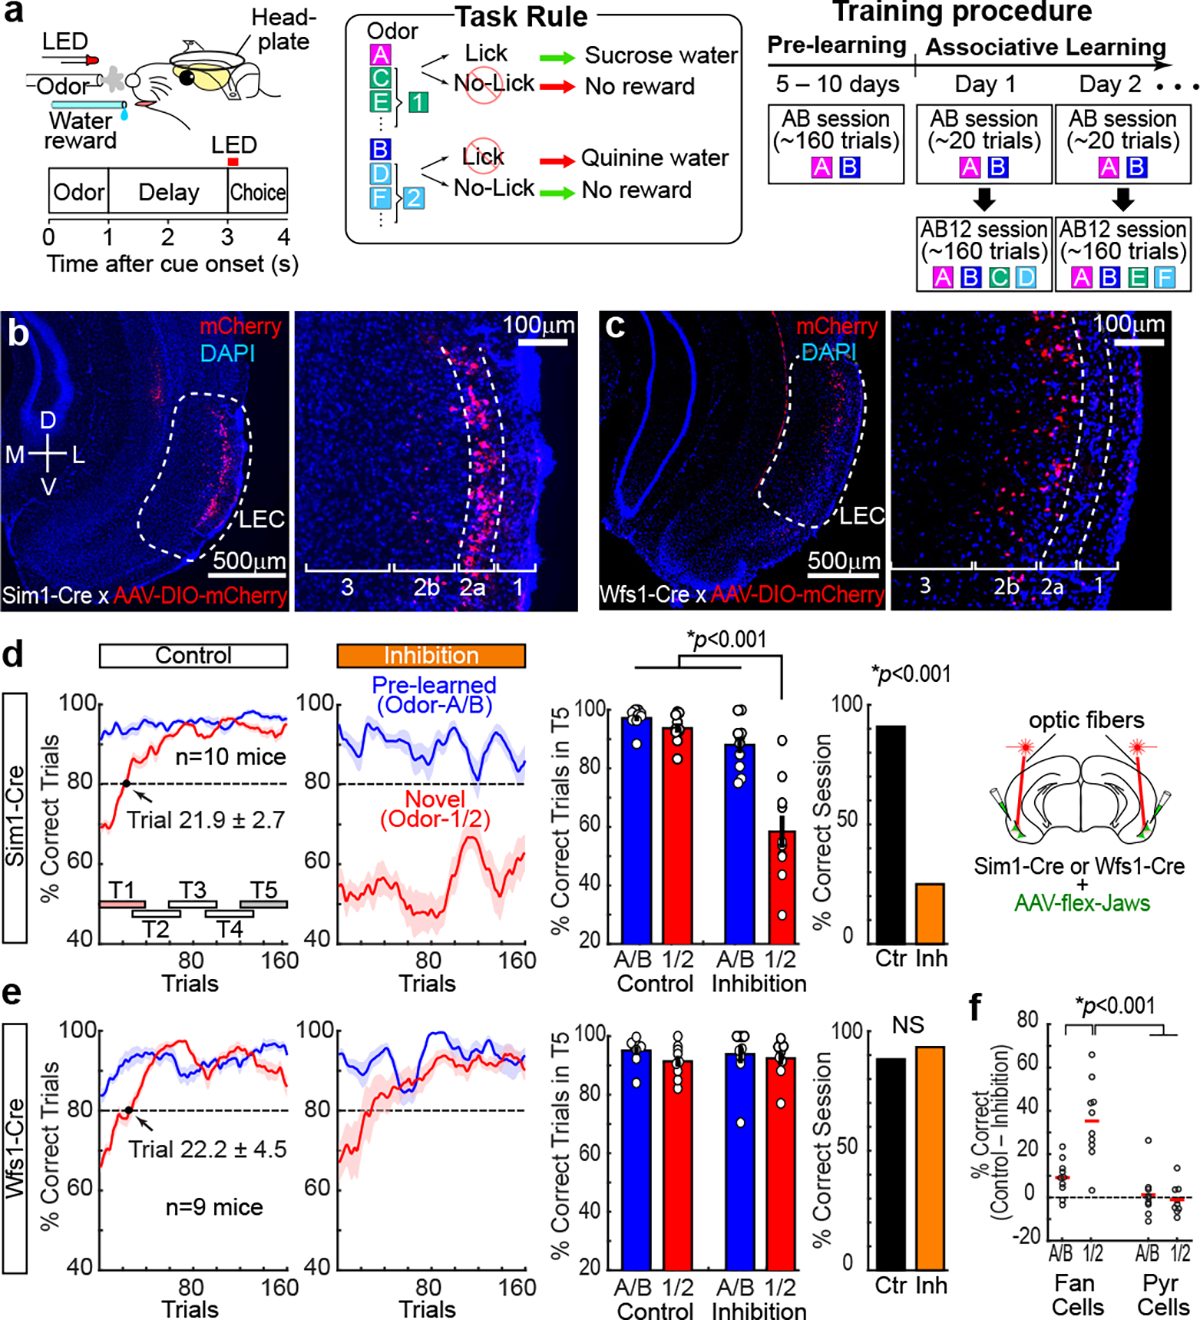
(a) Head-fixed mice learned association between odor cues and licking for sucrose water reward. During associative learning sessions, animals were tested with AB-only and AB12 sessions with novel odors (C/D, E/F, or G/H …). Novel odors are collectively referred to as Odor-1 and Odor-2 in subsequent figures.
(b) Sim1+ fan cells in LEC layer 2a of a coronal section of Sim1-Cre mouse injected with AAV-DIO-mCherry. D, dorsal, V, ventral, M, medial, L, lateral.
(c) Wfs1+ pyramidal cells in LEC layer 2b.
(d) Inhibition of Sim1+ fan cells. (Left) Correct trial rate for pre-learned odors (A/B, blue) and novel odors (1/2, red) in control and inhibition sessions. Trial number that surpassed 80% criteria (dot), and timepoints T1-T5 (rectangles) are shown. (Middle) Percent correct in T5 (p=2.3e-4, ANOVA; p= 2.1e-8 or better, post-hoc Tukey test; n = 10 mice). (Right) Percent sessions where mice correctly learned new association (p=4.1e-10, binomial test).
(e) Same as (d), but for inhibition of Wfs1+ pyramidal cells (p=0.60, ANOVA; n = 9 mice).
(f) Difference of performance between control and inhibition showing the effect of inhibition only on Odor-1/2 trials in fan cell inhibition group (p=8.8e-4, ANOVA; p= 1.3e-4 or better, post-hoc Tukey test; n = 10 Sim1 and n = 9 Wfs1 mice). All data in mean ± SEM.
LEC fan cells represent cue-reward associations
Having established the role of LEC fan cells in associative learning, we next investigated information carried by their spike activity. To isolate activity specifically from fan cells, we used a cell-type specific (“opt-tag”) recording method6 (Fig. 2a). We recorded 213 LEC fan cells (n=7 mice) and found that activity of fan cells dynamically changed during associative learning (Fig. 2b–c). An example fan cell (Fig. 2b) exhibited spike firing during the cue-delay periods of novel Odor-1 and Odor-2 trials in their first 10 trials (p<0.01, black asterisks in Fig. 2b). As learning progressed, a response to Odor-A (pre-learned rewarded) emerged but the response to Odor-2 (novel unrewarded) decreased, while maintaining firing for Odor-1 (novel rewarded) through the last 10 trials (p<0.05 or better, red asterisks in Fig. 2b). Another example fan cell developed firing only for Odor-B trials during learning (Fig. 2c). We compared fan cell population activity in the first, middle and last 10 trials of the session (defined as timepoint 1, 3 and 5 (T1, T3 and T5), respectively; Fig. 2d and Extended Data Fig. 3). Fan cell activity was strongest during the odor cue period and gradually decayed in the delay-reward periods (Extended Data Fig. 4), implying conjunctive representation of olfactory cue and task relevant information. Population representations for each trial type were then compared using principal component analysis (PCA, Fig. 2d). Fan cell activity was relatively silent and did not distinguish between Odor-A and B during the retrieval of pre-learned association (AB-only session). After novel odors were introduced in T1, a large proportion of fan cells acquired strong firing to Odor-1, reflected as a large deflection of PCA trajectory, but fired weakly during other odor trials (Fig. 2d). As learning progressed in T3, fan cell activity for Odor-A and Odor-B trials started to segregate, whereas activity for Odor-1 shifted on top of Odor-A activity. This overlap of activity between Odor-A and Odor-1 trials was maintained through T5, whereas the separation of activity between Odors-A/1 and Odor-B increased.
Figure 2. LEC fan cells encoded cue-reward association during learning.
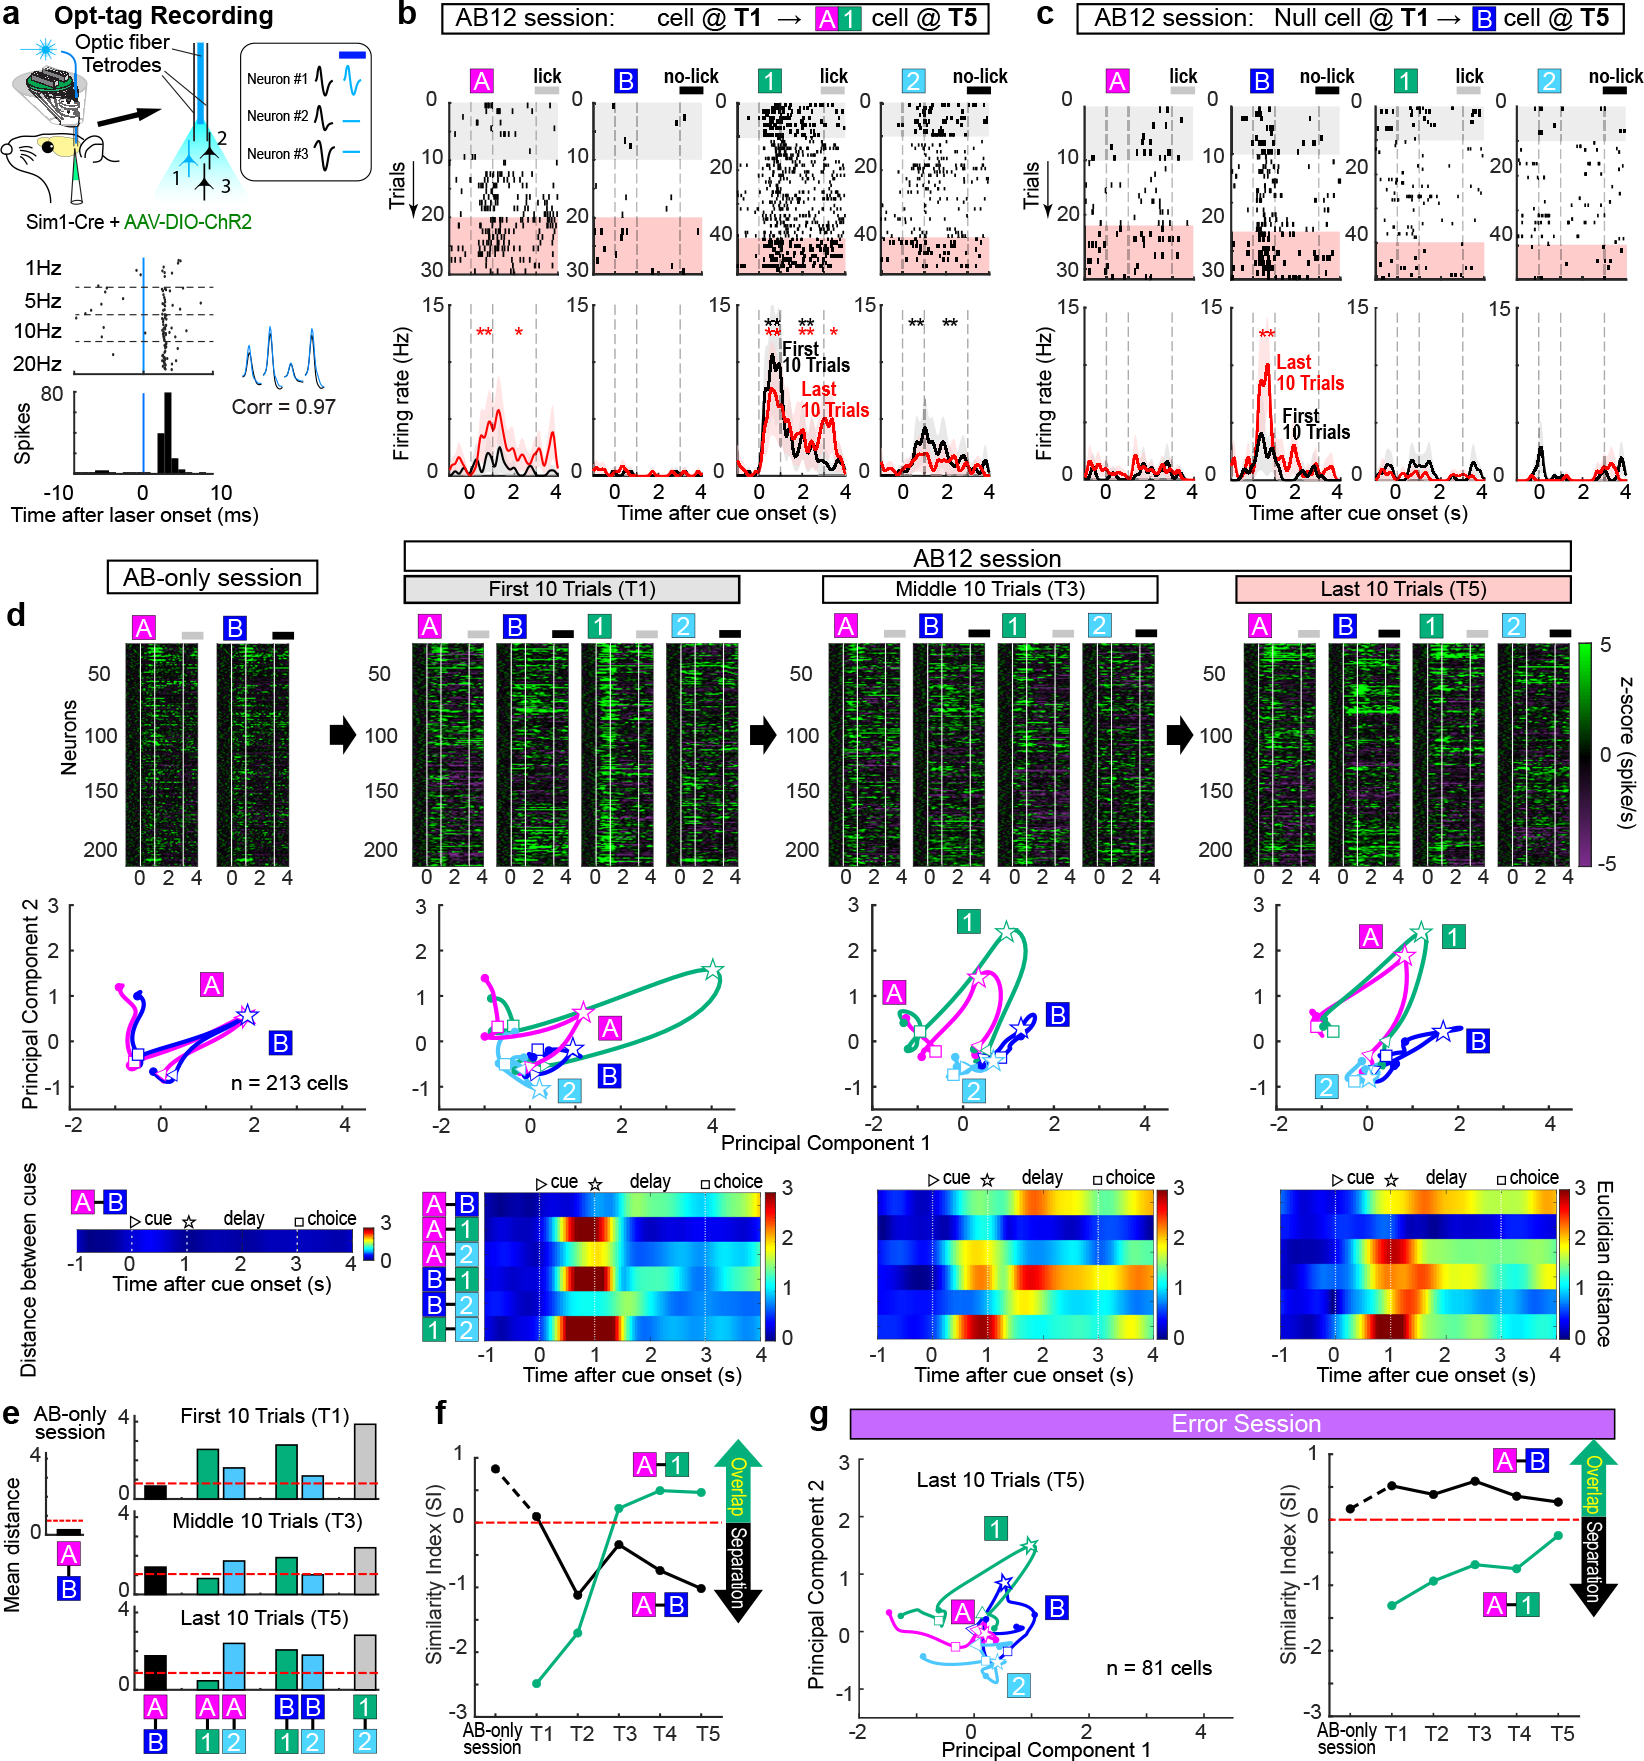
(a) Opt-tag recording of Sim1+ fan cells. Fan cells expressing Channelrhodopsin2 (ChR2) showed spike response to blue laser stimulation (see Methods).
(b) An example LEC fan cell showing constant firing for Odor-1 trials during an AB12 associative learning session. This cell increased firing for Odor-A, but decreased for Odor-2 (*p<0.05, **p<0.01 during cue, delay and choice, Wilcoxon signed-rank test). Black trace, first 10 trials. Red trace, last 10 trials.
(c) An example LEC fan cell that increased firing for Odor-B. All data in mean ± SEM.
(d) (Top) Spike firing rate of n = 213 fan cells shown in z-score during AB-only session and first 10 (T1), middle 10 (T3) and last 10 (T5) trials of AB12 session. (Middle) PCA trajectory of fan cell activity for each odor type (▷ cue-onset; ☆ cue-offset/delay-onset; □ delay-offset). (Bottom) Euclidian distance between odor types.
(e) Mean Euclidian distance during 0.5 – 1.5 s after cue onset. Ninety-fifth percentile distance obtained from shuffled data denotes significant distance (red line).
(f) Similarity index (SI) between Odor-A and -B, and between Odor-A and −1 during the learning. Positive SI denotes overlap of representation, whereas negative SI denotes separation (see text).
(g) Same as (d) and (f), but for error sessions where mice did not learn new association (n = 81 cells).
To test the similarity of fan cell representations between cue types, we measured Euclidian distances of trajectories (Fig. 2d). The distance peaked at 0.5 – 1.5 s after odor offset. We measured distances in this period and compared with a 95th percentile distance obtained from shuffled data (red line in Fig. 2e and Extended Data Fig. 4). Distance between Odor-A and B was small in T1, but became significantly larger than shuffle in T3-T5, indicating a separation of fan cell representations between Odor-A and B. By contrast, A-1 distance was significantly larger than shuffle in T1, but became smaller in T3-T5, suggesting an overlap of Odor-1 and A representations. We further assessed this overlap and separation of fan cells using a similarity index (SI), where SI = – (distancereal_data – distanceshuffle)/distanceshuffle (Fig. 2f). Positive SI represents overlap of representations between two odor trial types, whereas negative SI represents separation. With additional timepoints (T2 and T4), the SI plot showed that fan cell activity separated Odor-A and B trials during the early phase of learning (T1 – T3), whereas activity for Odor-A and 1 trials overlapped (Fig. 2f). A bootstrapping analysis confirmed the emergence of A-1 overlap and A-B separation during learning (Extended Data Fig. 5). Together, these data demonstrate that during associative learning, fan cell activity established a representation of novel Odor-1 trials that gradually overlapped with that of pre-learned Odor-A trials, while separating Odors-A/1 from pre-learned Odor-B trials. Curiously, this categorization of LEC fan cells matched the reward contingency of odor cues: reward-associated Odor-A and Odor-1 were grouped together, whereas non-rewarded Odor-B was separated from them, suggesting a cue-reward associative memory encoding of fan cells. Novel non-rewarded Odor-2 was not clearly represented by fan cells (Fig. 2d). The overlap and separation of fan cell representations were also observed when the incorrect trials were excluded from the PCA, excluding the possibility that the representations emerged from the increasing rate of correct trials (Extended Data Fig. 6). Another PCA using only lick trials (correct trials for Odors-A/1 and error trials for Odors-B/2) revealed a similar A-1 overlap and A-B separation, suggesting that fan cells do not simply represent lick-related motor information (Extended Data Fig. 6). When mice were overtrained with Odor-A, B, C and D, A-C overlap and A-B separation were observed in Days 1–4 but disappeared in Days 5–10, suggesting that these representations are required only during associative memory acquisition (Extended Data Fig. 7). In the 15.4% of sessions where mice did not learn new associations (“error sessions”), the A-1 overlap and A-B separation were weaker than correct sessions (n = 81 cells, Fig. 2g and Extended Data Fig. 5). The percentage of Odor A+1 type cells was lower in error sessions (Extended Data Fig. 4, p<0.05), which may contribute to the disappearance of A-1 overlap. These results suggest that the cue-reward associative encoding of fan cells is predictive of successful learning.
LEC dopamine carries novelty-induced reward expectation signals
What are circuit mechanisms that enable dynamic cue-reward associative encoding of fan cells? The match between the odor categorization and their reward contingency was the hint. It was previously shown that the LEC receives the most prominent dopaminergic inputs among the entorhinal-hippocampal circuit16–18 (Fig. 3a–b), but its role remained totally enigmatic. We injected AAV-DIO-ChR2-eYFP in the VTA and substantia nigra pars compacta (SNc) of dopamine transporter (DAT)-Cre mice, as well as a retrograde tracer in the LEC, and confirmed that the LEC receives massive dopaminergic axons (Fig. 3c and Extended Data Fig. 8). In situ hybridization showed that 42% of LEC fan cells expressed dopamine receptor D1R (185/441 cells, n = 2 mice) (Fig. 3d). We performed red laser inhibition of dopamine fibers projecting to the LEC (Fig. 3e). Mice showed impairment of new association (p<0.001, n= 9 mice) but the pre-learned association was spared (p=0.71), a result similar to that from fan cell inhibition (Fig. 1d). The percentage of correct sessions decreased (p<0.001). Another control group using AAV-flex-GFP confirmed our results (Extended Data Fig. 2). A pharmacological inhibition of LEC dopamine using D1R blocker SCH23390 further confirmed the result (Extended Data Fig. 8). These data indicate that LEC dopamine is required for the acquisition of new associative memory, but not for the retrieval of pre-learned memory.
Figure 3. LEC dopamine fibers sent novelty-induced reward expectation signals.
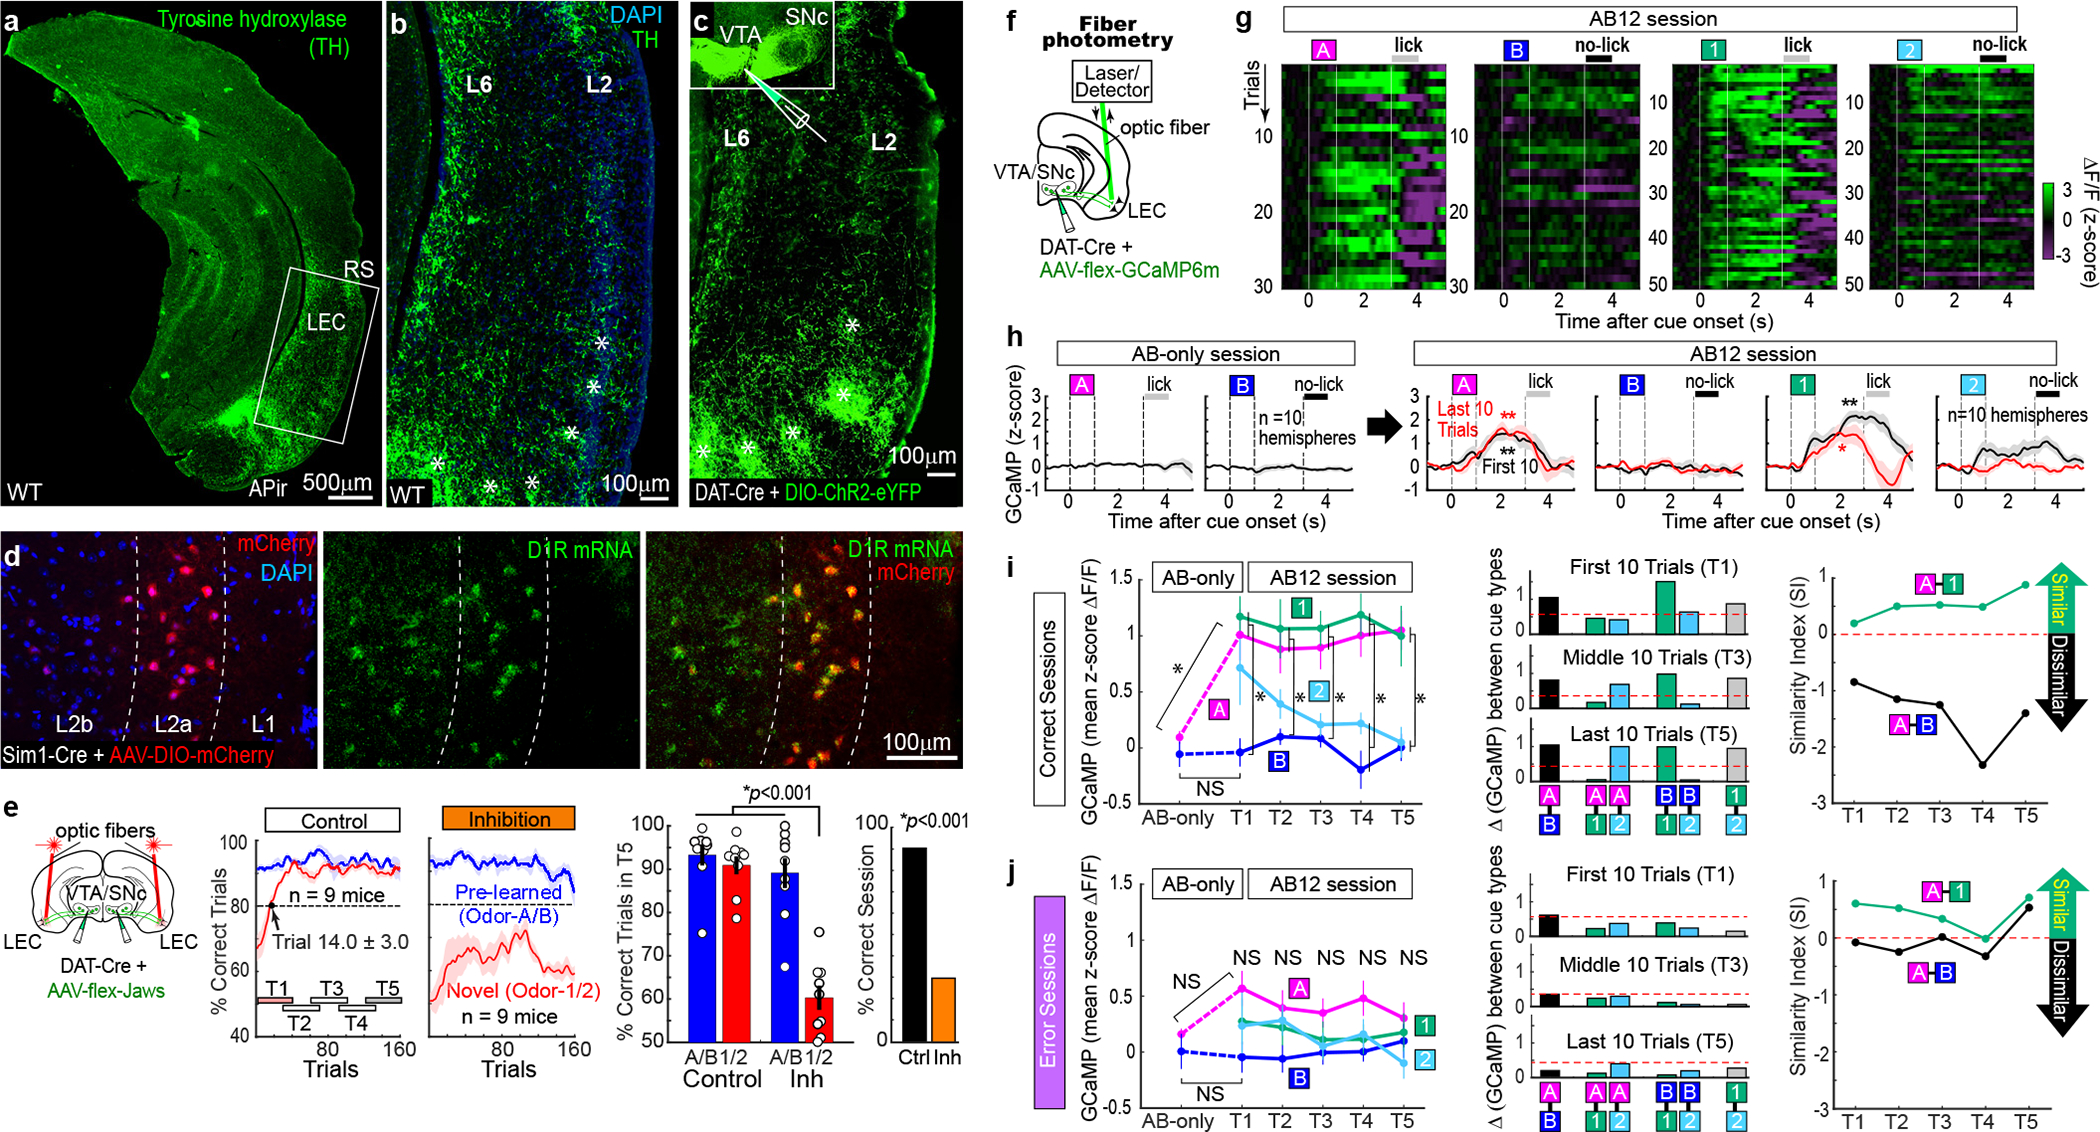
(a) Anti-tyrosine hydroxylase (TH) immunohistochemistry in wild type (WT) mice showing TH positive fibers in the LEC. RS: rhinal sulcus. APir: Amygdalopiriform transition area.
(b) The LEC receives TH+ fibers in layers (L) 2 and 6. The LEC has dense patches of TH+ fibers in the ventral part (asterisks).
(c) Dopaminergic axons in the LEC revealed by injection of AAV-DIO-ChR2-eYFP in the VTA and SNc of DAT-Cre mice.
(d) In situ hybridization of dopamine receptor D1R mRNA in LEC fan cells.
(e) Same behavior plots as in Fig. 1d, but for inhibition of dopamine fibers in the LEC using AAV-flex-Jaws injected in the VTA/SNc of DAT-Cre mice. (Left) LEC dopamine inputs were required for the acquisition, but not for the retrieval of association. (Middle) p=3.1e-5, ANOVA; p= 1.0e-7 or better, post-hoc Tukey test; n = 9 mice. (Right) p=6.0e-11, binomial test.
(f) Optic fiber photometry of calcium signals from dopamine fibers in the LEC.
(g) An example recording of GCaMP signals from LEC dopamine fibers shown in z-score.
(h) GCaMP signals in AB-only session and first 10 trials (T1) and last 10 trials (T5) of AB12 session (n = 10 hemispheres). *p<0.05 and **p<0.01, Wilcoxon signed-rank test during 0.5 – 3 s after cue onset compared with 1-s pre-cue period.
(i) (Left) Mean GCaMP signals during 0.5 – 3 s after cue onset during learning. (Odor A from AB-only to T1: p=0.03, ANOVA; p=0.02 or better, post-hoc Tukey test; Odors A/B/1/2 in T1 – T5: p=1.2e-18, ANOVA; p=0.04 or better, post-hoc Tukey test. (Middle) Absolute difference in GCaMP signal amplitude obtained from (i). (Right) Similarity Index calculated from difference in GCaMP signals between Odor-A and -B and between Odor-A and −1 during the learning.
(j) Same as (i), but for error sessions. n = 10 hemispheres. All data in mean ± SEM.
To directly assess the information in the dopamine inputs, we recorded calcium signals from dopaminergic axons using fiber photometry19,20 (Fig. 3f–h). In AB-only sessions, we observed virtually no signals. After novel cues were introduced, however, LEC dopamine axons started to send signals mainly during the cue-delay periods of reward-associated Odor-A and Odor-1 trials (Fig. 3g–i; p<0.01). For Odor-2, dopamine signals were present in several initial trials, but became silent as learning progressed. No signals emerged for Odor-B. To assess dynamics of dopamine signals, we assessed the SI using difference in calcium signals between odor types (Fig. 3i). The high SI between Odor-A and 1 confirmed that dopamine signals were supplied similarly on both odor trials throughout T1–T5, whereas low SI between Odor-A and B indicated significantly less dopamine signals on Odor-B trials. These dopamine signals for Odor-A/1 trials were not clearly discernible in error sessions (Fig. 3j). Together, these data suggest that LEC dopamine fibers initially carry novelty signals (for Odor-1 and Odor-2) that transitioned to reward expectation signals (for Odor-A and Odor-1) during learning.
LEC dopamine facilitates associative encoding of fan cells
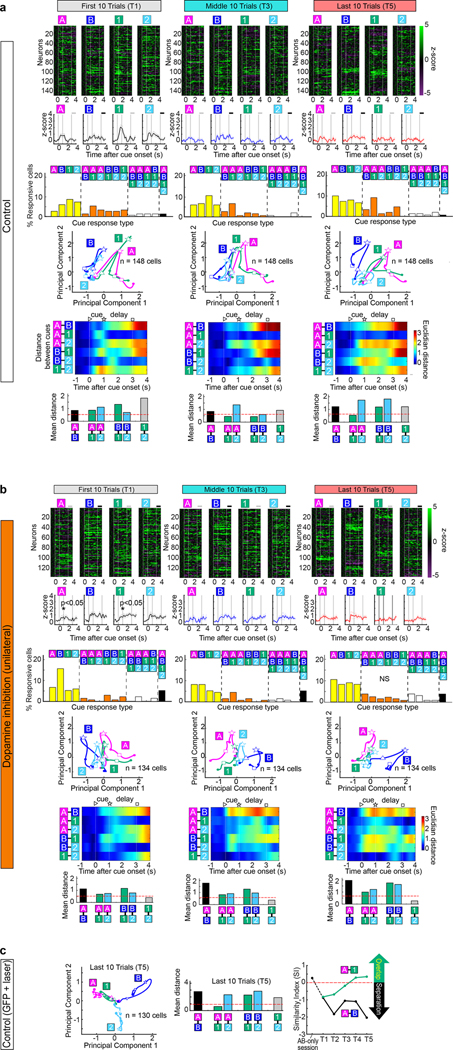
To test if LEC dopamine inputs directly control the cue-reward associative encoding of fan cells, we combined opt-tag recording of fan cells and optogenetic inhibition of LEC dopamine fibers (Fig. 4a). Although the implanted recording device only allowed unilateral inhibition, we observed decreased correct rate in T5 (inhibition 84.2 ± 1.9%, control 91.7± 1.1%; p<0.01, n= 8 mice) and decreased correct session number (inhibition 54.3%, control 92.4%, p<0.001; Fig. 4a and Extended Data Fig. 9). During control sessions, A-1 overlap, as well as A-B separation, were again observed in fan cell spikes from this distinct group of mice, confirming our finding (n = 148 cells, Fig. 4b). By contrast, during unilateral inhibition, fan cells did not show A-1 overlap (n = 134 cells, Fig. 4c). The instantaneous response to novel odors in T1 disappeared, presumably due to the absence of dopamine novelty signals (Extended Data Fig. 10). Interestingly, A-B separation still emerged, implying a dopamine-independent mechanism for A-B separation of fan cells (Fig. 4c). A bootstrapping comparison and another control group using AAV-flex-GFP confirmed our result (Extended Data Fig. 5 and 9). Plotting of A-1 integration and A-B separation as a function of behavioral performance showed positive and negative correlations between A-1 integration and performance (p<0.05) and between A-B separation and performance (p<0.01), respectively (Fig. 4d), indicating successful associative learning when A-1 integration and A-B separation emerged. Together, these data demonstrate that LEC dopamine inputs are required for establishing the representation of cue-reward association in LEC fan cells during associative learning (Fig. 4e).
Figure 4. Inhibition of dopamine inputs impaired the cue-reward encoding of LEC fan cells.
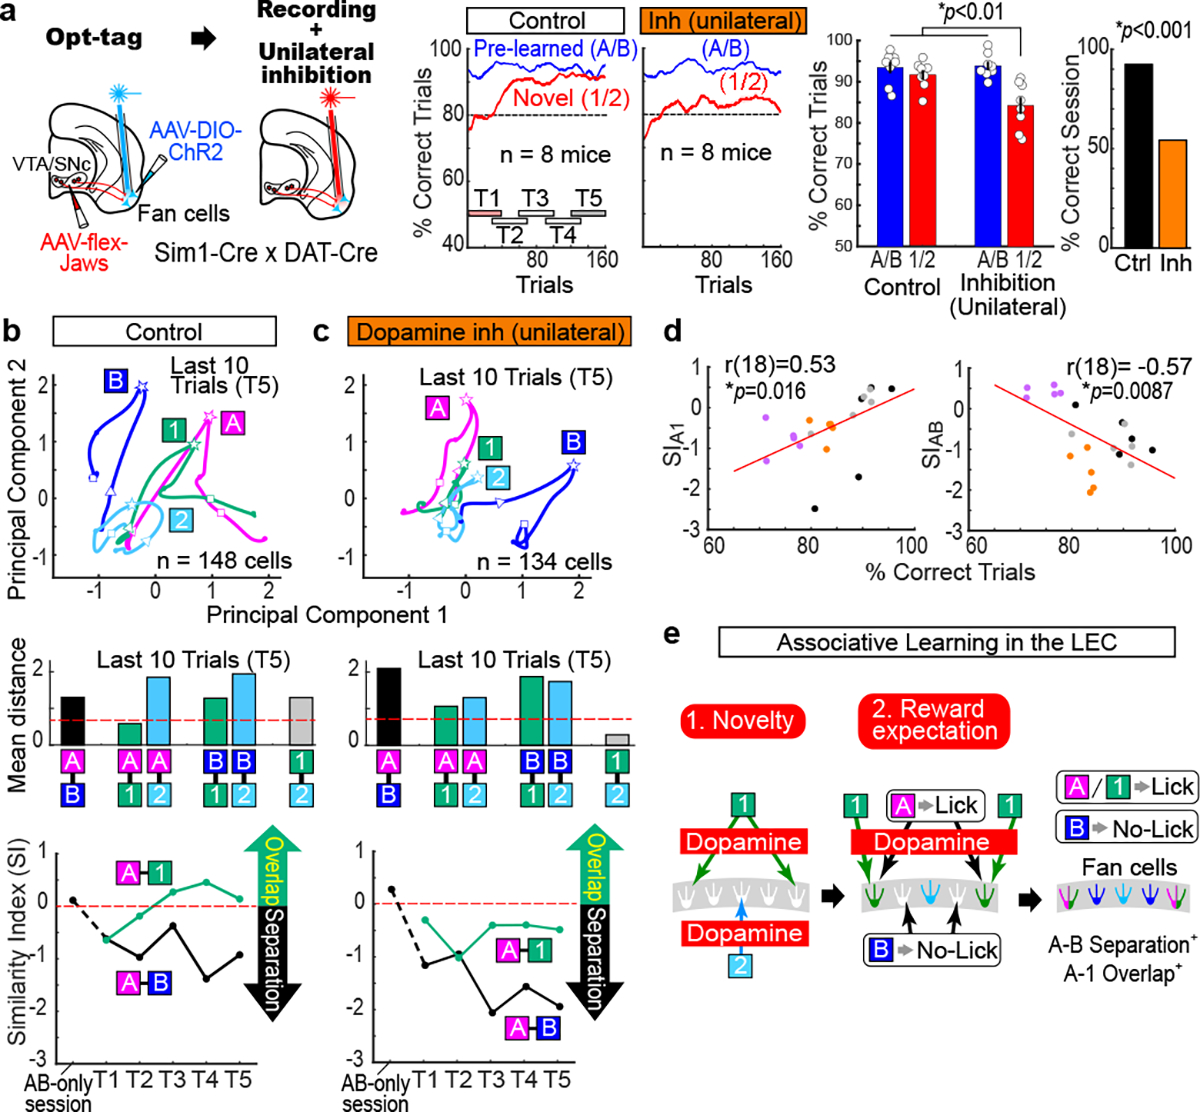
(a) Opt-tagging was followed by dopamine fiber inhibition using an optic fiber implanted unilaterally in the LEC. Jaws and ChR2 was expressed in the VTA/SNc and LEC, respectively, of Sim1-Cre x DAT-Cre mice. Same behavior plots as in Fig. 1d, but for unilateral dopamine fiber inhibition. (Left) p=0.011, ANOVA; p= 0.006 or better, post-hoc Tukey test; n = 8 mice. (Right) p=2.5e-11, binomial test. All data in mean ± SEM.
(b) (Top) Trajectories of n = 148 fan cells in the last 10 trials of control sessions (Control T5). (Middle) Mean Euclidian distance in control T5 with shuffle distance (red). (Bottom) Similarity Index during control T5.
(c) Same as (b), but for unilateral dopamine inhibition sessions (n = 134 cells).
(d) (Left) Similarity Index (SI) between Odor-A and −1 as a function of behavior performance. Each point represents data obtained from five timepoints (T1 – T5) x 4 session types [Correct sessions (black) or Error sessions (purple) in Fig. 2 and Control sessions (gray) or Unilateral dopamine inhibition session (orange)]. (Right), same as in (Left), but for SI between Odor-A and Odor-B. p=0.016 and p=8.7e-3, Pearson correlation; n = 20 time points.
(e) LEC dopamine and fan cells in associative learning (see text).
Discussion
Using cell-type-specific recording of LEC fan cells, photometry recording of LEC dopamine signals, and optogenetic manipulations, our results provide solid neural circuit evidence that LEC fan cells and LEC dopamine play critical roles in associative learning. These results indicate that fan cells transform sensory information received from the olfactory sensory regions21 to task-relevant information before sending it to the hippocampus. At the cellular level, fan cells receiving axonal inputs for both Odor-A and Odor-1, but inhibited by interneurons22, would be disinhibited through dopamine-dependent mechanisms23 to fire to the rewarded cues during associative learning. The overlapped representations of the rewarded cues, separated from the pre-learned unrewarded cue representation, suggest that fan cells encode memory for rules of cue-reward association. Fan cells may use the separated representation for Odor-A and -B as a template for new associative memory of Odor-1, implying that the LEC underlies memory schema representation and subsequent assimilative learning24. The cue-reward rule representation also implies cognitive maps of non-spatial, task rule domains25,26 that facilitate subsequent learning. Here we propose a unified view of the entorhinal cortex: the LEC represents cognitive maps of abstract task rule domains whereas the MEC represents cognitive maps of spatial domains27.
Dopamine signals in the striatum have been conceptualized as reward prediction errors1,2 in reinforcement learning, while striatal dopamine also sends novelty signals that presumably activate target circuits to facilitate exploration of potential rewards (“novelty bonus”)28. The LEC dopamine that emerged for both Odor-1 and -2 in the initial trials may encode such novelty signals and function as a “detonator” of fan cell activity for motivating mice for novel cues. These inputs, however, became active only for Odor-A and −1, presumably acting then as teaching signals for enhancing the response to rewarded cues. In the memory system, dopamine signals are hypothesized to regulate the entry of information into long-term memory29, and novelty-coding dopamine from the locus coeruleus has been identified30. In this study, we provide new evidence that in an area one synapse upstream from the hippocampus, dopamine signals from the VTA/SNc regulate memory encoding. Our findings on LEC dopamine would provide a basis for a future theoretical framework that unifies the roles of two central players in memory – dopamine and the entorhinal-hippocampal circuit.
Methods
Subjects
All procedures were conducted in accordance with the guidelines of the National Institutes of Health and approved by the Institutional Animal Care and Use Committee at the University of California, Irvine. Mice were maintained in standard housing conditions on a reversed 12h dark/light cycle with food and water provided ad libitum. All experiments were conducted during the dark phase. Mouse lines and their received procedure are summarized in Supplementary Tables 2 and 4.
All animals either had C57BL/6 background or were backcrossed to C57BL/6 for at least 6 generations. Animals were 3–5 months old at time of surgical procedures. They were housed individually with an exercise wheel following their first procedure. Medications and appropriate treatments were applied across 1–2 weeks for recovery. If animals died or were sick during or before the experiment, their recording positions could not be validated and therefore were removed from the data analysis. We noted no difference in our preliminary analyses between sexes.
Electrode, Drive and Optic Fiber Preparation
Opt-tetrode drive.
A custom-built 64-channel drive modified from Cohen et al (2012) was used for opt-tag recording. Tetrodes for spike recording experiments were produced by twisting four 17μm polyimide-coated 90% platinum / 10% iridium wires (California Fine Wire). Tetrode contacts were plated at 1kHz with gold or platinum to reduce impedances to 150–300 kΩ. 16 tetrodes were attached surrounding an optic fiber, with tetrode tips extending 0.2–0.5 mm from the optic fiber tip. This bundle was held by a custom 3D-printed drive which allowed free adjustment of tetrode depth along the dorsal-ventral axis. Optic fibers of either 200 μm or 400 μm diameter were used in all experiments.
Optic fibers.
For optogenetic inhibition experiment, optic fibers of 400 μm diameter (Thorlabs) were used. For photometry recording, optic fibers with 400 μm diameter (Doric lenses) were used.
Surgery
Surgery.
For all surgeries, mice were anesthetized with isoflurane (2–3% v/v induction, 0.5–1% maintenance, adjusted according to pinch reflex and breathing rate; air flow: 1.0 L/min). Mice received intraperitoneal injection of buprenorphine following induction of anesthesia. Anesthetized mice were fixed on a stereotaxic frame (Kopf Instrument) with auxiliary ear bar (Narishige) atop a heat pad set to maintain body temperature at 36 °C. The scalp was shaved clean and sanitized with povidone-iodine and 70% ethanol. Lidocaine was injected subcutaneously under the scalp as a local anesthetic before making an incision. The skull was cleaned with sterile saline, hydrogen peroxide, and 70% ethanol.
Injections.
Viruses or tracers were loaded into capillary tubes (PCR micropipette, Drummond) pulled into micropipettes with a Sutter P-30 puller. For injections targeting the LEC, a 1 mm craniotomy was centered at AP 3.5 mm, ML 3.5 mm from bregma. Injection needle was angled at 10 degrees laterally and inserted 3800–4000 μm deep from the brain surface. For viral injections targeting the VTA/SNc, 1 mm craniotomy was centered at AP 3.15 mm, ML 0.8 mm from bregma. The micropipette was lowered 4000 μm deep from the brain surface and allowed to settle for several minutes. Viruses were injected at approximately 0.1 μL/min using a hydraulic manipulator (MO-10, Narishige). After injecting the desired volume, the micropipette was allowed to settle for five minutes. It was then removed at approximately 1 mm/min. Craniotomies were sealed with Kwik-Sil silicone adhesive (World Precision Instruments). Finally, the incision was sutured closed and treated with Vetbond tissue adhesive (3M) and Neosporin. Mice received subcutaneous injections of Flunixin and Baytril daily as needed. For the induction of Cre/ERT2, tamoxifen (75 mg/kg body weight) was injected intracutaneously in Wfs1-Cre mice one week after the injection for consecutive three days.
Head-plate implantation.
After allowing at least one week for mice to recover from injection surgery, mice were implanted with a custom-made titanium head-plate to allow head-fixing during behavior. Mice were anesthetized and prepared as described above. The headplate was glued flat on the skull with adhesive cement (C&B Metabond, Patterson Dental), leaving the area above VTA/SNc, LEC and anterior cerebellum accessible for fiber/tetrode/screw implants.
Opt-tetrode implantation.
Opt-tetrode drives were implanted during the same head-plate surgery. 1 mm craniotomies were drilled over the right-hemisphere LEC and over the cerebellum. A reference screw was implanted on the surface of the cerebellum. The optic fiber/tetrode bundle was then slowly inserted into the LEC at 10 degrees to the right of vertical, advancing ~3200 μm. The remaining exposed bundle above the skull was coated in surgical lubricant to enable free adjustment along the DV axis. The base of the drive was then secured to the skull and headplate with several layers of dental acrylic. While drying, the drive was surrounded by a conical shield made of an outer plastic transparency sheet epoxied to an inner aluminum foil sheet. The wound was treated with tissue adhesive and Neosporin. Subcutaneous injections of Flunixin and Baytril were administered daily for at least one week after surgery.
Optic fiber implantation.
For optogenetic inhibition experiments in Sim1-Cre, Wfs1-Cre and DAT-Cre animals, optic fibers with 400 μm diameter were bilaterally implanted at AP 3.5 mm, ML 3.5 mm, 4000 μm depth with an angle of 10 degrees to lateral. For photometry experiments, optic fibers were implanted either unilaterally or bilaterally at the same coordinate. Protective conical shields were secured with dental cement after optic fiber implantation.
Apparatus and Training Procedures
Behavioral apparatus.
A custom-made behavior test apparatus was modified from Menegas et al (2017) and used in this study. All training and experiments were performed with the mouse stationed inside a custom sound-proof shielded chamber. Mice were head-fixed to aluminum bars on both sides of the head, and their bodies were elevated on an acrylic platform. Lick spouts made from two 20G hypodermic needles (one for sucrose, one for quinine) were placed in front of mice. Sucrose and quinine were dispensed via 3-port solenoid valves (The Lee Company). An infrared emitter and sensor (Honeywell) were positioned for the detection of licking. Odor molecules obtained at >90% purity were dissolved in mineral oil or propylene glycol at 1–100% dilution (Supplementary Table 3). We used dilution concentrations used in previous olfactory studies31. We did not observe differences in learning across odor pairs. 30 μL of odor solution was pipetted into a Puradisc syringe filter (Whatman). Odorized air (100 mL/min) generated in a custom olfactometer32 was further diluted in vehicle pure air stream (1 L/min) and delivered to the mice through a plastic tube positioned ~1 cm from the nose tip. A constant vacuum tube was placed beneath the lick spout to remove lingering odors. The mouse was monitored with an external webcam throughout experiments. After each session, olfactometer components were washed and sonicated to remove odor traces. The tasks were automated with custom LabView scripts on a laptop connected to a DAQ port (National Instruments). The volume of reward was individually adjusted to each animal’s maximum perceived motivation.
Water deprivation.
Mice were recovered to a stable body weight (~1 week) after surgery. During this period, tetrodes were lowered by increments of 40–80 μm until significant spike clusters were detected, indicating the LEC superficial cell layer had been reached. After recovery, mice were water deprived and body weight maintained above 85% of baseline. Mice were habituated to being head-fixed and encouraged to lick the reward spout (1–4 days).
Habituation/procedural learning.
Mice were initially habituated and trained for procedural learning of water licking and withholding licking using three steps.
Step1 (1–4 days). Habituation to the environment and water reward. Trials were given every 8–12 s (random) consisting of a 1 s non-odorized air puff, 1 s delay, and an LED cue + automatic 5 μL sucrose water (10%) delivery.
Step 2 (1–5 days). Training animals to lick actively. Sucrose water was delivered by the detection of licking within 2 s after the LED.
Step 3 (1–5 days). Training animals to withhold licking during delay period until LED signal. Mice were additionally required to completely withhold licking during the delay period preceding the LED; premature licking resulted in abortion of the trial. Delay duration was incremented from 500 ms to 2000 ms as the mouse learned to suppress premature licking during the delay.
Pre-learning.
After the completion of habituation/procedural learning, mice were trained onan odor-cued go/no-go reward association task with 2 second delay33. Go Odor-A (isoamyl acetate, 5% in mineral oil) and no-go Odor-B (α-pinene, 15% in mineral oil) were presented in random order every 18–22 s. When animals licked after Odor-B, a 1.5 μL of quinine water (0.64%) was delivered. Mice were thus trained to lick after Odor-A and withhold after Odor-B. The probability of Odor-B was gradually increased from 10%, 25%, and then to 50%. When animals performed >80% correct rate, Odor-B probability was increased. If they failed the same probability 3 days in a row, they reverted to the previous probability. Training was complete when mice scored >80% on three consecutive daily sessions with 50% Odor-B trials. The pre-learning typically took 5 – 10 days.
Associative learning.
A ~20-trial session that randomly delivers only Odor-A and Odor-B was tested first (AB-only session). After the AB-only session, two novel odors in addition to Odor-A and Odor-B were presented in random order every 18–22 s (AB12 session). One of the novel odors was associated with lick, and the other with no-lick. Mice learned this new association by trial and error. The pair of novel odors were pseudo-randomly chosen by the experimenter for each session so that mice never repeated a novel odor pair. The lick-associated odors (Odor-C, -E, -G, …) were collectively termed as Odor-1, and the no-lick-associated odors (Odor-D, -F, -H,…) were termed as Odor-2. The reward contingency of each odor pair was counterbalanced across animals. During the 160–200 trial AB12 sessions, Odor-A and Odor-B were randomly delivered with 20% emergence rate each, whereas Odor-1 and Odor-2 were delivered with 30% emergence rate each. Licking during the delay period automatically aborted the trial. If the correct rate on the Odor-A/Odor-B trials was below 80%, the mouse was trained again on step 4. This retraining only occurred twice in one mouse in the Sim1 opt-tagging group, and did not occur in animals in inhibition groups.
Data Collection
Spike recording.
The tetrodes were connected to a multichannel, impedance matching, unity gain headstage (Neuralynx). The output of the headstage was conducted to a data acquisition system (Cheetah software, Neuralynx). Unit activity was amplified by a factor of 3000–5000 and band-pass filtered from 600 Hz to 6000 Hz. Spike waveforms above a threshold set by the experimenter (~30 μV) were time-stamped and digitized at 32 kHz for 1 ms. Notch filters were not applied. Tetrodes were advanced 40–80 μm to record a different group of cells in each session of a same type (either control or inhibition session) at the same recording position, assuring that identical cells were not double counted in a given recoding group. We typically advanced tetrodes after the recording of one control session and one inhibition session.
Opt-tagging.
An optogenetic-assisted cell-type identification was performed as described previously (Cohen et al., 2012; Kvitsiani et al., 2013). Two opt-tagging sessions were performed before and after the behavior recording sessions to validate the opt-tag results. 5 ms pulses of 465 nm blue laser stimulation (7–9 mW mm−2 at the tip of implanted optic fiber) were delivered through the implanted optic fiber at 1, 5, 10, and 20 Hz (5 pulse trains per frequency, 10 pulses per train) to test the light-induced spike activities.
Optogenetic inhibition.
For inhibition experiments of fan cells, pyramidal cells, and DAT+ fibers, 635 nm red laser stimulation (20 mW mm−2 at the tip of implanted optic fiber) was delivered through the implanted optic fiber. Laser was on from the cue onset for 5 s, followed by a linear taper of 10 s in each of Odor-A, B, 1, 2 trials throughout the session. For all control experiments, we performed experiments with laser patch fiber tips placed inside the implanted conical shield, but not connected to the implanted fibers. Laser was applied inside the shield with the same condition as inhibition experiments. We used this control condition because a small amount of laser leakage occurred from the implanted dental cement, and this condition needed to be kept same for both inhibition and control experiments. Control and inhibition sessions were tested one session each for the initial group of mice, and were tested at least two sessions each for the latter group of mice. To control unequal number of sessions from individual mice, we averaged behavioral performance across sessions for each mouse and used these mean values (see Data Analysis below).
Photometry recording.
The photometry recording was performed using a custom-made photometry setup as described previously (Menegas et al., 2017). Briefly, two excitation lasers (473nm and 561nm, 0.1–0.2 mW) were delivered through a dichroic and a patch cord (Doric Lenses). Activity-dependent fluorescence emitted by GCaMP-expressing axons was spectrally separated from the excitation light using a dichroic, passed through a single band filter, and focused onto a photodetector connected to a current preamplifier (SR570, Stanford Research Systems). The output voltage signals from the preamplifiers were collected by an AD board (National Instruments).
Data Analysis
Unless indicated otherwise, analyses were performed using MATLAB codes written by the authors.
Behavioral analysis.
Behavioral performance was calculated by counting the licking responses to Odor-A and 1 (hit) and the withholdings to Odor-B and 2 (correct rejection). Instantaneous behavioral performance (instantaneous percent correct trials) for Odors-A/B and Odor-1/2 was calculated from a sum of hit and correct rejection trials within a sliding window of 20 trials, divided by a total trial number of 20. The mean behavioral performance for each session after the learning (percent correct trials in T5) was calculated from a sum of hit and correct rejection trials during trials 121–160, divided by a total trial number of 40. To evaluate the behavioral performance for each mouse, these two values were averaged for all sessions with the same condition (control or inhibition) for each mouse regardless of the performance and shown in the Figures. For percent correct sessions, sessions with (percent correct trials in T5) > 80% were counted from all sessions pooled from multiple animals.
Spike sorting.
Spike sorting was performed offline using graphical cluster-cutting software, MClust by Dr. David Redish. Putative excitatory cells were distinguished from putative interneurons by spike peak-valley width and average rate. All putative excitatory cells with spike peak-valley width of more than 230 μs and cells with more than 100 spikes in a session were included for further analysis. We compared spike clusters before and after turning tetrodes using the distribution of clusters in the 4-dimensional energy plots, spike autocorrelation, and mean firing frequency, as well as the coding property in the learning tasks. If there was any sign that clusters can be similar before and after the turning, they were considered as the same neuron, and the cluster after the turning was excluded from analyses. If new clusters appeared, they were included in the analyses.
Opt-tag cell identification.
Putative excitatory cells that responded consistently to blue laser pulses were tagged as Sim1+ cells. We used exactly the same criteria for opt-tagged neurons as described previously (Kvitsiani et al., 2013). Briefly, the optic response during 10 ms after the laser stimulation was statistically compared from baseline spike activity during −100 – 0 ms before the laser stimulation using Kullback-Leibler divergence (Stimulus-Associated spike Latency Test (SALT)). Spike waveforms during the opt-tag stimulation and behavior recording were compared using waveform correlation to ensure recording from identical neurons. Neurons with p<0.01 in SALT and waveform correlation of >0.85 were considered as fan cells.
Spike response.
Mean firing rates in 50-ms bins were obtained using a Gaussian filter with a sigma of 100 ms and transformed as z-score using the mean firing rate during a baseline pre-odor period (−1 – 0 s before the odor onset). Significant response was assessed from total spike numbers during odor (0.5 – 1.5 s after odor onset), delay (2 – 3 s after odor onset), and reward (3 – 4 s after odor onset) periods, compared with those in 1 s pre-odor period (Wilcoxon signed-rank test). We used 0.5 – 1.5 s after odor onset for the odor response period because of the delay from odor delivery to the onset of LEC activity observed in this and previous studies (Igarashi et al., 2014). The delay period was chosen as a period 2 – 3 s after odor onset because of this delay in LEC activity.
Principal component analysis (PCA).
Mean firing rates in 50-ms bins during −1 – 4 s after odor onset in each odor type (A, B, 1, 2) were normalized and processed for principal component analysis as described previously (Cunningham and Yu, 2014). Spike rate was normalized by subtracting the minimum firing rate and dividing by the maximum firing rate for each neuron. PCA was performed using Matlab function pca. Principal components (PCs) 1 and 2 were used for the subsequent analyses (>46% explained by PC1 and PC2 for all assessed sessions). In the correct sessions from Sim1-Cre animal recordings, PC1 explained 39%, 31%, 30%, 24%, and 25% in T1-T5, respectively, whereas PC2 explained 21%, 19%, 19%, 22%, and 23% in T1-T5, respectively. Euclidian distances were calculated between each odor types. The Euclidian distance during the 1-s period of 0.5 – 1.5 s after odor onset was assessed as mean distance between odor trial types.
Shuffle analysis.
Shuffle analysis was used to statistically evaluate the mean distances between odor types (Igarashi et al., 2014). Shuffle data were obtained by randomly shuffling the assignment of odor type for each trial while keeping the total number of each trial type same as the original real data. With this shuffling procedure, the distinct response to specific odor types observed in the original data disappeared (Extended Data Fig. 4g), producing randomly distributed spike responses in each odor trial type. Mean distance during the 1-s period of 0.5 – 1.5 s after odor onset was obtained for each shuffled data. This procedure was repeated 1000 times, producing 1000 distances for each odor pair. Upper 95th percentile of 1000 distances from each odor pair were averaged and used as a threshold for the statistical assessment.
Similarity index.
A mean shuffle distance was obtained by averaging the shuffle distance across T1 – T5. A similarity index (SI) was calculated as the difference between real and mean shuffled distance, normalized by the mean shuffled distance:
The numerator of SI was negatively flipped so that SI becomes positive if the distance obtained from a given odor pair was smaller than shuffle distance (overlapped representations of two odors), and negative if the distance was larger than shuffle distance (separated representations of two odors).
Bootstrapping analysis.
The change of SI during associative learning was compared using the bootstrapping method34. Briefly, PCA was performed from a resampled neuronal population, and this procedure was repeated 1000 times to make 1000 bootstraps. SI was calculated for each bootstrap, then SIs in T2 – T5 were subtracted by that in T1, to test if there is a significant distribution above or below zero. Distribution of difference with p<0.05 above or below zero was considered significant. The bootstraps were also compared between control and inhibition sessions.
Photometry data analysis.
Photometry signals were digitized at 1-kHz. The signals in each timepoint (Ft) were processed using the mean signal during the 1-s before cue onset (F0) and expressed as dF/F = (Ft – F0)/Ft, and then Gaussian filtered with a sigma of 200 ms. tdTomato signals were also processed. We did not observe any changes in tdTomato signals as in previous studies (Menegas et al., 2017). GCaMP signal is shown in z-score by normalizing dF/F using the dF/F in the 1s period before the cue onset. Mean GCaMP signal was calculated for each odor trial type by averaging z-score during 0.5 – 3 s after cue onset.
Similarity Index for photometry data was calculated the same as Similarity Index for spike data, but instead using the absolute difference in mean GCaMP signal between odor trial types. An absolute difference for shuffle GCaMP signal was obtained by shuffling the trial types within a session. Similarity index (SI) was calculated as:
Histology and Reconstruction of Recording Positions
Electrode positions.
Recording positions were confirmed by anesthetizing the drive-implanted mice using isoflurane and inducing small electrolytic lesions by passing current (10 μA for 20 s) through the electrodes. Immediately after this, the mice received an overdose of isoflurane and were perfused intracardially with saline followed by 4% freshly depolymerized paraformaldehyde in phosphate buffer (PFA). The brains were extracted and stored in the same fixative overnight. After 24h cryoprotection in phosphate buffer saline with 30% sucrose at 4°C, tissue samples were embedded in O.C.T. mounting medium and coronal sections (40 μm) were cut. All tetrodes were identified, and the tip of each electrode was found by comparison with adjacent sections. Only data from tetrodes in the LEC was collected for analysis. Note that electrical lesions often made tip holes in the brain section larger, so that they spanned across cell layers.
Immunostaining.
Sections were rinsed 3 times for 10 min in 1 x PBS (pH 7.6) at room temperature, then preincubated for 1 hr in 10% normal goat serum in PBST (1 x PBS with 0.5% Triton X-100). Between incubation steps, sections were rinsed in PBST. Sections were incubated with antibodies against tyrosine hydroxylase, raised in rabbit (MB152, Millipore, 1:1000), GFP, raised in chicken (GFP1010, Aveslab, 1:1000), Reelin, raised in mouse (MAB5364, Millipore, 1:1000), or Calbindin, raised in rabbit (300, Swant, 1:1000) for 24 hr in antibody-blocking buffer at 4°C. After three 15 min washes in PBST at room temperature, sections were incubated in a goat anti-rabbit antibody conjugated with Alexa Fluor 488nm (ab150077, Abcam, 1:250), goat anti-chicken antibody conjugated with Alexa Fluor 488nm (A11039, Invitrogen, 1:250), or goat anti-mouse antibody conjugated with Alexa Fluor 488nm (A-11001, Thermo Fisher, 1:250) for 2 hr at room temperature. After rinsing in PBS, sections were mounted onto glass slides with 40, 60-diamidino-2-phenylindole (DAPI)-containing Vectashield mounting medium (Vector Laboratories), and a coverslip was applied. Digital photomicrographs were acquired with an Olympus BX53 fluorescence microscope equipped with a digital camera.
Fluorescent in situ hybridization with immunostaining.
After perfusion, brains from Sim1-Cre mice injected with AAV-DIO-mCherry into the LEC were cryoprotected in RNase-free phosphate buffer saline with 30% sucrose after the perfusion. The tissue samples were sliced into coronal sections (20 μm). The sections were rinsed in PBS and 0.1 M phosphate buffer, mounted on glass slides, and dried overnight in a vacuum desiccator. Digoxigenin (DIG)-labeled RNA probe against D1R mRNA was prepared using an in vitro transcription kit (11175025910, Roche) according to the manufacturer’s protocol with a plasmid kindly provided by Dr. Kazuto Kobayashi35. The dried sections were fixed in 4% PFA, digested using proteinase K (10 μg/mL) for 30 min, and post-fixed in 4% PFA for 15 min. After prehybridization, the sections were incubated overnight at 65 °C with DIG-labelled RNA probe. After stringent washing, the sections were incubated in 1% blocking buffer (11096176001, Roche) for 1 h. The sections were then incubated with an anti-DIG antibody conjugated with peroxidase (11207733910, Roche, 1:500) for 1 h at room temperature. After three 10-min washes in TNT (0.1 M Tris-HCl [pH 7.5], 0.15 M NaCl, 0.1% Tween 20), the sections were treated with diluted Tyramide Signal Amplification (TSA)-Plus fluorescein reagents for 10 min according to the manufacturer’s instructions (NEL741001KT, Perkin-Elmer, 1:100). Subsequently, the sections were washed in TNT three times for 10 min each, and incubated with primary antibody against mCherry (AB8181, Origene, 1:1000) at 4°C overnight. The sections were washed three times in TNT and incubated with an Alexa Fluor 594-conjugated secondary antibody (705–585-003, Jackson ImmunoResearch Labs, 1:500) for 2 h. After three 10-min washes in TNT, the sections were counterstained with DAPI diluted in PBS (1 μg/mL) for 5 min. After washing in PBS, the sections were mounted in PermaFluor (Thermo Fisher Scientific). Digital photomicrographs were acquired with an Olympus BX51WI fluorescence microscope equipped with a digital camera.
Cell counting.
The degree of labeled neurons from Sim1+ population in layer 2a and Wfs1+ population in layer 2b was evaluated by injecting AAV-DIO-mCherry in Sim1-Cre and Wfs1-Cre mice at the LEC followed by reelin and calbindin immunostaining. Using CellSens software (Olympus), we manually counted the labeled neurons in the 500μm × 500μm block below the rhinal sulcus. Four blocks representing the recorded areas in LEC were taken from each hemisphere spanning 2.8 – 4.2 mm posterior to Bregma. Data from sixteen blocks from two mice were used for analysis. The same approach was applied to evaluate the dopaminergic population from VTA and SNc that project to the LEC. Cholera toxin B (CTB) was injected in the LEC to trace dopaminergic fibers projecting to the LEC in retrograde fashion, followed by tyrosine hydroxylase immunostaining. Three to four 500μm × 500μm block images representing the VTA and SNc were taken from each hemisphere spanning 3.0 – 4.0 mm posterior to Bregma. Data from twenty-two blocks from three mice were used for analysis.
Statistics and Reproducibility
Data are shown with ± standard error. The animal numbers and sampled neuron numbers (biological replicates) were designed to achieve a power of more than 0.8. Both sexes of animals, randomized and blinded analyses were used. For statistical testing, data were first tested for normal distribution using the Kolmogorov-Smirnov test (p<0.05 cut-off). All statistical methods used are summarized in Supplementary Table 1 and were two-sided.
Histological experiments was repeated independently in difference mice with similar results for Fig. 1b–c (n = 12), Fig. 3a–b (n=5), Fig. 3c (n=11), Fig. 3d (n=2), Extended Data Fig. 2b (n=2), and Extended Data Fig. 8e (n=3).
Data and code availability
Neurophysiological data generated in this study are available upon request, and will be deposited with a subsequent protocol paper.
Extended Data
Extended Data Figure 1 |. Histological validation of implanted sites.
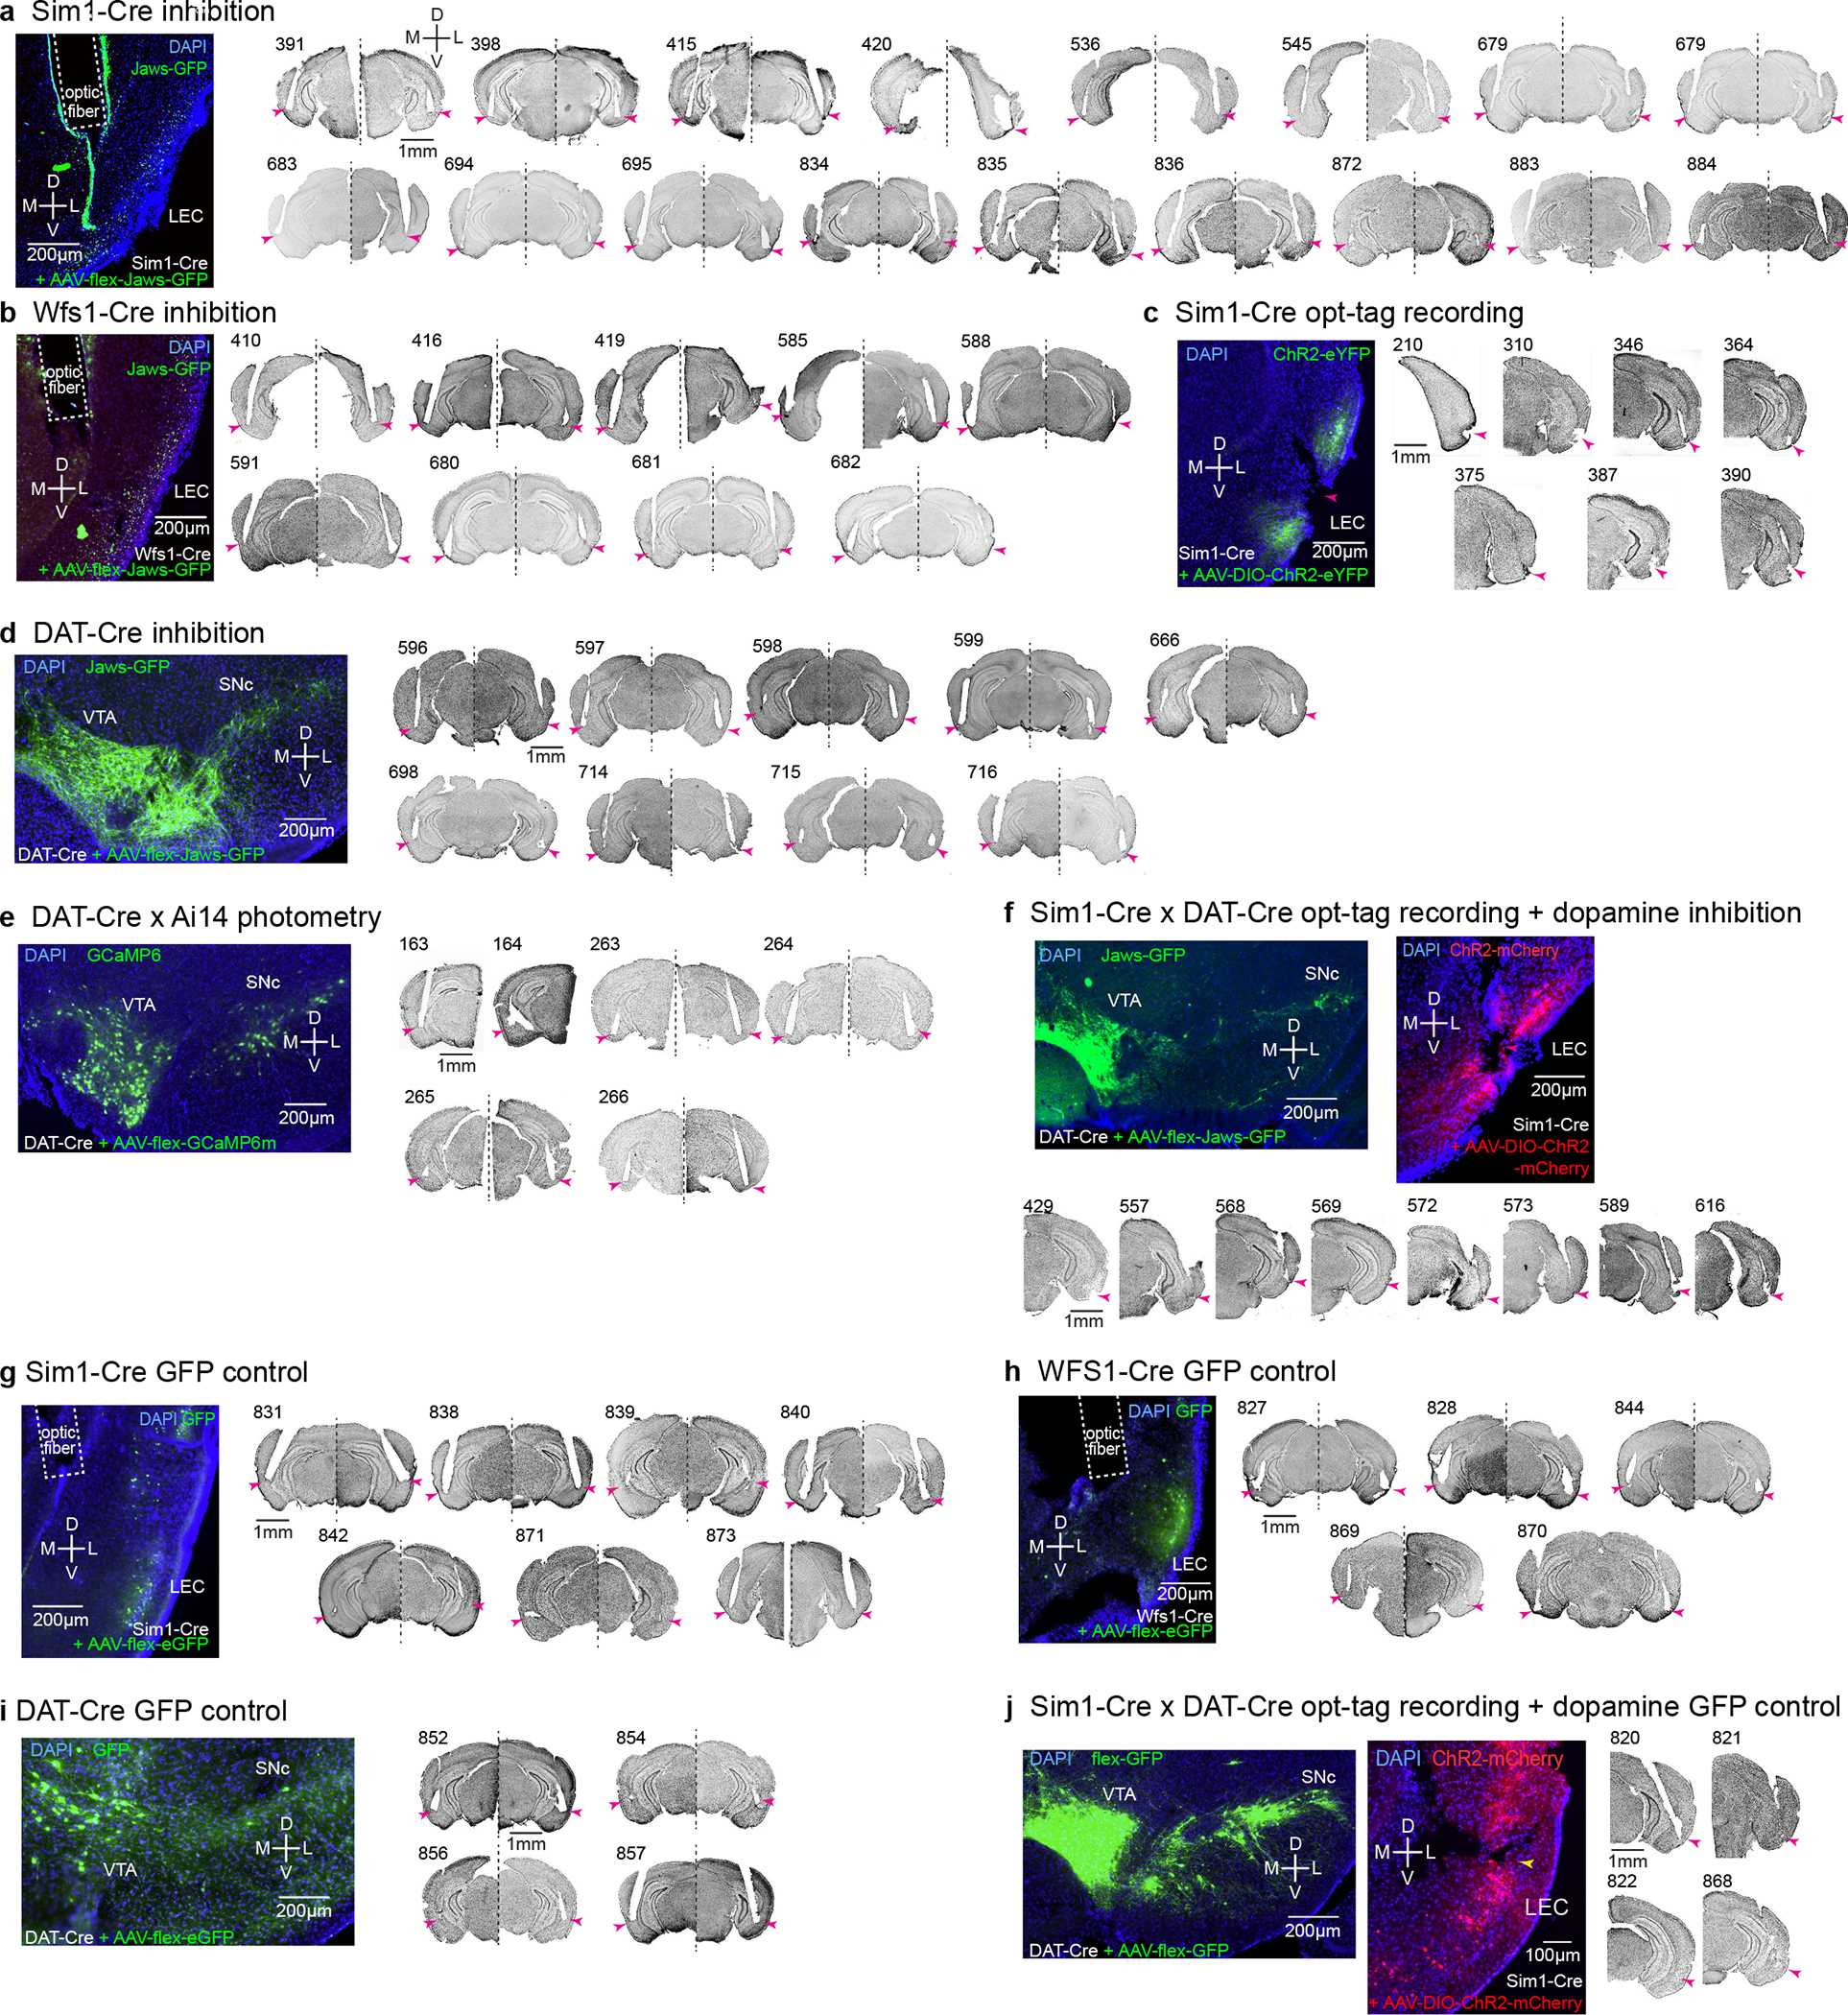
(a) Optic fiber positions in the LEC of Sim1-Cre mice injected with AAV-flex-Jaws-GFP for inhibition experiments. Arrowhead, the tip of optic fibers. D, dorsal, V, ventral, M, medial, L, lateral.
(b) Optic fiber positions in the LEC of Wfs1-Cre mice for inhibition experiment of Wfs1-expresing pyramidal cells.
(c) Recording position in the superficial layer of LEC from Sim1-Cre mice for opt-tagging experiment. Note large lesions because of the electrical lesioning.
(d) Optic fiber positions in the LEC of DAT-Cre mice injected with AAV-flex-Jaws-GFP in the VTA/SNc for inhibition experiment.
(e) Optic fiber positions in the LEC of DAT-Cre x Ai14 mice for photometry experiment. Two mice received unilateral implantations and four mice received bilateral implantations.
(f) Recording position in the superficial layer of LEC from Sim1-Cre x DAT-Cre mice for opt-tagging + inhibition experiment.
(g) Optic fiber positions in the LEC of Sim1-Cre mice injected with AAV-flex-GFP for control inhibition experiment.
(h) Optic fiber positions in the LEC of Wfs1-Cre mice injected with AAV-flex-GFP for control inhibition experiment.
(i) Optic fiber positions in the LEC of DAT-Cre mice injected with AAV-flex-GFP at VTA and SNc for control inhibition experiment.
(j) Recording position in the superficial layer of LEC from Sim1-Cre x DAT-Cre mice for opt-tagging (ChR2-mCherry) + control inhibition (GFP) experiment.
Extended Data Figure 2 |. Performance of mice during associative learning.
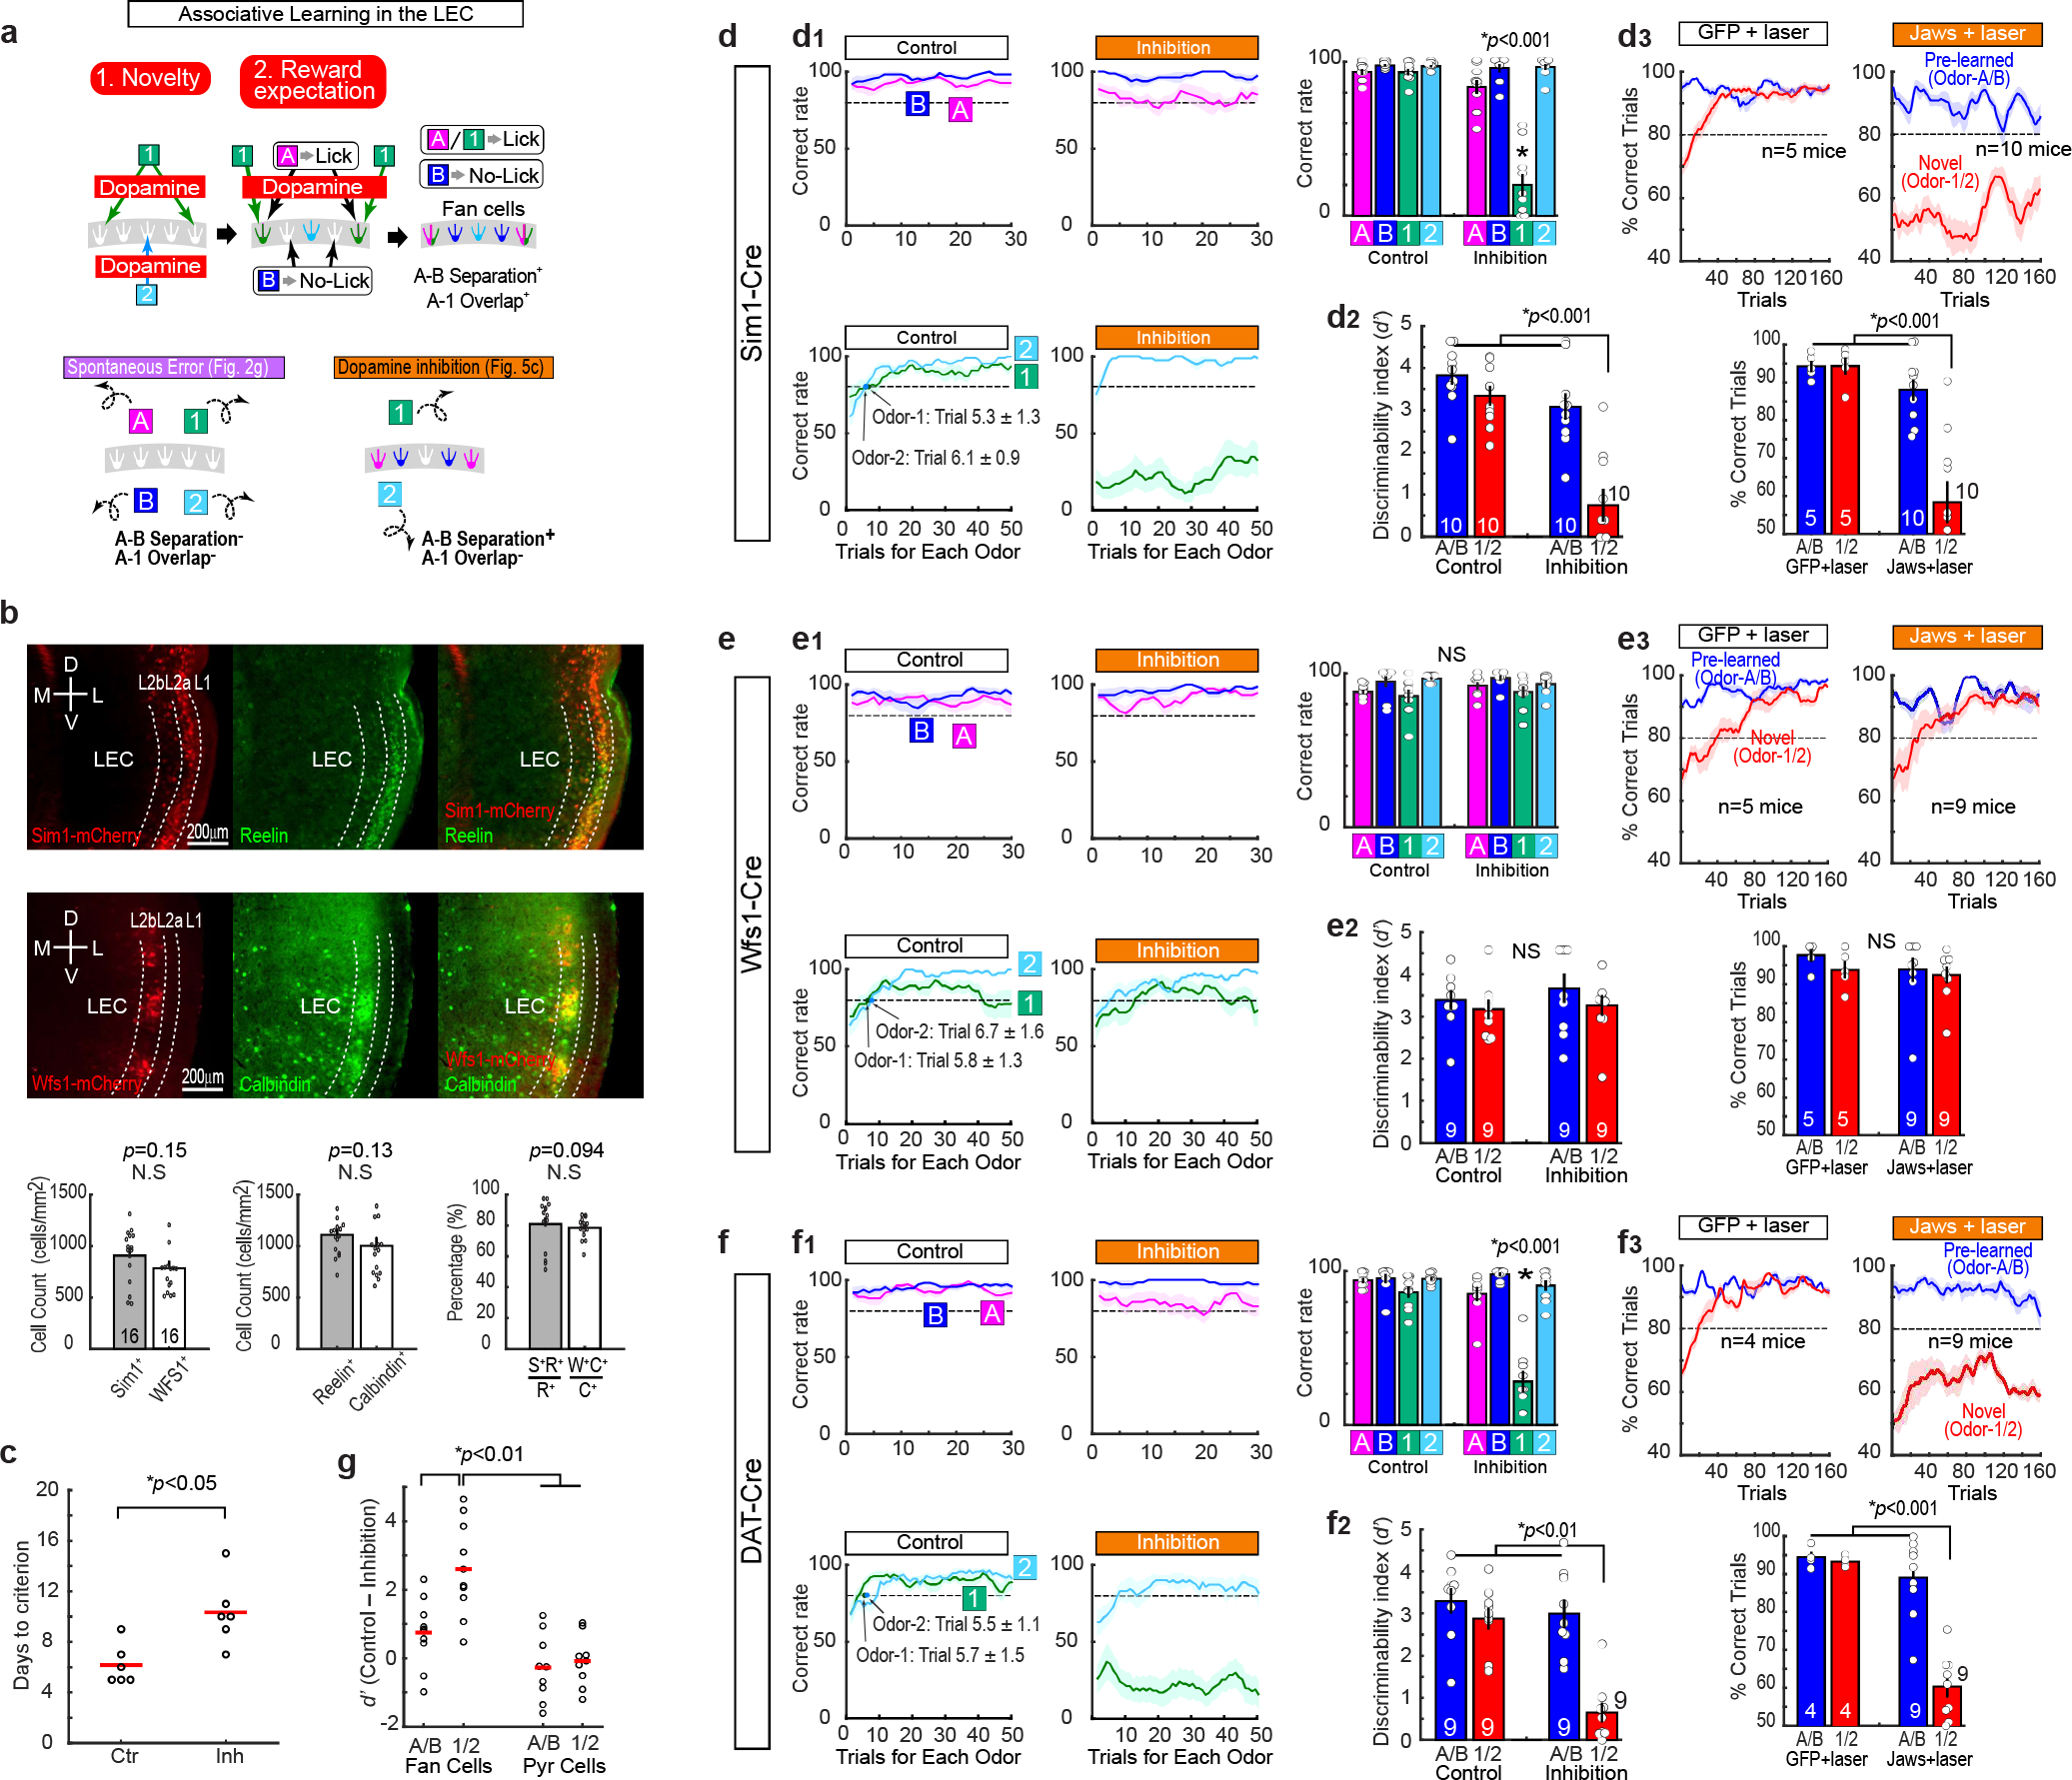
(a) A model for LEC dopamine and fan cells in associative learning. When novel cues are presented, LEC dopamine functions as a “detonator” of fan cell activity. Dopamine gradually supplies reward expectation signals only during rewarded Odor-A and Odor-1 trials, serving as a supervising signal so that Odor-A and Odor-1 are represented in the same fan cell population. Odor-B is represented by a fan cell population distinct from Odors-A/1, resulting in A-B separation. Novel unrewarded Odor-2 was not clearly represented in our recorded population. Two types of errors were observed in our study: The spontaneous error where A-B separation and A-1 overlap were both abolished (Fig.2g), and the error observed in the unilateral dopamine inhibition sessions where A-B separation was spared but A-1 overlap was abolished (Fig. 4c).
(b) Sim1 and Wfs1 population counts in the LEC. (Top) Reelin immunohistochemistry in Sim1-Cre mice injected with AAV-DIO-mCherry. D, dorsal, V, ventral, M, medial, L, lateral. (Middle) Calbindin immunohistochemistry in Wfs1-Cre mice injected with AAV-DIO-mCherry. (Bottom) From left, density of mCherry-positive neurons in Sim1-Cre and Wfs1-Cre mice, Reelin and Calbindin positive cells, and percentage of mCherry-labeled neurons. (p>0.05, Wilcoxon rank sum test; n = 16 sections obtained from n = 2 mice for each group).
(c) We performed an additional experiment to inhibit fan cells during the whole period of pre-learning with Odor-A and Odor-B (these animals are not included in the data in the main figures). After injecting Jaws in Sim1-Cre mice, A/B training was repeated (n = 6 GFP control mice and n = 6 Jaws inhibition mice). Days until animals reached criterion (three consecutive days of reaching 80%) were compared (p = 0.012, Wilcoxon rank sum test).
(d) Detailed performance of mice during fan cell inhibition.
(d1) Learning curves during control (left) and fan cell inhibition (middle) sessions. In these plots, the data shown in Fig. 1d were plotted for percent correct trials in each odor trial type as a function of trial number for each odor type. (Right) Performance of mice in the last 10 trials (p=6.1e-19, ANOVA; p= 6.0e-8, post-hoc Tukey test; n = 10 mice).
(d2) Performance of mice in trials 121–160 as in Fig. 1d, but assessed with discriminability index (D-prime) (p=3.1e-3, ANOVA; p= 1.2e-5 or better, post-hoc Tukey test; n = 10 mice).
(d3) We performed control experiment using Sim1-Cre mice injected with AAV-flex-GFP with laser (n = 5 mice). The GFP control experiment showed same result as no-laser control in Fig. 1d (p=0.0028, ANOVA; p= 3.1e-5 or better, post-hoc Tukey test; n = 5 GFP control mice; n = 10 Jaws inhibition mice).
(e) Same as (d), but for pyramidal cell inhibition in Wfs1-Cre mice in Fig. 2e (p>0.05, ANOVA; n = 5 GFP control mice; n = 9 Jaws inhibition mice).
(g) Same as (d), but for bilateral dopamine inhibition in DAT-Cre mice in Fig. 3e (p=0.0017, ANOVA; p= 2.0e-5 or better, post-hoc Tukey test; n = 4 GFP control mice; n = 9 Jaws inhibition mice).
(f) Difference of percent correct sessions between control and inhibition as in Fig. 1f, but plotted for discriminability index (D-prime) (p=0.019, ANOVA; p= 0.0021 or better, post-hoc Tukey test).
Extended Data Figure 3 |. Performance and spikes in Sim1-Cre mice.
a, Behavioral performance of mice used for fan cell opt-tag recording (Fig. 2).
(a1) Learning curves for Odor-A/Odor-B (blue) and Odor-1/Odor-2 (red) during correct sessions where mice acquired the association of Odors1/2 (Correct sessions, top left), and during error sessions where mice did not acquire the new association (Error sessions, top right). (Bottom left) Percent correct trials averaged for trials 121–160 for Odor-A/B trials and Odor-1/2 trials during correct and error sessions (p=6.5e-5, ANOVA; p= 1.7e-6 or better, post-hoc Tukey test; n = 10 mice). (Bottom right) Percent of correct and error sessions.
(a2) Learning curves during correct (left) and error (middle) sessions. In these plots, the data shown in (a1) were plotted for percent correct trials in each odor trial type as a function of trial number for each odor type. (Right) Performance of mice in the last 10 trials (p=3.3e-8, ANOVA; p= 0.001 or better, post-hoc Tukey test; n = 10 mice).
(a3) Performance of mice in trials 121–160 as in (a1), but assessed with discriminability index (D-prime) (p=1.5e-4, ANOVA; p= 6.4e-6 or better, post-hoc Tukey test; n = 10 mice).
b, A representative fan cell shown in Fig. 2b. (Right) Firing frequency in Trials 1 – 10 was plotted. Mean firing frequencies during 0.5 – 1.5 s after cue onset in each trial are shown in the bar graph.
c-e, Three additional example fan cells that fired to Odor-1. These cells showed high firing frequency to Odor-1 within 10 trials.
f, Mean firing frequency to each odor in trials 1 – 10 in T1. Fan cells showed larger firing frequency to Odor-1 than to other odors starting from trial 2 (n = 213 cells, p=4.1e-30, ANOVA; p<0.05 or better, post-hoc Tukey test).
Extended Data Figure 4 |. Spike properties of fan cells in Sim1-Cre mice.
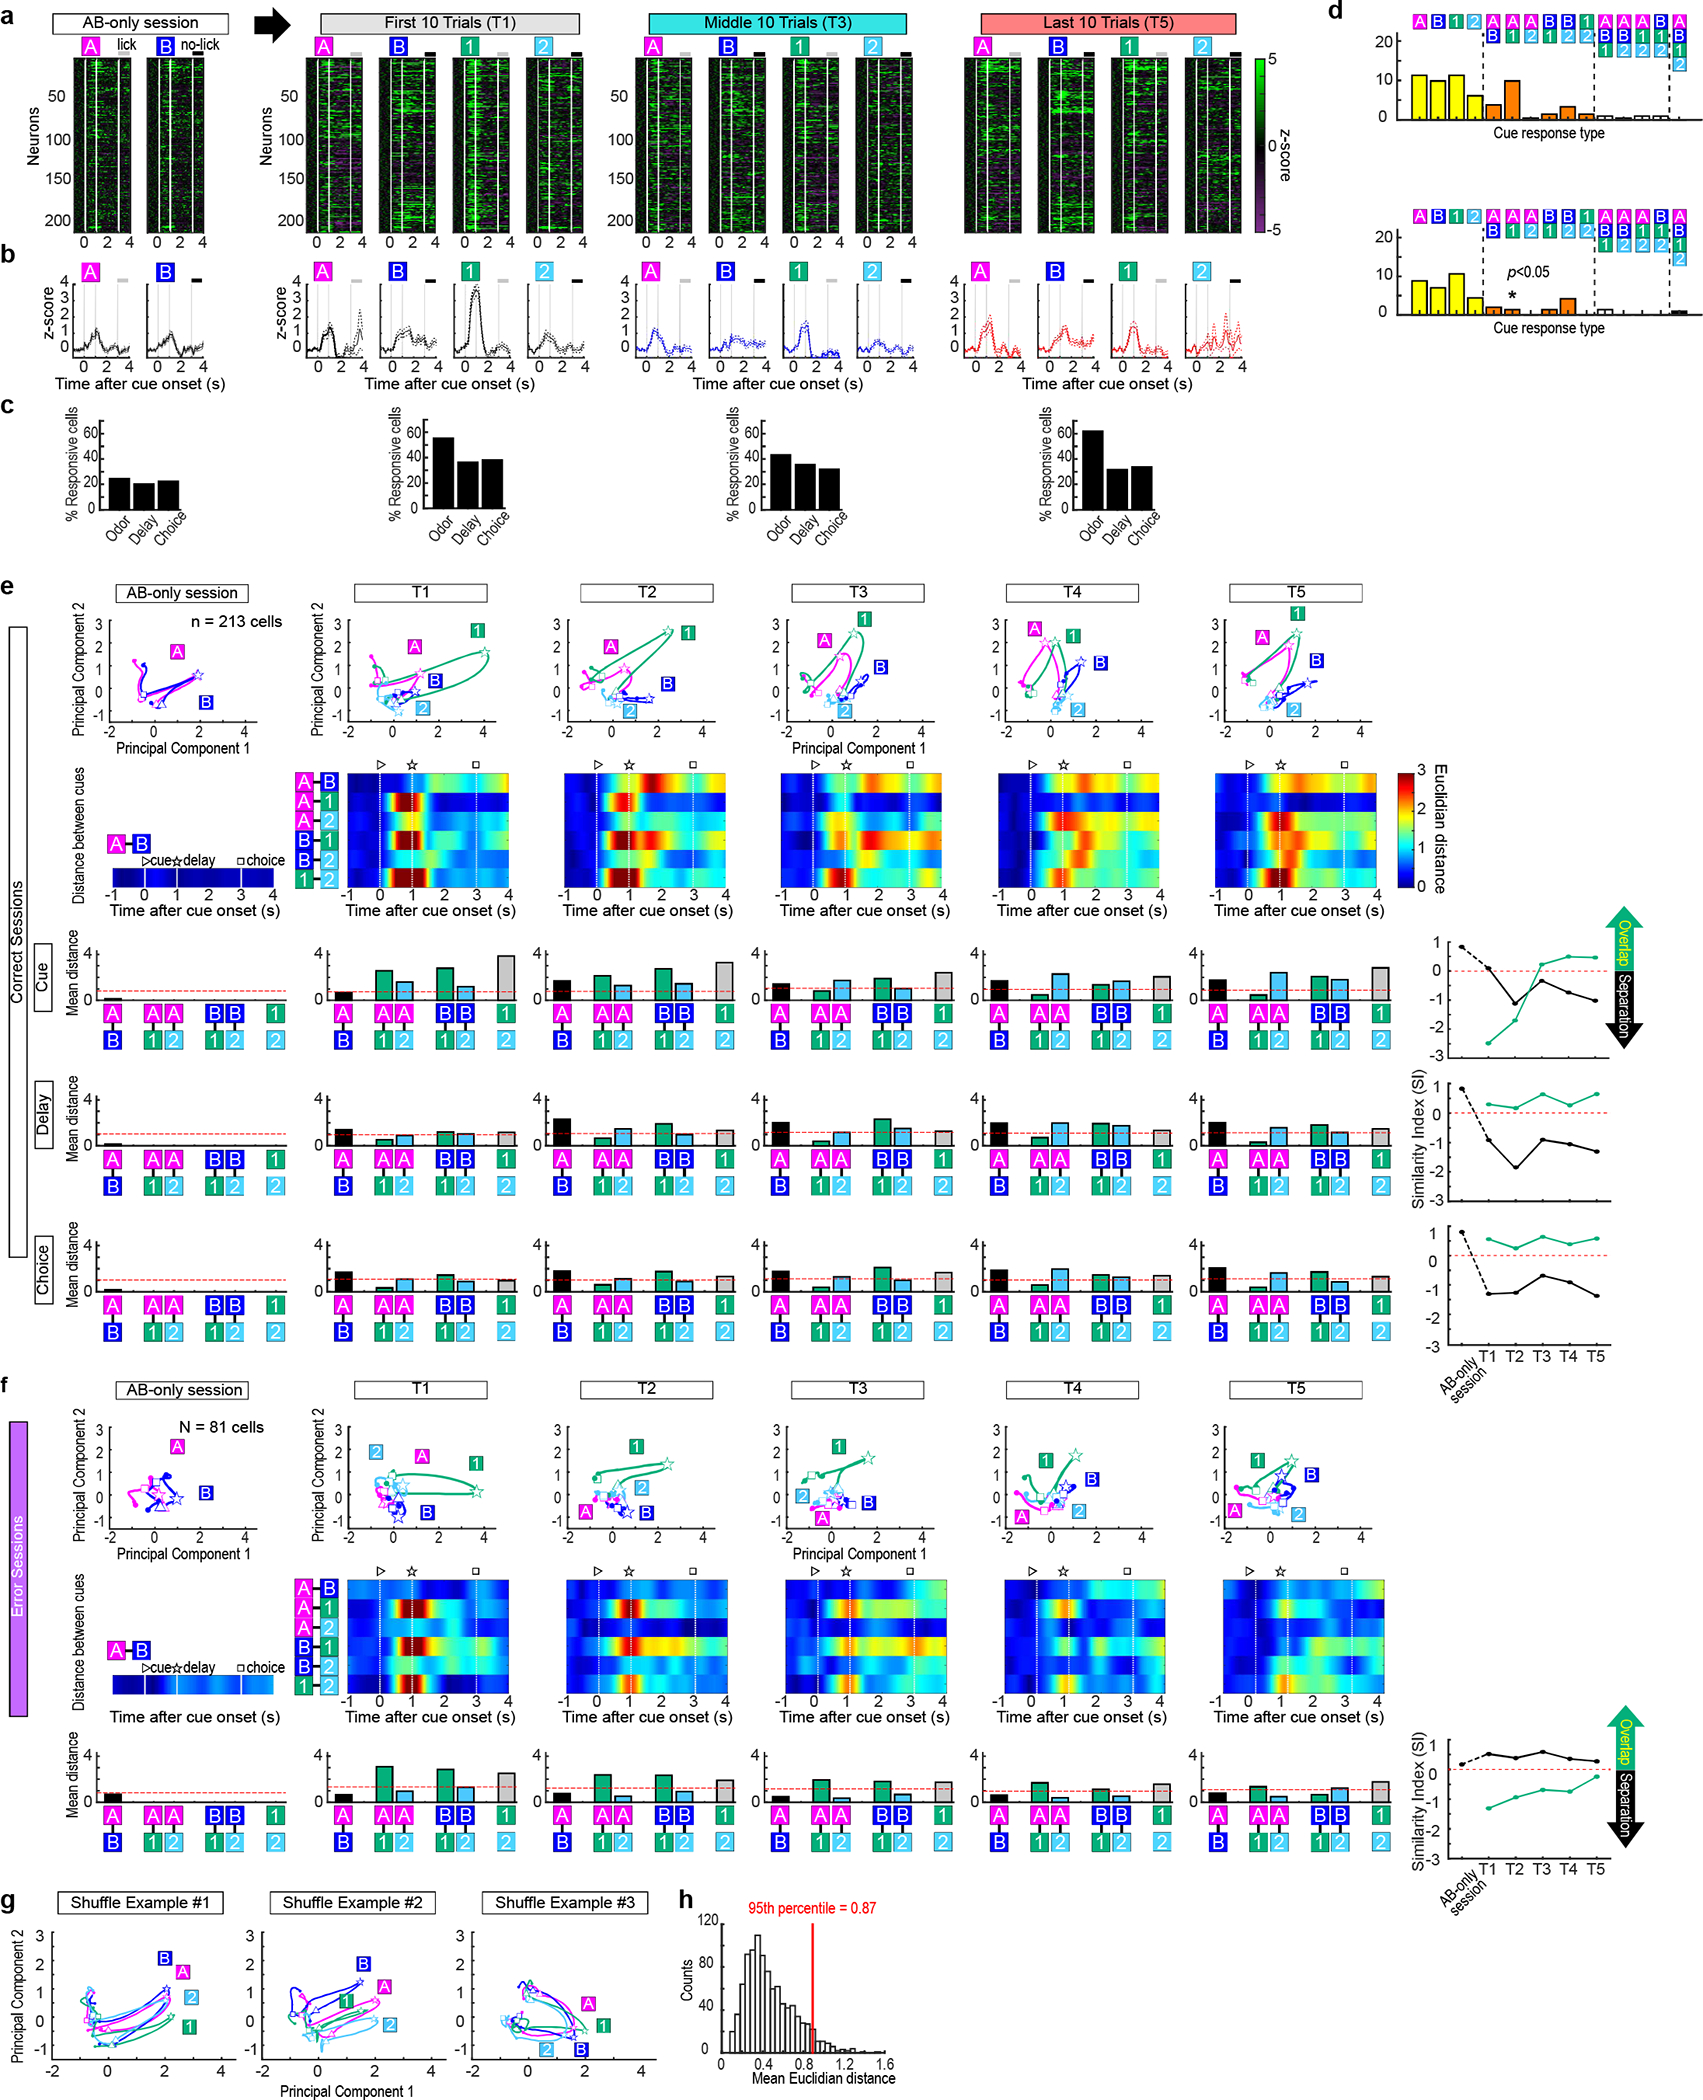
(a) – (c), spike properties of fan cells. Fan cells were recorded in a session with Odor-A and Odor-B (AB session). After ~20 trials in AB session, associative learning (AB12) session was tested (T1-T5). T5 in error sessions is also shown.
(a) Spike firing of 213 fan cells. Mean spike activity was averaged in 50 ms bins and shown in z-score compared with −1 – 0 s before odor onset. In this panel, cells were sorted using a cluster analysis of firing property in T5.
(b) Mean firing rate of 213 fan cells shown in z-score.
(c) Percent responsive cells in periods of 0.5–1.5 s (odor), 2–3 s (delay) and 3–4 s (choice) after odor onset. Neurons with significant firing during each period were counted (Wilcoxon signed-rank test, p<0.05).
(d) Percent responsive cells in correct T5 (top) and error T5 (bottom). Neurons with significant firing during 0.5–1.5 s after odor onset were counted (Wilcoxon signed-rank test, p<0.05). Asterisk denotes lower percentage of A-1 responsive cells in error T5 than that in correct T5 (p<0.05, chi-square test; p<0.05 for A-1 cells, post-hoc residual test with false discovery rate correction for multiple comparisons).
(e) Trajectories of neural firing of fan cell population (top), Euclidian distance between odor trial types (middle) and mean Euclidian distance and Similarity Index during 0.5–1.5 s after odor onset (cue period) for timepoints T1 – T5 of correct sessions (bottom). Ninety-fifth percentile distance obtained from shuffled data denotes significant distance (red line). Data during 2–3 s (delay) and 3–4 s (choice) after odor onset were also plotted.
(f) Same as (e), but for error sessions where mice did not learn new associations.
(g) Example trajectories obtained from shuffling analysis. Trajectories of neuronal data obtained from three shuffled data in correct T5 sessions are shown.
(h) Distribution of mean Euclidian distance obtained from shuffle data in correct T5. Distance obtained from six possible odor pairs were averaged and plotted. A 95th percentile of the distribution (red) was used for the cut-off indicating significant distance.
Extended Data Figure 5 |. Bootstrapping test for spike Similarity Index.
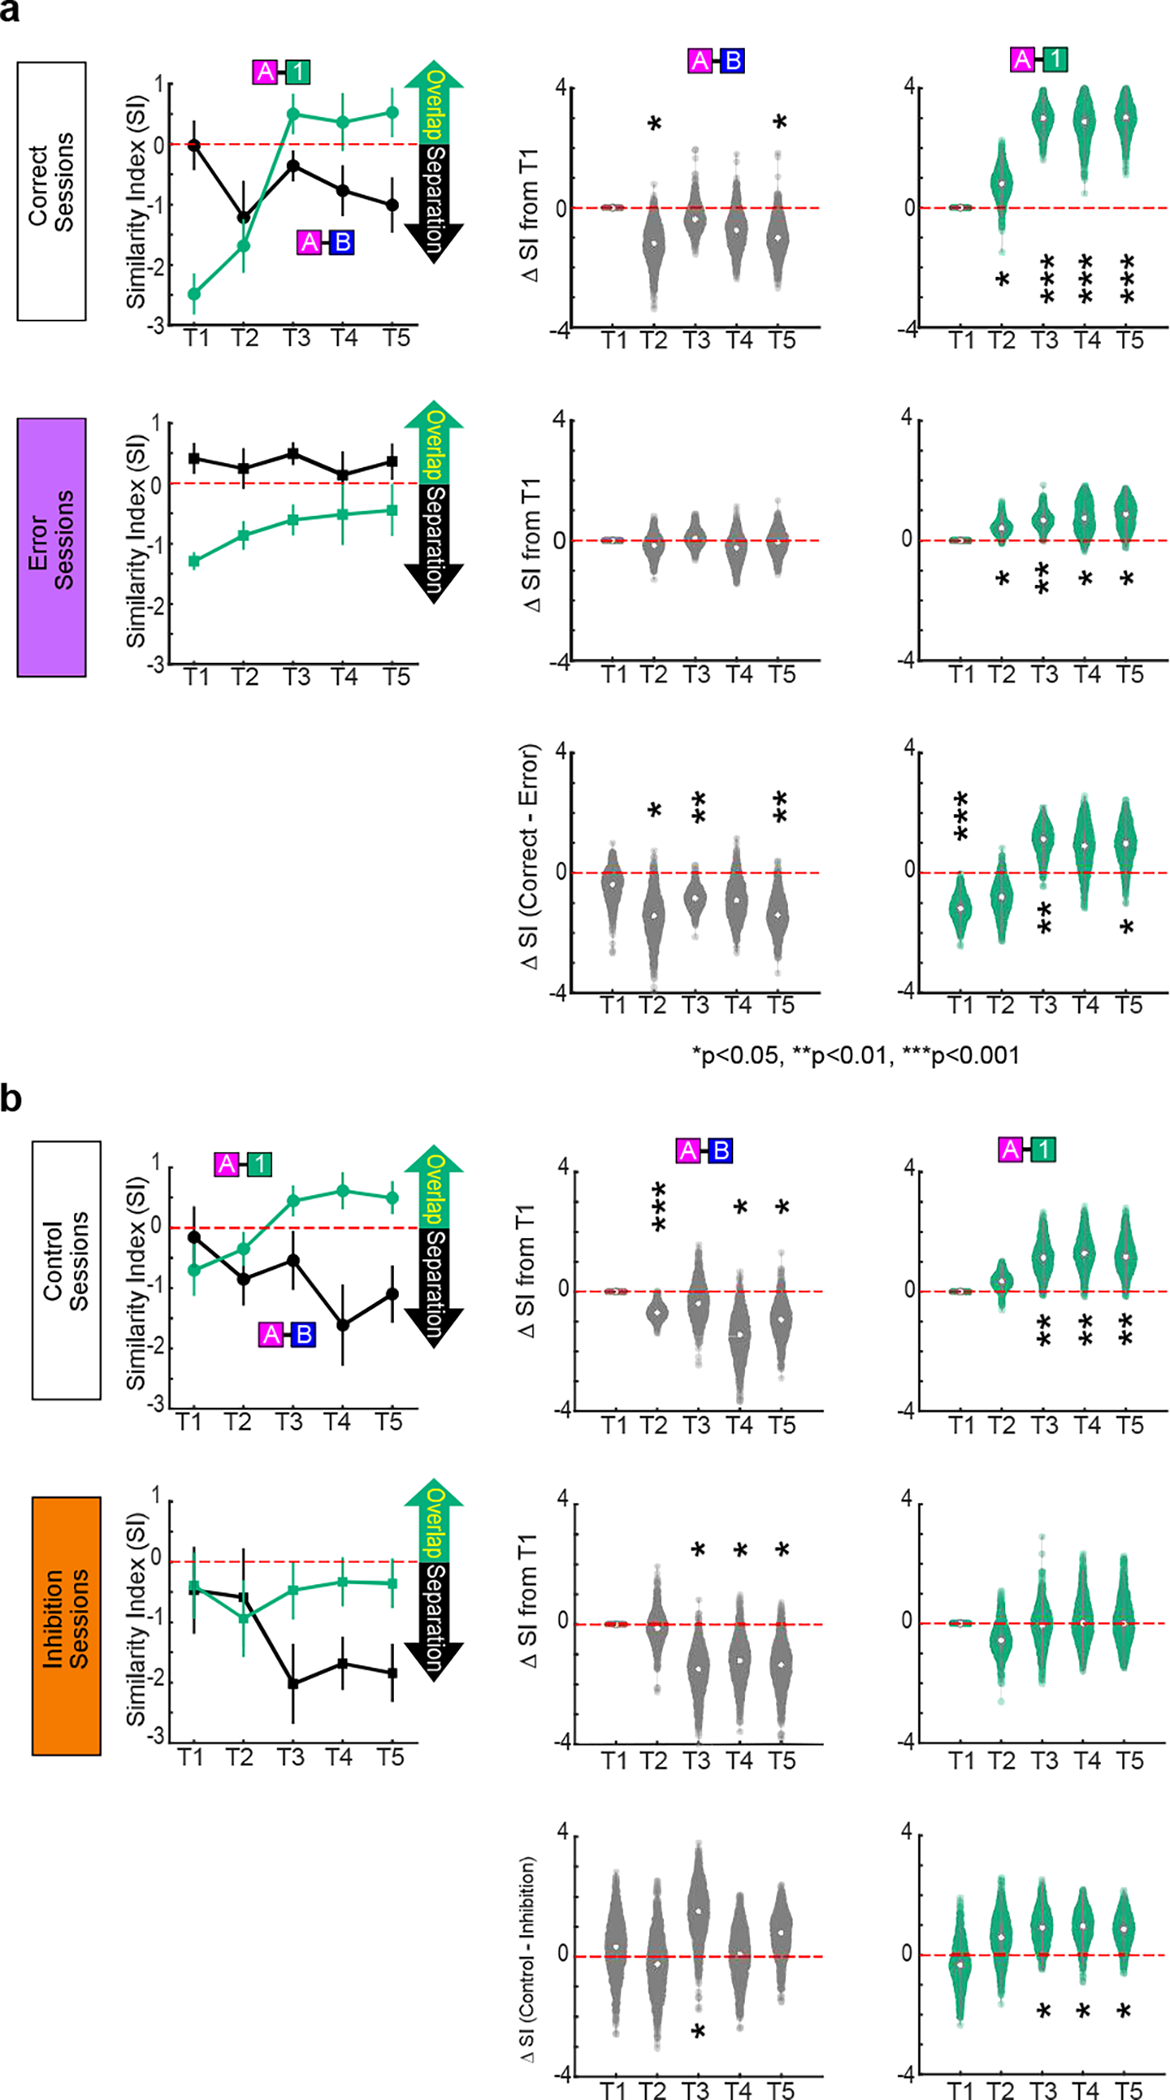
The change of Similarity Index (SI) during associative learning was compared using the bootstrapping method. PCA was performed from a resampled neuronal population, and this procedure was repeated 1000 times to make 1000 bootstraps. SI was calculated for each bootstrap, then SIs in T2 – T5 were subtracted by that in T1, to test if there was a significant distribution above or below zero.
(a) (Top) In correct sessions in Fig. 2, SI for Odors A-B showed significant decrease in T5 compared to T1 (p =0.039) whereas SI for Odors A-1 increased (p =1.2e-10), confirming A-B separation and A-1 overlap. (Middle) In the error sessions, no A-B separation was observed (p>0.05). Although A-1 distance decreased during the session (p<0.05), SIAB stayed in negative values. (Bottom) The subtraction of bootstraps in error session from correct sessions confirms the difference in A-1 overlap (p<0.05 in T3 and T5, right). *p<0.05, **p<0.01, ***p<0.001; n = 1000, bootstrapping test.
(b) (Top) In dopamine control sessions, SI for Odors A-B showed significant decrease in T5 compared to T1 (p =0.044) whereas SI for Odors A-1 increased (p =0.0082), confirming A-B separation and A-1 overlap. (Middle) In the unilateral inhibition sessions, although A-B separation was observed (p<0.05), no A-1 overlap was observed (p>0.05). (Bottom) The subtraction of bootstraps in inhibition session from control sessions confirms the effect of inhibition on A-1 overlap (p<0.05 in T3 – T5, right). These data suggest that dopamine plays a critical role in establishing A-1 overlapped representations. *p<0.05, **p<0.01, ***p<0.001; n = 1000, bootstrapping test.
Extended Data Figure 6 |. Additional principal component analyses.
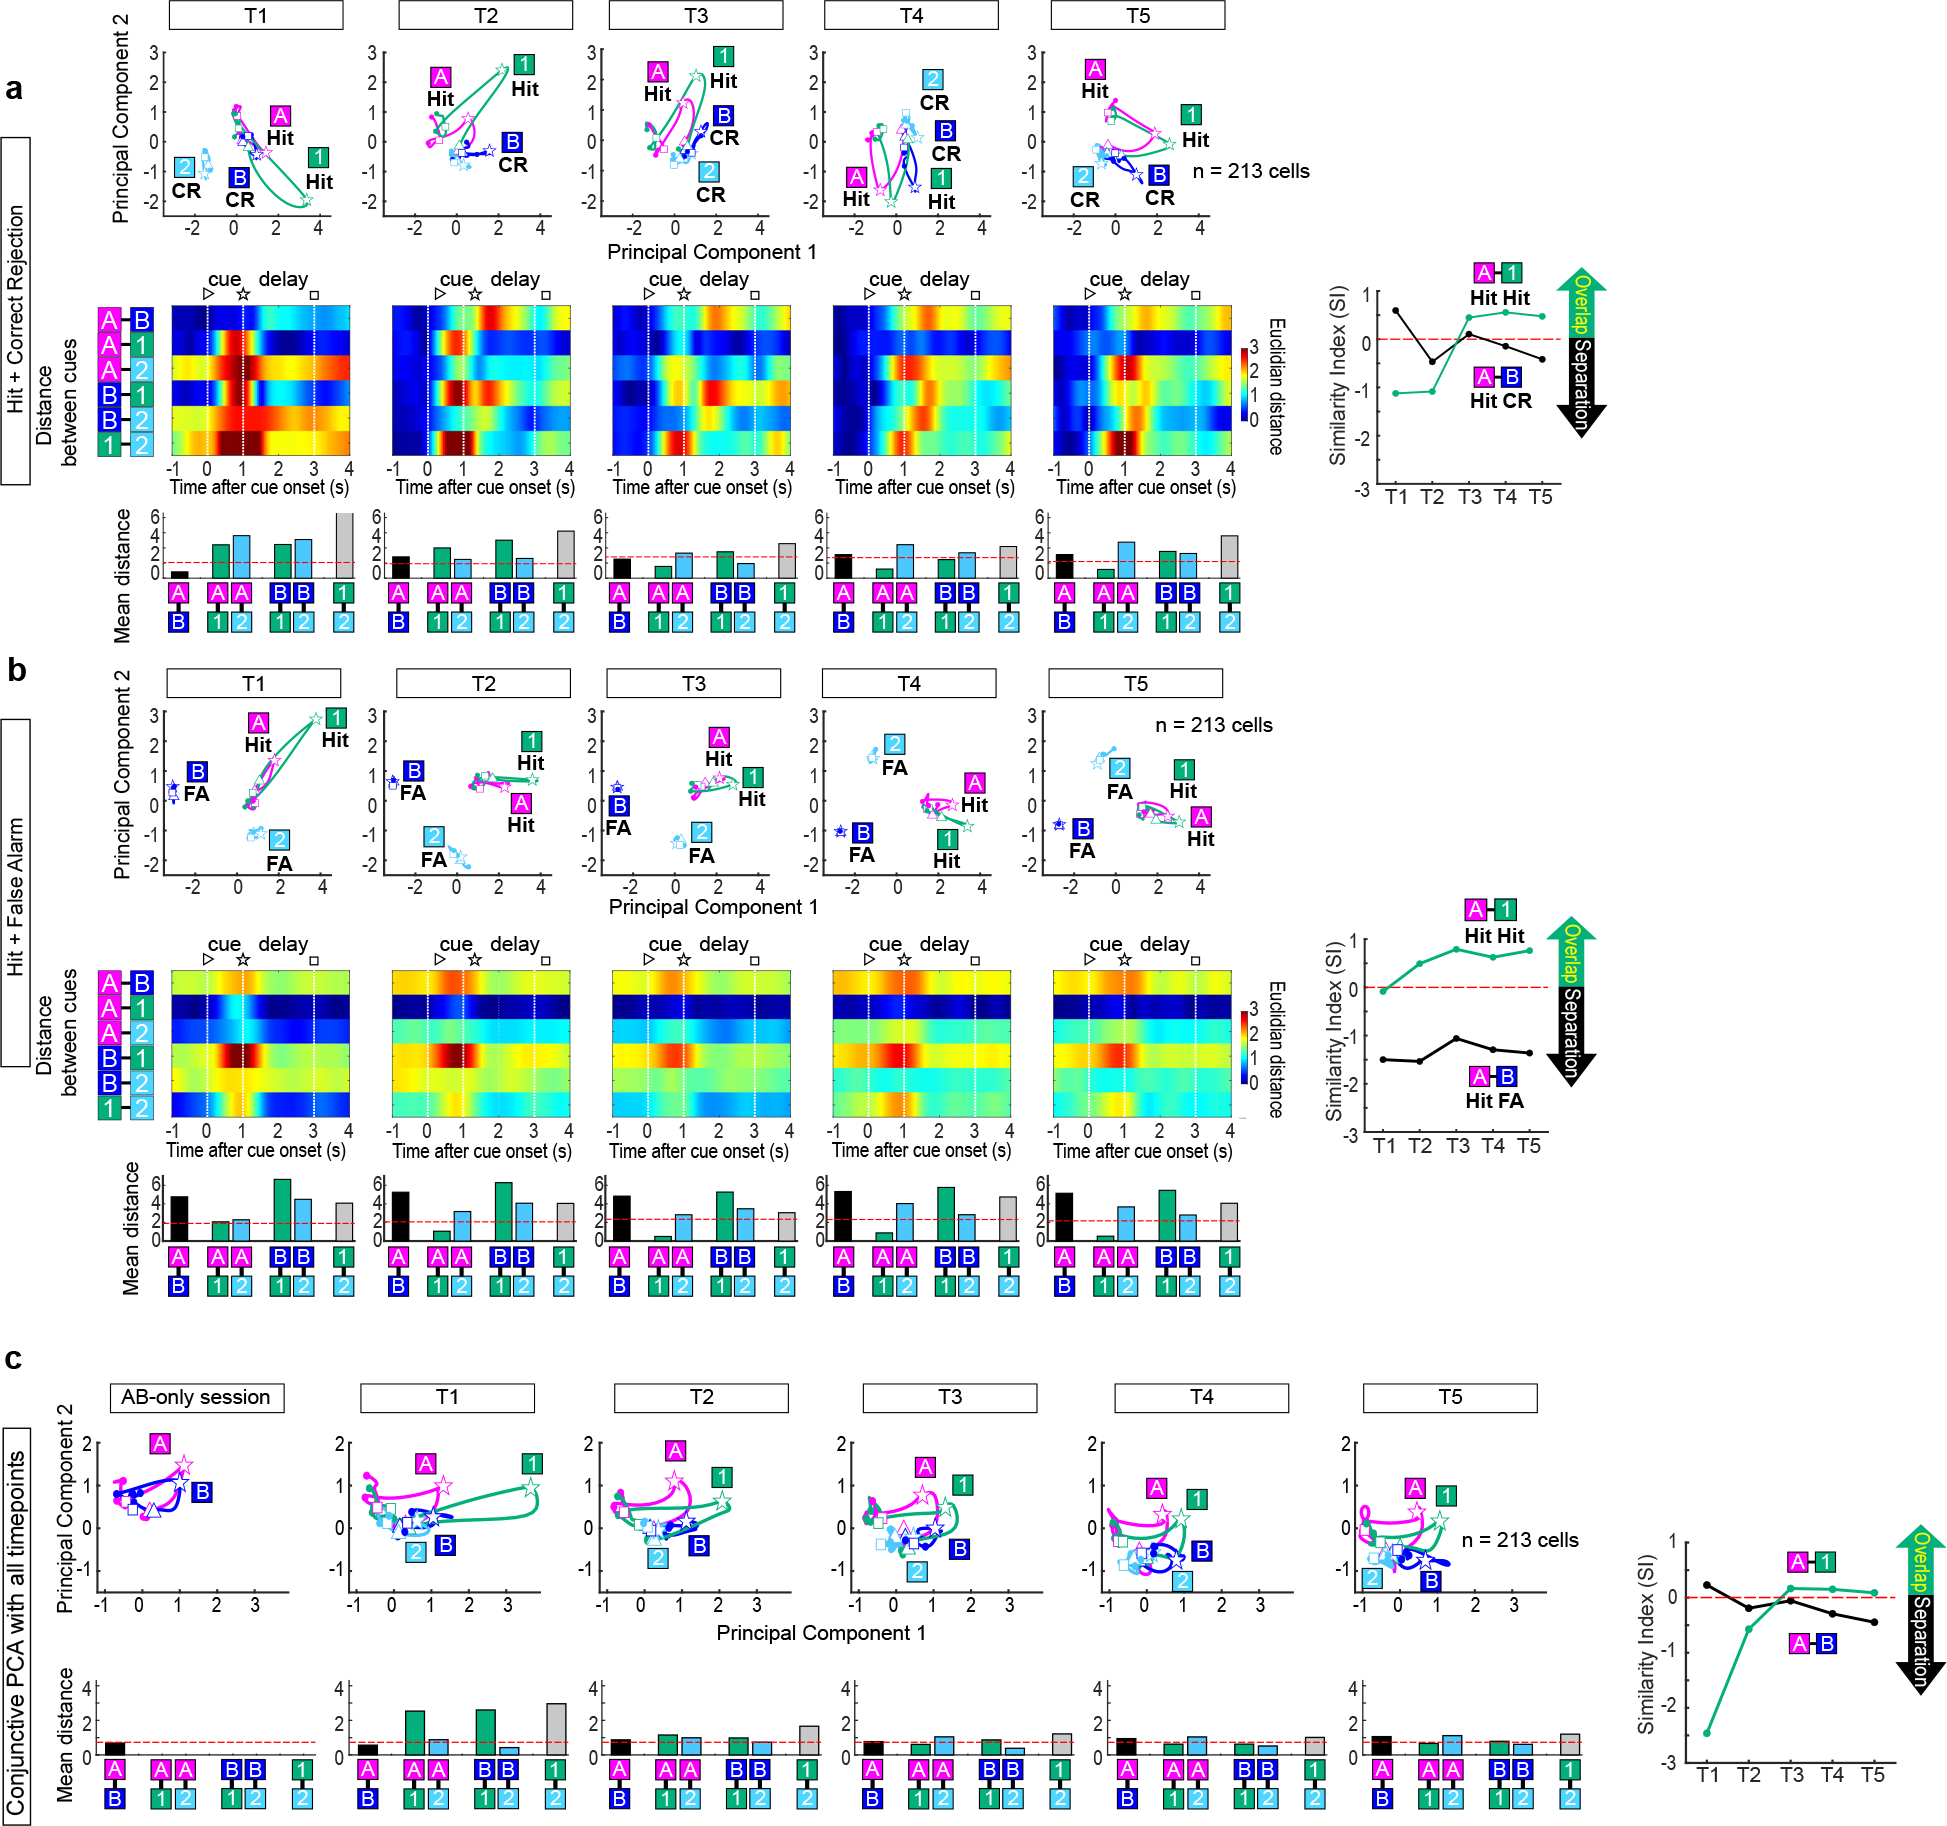
(a) Trajectories of neural firing of fan cell population using only correct (hit) trials for Odor-A and Odor-1 and correct rejection (CR) trials for Odor-B and Odor-2. The separation and overlap of fan cells were again observed when the incorrect trials were removed from the PC analysis.
(b) Trajectories of neural firing of fan cell population using only hit trials for Odor-A and Odor-1 and error lick (false alarm, FA) trials for Odor-B and Odor-2. Although all of them are trials in which mice made lick responses, similar overlapped representations between Odors-A and 1, and their separation from Odor-B were observed, suggesting that fan cells do not simply represent lick-related motor information.
(c) Principal component analysis (PCA) for 213 fan cells as in Fig. 2d, but using conjunctive PCA with data from all timepoints (AB-only, T1 – T5). The results show similar A-1 overlap and A-B separation as in Fig. 2d.
Extended Data Figure 7 |. Repeated associative learning using the same odor cues.
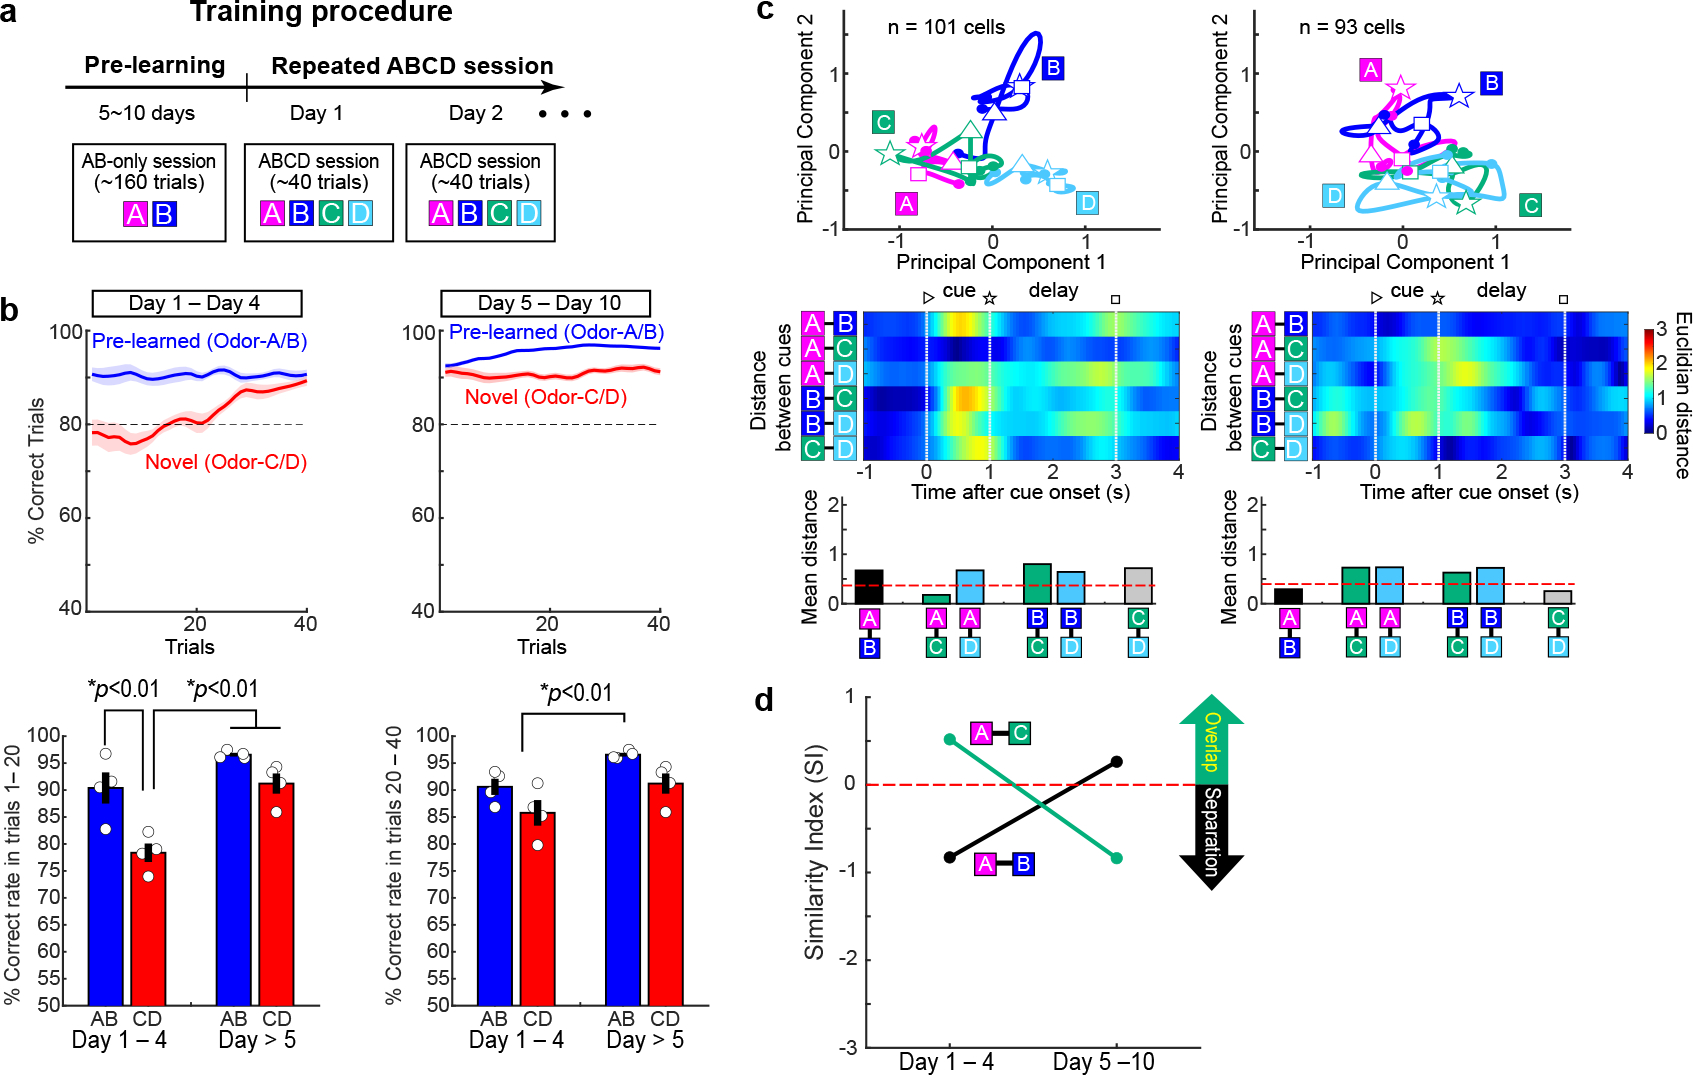
(a) To test the effect of repeated exposure to the same odor pair during associative learning, sessions with Odor-A, -B, -C and -D were repeated for 10 days in Sim1xDAT mice injected with AAV-flex-GFP (n = 4 mice, without laser).
(b) Learning curves between Day 1 – Day 4 and Day 5 – Day 10. In Day 1 – Day 4, animals gradually learned Odor-C and Odor-D as in the regular new association experiment with novel odor pairs. However, after Day 5, animals showed better performance for Odor-C and Odor-D from the initial trials. This was confirmed with increased correct rate for Odor-C/D on trials 1 – 20 in Day 5 – 10 compared to that in Day 1 – 4 (bottom left, p=3.5e-4, ANOVA with post-hoc Tukey test, p= 0.0025).
(c) Fan cell trajectories for Odor-A, -B, -C and -D in T5 during Day 1 – Day 4 (left, n=101 cells) and during Day 5 – 10 (right, n = 93 cells).
(d) Fan cells showed A-B separation and A-1 overlap in Day 1–4, but this representation disappeared after animals were overtrained. These results further support the idea that fan cells were needed only when new associative memory is formed.
Extended Data Figure 8 |. Properties of LEC dopamine inputs.
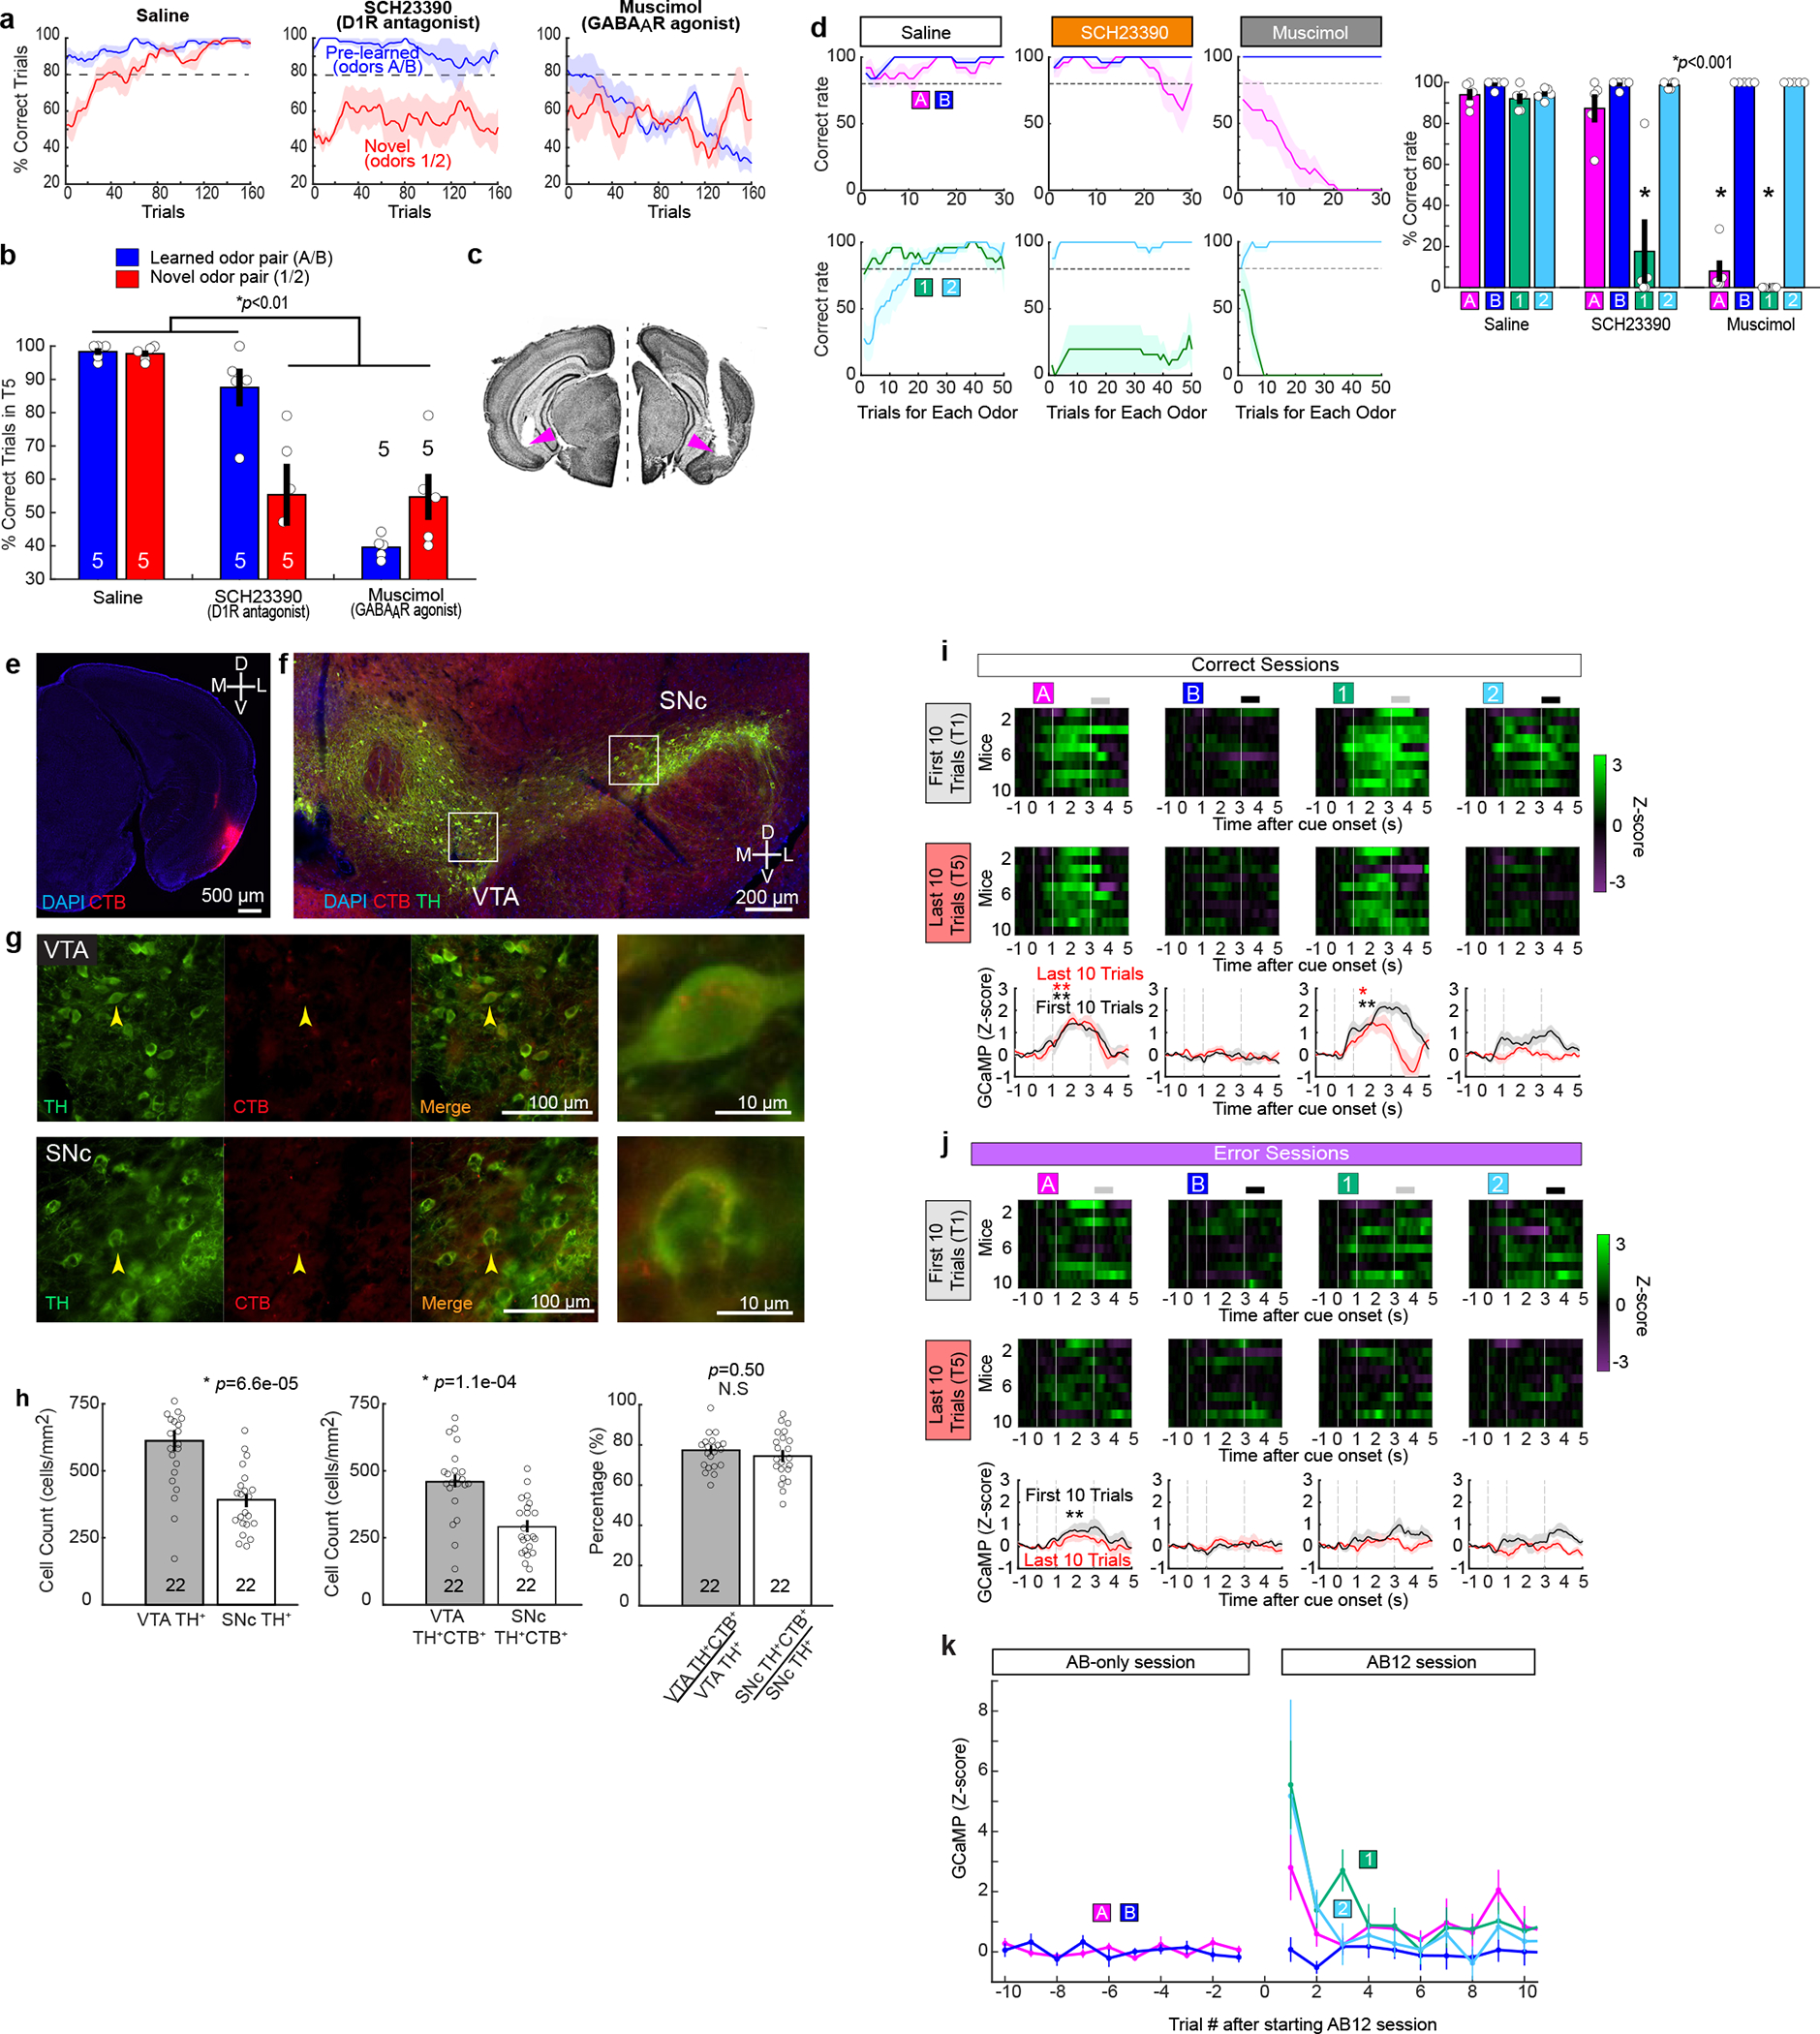
a-d, Pharmacological blockade experiments during associative learning. We performed a supplementary pharmacological experiment to validate the optogenetic inhibition experiments using dopamine D1 receptor antagonist SCH23390, or GABAA receptor agonist muscimol. SCH23390 bilateral injection abolished new learning of Odor-1 and Odor-2, while sparing the pre-learned association, replicating the result obtained from the optogenetic inhibition of dopamine fibers (Fig. 3e). Injection of muscimol impaired both the pre-learned association and acquisition of new association, implying an involvement of LEC neurons other than fan cells in the retrieval of pre-learned association.
(a) Learning curves during saline, SCH23390 and muscimol infusions.
(b) Percent correct sessions during trials 121 – 160 where mice correctly learned new association (p=6.1e-4, ANOVA; 0.0032 or better, post-hoc Tukey test; n = 5 mice)
(c) Example histology from cannula implantations.
(d) Learning curves during saline (left), SCH23390 (middle) and muscimol (right) sessions. In these plots, the data shown in (a) were plotted for percent correct trials in each odor trial type as a function of trial number for each odor type. (Right) Performance of mice in the last 10 trials (p=1.3e-15, ANOVA; p = 2.2e-7, post-hoc Tukey test; n = 5 mice).
e-h, Retrograde tracing of LEC dopaminergic fibers from VTA and SNc
(e) Coronal section of the right hemisphere including LEC, where the retrograde tracer cholera toxin B (CTB, red) was injected.
(f) Coronal section of the right hemisphere midbrain including VTA and SNc. Anti-tyrosine hydroxylase (TH, green) immunostaining reveals dopaminergic cells.
(g) Magnified windows from (f). Yellow arrows point to example cells expressing both TH and CTB, which are further magnified in the rightmost panels.
(h) From left, density of TH-expressing neurons in VTA and SNc, TH+CTB+ population between VTA and SNc, percentage of double-positive neurons among TH+ neurons. Although VTA has more cells for both TH+ and TH+CTB+ neurons (p<0.001, Wilcoxon rank sum test), the percentage of CTB+ neurons did not differ between VTA and SNc (p=0.50, Wilcoxon rank sum test; n = 22 sections obtained from n = 3 mice).
i-k, Calcium imaging of dopamine inputs.
(i) Calcium signals from individual hemisphere (n=10) during first 10 trials (T1, top) and last 10 trials (middle, T5) in correct sessions. Mean traces are shown at the bottom for T1 (black) and T5 (red). *p<0.05 and **p<0.01, Wilcoxon signed-rank test during 0.5 – 3 s after cue onset compared with 1-s pre-cue period.
(j) Same as (b), but for error sessions.
(k) Plot of GCaMP calcium signal as a function of trial number after starting AB12 session (n=10 hemispheres).
Extended Data Figure 9 |. Dopamine unilateral inhibition during fan cell recording.
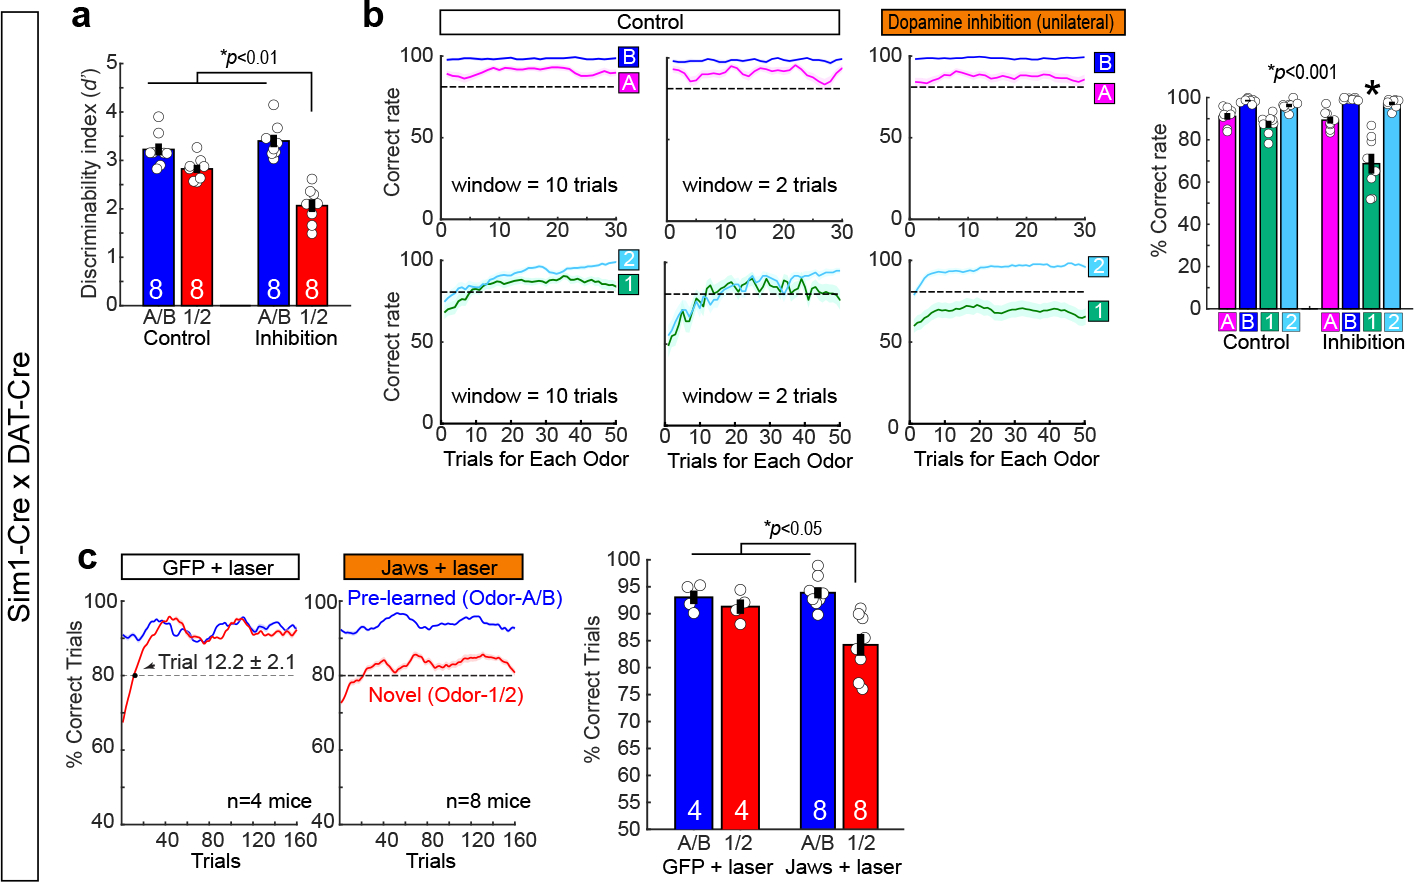
(a) Performance of mice during unilateral dopamine inhibition.
(Left) Performance of mice in trials 121–160 as in Fig. 4a, but assessed with discriminability index (D-prime) (p=5.1e-4, ANOVA; p=9.6e-3 or better, post-hoc Tukey test; n = 8 mice).
(Middle) Learning curves during control (left) and unilateral dopamine inhibition (right) sessions. In these plots, the data shown in Fig. 4a were plotted for percent correct trials in each odor trial type as a function of trial number for each odor type. Plot using 2-trial moving window is also shown for control sessions.
(Right) Performance of mice in the last 10 trials (p=6.5e-6, ANOVA; p= 0.046 or better, post-hoc Tukey test; n = 10 mice). In the unilateral dopamine inhibition experiments, each mouse (n = 8) had 10 – 16 inhibition sessions. Of them, percentage of correct sessions (i.e. #correct sessions/(#correct sessions + #error sessions) ) were 46.6%, 55.6%, 43.3%, 50.0%, 54.7%, 53.6%, 53.6%, and 42.8%.
(b) We performed control experiments using DAT-Cre mice injected with AAV-DIO-ChR2 and AAV-flex-GFP for unilateral opt-tagging and laser control (n = 4 mice). The GFP control experiment showed same result as no-laser control in Fig. 4a (p=0.035, ANOVA; p= 0.044 or better, post-hoc Tukey test; n = 4 GFP control mice; n = 8 Jaws inhibition mice).
Extended Data Figure 10 |. Firing property of fan cells during dopamine unilateral inhibition.
(a) Firing property of fan cells in the no-laser control sessions obtained from Sim1xDAT mice (n = 148 cells). (Top to bottom) Z-scored firing rates, mean firing rate, percent cells for each response type, PCA trajectories, Euclidian distance and mean Euclidian distance are shown as in Fig. 2d.
(b) Same as (a), but for fan cells during unilateral dopamine inhibition (n = 134 cells). Mean firing rates for Odor-A and Odor-1 were lower than control in T1 (p<0.05, Wilcoxon rank sum test). No difference was observed for the distribution of responsive type in T5 between control and inhibition (p=0.24, chi-square test).
(c) Trajectories, mean Euclidian distance and SI of fan cells as in Fig. 4b, but from GFP control animals (n=130 cells).
Supplementary Material
Acknowledgments:
We especially thank Drs. Naoshige Uchida and Mitsuko Watabe-Uchida for their mentorship, including generous support in setting up optogenetic recording and photometry experiments and providing discussions throughout the course of this project. We also thank Ryunosuke Amo and Hideyuki Matsumoto in the Uchida lab for their help setting up the behavior and photometry experiments, and Tomoko Viaclovsky, Allen Bramian and Marjan Savadkohighodjanaki in the Igarashi lab for technical assistance. We also thank Drs. Menno P. Witter, Alessandro Treves, Hiroshi T. Ito, Bruce McNaughton, Christine Gall and Gary Lynch for providing valuable comments on the work. We finally thank anonymous reviewers for their constructive comments that significantly heightened the paper.
Funding:
The work was supported by NIH R01 grants (R01MH121736, R01AG063864, R01AG066806), PRESTO grant from Japan Science and Technology Agency (JPMJPR1681), Brain Research Foundation Fay-Frank Seed Grant (BRFSG-2017–04), Whitehall Foundation Research Grant (2017–08-01), BrightFocus Foundation Research grant (A2019380S), Alzheimer’s Association Research Grant (AARG-17–532932) and New Vision Research Investigator Award (CCAD201902) to K.M.I.
H.J. was supported by the University of California, Irvine Medical Scientist Training Program (MSTP) (T32GM008620) and NIH F31 grant (1F31AG069500).
Footnotes
Competing interests: The authors declare that they have no competing financial interests.
Data, code and materials availability: Neurophysiological data and analytical codes are available upon request, will be deposited with a subsequent protocol paper.
REFERENCES
- 1.Schultz W, Dayan P & Montague PR A neural substrate of prediction and reward. Science 275, 1593–1599, doi: 10.1126/science.275.5306.1593 (1997). [DOI] [PubMed] [Google Scholar]
- 2.Watabe-Uchida M, Eshel N & Uchida N Neural Circuitry of Reward Prediction Error. Annu Rev Neurosci 40, 373–394, doi: 10.1146/annurev-neuro-072116-031109 (2017). [DOI] [PMC free article] [PubMed] [Google Scholar]
- 3.Scoville WB & Milner B Loss of recent memory after bilateral hippocampal lesions. Journal of neurology, neurosurgery, and psychiatry 20, 11–21 (1957). [DOI] [PMC free article] [PubMed] [Google Scholar]
- 4.Squire LR Memory and the hippocampus: a synthesis from findings with rats, monkeys, and humans. Psychological review 99, 195–231 (1992). [DOI] [PubMed] [Google Scholar]
- 5.Buzsaki G & Moser EI Memory, navigation and theta rhythm in the hippocampal-entorhinal system. Nature neuroscience 16, 130–138, doi: 10.1038/nn.3304 (2013). [DOI] [PMC free article] [PubMed] [Google Scholar]
- 6.Cohen JY, Haesler S, Vong L, Lowell BB & Uchida N Neuron-type-specific signals for reward and punishment in the ventral tegmental area. Nature 482, 85–88, doi: 10.1038/nature10754 (2012). [DOI] [PMC free article] [PubMed] [Google Scholar]
- 7.Witter MP & Amaral DG in The Rat Nervous System 3rd edn (ed. G Paxinos) (ed Paxinos G) (Elsevier, 2004). [Google Scholar]
- 8.Moser EI, Roudi Y, Witter MP, Kentros C, Bonhoeffer T & Moser MB Grid cells and cortical representation. Nat Rev Neurosci 15, 466–481, doi: 10.1038/nrn3766 (2014). [DOI] [PubMed] [Google Scholar]
- 9.Igarashi KM, Lu L, Colgin LL, Moser MB & Moser EI Coordination of entorhinal-hippocampal ensemble activity during associative learning. Nature 510, 143–147, doi: 10.1038/nature13162 (2014). [DOI] [PubMed] [Google Scholar]
- 10.Kitamura T, Pignatelli M, Suh J, Kohara K, Yoshiki A, Abe K & Tonegawa S Island cells control temporal association memory. Science 343, 896–901, doi: 10.1126/science.1244634 (2014). [DOI] [PMC free article] [PubMed] [Google Scholar]
- 11.Surmeli G, Marcu DC, McClure C, Garden DL, Pastoll H & Nolan MF Molecularly Defined Circuitry Reveals Input-Output Segregation in Deep Layers of the Medial Entorhinal Cortex. Neuron 88, 1040–1053, doi: 10.1016/j.neuron.2015.10.041 (2015). [DOI] [PMC free article] [PubMed] [Google Scholar]
- 12.Vandrey B, Garden DLF, Ambrozova V, McClure C, Nolan MF & Ainge JA Fan Cells in Layer 2 of the Lateral Entorhinal Cortex Are Critical for Episodic-like Memory. Current biology : CB 30, 169–175 e165, doi: 10.1016/j.cub.2019.11.027 (2020). [DOI] [PMC free article] [PubMed] [Google Scholar]
- 13.Leitner FC, Melzer S, Lutcke H, Pinna R, Seeburg PH, Helmchen F & Monyer H Spatially segregated feedforward and feedback neurons support differential odor processing in the lateral entorhinal cortex. Nature neuroscience 19, 935–944, doi: 10.1038/nn.4303 (2016). [DOI] [PubMed] [Google Scholar]
- 14.Ohara S, Gianatti M, Itou K, Berndtsson CH, Doan TP, Kitanishi T, Mizuseki K, Iijima T, Tsutsui KI & Witter MP Entorhinal Layer II Calbindin-Expressing Neurons Originate Widespread Telencephalic and Intrinsic Projections. Front Syst Neurosci 13, 54, doi: 10.3389/fnsys.2019.00054 (2019). [DOI] [PMC free article] [PubMed] [Google Scholar]
- 15.Chuong AS, Miri ML, Busskamp V, Matthews GA, Acker LC, Sorensen AT, Young A, Klapoetke NC, Henninger MA, Kodandaramaiah SB, Ogawa M, Ramanlal SB, Bandler RC, Allen BD, Forest CR, Chow BY, Han X, Lin Y, Tye KM, Roska B, Cardin JA & Boyden ES Noninvasive optical inhibition with a red-shifted microbial rhodopsin. Nature neuroscience 17, 1123–1129, doi: 10.1038/nn.3752 (2014). [DOI] [PMC free article] [PubMed] [Google Scholar]
- 16.Hokfelt T, Ljungdahl A, Fuxe K & Johansson O Dopamine nerve terminals in the rat limbic cortex: aspects of the dopamine hypothesis of schizophrenia. Science 184, 177–179, doi: 10.1126/science.184.4133.177 (1974). [DOI] [PubMed] [Google Scholar]
- 17.Fallon JH, Koziell DA & Moore RY Catecholamine innervation of the basal forebrain. II. Amygdala, suprarhinal cortex and entorhinal cortex. J Comp Neurol 180, 509–532, doi: 10.1002/cne.901800308 (1978). [DOI] [PubMed] [Google Scholar]
- 18.Swanson LW, Köhler C, and Björklund A The limbic region. I. The septohippocampal system. In “Handbook of Chemical Neuroanatomy” (Björklund A, Hökfelt T, and Swanson LW, Eds.), Vol. 5, Part I., pp. 125–227., (Elsevier, 1987). [Google Scholar]
- 19.Kudo Y, Akita K, Nakamura T, Ogura A, Makino T, Tamagawa A, Ozaki K & Miyakawa A A single optical fiber fluorometric device for measurement of intracellular Ca2+ concentration: its application to hippocampal neurons in vitro and in vivo. Neuroscience 50, 619–625, doi: 10.1016/0306-4522(92)90451-7 (1992). [DOI] [PubMed] [Google Scholar]
- 20.Menegas W, Babayan BM, Uchida N & Watabe-Uchida M Opposite initialization to novel cues in dopamine signaling in ventral and posterior striatum in mice. Elife 6, doi: 10.7554/eLife.21886 (2017). [DOI] [PMC free article] [PubMed] [Google Scholar]
- 21.Igarashi KM, Ieki N, An M, Yamaguchi Y, Nagayama S, Kobayakawa K, Kobayakawa R, Tanifuji M, Sakano H, Chen WR & Mori K Parallel mitral and tufted cell pathways route distinct odor information to different targets in the olfactory cortex. J Neurosci 32, 7970–7985, doi: 10.1523/JNEUROSCI.0154-12.2012 (2012). [DOI] [PMC free article] [PubMed] [Google Scholar]
- 22.Nilssen ES, Jacobsen B, Fjeld G, Nair RR, Blankvoort S, Kentros C & Witter MP Inhibitory Connectivity Dominates the Fan Cell Network in Layer II of Lateral Entorhinal Cortex. J Neurosci 38, 9712–9727, doi: 10.1523/JNEUROSCI.1290-18.2018 (2018). [DOI] [PMC free article] [PubMed] [Google Scholar]
- 23.Yagishita S, Hayashi-Takagi A, Ellis-Davies GC, Urakubo H, Ishii S & Kasai H A critical time window for dopamine actions on the structural plasticity of dendritic spines. Science 345, 1616–1620, doi: 10.1126/science.1255514 (2014). [DOI] [PMC free article] [PubMed] [Google Scholar]
- 24.Tse D, Langston RF, Kakeyama M, Bethus I, Spooner PA, Wood ER, Witter MP & Morris RG Schemas and memory consolidation. Science 316, 76–82, doi: 10.1126/science.1135935 (2007). [DOI] [PubMed] [Google Scholar]
- 25.Tolman EC Cognitive maps in rats and men. Psychological review 55, 189–208, doi: 10.1037/h0061626 (1948). [DOI] [PubMed] [Google Scholar]
- 26.Behrens TEJ, Muller TH, Whittington JCR, Mark S, Baram AB, Stachenfeld KL & Kurth-Nelson Z What Is a Cognitive Map? Organizing Knowledge for Flexible Behavior. Neuron 100, 490–509, doi: 10.1016/j.neuron.2018.10.002 (2018). [DOI] [PubMed] [Google Scholar]
- 27.McNaughton BL, Battaglia FP, Jensen O, Moser EI & Moser MB Path integration and the neural basis of the ‘cognitive map’. Nat Rev Neurosci 7, 663–678, doi: 10.1038/nrn1932 (2006). [DOI] [PubMed] [Google Scholar]
- 28.Kakade S & Dayan P Dopamine: generalization and bonuses. Neural Netw 15, 549–559, doi: 10.1016/s0893-6080(02)00048-5 (2002). [DOI] [PubMed] [Google Scholar]
- 29.Lisman JE & Grace AA The hippocampal-VTA loop: controlling the entry of information into long-term memory. Neuron 46, 703–713, doi: 10.1016/j.neuron.2005.05.002 (2005). [DOI] [PubMed] [Google Scholar]
- 30.Takeuchi T, Duszkiewicz AJ, Sonneborn A, Spooner PA, Yamasaki M, Watanabe M, Smith CC, Fernandez G, Deisseroth K, Greene RW & Morris RG Locus coeruleus and dopaminergic consolidation of everyday memory. Nature 537, 357–362, doi: 10.1038/nature19325 (2016). [DOI] [PMC free article] [PubMed] [Google Scholar]
- 31.Mori K, Takahashi YK, Igarashi KM, and Yamaguchi M (2006). Maps of odorant molecular features in the Mammalian olfactory bulb. Physiol Rev 86, 409–433. [DOI] [PubMed] [Google Scholar]
- 32.Uchida N, and Mainen ZF (2003). Speed and accuracy of olfactory discrimination in the rat. Nature neuroscience 6, 1224–1229. [DOI] [PubMed] [Google Scholar]
- 33.Li Y, Xu J, Liu Y, Zhu J, Liu N, Zeng W, Huang N, Rasch MJ, Jiang H, Gu X, et al. (2017). A distinct entorhinal cortex to hippocampal CA1 direct circuit for olfactory associative learning. Nature neuroscience 20, 559–570. [DOI] [PubMed] [Google Scholar]
- 34.Russo AA, Khajeh R, Bittner SR, Perkins SM, Cunningham JP, Abbott LF & Churchland MM Neural Trajectories in the Supplementary Motor Area and Motor Cortex Exhibit Distinct Geometries, Compatible with Different Classes of Computation. Neuron 107, 745–758 e746, doi: 10.1016/j.neuron.2020.05.020 (2020). [DOI] [PMC free article] [PubMed] [Google Scholar]
- 35.Sano H, Yasoshima Y, Matsushita N, Kaneko T, Kohno K, Pastan I, and Kobayashi K (2003). Conditional ablation of striatal neuronal types containing dopamine D2 receptor disturbs coordination of basal ganglia function. J Neurosci 23, 9078–9088. [DOI] [PMC free article] [PubMed] [Google Scholar]
Associated Data
This section collects any data citations, data availability statements, or supplementary materials included in this article.
Supplementary Materials
Data Availability Statement
Neurophysiological data generated in this study are available upon request, and will be deposited with a subsequent protocol paper.


