Abstract
At present, the existing standards (AISC360-16, EN1994-1-1:2004, and JGJ138-2016) lack relevant provisions for steel-reinforced concrete (SRC) composite columns with high-strength steel. To investigate the axial compressive mechanical performance of short high-strength steel-reinforced concrete (HSSRC) columns, the axial load test was conducted on 12 short composite columns with high-strength steel and ordinary steel. The influences of steel strength, steel ratio, and the section form of steel on the failure modes, bearing capacity, and ductility of the specimens were studied. Afterward, the experimental data were compared with the existing calculation results. The results show: compared with the specimens with Q235 steel, the bearing capacity of the specimens with Q460 steel increases by 7.8–15.3%, the bearing capacity of the specimens with Q690 steel increases by 13.2–24.1%, but the ductility coefficient increases by 15.2–202.4%; with the increase of steel ratio, the bearing capacity and ductility of specimens are significantly improved. A change of the steel cross-section could influence the ductility of SRC columns more than their bearing capacity. Moreover, the calculation results show that present standards could not predict the bearing capacity of HSSRC columns. Therefore, a modified method for determining the effective strength of steel equipped in HSSRC columns was proposed. The results of the ABAQUS simulation also showed that the addition of steel fibers could significantly improve the bearing capacity of Q690 HSSRC columns. The research results provide a reference for engineering practices.
Keywords: high-strength steel, steel-reinforced concrete composite short column, bearing capacity, ductility, ABAQUS simulation
1. Introduction
With the rapid development of high-rise and long-span buildings, ordinary construction materials do not meet the requirements of modern buildings. Since the 1990s, high-strength materials have increasingly been applied because their use in high-rise buildings can reduce the section size of structural elements and can reduce the use of building materials while saving building space. Therefore, it is more economical and environmentally friendly. In this background, high-strength and high-performance materials have gotten significant attention [1,2,3,4]. High-strength steel has excellent mechanical performance and can improve the mechanical performance of the structure. For the mechanical performance of high-strength steel, the calculation method based on density functional theory is proposed from the atomic level, which effectively reveals the mechanism of metal strength and provides guidance for industrial production [5,6]. In recent years, the production of high-strength steel has been increasing, and the welding conditions matching high-strength steel are also perfected, which lays a strong foundation for the extensive application of high-strength steel.
Scholars have carried out extensive research on the application of high-strength steel in the construction field. Some of them had applied high-strength steel bars to ordinary steel-concrete structures and found that high-strength steel bars can significantly improve the bearing capacity and ductility of reinforced concrete columns [7,8]. Compared with high-strength steel bars, high-strength steel tubes can better restrain concrete [9,10,11]. Restricted concrete can delay or even avoid local buckling of steel tubes so that the strength of steel tubes can be fully utilized [12,13,14]. Compared with the normal reinforced concrete columns, steel-reinforced concrete (SRC) columns have better structural performance, which can effectively reduce the cross-sectional size of structural columns and obtain larger building space. Compared with concrete-filled steel tubular columns, SRC columns can make full use of the compressive performances of high-strength steel, and poured concrete outside the steel can also avoid steel corrosion and improve the fire resistance of components [15,16]. Therefore, SRC structures have been widely used in key parts of important buildings [17,18,19]. The application of high-strength steel to SRC columns aims to improve the bearing capacity of the member without increasing or reducing the sectional area of the vertical member [20,21,22].
However, as shown in Table 1, during the study, scholars [23,24,25,26,27,28,29,30,31,32,33,34,35,36,37,38,39] also found that when high-strength steel is applied to building structures, the existing standards cannot accurately predict the mechanical performance of this type of specimen. Besides, design approaches from standards, including AISC360-16 [40], EN1994-1-1: 2004 [41], and JGJ138-2016 [42], are based on the related research results of ordinary steel; therefore, the scope of application needs to be verified.
Table 1.
Research status in various countries.
| Author | Strength/MPa | Type | Number of Specimen | Method | Main Conclusion |
|---|---|---|---|---|---|
| Gu [23] | 459–737 | HSRC | 12 | experiment |
|
| Li [24] | 437–629 | 9 |
|
||
| Li [25] | 437–629 | 9 |
|
||
| Mohsen [26] | 520–670 | 39 |
|
||
| Wang [27] | 522–906 | CFHSST | 13 | experiment |
|
| Du [28] | 724–741 | 10 |
|
||
| Wei [29] | 359–1153 | 15 | experiment and simulation |
|
|
| Cai [30] | 629–1022 | 34 |
|
||
| Fang [31] | 760–782 | 15 |
|
||
| Ehab [33] | 275–690 | HSSRC | 54 | simulation |
|
| Wang [34] | 276–774 | 12 | experiment |
|
|
| Lai [35] | 590–646 | 12 |
|
||
| Li [36] | 439–888 | 8 |
|
||
| Li [37] | 439–888 | 5 | experiment and simulation |
|
|
| Yang [38] | 496–530 | 2 |
|
||
| Yang [39] | 517 | 1 |
|
HSRC represents high-strength reinforcement concrete; CFHSST represents concrete filled high strength steel tube; HSSRC represents high-strength steel reinforced concrete.
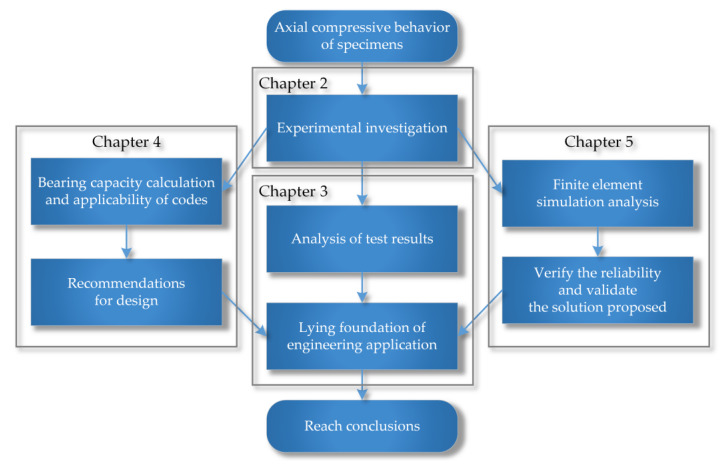
To investigate the influence of steel strength, steel ratio, and the section form of steel on the axial compressive bearing capacity of HSSRC composite short columns, 12 specimens equipped with Q235, Q460, and Q690 were tested. The main steps of this research are shown in Figure 1. The experimental results were compared with the calculation results from existing related codes to verify the applicability of the calculation approaches, and design suggestions were proposed. Finally, finite element models were established.
Figure 1.
Flowchart of main steps.
2. Experimental Investigation
This section contains four parts, and the main steps are shown in Figure 2.
Figure 2.
Flowchart of the experimental investigation.
2.1. Test Specimens
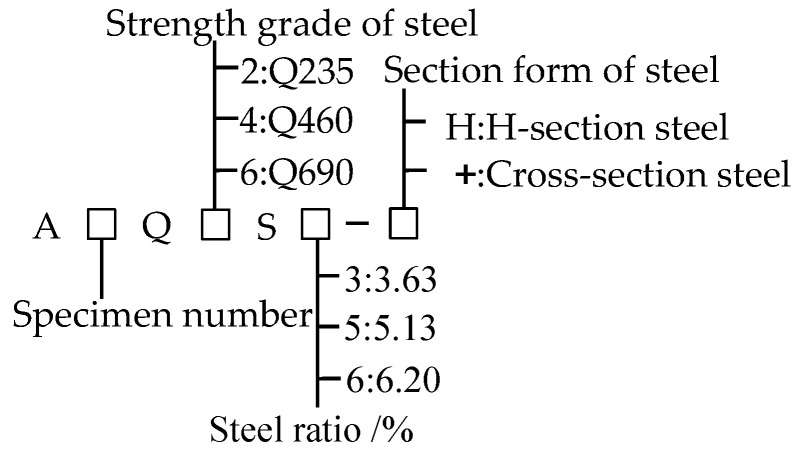
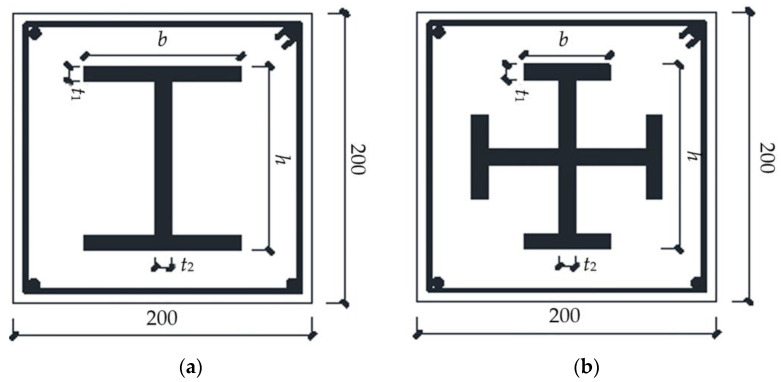
A total of eight high-strength welded steel-concrete composite short column specimens and four ordinary welded steel concrete comparison specimens were designed for the experiment. The change parameters contain the strength grade of the section steel, the steel ratio, and the section form of the section steel. Figure 3 shows the details; the explanation of the number of the specimens is shown in Table 2; the section size and reinforcement of the specimen are shown in Figure 4. The height of the specimens was 600 mm. Considering that high-strength concrete has strong brittleness and poor crack resistance, C50 pea gravel concrete was used in this test.
Figure 3.
Labeling rule of specimens.
Table 2.
Main parameters of specimens.
| Specimen Designation | Steel Grade | Steel Ratio to Concrete | Dimensions of Steel (b × h × t1 × t2) |
Stirrups Spacing | Section Form of Steel |
|---|---|---|---|---|---|
| A1Q4S3-H(A1) | Q460 | 3.13% | 100 × 100 × 5 × 5 | 70 | H |
| A2Q4S5-H(A2) | Q460 | 5.13% | 100 × 106 × 8 × 5 | 70 | H |
| A3Q4S6-H(A3) | Q460 | 6.20% | 110 × 106 × 8 × 8 | 70 | H |
| A4Q4S6-+(A4) | Q460 | 6.20% | 50 × 106 × 8 × 5 | 70 | + |
| A5Q6S3-H(A5) | Q690 | 3.13% | 100 × 100 × 5 × 5 | 70 | H |
| A6Q6S5-H(A6) | Q690 | 5.13% | 100 × 106 × 8 × 5 | 70 | H |
| A7Q6S6-H(A7) | Q690 | 6.20% | 100 × 106 × 8 × 8 | 70 | H |
| A8Q6S6-+(A8) | Q690 | 6.20% | 50 × 106 × 8 × 5 | 70 | + |
| A9Q2S3-H(A9) | Q235 | 3.13% | 100 × 100 × 5 × 5 | 70 | H |
| A10Q2S5-H(A10) | Q235 | 5.13% | 100 × 106 × 8 × 5 | 70 | H |
| A11Q2S6-H(A11) | Q235 | 6.20% | 110 × 106 × 8 × 8 | 70 | H |
| A12Q2S6-+(A12) | Q235 | 6.20% | 50 × 106 × 8 × 5 | 70 | + |
Figure 4.
Cross-section and reinforcement of specimens (dimensions are presented in (mm)). (a) Specimens equipped with H-section steel. (b) Specimens equipped with cross-section steel.
For Simplicity, Ai (i = 1~12) is used in some parts of the article to represent the number of specimens.
2.2. Material Properties
According to the relevant standard “Metallic Materials Tensile Test” (GB/T 228.1-2010) [43], the mechanical properties of the section steel and the steel bars were tested, as shown in Table 3.
Table 3.
Mechanical properties of steel.
| Grade | Yield Strength | Ultimate Strength | Elongation Ratio | ||
|---|---|---|---|---|---|
| fy/MPa | Cv | fu/MPa | Cv | δ/% | |
| Q235 | 291.0 | 5.4% | 453.1 | 4.3% | 32.3% |
| Q460 | 469.1 | 7.9% | 557.3 | 8.3% | 25.0% |
| Q690 | 735.1 | 1.1% | 822.3 | 0.9% | 19.2% |
| HRB400 | 443.2 | 4.5% | 594.9 | 3.7% | 27.8% |
Cv represents coefficient of variation.
According to the relevant standard “Standard for Test Methods of Concrete Structures” (GB/T 50152-2012) [44], the mechanical properties of the concrete were tested. Nine concrete cubes (150 mm × 150 mm × 150 mm) were maintained under the same conditions as the specimens in 28 days, and the cubic compressive strength of the concrete test block was 55.8 MPa.
2.3. Process of Specimen Manufacture
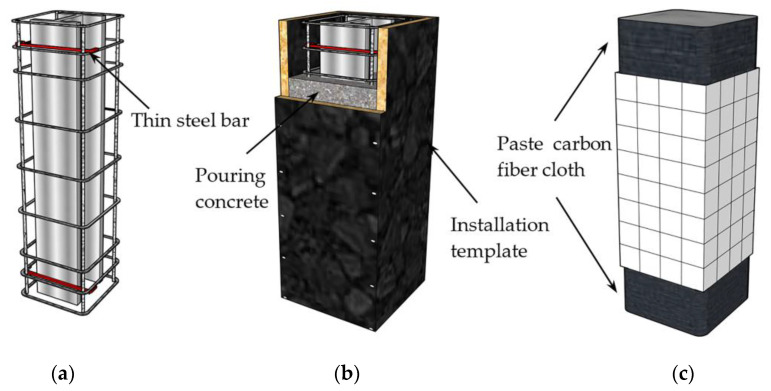
The production processes of the specimens are shown in Figure 5. The section of steel was formed by the full welding of three steel plates. As shown in Figure 5a, before pouring the specimens, the section of steel was fixed to the reinforcing steel frame by thin steel bars at the upper and lower ends. Further, paste strain gauges were placed at locations to be measured. As shown in Figure 5b, we installed the formwork and poured the concrete into layers that were fully vibrated during the pouring process. As shown in Figure 5c, after the curing was completed, the top surface of the specimen was polished flat. In order to prevent local pressure damage to the specimen, the upper and lower ends were reinforced with carbon fiber cloth within a range of 200 mm.
Figure 5.
Manufacturing process of specimens. (a) Fix steel, (b) install formwork and pour, (c) paste carbon fiber cloth.
2.4. Test Setup and Procedure
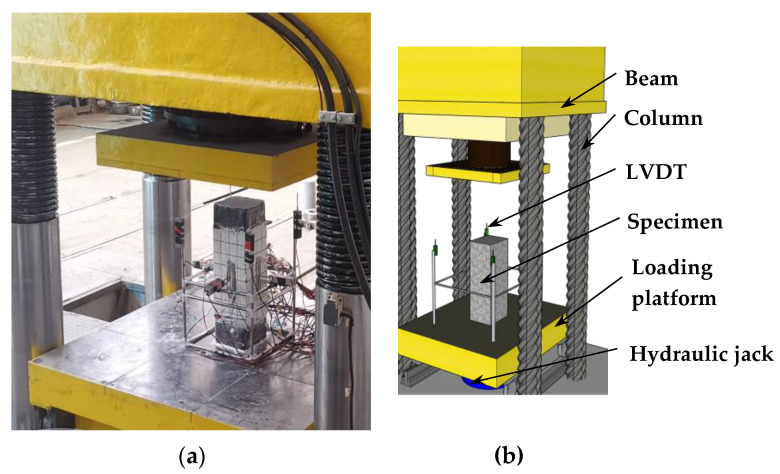
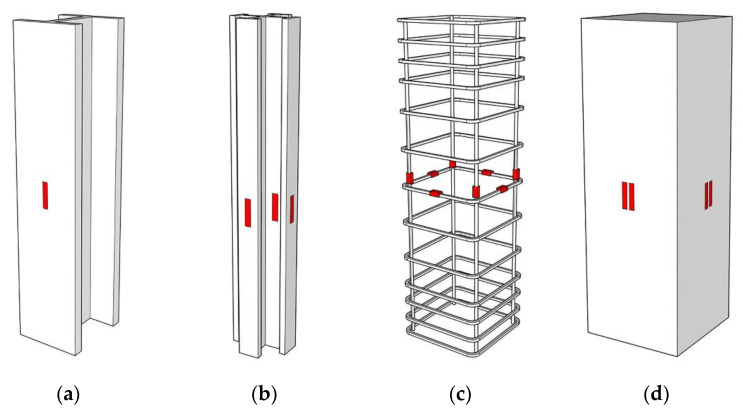
The test loading was carried out by the electro-hydraulic servo testing machine (Dongce Testing Machine Technology Co., Ltd., Jinan, China), and the loading device is shown in Figure 6. The test was carried out in a graded loading method. Before the formal load, to ensure the normal operation of the test instrument, a load of 100 kN was applied in advance. At the beginning of the formal test, the load was carried out at a rate of 200 kN/min until the load was 40% of the estimated ultimate load, then the loading rate was reduced to 100 kN/min. When the loading reached 80% of the estimated ultimate bearing capacity, the load method was switched to displacement control, and the loading rate was 0.2 mm/min. After loading to the peak load, the test was ended when the bearing capacity dropped to ~75% of the ultimate load. To facilitate the monitoring of the component forces, strain gauges were pasted on the surface of the section of steel, steel bars, and concrete, and the measuring points are shown in Figure 7. The vertical displacement of the specimen was recorded by the displacement meter in the loading device.
Figure 6.
Test setup. (a) Diagram of test device. (b) Device diagram.
Figure 7.
Measuring instrument layout. (a) Specimens with H-section steel. (b) Specimens with cross-section steel. (c) Reinforcement framework, (d) Concrete.
3. Test Results and Analysis
3.1. Failure Phenomenon
Due to the different design parameters of the specimens, the damage phenomena were different during the stress process. The failure phenomenon of each specimen is described according to the yield state and the changing trend of the bearing capacity of the section steel.
The failure modes of specimens equipped with Q460 (A1~A4) and Q235 steel (A9~A12) are similar, and the failure characteristics are as follows.
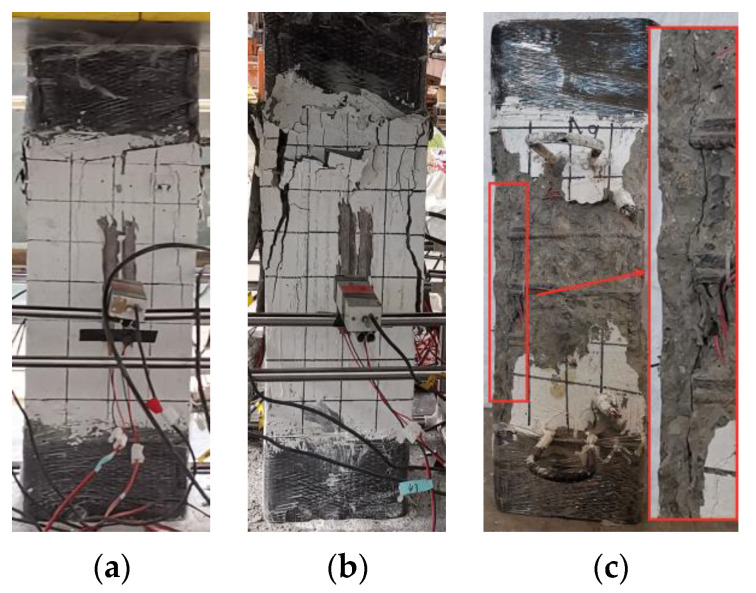
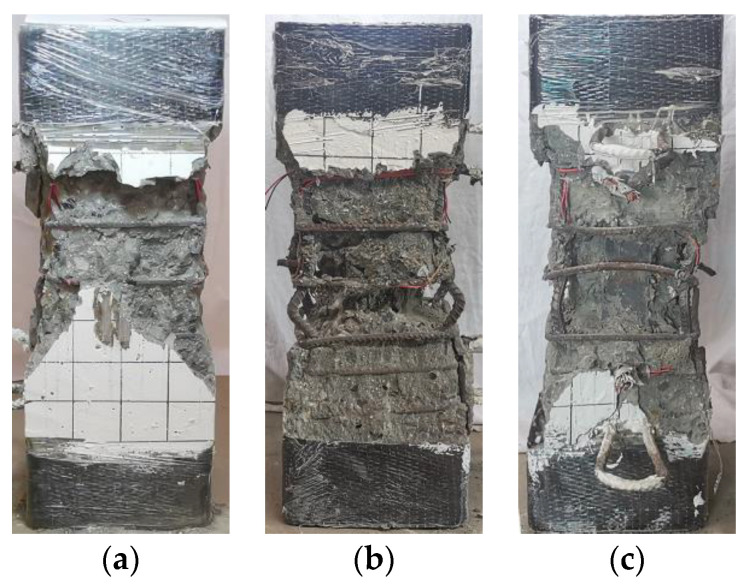
Figure 8 shows the typical failure characteristics of the specimen. At the initial stage of loading, the specimen was in a linear elastic state, and no cracks appeared on the concrete surface. As shown in Figure 8a, when the load increased to 0.8~0.9 Nu (Nu is the ultimate bearing capacity of the specimen), micro-cracks appeared on the side of the upper end of the column; as the load continued to increase, the cracks continued to extend downwards, and the longitudinal bars and the section steel yielded successively. When the specimen equipped with Q235 steel was in a compression state, the section steel yielded before the longitudinal reinforcement. When the strength grade of the section steel was Q460, the longitudinal reinforcement of the composite short column yielded before the section steel. When the specimen reached the ultimate bearing capacity Nu, crack length and crack width developed rapidly. As shown in Figure 8b, the protective concrete layer in the middle section of the specimen cracked and fell off. With the increase of the load, as the concrete at the middle edge of the specimen was crushed, the protective layer continuously fell off, the load-bearing capacity of the specimen was rapidly reduced, and the longitudinal reinforcement bulged outward. Simultaneously, stirrup yielded; as shown in Figure 8c, the concrete of the protective layer was separated from the concrete in the confinement area of the stirrups. Then the rate of reduction of the bearing capacity slowed down until it reached 75% of the ultimate bearing capacity. After the test was over, the broken concrete on the surface of the specimens was removed, and it can be observed that the concrete in the constrained area did not show obvious collapse.
Figure 8.
Typical failure modes in each stage of A9. (a) Micro-cracks, (b) ultimate load, (c) stripping of concrete cover.
Compared with A1~A4 and A9~A12, the cracks of specimens A5 and A6 (equipped with 3.63% and 5.13% Q690 steel, respectively) appeared later, and the failure process has the following characteristics.
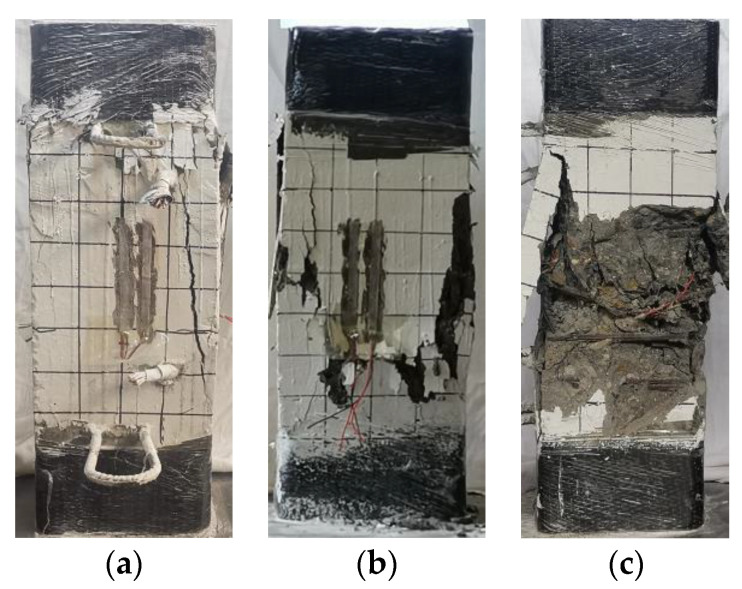
When specimens A5 and A6 reached the ultimate bearing capacity Nu, multiple vertical cracks quickly appeared on the surface of the column, and they developed continuously with the increase of the vertical displacement. At this time, the longitudinal bars yielded, but the section steel had not reached the yielding state. When the bearing capacity dropped to approximately 85% of the peak load, the bearing capacity decreased slowly. When the bearing capacity dropped to ~85% of the peak load, the bearing capacity dropped slowly. The vertical displacement of the specimen when failed increased due to the increase of the strength level of the section steel, and the degree of damage was intensified. Figure 9 and Figure 10 show the characteristics of the failure morphology of different specimens. Compared with specimens A1~A4 and A9~A12, the concrete cracking degree and the final degree of crushing in the middle section of specimens A5 and A6 were more serious.
Figure 9.
Comparison of cracking degree of concrete. (a) A9, (b) A5, (c) A7.
Figure 10.
Concrete crushing modes of specimens. (a) A9, (b) A5, (c) A7.
The specimens A7 and A8 equipped with Q690 steel and steel ratio of 6.20% were loaded to the ultimate load, and then slowly dropped to 0.85 Nu. At this time, the concrete protective layer fell off, the load-displacement curve reached an inflection point, the bearing capacity of the specimen stopped decreasing, and a slow secondary lifting phenomenon occurred. During this process, the Q690 steel yielded, and the surface of the specimen was seriously damaged. When the vertical displacement reached 20~23 mm, accompanied by a loud noise, the specimen lost all bearing capacity, and the test ended. After removing the broken concrete on the surface, it was found that the longitudinal bars buckled outwards, and the stirrups broke.
3.2. Load-Displacement Curve
Due to the different design parameters of the specimens, the damage phenomena were different during the stress process. The failure phenomenon of each specimen is described according to the yield state and the changing trend of the bearing capacity of the section steel.
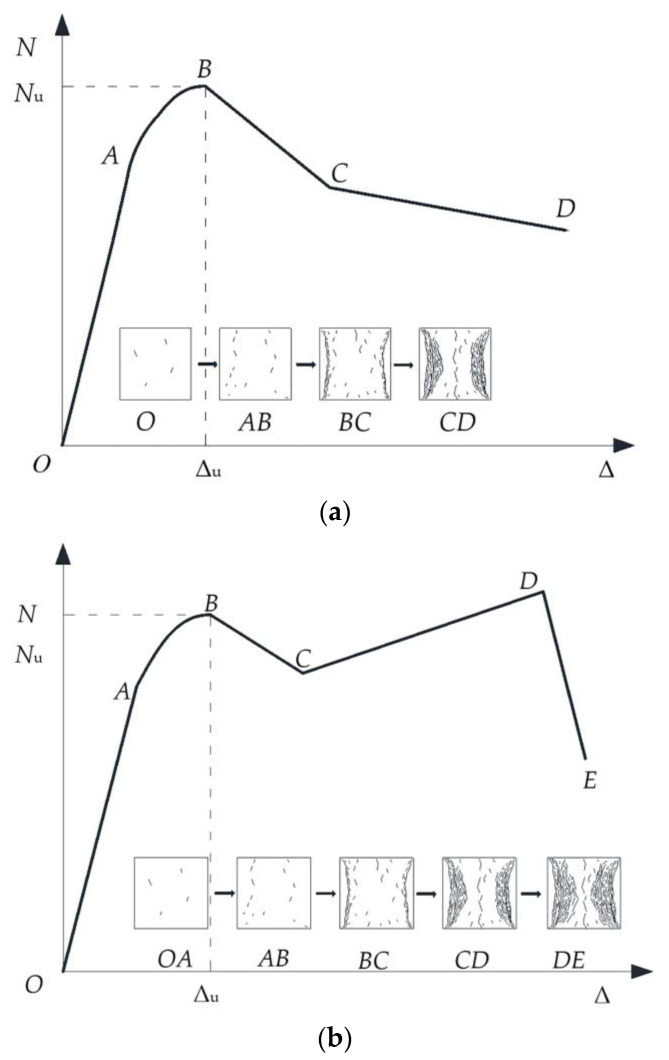
Figure 11a shows the load-displacement curve of type I. The specimens conforming to the characteristics of this type of curve are A1~A6 and A9~A12. The OA stage is the elastic deformation stage, at which the specimens have linear deformation. At the AB stage, the transverse deformation of each part gradually increases, and the restraint effect of the section steel and stirrups on the concrete in the constrained area continues to increase until the specimen enters the full-section plastic state and reaches the limit bearing capacity. Because the concrete of the protective layer is not restrained, the deformation ability of the specimens is relatively weak at the BC stage. At this stage, it cracks and falls off, and the bearing capacity of the specimen decreases rapidly until the specimen is transformed from the overall axial force to the constrained area of the steel and stirrups. The concrete bears the axial force. At the CD stage, the load is mainly borne by the concrete inside the confinement area of the steel section and stirrups. The concrete in the constrained area of stirrups is jointly restrained by stirrups and steel sections, its deformation ability is improved, its strength degrades slowly, and it can continue to bear the load, so the rate of decrease of the bearing capacity of the specimen is slowed down.
Figure 11.
Two ideal specimens N-Δ curves. (a) Ideal N-Δ curve—class Ⅰ. (b) Ideal N-Δ curve—class Ⅱ.
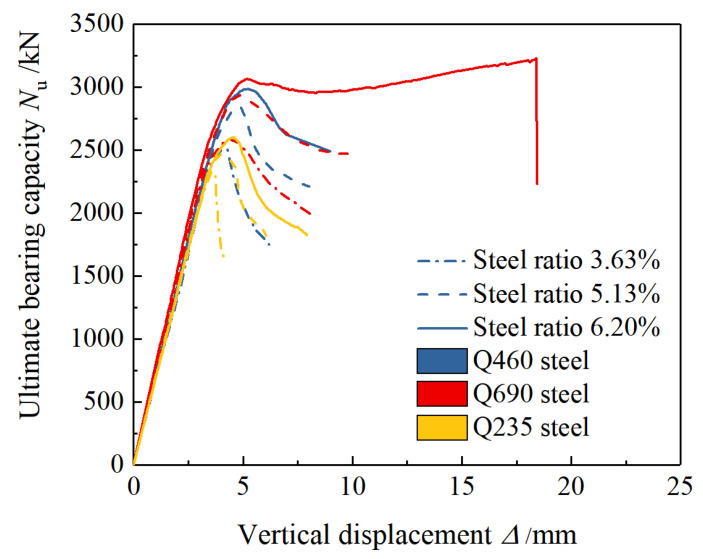
As shown in Figure 11b, the load-displacement curves of the specimens A7 and A8 (equipped with 6.20% Q690 steel in H-section and cross-section form) both showed a secondary increase. The phenomenon is in line with the characteristics of the type Ⅱ load-displacement curve. At the CD stage, the concrete protective layer has completely failed, but the strength of the concrete in the confinement area of the stirrups degrades slowly. As the sectioned steel reaches the yielding state and enters the strengthening stage, the overall load-bearing capacity of the specimen reaches the lowest point C of the descending section, the displacement continues to increase, the built-in sectioned steel yields and begins to strengthen under the action of axial pressure, and the load changes from falling to rising. At the DE stage, when the displacement increases to a certain extent, the class II curve breaks due to the yield of the stirrup, and the concrete in the confinement area of the stirrup loss of restraint and sudden crushing results in loss of bearing capacity of the specimen. Figure 12 and Figure 13 show the load-displacement curves of the specimens with different steel grades, steel ratios, and section forms of steel.
Figure 12.
Influence of strength grade and content of steel on load-displacement curves.
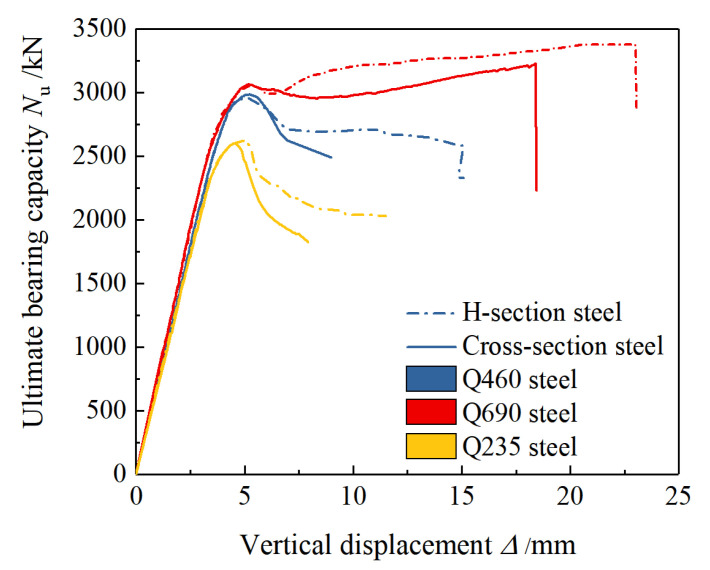
Figure 13.
Influence of section form of steel on load-displacement curves.
3.3. Ultimate Bearing Capacity
The ultimate bearing capacity of the specimen is shown in Table 4. Compared with the specimens equipped with Q235 steel, when the steel grades were Q460 and Q690, the maximum increase in the bearing capacity of the specimens was 15.3% and 19.0%, respectively. Compared with the specimens equipped with Q460 steel, the bearing capacity of the specimens equipped with Q690 steel increased slightly because the yield strain of the Q690 steel was much larger than the peak compressive strain of the concrete, so the Q690 steel could not yield when the specimens reached the ultimate bearing capacity; therefore the material performances of the high-strength steel were not fully utilized. For the specimens with the same strength grade built-in steel, compared with the specimens with a steel ratio of 5.13%, the highest increases in bearing capacity of the specimens with a steel ratio of 6.20% were 13.6% and 18.8%. The growth rate was relatively large.
Table 4.
Comparison of test results with calculation results calculated codes.
| Specimens | Test Results | Simulation Results | Calculation Results | |||||||||
|---|---|---|---|---|---|---|---|---|---|---|---|---|
| Bearing CapacityNu/kN | Bearing CapacityNa/kN | Simulation Error | AISC360-16 | EN1994-1-1:2004 | JGJ138-2016 | |||||||
| Nuca/kN | Error Rate | Nucc/kN | Error Rate | Nucj/kN | Error Rate | |||||||
| Single | Average | Single | Average | Single | Average | |||||||
| A1Q4S3-H | 2514.0 | 2457.3 | −2.3% | 2241.9 | 12.1% | 9.1% | 2307.8 | 8.9% | 6.15% | 2141.2 | 17.4% | 14.9% |
| A2Q4S5-H | 2845.6 | 2787.9 | −2.0% | 2581.2 | 10.2% | 2654.5 | 7.2% | 2452.2 | 16.0% | |||
| A3Q4S6-H | 2987.5 | 3032.5 | 1.5% | 2807.7 | 6.4% | 2884.7 | 3.6% | 2658.6 | 12.4% | |||
| A4Q4S6-+ | 2961.2 | 3010.4 | 1.7% | 2753.9 | 7.5% | 2822.7 | 4.9% | 2602.8 | 13.8% | |||
| A5Q6S3-H | 2585.6 | 2635.3 | 1.9% | 2651.6 | −2.5% | −5.8% | 2744.6 | −5.8% | −8.9% | 2534.2 | 2.0% | −0.93% |
| A6Q6S5-H | 2938.5 | 2988.1 | 1.7% | 3055.4 | −3.8% | 3159.0 | −7.0% | 2906.2 | 1.1% | |||
| A7Q6S6-H | 3067.7 | 2976.7 | −3.0% | 3346.5 | −8.3% | 3456.8 | −11.3% | 3173.5 | −3.3% | |||
| A8Q6S6-+ | 3060.6 | 3126.5 | 2.2% | 3352.4 | −8.7% | 3455.3 | −11.4% | 3172.2 | −3.5% | |||
| A9Q2S3-H | 2332.9 | 2327.2 | −0.2% | 2025.5 | 15.2% | 12.8% | 2079.0 | 12.2% | 10.2% | 1935.2 | 20.5% | 18.73% |
| A10Q2S5-H | 2468.9 | 2407.1 | −2.5% | 2212.5 | 11.6% | 2266.1 | 9.0% | 2102.6 | 17.4% | |||
| A11Q2S6-H | 2601.0 | 2559.9 | −1.6% | 2339.8 | 11.2% | 2392.9 | 8.7% | 2216.0 | 17.4% | |||
| A12Q2S6-+ | 2623.3 | 2546.3 | −2.9% | 2318.8 | 13.1% | 2367.3 | 10.8% | 2193.0 | 19.6% | |||
Simulation error = Na/Nu − 1. Error rate = Nu/Nuc* − 1. Nuca, Nucc, Nucj represent the calculation results according to the standards of the United States, Europe, and China, respectively. The details of the simulation method and the simulation verification are shown in Section 5.
3.4. Ductility Coefficient
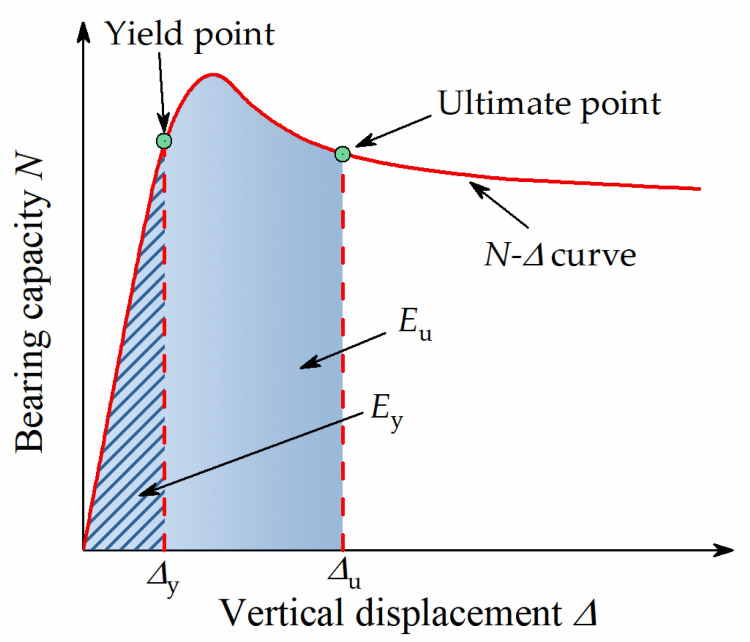
In order to quantitatively analyze the axial ductility of the specimens, the ductility coefficient μ is now introduced [45,46], as shown in Equation (1).
| (1) |
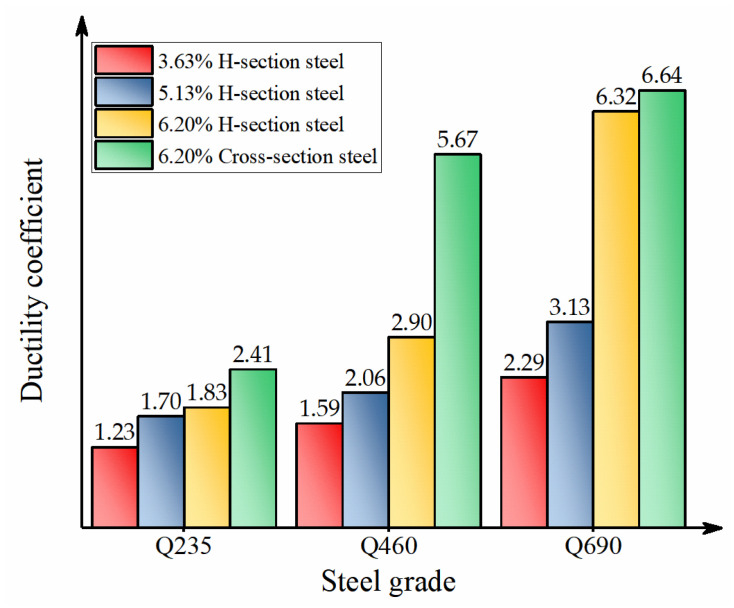
where, Eu is the dissipated energy at the ultimate point; Ey is the dissipated energy at the yield point, as shown in Figure 14. In this study, the ultimate point was taken as the bearing capacity drops to 85% of Nu. Since the N-Δ curves of A7 and A8 cannot drop to 85% of Nu, and the phenomenon of the secondary rise occurred, the ultimate points of A7 and A8 were determined from the perspective of deformation. Therefore, the point with three times the deformation of the peak load was selected as the ultimate point. The yield points of the specimens were determined by the energy equivalence method. The calculation results are shown in Table 5, and the ductility comparison of each specimen is shown in Figure 15.
Figure 14.
Calculating diagram of ductility factor.
Table 5.
Loads and displacements of characteristic points.
| Specimens | Δy/mm | E y | Δu/mm | E u | μ |
|---|---|---|---|---|---|
| A1Q4S3-H | 3.70 | 4660.9 | 4.85 | 7415.84 | 1.59 |
| A2Q4S5-H | 3.89 | 5230.2 | 5.96 | 10,790.8 | 2.06 |
| A3Q4S6-H | 4.15 | 6115.6 | 8.35 | 17,757.3 | 2.90 |
| A4Q4S6-+ | 4.16 | 6163.9 | 15.06 | 34,940.8 | 5.67 |
| A5Q6S3-H | 3.76 | 5138.5 | 6.48 | 11,783.1 | 2.29 |
| A6Q6S5-H | 3.97 | 5869.2 | 8.53 | 18,357.5 | 3.13 |
| A7Q6S6-H | 4.16 | 6539.6 | 14.37 | 41,312.8 | 6.32 |
| A8Q6S6-+ | 4.18 | 6637.4 | 13.83 | 44,051.8 | 6.64 |
| A9Q2S3-H | 3.42 | 4017.9 | 3.83 | 4936.8 | 1.23 |
| A10Q2S5-H | 3.58 | 4422.0 | 4.88 | 7526.1 | 1.70 |
| A11Q2S6-H | 3.84 | 5009.8 | 5.51 | 9190.1 | 1.83 |
| A12Q2S6-+ | 3.82 | 5144.2 | 6.81 | 12,382.4. | 2.41 |
Where, Δy is the displacement corresponding to the yield point, Δu is the displacement corresponding to the ultimate point.
Figure 15.
Comparison of ductility of all specimens.
By comparing the calculation results of the ductility coefficient of different specimens, it can be found that the increases of the steel grade and steel ratio had obvious effects on the ductility coefficient of the specimens. When the steel ratio was higher, the increase in the strength grade had a significant impact on the ductility coefficient of the specimens. When the section steel had higher strength, the increase in the steel ratio had a significant impact on the ductility coefficient. When the steel ratio was 6.20%, compared with the specimens equipped with Q235 steel, the ductility coefficients of the specimens equipped with Q460 and Q690 steel were increased by 58.5% and 245.4%, respectively. When the steel grade was Q690, compared with the specimen with a 3.63% steel ratio, the ductility coefficients of the specimens equipped with steel ratios of 5.13% and 6.20% were increased by 36.7% and 176.0%, respectively.
When the form of the steel changes from H-section to cross-section, the ductility coefficient of the specimen equipped with Q235 steel increased by 31.20%, the ductility coefficient of the specimen equipped with Q460 steel increased by 95.20%, and the ductility coefficient of the specimen equipped with Q690 steel increased by 5.1%. When the steel grade was Q235, the displacement difference between the two different cross-section specimens was small when the bearing capacity of the specimen was reduced to about 85% Nu, so the ductility coefficient did not change significantly. However, it can be observed from Figure 11 that when the bearing capacity was reduced to about 75% Nu, the displacement of the specimen equipped with cross-section steel was much greater than that of the specimen equipped with H-section steel. When the steel grade was Q460, the cross-section steel fully exerted the restraint effect on the concrete when the member was stressed, and the ductility coefficient increased significantly. When the steel grade was Q690, the ductility of the specimens equipped with H-section and cross-section steel were both very excellent. Compared with the specimen equipped with H-section steel, the second increasing stage of the load-displacement curves of specimens equipped with cross-section steel showed that the residual bearing capacity was higher, and the ultimate displacement of the specimen was greater.
4. Calculation and Analysis of Bearing Capacity
American code AISC360-16, European code EN1994-1-1:2004, and Chinese code JGJ138-2016 all propose the formulas for calculating the axial compressive bearing capacity of SRC columns, but none of them give the calculation formula for the SRC column with high-strength steel. Combined with the test results, the applicability of the above-mentioned formulas for calculating the axial compressive bearing capacity of the specifications for the high-strength SRC column was verified.
4.1. The Calculation Method of Current Specifications
The American “Code for Design of Steel Structure Buildings” (AISC360-16) adopts the method equivalent to the section steel of the outer reinforced concrete part and calculates according to the steel structure design method. The calculation formula of the axial compression is:
| (2) |
| (3) |
| (4) |
where, As, Asr, Ac represent the section area of section steel, steel bar, and concrete, respectively; Fy, Fysr, fc′ represent the compressive strength of section steel, steel bar, and concrete, respectively; EIeff represents the effective stiffness of the section; Lc represents the effective length of the member.
For biaxially symmetric steel-concrete composite columns, the calculation formula for the axial compressive bearing capacity of the European “Code for Design of Steel and Concrete Composite Structures” (EN1994-1-1:2004) is as follows:
| (5) |
| (6) |
where, Aa, Ac, As, represent the cross-sectional area of section steel, concrete, and reinforcement, respectively; fyd, fcd, fsd represent the compressive strength of section steel, concrete, and reinforcement, respectively; χ represents the buckling reduction coefficient considering the relative slenderness ratio, confirmed according to the European “Code for Design of Steel Structures” (EN 1993-1-1:2005) [47].
The calculation formula for the axial compressive bearing capacity of steel-concrete composite columns from “Code for Design of Composite Structures” (JGJ 138-2016) is:
| (7) |
where, fc, fy′, fa′ represent the design value of compressive strength of concrete, steel bar, and section steel, respectively; Ac, As′, Aa′ represent the cross-sectional area of concrete, steel bar, and section steel, respectively; φ represents the axial compression stability coefficient, which can be obtained according to the slenderness ratio look-up table.
4.2. Comparison of Test Results and Calculation Results
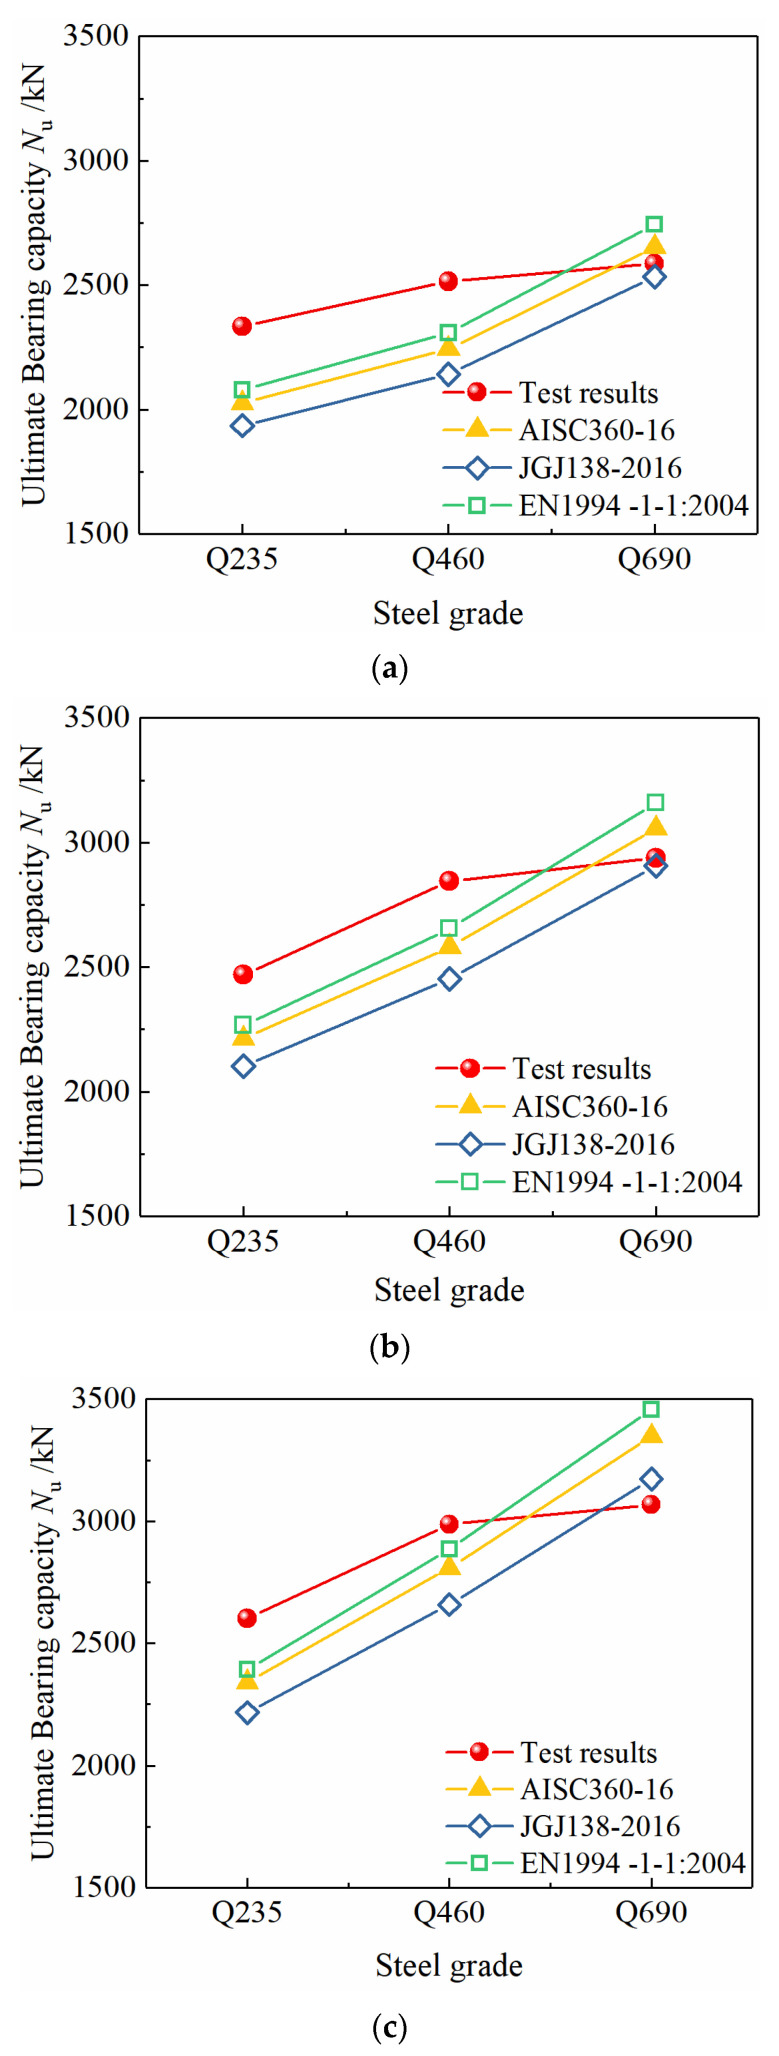
As shown in Figure 16, when the steel content is constant, as the strength grade of the section steel increases from Q235 to Q460, the bearing capacity of the specimens is significantly improved. Based on the different specifications, the calculation results are much smaller than the test results, the norms of all countries are conservative, and the changing trend of the calculated value of the bearing capacity is consistent with the test value. The European standard calculation results are the closest to the test results, and the Chinese standard calculation results are the most conservative. When the existing standard calculation methods are applied to the calculation of the axial compressive bearing capacity of the Q690 high-strength steel-concrete composite specimens, the calculation results can not predict the bearing capacity of the columns accurately, because compared to Q235 and Q460 steel, the yield strain of Q690 steel is much larger. Because of the limitation of the compressive deformation capacity of concrete, the specimens reach the ultimate bearing capacity when the concrete is crushed, but the Q690 steel has not yet yielded, so the strength has not been fully developed. If the yield strength of Q690 section steel is still used to calculate the bearing capacity based on the strength superposition theory, the contribution of the high-strength section steel to the axial load bearing capacity would be overestimated, resulting in unsafe calculation results. Therefore, it is not appropriate to directly use the existing calculation method for the calculation of the bearing capacity of the Q690 high-strength steel-concrete composite column specimens.
Figure 16.
Effect of steel grade on bearing capacity of specimens. (a) Steel ratio 3.63%, (b) steel ratio 5.13%, (c) steel ratio 6.20%.
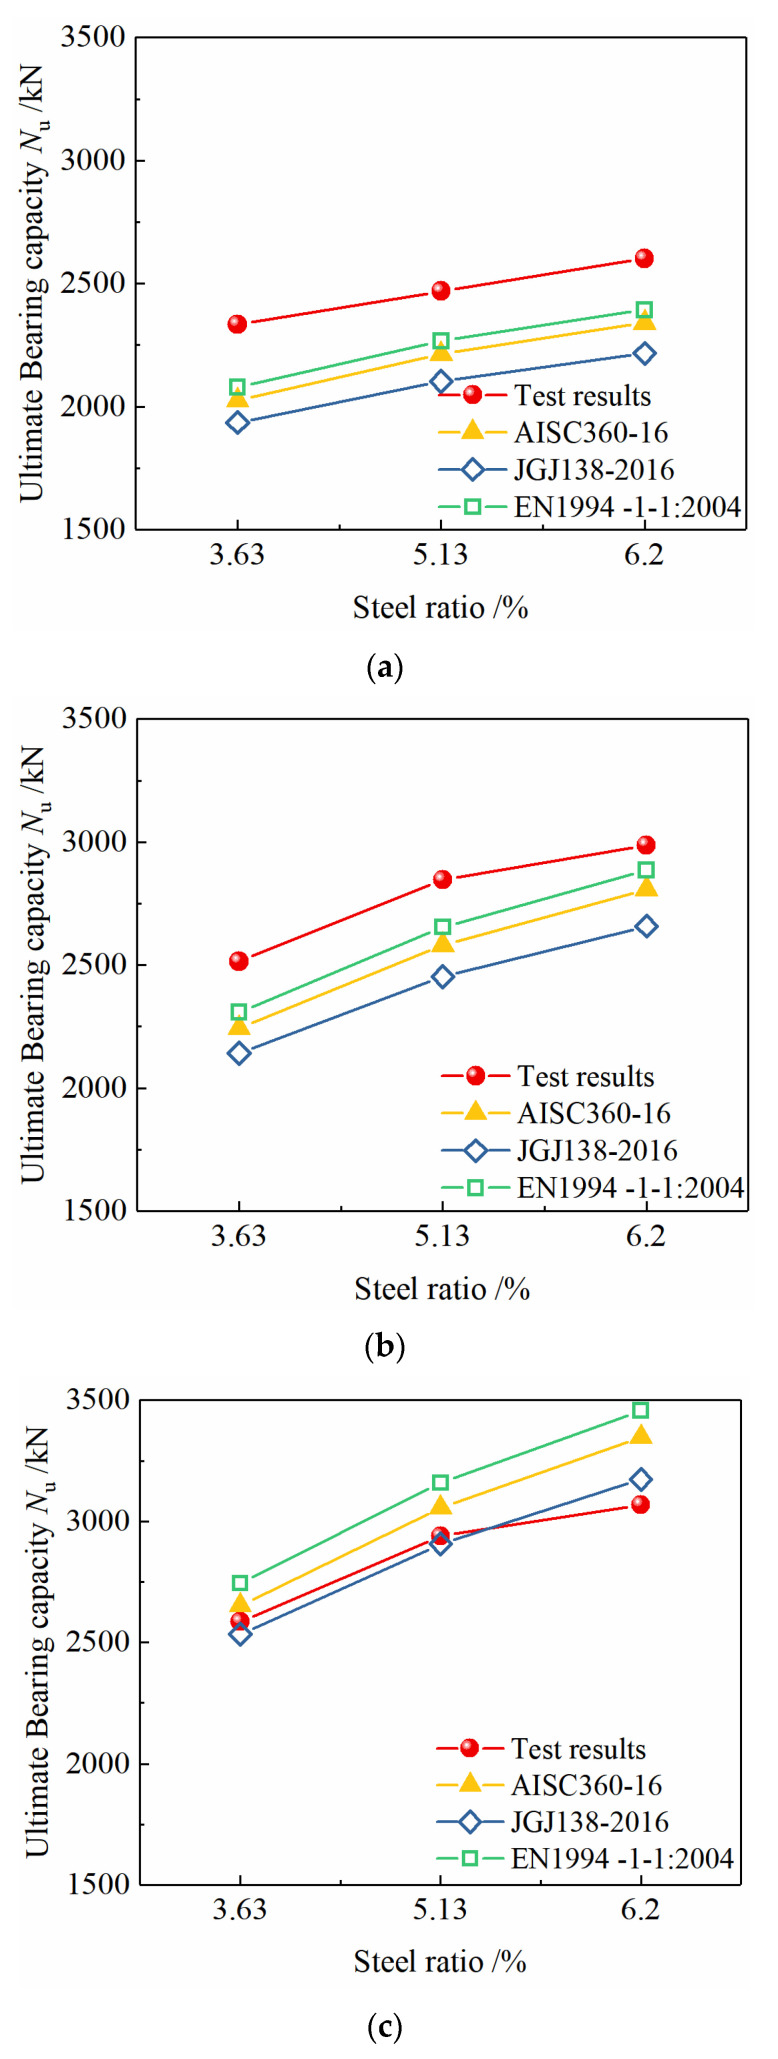
As shown in Figure 17, when the strength grade of the section steel is constant, as the steel content increases from 3.63% to 5.13% and 6.20%, the bearing capacity of the specimen increases significantly, and the test results and the standard calculation results have the same change trend.
Figure 17.
Effect of steel ratio on bearing capacity of specimens. (a) Steel grade Q235, (b) steel grade Q460, (c) steel grade Q690.
4.3. Design Suggestion
According to the above test results and theoretical analysis, Q690 steel can greatly improve the residual bearing capacity and deformation capacity of the specimens. However, because the specimens reach the ultimate bearing capacity and the high-strength section steel fails to yield, it is not advisable to use the existing bearing capacity calculation formulas when designing this type of member. A comprehensive consideration of the strength degradation of the protective layer of concrete and the improvement of the strength and deformation performance of the concrete in the confinement area of the stirrups, if no measures are taken to ensure the compressive deformation capacity of concrete, when calculating the axial compressive bearing capacity of high-strength steel-concrete composite short columns, the strength of the section steel should be taken from its effective compressive strength:
| (8) |
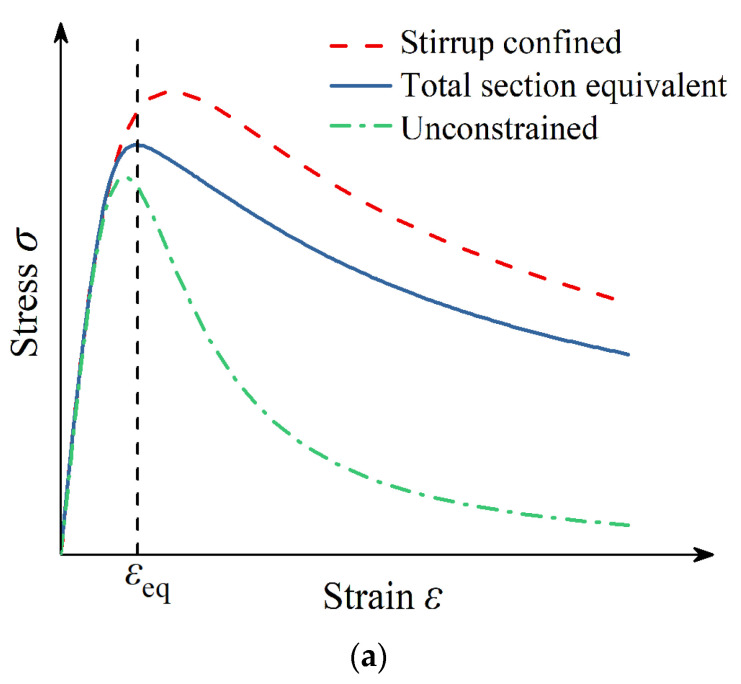
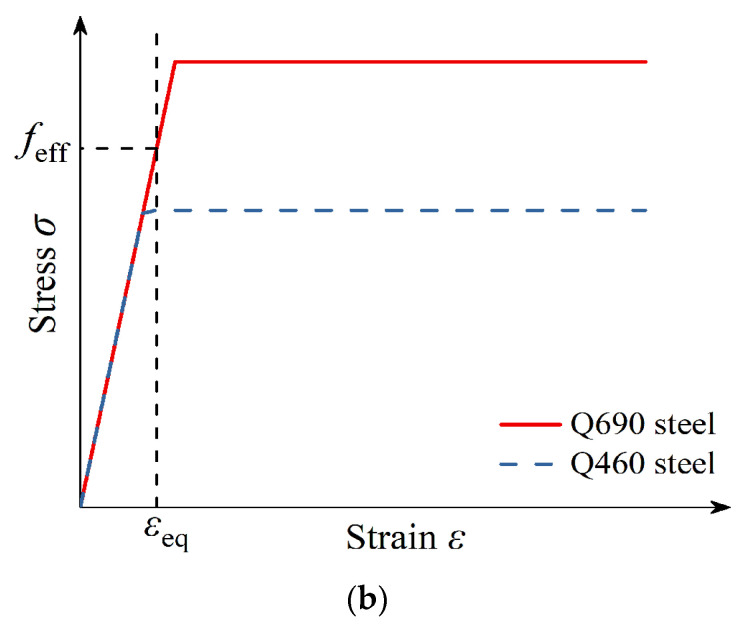
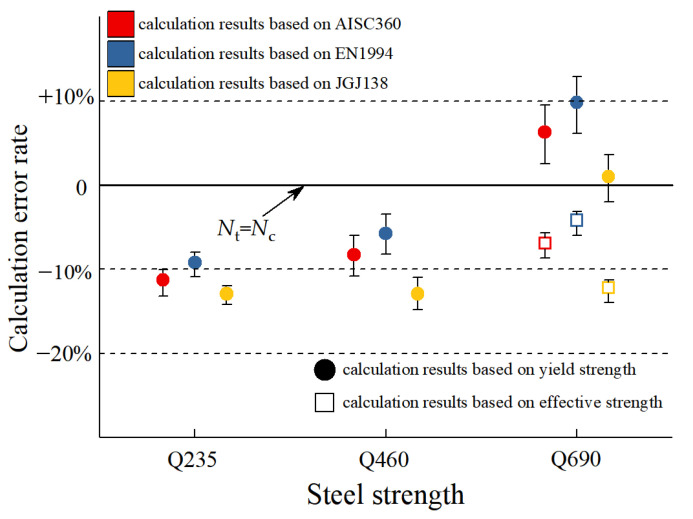
where, Es is the elastic modulus of section steel, as shown in Figure 18. According to the weight of the unconfined concrete and the concrete in the constrained area in the full-section concrete, the equivalent full-section concrete stress-strain curve has been calculated, as shown in Figure 18a. The strain value corresponding to its peak point is the equivalent full-section concrete peak strain εeq, taking the strain value εeq on the stress-strain curve of the high-strength section of steel as the corresponding stress is the effective compressive strength feff provided by the high-strength section steel, as shown in Figure 18b. The influence of this method on the calculation results of bearing capacity is shown in Figure 19.
Figure 18.
Determination of effective compressive strength of high-strength steel. (a) Equivalent total section concrete peak strain. (b) Effective compressive strength of high-strength steel.
Figure 19.
Influence of strength limit of steel on calculation results. Nc and Nt represent the calculation results of the bearing capacity and the test bearing capacity. Color (red, blue, and yellow) is used to distinguish different standards. Shapes (solid circles and hollow squares) used to distinguish steel strength values.
5. Finite Element Analysis
5.1. Model Establishment
In the failure process of the specimens equipped with Q690 steel, the compressive strength of the steel is not fully utilized, resulting in insufficient overall bearing capacity of the specimen. When the steel reaches the yield stress value, the protective layer concrete has severely cracked or even fell off, which seriously affects the applicability of the structure. To meet the requirements of engineering application, it is necessary to propose a measure to improve the concrete deformation capacity of the component. To solve this problem, steel fiber concrete can be applied to high-strength SRC columns.
Studies have shown that the incorporation of steel fibers can effectively improve the deformability of concrete [48,49]. The numerical analysis of the representative specimens A3, A4, A7, and A8 in the test was carried out through the ABAQUS finite element analysis software. Based on the research [50], the proposed outsourcing hexahedron method uses python scripts to insert randomly distributed steel fibers inside the specimen. By comparing the stress characteristics of the specimen before and after inserting the steel fiber, the influence of the incorporation of steel fibers to the bearing capacity and the force behavior were analyzed for the specimen.
In the model, the C3D8R hexahedral reduced integral element was selected for concrete and section steel element type, and T3D2 three-dimensional truss element was selected for reinforcement and steel fiber element type. The friction was defined at the interface between the concrete and the steel to consider the bond. The model grid was divided with the size ratio proposed by Ehobody et al. [51]. After convergence analysis, we selected the grid division scheme, as shown in Figure 20, and imposed constraints based on the actual loading device.
Figure 20.
Finite element models and the meshing plan. (a) Equipped with cross-section steel model. (b) Equipped with H-section model. (c) Steel fiber model.
5.2. Definition of Material Properties
The compressive capacity and deformation capacity of concrete can be significantly improved under the lateral restraint. Scholars have proposed a variety of constitutive curves of concrete under restraint. Among them, the constitutive relationship of restrained concrete proposed by Mander et al. [52] considered factors, such as the stirrup ratio, stirrup strength, stirrup form, and the concrete compressive strength; the expression is as follows:
| (9) |
where σ is the concrete stress; fcc is the compressive strength of concrete considering the lateral restraint effect; x = ε/εcc; ε is the concrete strain Esec = fcc/εcc, fcc = kfc0, εcc = [1 + 5(k − 1)]εc0, Ec, Esec are the elastic modulus and secant modulus of concrete; fc0 is the axial compressive strength of concrete; k is the strength improvement coefficient of constrained concrete.
For unconstrained concrete, k = 0; for concrete in the area confined by stirrups, Mander gives the calculation method as:
| (10) |
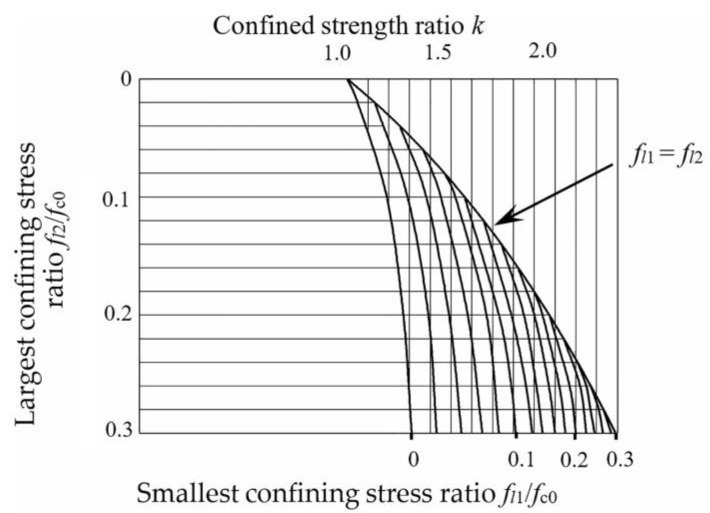
where fc0 is the axial compressive strength of concrete and fl′ is the effective lateral restraint stress [53] for the concrete in the effective confinement area of section steel and stirrups. Combined with the calculation method of effective restraint stress of section steel given by Zhao et al. [54] and the theory of linear superposition of restraint of joint restraint area proposed by Feng et al. [55], the triaxial figure proposed by Mander can be used to determine the strength improvement coefficient k, as shown in Figure 21.
Figure 21.
Triaxial diagram of confined concrete strength improvement coefficient.
The material performances of sectioned steel and reinforcing steel adopt an ideal elastoplastic constitutive model, and its mechanical performance index was adopted according to the results of the material property test. As shown in Table 6, combined with related research and design specifications, the simulation parameters of steel fiber were determined.
Table 6.
Simulation parameters of steel fibers.
| Type | fsf/MPa | ρf/% | df/mm | lf/mm | lf/df |
|---|---|---|---|---|---|
| Flat | 400 | 1.0 | 0.8 | 60 | 75 |
fsf, ρ, df, lf represent the tensile strength, volume content, diameter, and length of steel fiber, respectively.
5.3. Analysis Result
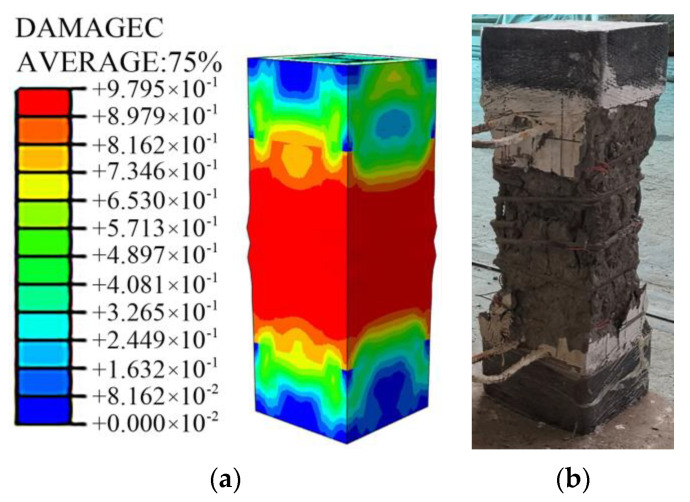
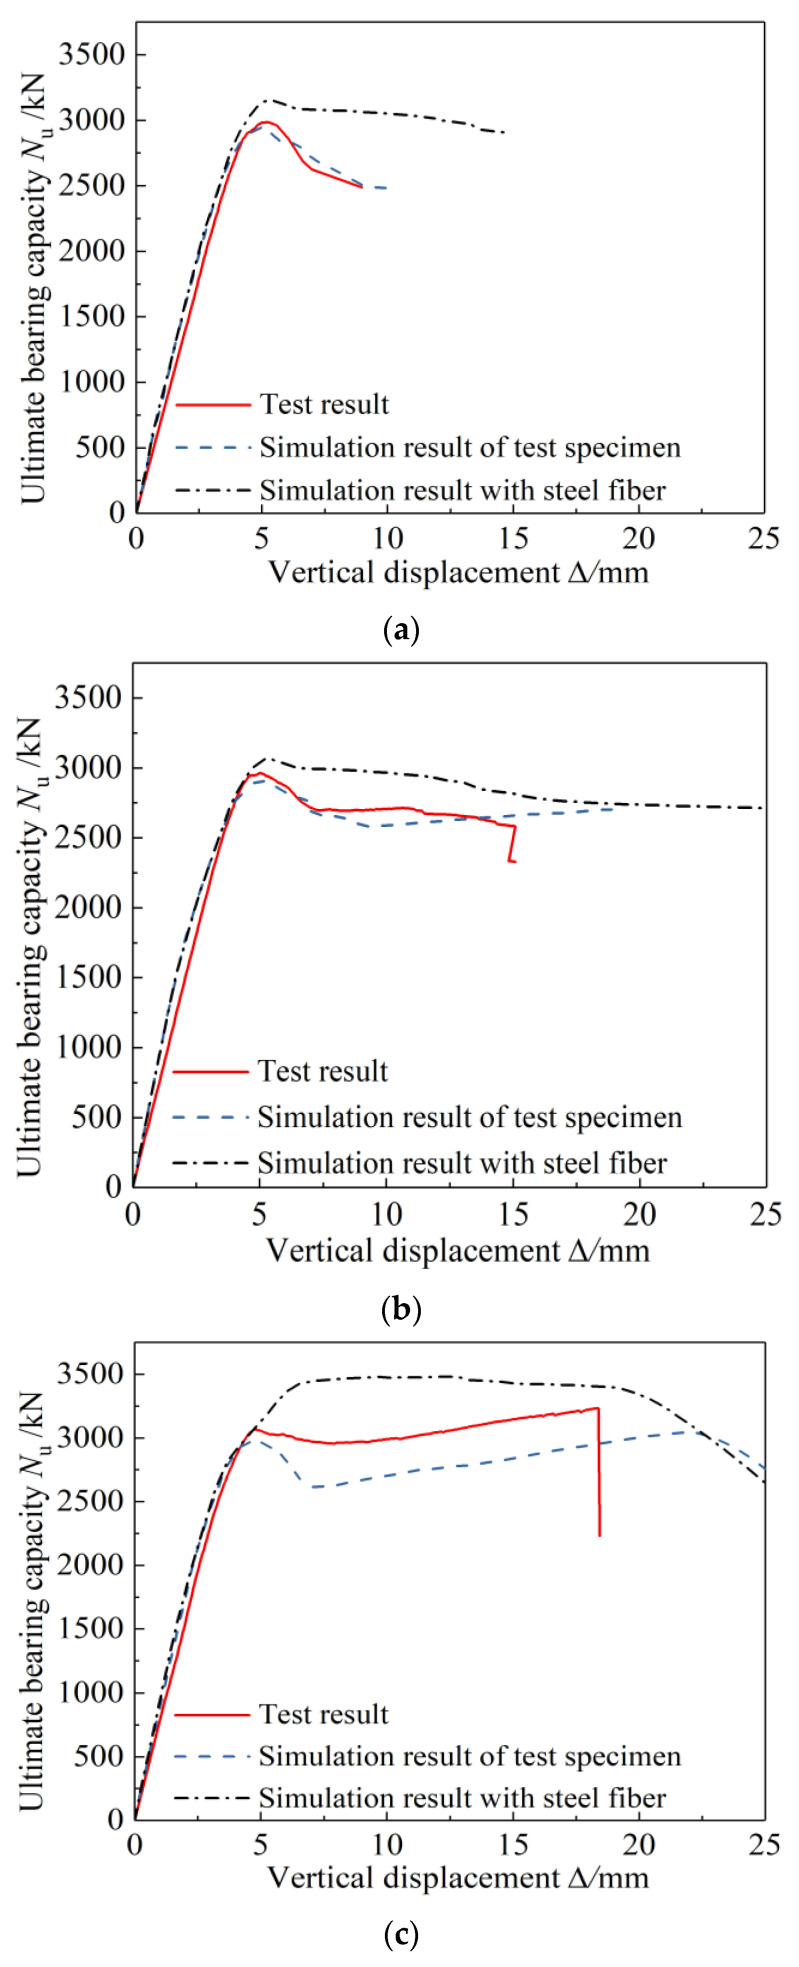
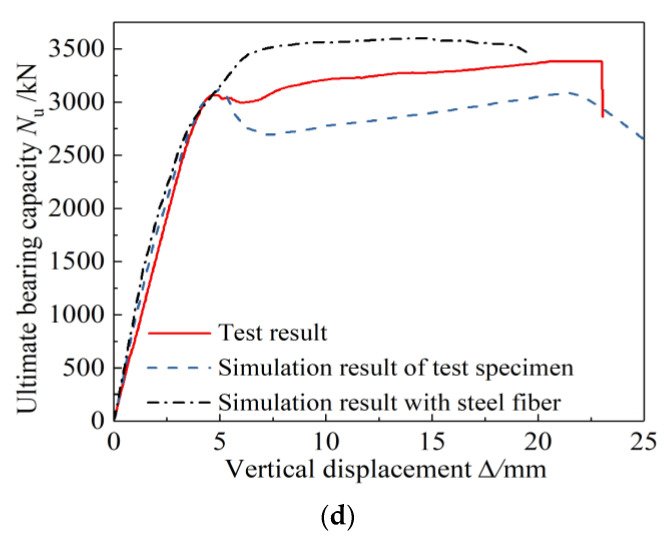
As shown in Figure 22, the damage pattern of the simulation analysis was in good agreement with the test results. Figure 23 shows the test results of typical specimens and the load-displacement curves of the simulation results before and after the concrete was added with steel fiber. The simulation curve without steel fiber was in good agreement with the test result curve, indicating that the model can simulate and analyze the stress process of this type of specimen accurately; the reinforcement of fibers had little effect on the ultimate bearing capacity of specimens equipped with Q460 steel. However, it can significantly enhance the ultimate bearing capacity of the specimens equipped with Q690 steel so that the strength can be fully exerted. Compared with the simulation results of the specimens without steel fibers, the simulation results with steel fibers of the bearing capacity of specimens A7 and A8 increased by 15.5% and 13.9%, respectively.
Figure 22.
Comparison between simulated failure modes and test results. (a) Simulated failure mode, (b) test result.
Figure 23.
Comparison of load-displacement curves between two simulation results with test results. (a)A3, (b) A4, (c) A7, (d) A8.
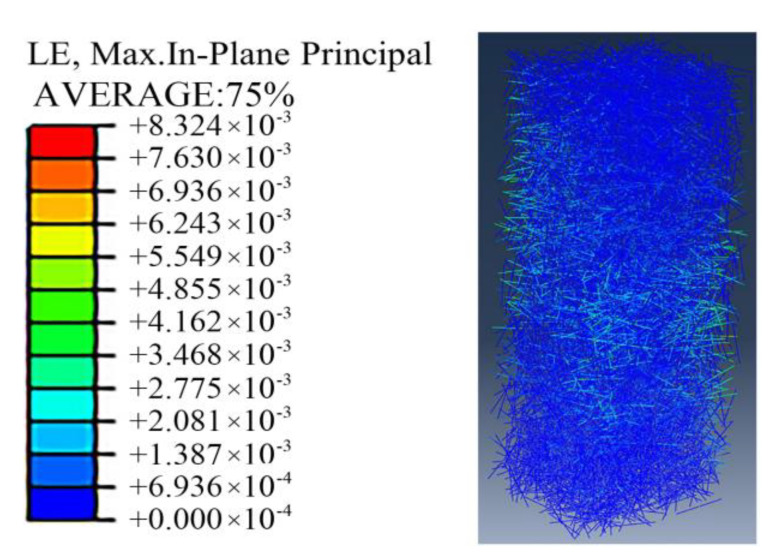
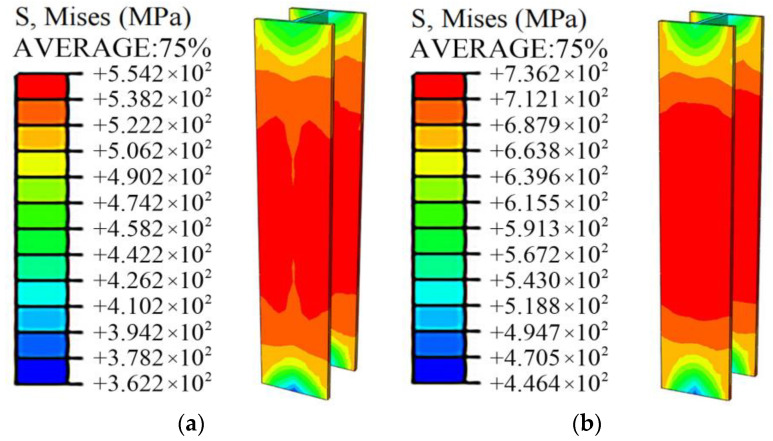
As shown in Figure 24, in the process of concrete compression, the steel fibers distributed along the cross-section of the specimen at the place where the concrete stress is relatively large produced obvious tensile strain. As shown in Figure 25, by comparing and analyzing the stress cloud diagram of section steel, it can be observed that after the concrete is reinforced by steel fiber, when the specimen reaches the ultimate bearing capacity, Q690 steel reaches the yield state, which can give full play to the strength of the material. The passive restraint measure provides a lateral restraint effect for the concrete, which can enhance the deformability of the full-section concrete to match the Q690 high-strength steel.
Figure 24.
Simulation results of steel fiber strain.
Figure 25.
Effect of steel fiber reinforcement on the stress of Q690 steel. (a) Without steel fiber, (b) incorporation of steel fiber.
At present, scholars have conducted research on the deformation performance of steel fiber concrete [56,57,58,59,60]. Based on the analysis of the test results, the conditions that the high-strength steel is applied to the SRC columns are put forward: fcc ≥ fy/Es. To meet this condition, the peak strain of concrete can be increased by adding steel fiber so that it is not less than the yield strain of sectioned steel to ensure that the mechanical performance of high-strength sectioned steel can be fully exerted.
6. Conclusions
In this paper, the axial load test, theoretical analysis, and ABAQUS simulation of eight HSSRC columns equipped with Q460 and Q690 steel and four SRC columns equipped with Q235 steel were carried out. The conclusions are as follows:
-
(1)
For the specimens with the same steel ratio, the bearing capacity and ductility of SRC columns increase with the increase of steel strength. Compared with the specimens with Q235 steel, the bearing capacity and the ductility of the specimens equipped with Q460 steel increased by 7.8–15.3%, 21.2–135.3%, respectively; the bearing capacity and the ductility of the specimens equipped with Q690 steel increased by 13.2–24.1%, 84.1–245.4%, respectively.
-
(2)
For the specimens with the same strength grade, the bearing capacity and ductility of SRC columns can be significantly improved by increasing the steel ratio. Compared with the specimens equipped with a 3.63% steel ratio, the bearing capacity and ductility of the specimens equipped with 5.13% steel ratio increased by 5.8–13.6%, 29.6–38.2%, respectively; the bearing capacity and the ductility of the specimens equipped with a 6.20% steel ratio increased by 11.5–18.6%, 48.8–176.0%, respectively.
-
(3)
For the specimens with the same steel ratio, when the form of steel section is transformed from H-section to cross-section, in terms of bearing capacity, the bearing capacity of SRC columns did not change significantly; in terms of ductility, when the steel grade was Q460, the ductility of the specimen equipped with cross-section steel was 95.2% higher than the ductility of the specimen equipped with H section. When the steel grade was Q690, the ductility of the specimens equipped with H-section and cross-section steel were both very excellent.
-
(4)
Comparing the test results with the calculation results of the existing approach, it is found that the existing calculation approach can accurately calculate the axial bearing capacity of SRC columns equipped with Q460 steel, but it is unable to calculate the axial bearing capacity of SRC columns equipped with Q690 steel. Therefore, the method of determining the effective compressive strength of high-strength steel in SRC columns is proposed. The results show that this method can accurately calculate the axial bearing capacity of HSSRC columns and apply the calculation results to engineering applications.
-
(5)
The simulation results show that the bearing capacity of HSSRC columns with added steel fibers is higher than the HSSRC columns without steel fibers. Therefore, steel fibers are suggested to be incorporated into the HSSRC columns.
7. Research Limitation
In this paper, the axial load test of HSSRC short columns was carried out, and the conclusions were obtained by combining theoretical analysis. However, the research still has limitations:
-
(1)
The parameters studied in this paper were the influence of the steel grade, the steel ratio, and the section form of the steel. Subsequently, parameters such as slenderness ratio, stirrup form, and concrete strength can be added for the test.
-
(2)
Based on the theoretical analysis, this paper proposed to improve the deformation performance of concrete by steel fibers to make full use of the compression performance of high-strength steel, which is verified by an ABAQUS simulation. The conclusion can be verified by experiments.
Author Contributions
J.W. proposed the topic of this study, designed this test, calculated the results according to the codes, and analyzed the data; X.W. performed simulation calculations, proposed the modified method for calculation, and wrote the original draft; Y.D. checked the data; Y.S. directed the numerical simulation method; X.Y. revised the final version of the manuscript. All authors have read and agreed to the published version of the manuscript.
Funding
This research is financially supported by the Key program of the Natural science foundation project of Heilongjiang province (ZD2019E001) and the Fundamental Research Funds for the Central Universities (2572019CT01).
Institutional Review Board Statement
Not applicable.
Informed Consent Statement
Not applicable.
Data Availability Statement
The data presented in this study are available on request from the corresponding author.
Conflicts of Interest
The authors declare no conflict of interest.
Footnotes
Publisher’s Note: MDPI stays neutral with regard to jurisdictional claims in published maps and institutional affiliations.
References
- 1.Bin H., Wenfu Z. Local-overall interactive buckling of high strength steel welded I-section columns under axial compression. Thin Wall Struct. 2020;157:106964. [Google Scholar]
- 2.Xianlei C., Geng Z., Zhengyi K., Hao S., Chao C., Zongping C., SeungEcok K. Experimental study on local buckling of 800 MPa HSS welded I-section columns under axial compression. Thin Wall Struct. 2020;155:106878. [Google Scholar]
- 3.Jie W., Jin D., Qian Z., Fengjiang Q. Overall buckling behaviour of Q420-Q960 steel welded H-section axial compression members. Eng. Struct. 2021;249:113340. [Google Scholar]
- 4.Gang S., Huiyong B., Yuanqing W. Overview of research progress for high strength steel structures. Eng. Plast. Appl. 2013;30:1–13. [Google Scholar]
- 5.Ilawe N.V., Zimmerman J.A., Wong B.M. Breaking badly: DFT-D2 gives sizeable errors for tensile strengths in Palladium-Hydride solids. J. Chem. Theroy Comput. 2015;11:5426–5435. doi: 10.1021/acs.jctc.5b00653. [DOI] [PubMed] [Google Scholar]
- 6.Ji H., Lee Jong H., Park A.S. Assessing the Influence of van der Waals Corrected Exchange-Correlation Functionals on the Anisotropic Mechanical Properties of Coinage Metals. Phys. Rev. B. 2016;94:024108. [Google Scholar]
- 7.Junsheng S., Junjie W., Wenbiao W., Zhengfang D., Bo L. Comparative experimental research on seismic performance of rectangular concrete columns reinforced with high strength steel. J. Build. Struct. 2014;35:20–27. [Google Scholar]
- 8.Qingxuan S., Licheng M., Qiuwei W., Bin W., Kun Y. Seismic performance of square concrete columns reinforced with grade 600 MPa longitudinal and transverse reinforcement steel under high axial load. Structures. 2021;32:1955–1970. [Google Scholar]
- 9.Jiabao Y., Xinyan Y., Yunbiao L., Xuchuan L., Lingxin Z. Studies on axial compression behaviors of concrete-filled steel tubular columns at low temperature. J. Build. Struct. 2021;42:248–255. doi: 10.14006/j.jzjgxb.2021.S2.0029. [DOI] [Google Scholar]
- 10.Lingyue L., Jian C. A new method to calculate axial bearing capacity of composite columns with core of high-strength concrete-filled steel tube. J. South China Univ. Technol. Nat. Sci. Ed. 2010;38:26–31. [Google Scholar]
- 11.Guochang L., Bowen C., Zhijian Y., Yaopeng L., Yihe F. Experimental and numerical behavior of eccentrically loaded square concrete-filled steel tubular long columns made of high-strength steel and concrete. Thin Wall Struct. 2021;159:107289. doi: 10.1016/j.tws.2020.107289. [DOI] [Google Scholar]
- 12.Jiangang W., Xia L., Zhichao L., Amit H.V. Experimental behavior and design of high-strength circular concrete-filled steel tube short columns. J. Struct. Eng. 2020;146:04019184. [Google Scholar]
- 13.Jian C., Xiaofeng X., Chun Y., Jiangang H., Haifeng C. An Experimental Research on the Composite Column with Core of High-Strength Concrete Filled Steel Tube under Axial Compression Loading. J. South China Univ. Technol. Nat. Sci. Ed. 2022;30:81–85. [Google Scholar]
- 14.Yanlei W., Yonghua G., Qing S., Bin Z. Study on local stability of Q690 high-strength steel tube under axial compression. Chn. J. Civ. Eng. 2013;46:1–12. doi: 10.15951/j.tmgcxb.2013.05.012. [DOI] [Google Scholar]
- 15.Xianlin W., Yuqing L., Fei Y., Yuanchun L., Xuefeng L. Effect of concrete cover on the bond-slip behavior between steel section and concrete in SRC structures. Constr. Build. Mater. 2019;229:116855. [Google Scholar]
- 16.Chanchan Z., Guangyong W., Yinxing L. Fire performance of restrained steel reinforced concrete columns. J. Build. Struct. 2021;62:46–55. doi: 10.14006/j.jzjgxb.2021.0001. [DOI] [Google Scholar]
- 17.Qiliang L., Xishan H., Dong C. Joints detailed design and engineering application of steel reinforced concrete composite structure. Constr. Technol. 2013;42:42–44. doi: 10.7672/sgjs2013240042. [DOI] [Google Scholar]
- 18.Shuren Z. Experimental study on seismic performances of steel reinforced concrete beam-column joints in Yinchuan Green Space Center. Build. Struct. 2021;51:44–48. doi: 10.19701/j.jzjg.2021.12.008. [DOI] [Google Scholar]
- 19.Linfei P., Huiyi W., Tianli J., Shen T. Steel structure desigin of trestle bridge in gas pipeline engineering. Eng. J. Wuhan Univ. 2020;53:59–64. [Google Scholar]
- 20.Mingqiang L., Fengjuan D., Weishan J. Research on high-strength concrete SRC column. Sci. Tech. Info. 2010;25:722. [Google Scholar]
- 21.Chang-Soo K., Hong-Gun P., Ho-Jun L., In-Rak C., Kyung-Soo C. Eccentric axial load test for high-strength composite columns of various sectional configurations. J. Struc. Eng. 2017;143:04017075. [Google Scholar]
- 22.Chang-Soo K., Hong-Gun P. Eccentric axial load testing for concrete-encased l-section columns using 800 MPa steel and 100 MPa concrete. J. Struct. Eng. 2012;138:1019–1031. [Google Scholar]
- 23.Yangming G., Jingfeng W., Qihan S., Zhaodong D., Xingqiao S. Experimental study on axial compressive performance of HRB635 grade hot-rolled ribbed high-strength reinforced concrete short column. J. Hefei Univ. Technol. Nat. Sci. 2021;44:1370–1384. [Google Scholar]
- 24.Yizhu L., Shuangyin C., Hang L., Xiangyong N., Denghu J. Axial compressive behavior of concrete columns with grade 600 MPa reinforcing bars. Eng. Struct. 2018;172:497–507. [Google Scholar]
- 25.Yizhu L. Southeast Doctoral thesis. Southeast University; Nanjing, China: 2019. Experimental and theoretical research on mechanical behavior of RC columns with 600MPa reinforcing bars. [DOI] [Google Scholar]
- 26.Khalajestani M.K., Parvez A., Foster S.J., Valipour H., McGregor G. Concentrically and eccentrically loaded high-strength concrete columns with high-strength reinforcement: An experimental study. Eng. Struct. 2021;248:113251. doi: 10.1016/j.engstruct.2021.113251. [DOI] [Google Scholar]
- 27.Yanbo W., Ci S., Xingyuan Z., Guoqiang L. Experimental research on axial compressive bearing capacity of high-strength concrete filled steel tubular short columns. J. Struc. Eng. 2021:1–17. doi: 10.14006/j.jzjgxb.2021.0203. [DOI] [Google Scholar]
- 28.Yansheng D., Dinghui G., Zhihua C., Zihan Z., Xiaodun W. Behaviors of FRP confined rectangular concrete-filled thin-walled steel tubular stub columns using high-strength materials under axial load. Compos. Struct. 2022;280:114915. doi: 10.1016/j.compstruct.2021.114915. [DOI] [Google Scholar]
- 29.Jiangang W., Xia L., Zhijing O., Baochun C. Experimental study on axial compressive behavior of circular UHPC filled high-strength steel tube short columns. J. Struct. Eng. 2020;41:16–28. doi: 10.14006/j.jzjgxb.2019.0337. [DOI] [Google Scholar]
- 30.Yancheng C., Meini S., Xuerui C., Ben Y. High strength steel square and rectangular tubular stub columns infilled with concrete. J. Constr. Steel Res. 2021;179:106536. doi: 10.1016/j.jcsr.2021.106536. [DOI] [Google Scholar]
- 31.Han F., Tak-Ming C., Ben Y. Structural performance of concrete-filled cold-formed high-strength steel octagonal tubular stub columns. Eng. Struct. 2021;239:112360. doi: 10.1016/j.engstruct.2021.112360. [DOI] [Google Scholar]
- 32.Zhu J.Y., Chan T.M. Experimental investigation on octagonal concrete filled steel stub columns under uniaxial compression. J. Constr. Steel Res. 2018;147:457–467. doi: 10.1016/j.jcsr.2018.04.030. [DOI] [Google Scholar]
- 33.Ehab E., Ben Y. Eccentrically loaded concrete encased steel composite columns. Thin Wall Struct. 2010;49:53–65. [Google Scholar]
- 34.Jun W., Wenze S., Jinyou Z., Yu S., Xinran W. Experimental study on eccentric loaded high strength H-section steel reinforced concrete composite column. J. Struct. Eng. 2021:1–10. doi: 10.14006/j.jzjgxb.2021.0109. [DOI] [Google Scholar]
- 35.Lai B., Liew J.R. Axial-moment interaction of high strength concrete encased steel composite columns: Design recommendation. J. Constr. Steel Res. 2020;175:106370. doi: 10.1016/j.jcsr.2020.106370. [DOI] [Google Scholar]
- 36.Li S., Liew J.R., Xiong M.-X., Lai B.-L. Experimental investigation on fire resistance of high-strength concrete encased steel composite columns. Fire Safety J. 2021;121:103273. doi: 10.1016/j.firesaf.2020.103273. [DOI] [Google Scholar]
- 37.Li S., Liew J.R., Xiong M.-X. Fire performance of composite columns made of high strength steel and concrete. J. Constr. Steel Res. 2021;181:106640. doi: 10.1016/j.jcsr.2021.106640. [DOI] [Google Scholar]
- 38.Yiting Y., Zhaoxin H., Guoqiang L., Chao G., Suwen C. Study on mechanical properties of Q460 high-strength SRC circular column under axial compression. Steel Constr. 2016;31:24–31. [Google Scholar]
- 39.Yiting Y., Zhaoxin H., Chao G., Yan W. Analysis on influencing factors of seismic performance for high-strength steel reinforced concrete columns. Prog. Steel Build. Struct. 2018;20:11–21. [Google Scholar]
- 40.ANSI/AISC360-2016 . Specification for Structural Steel Buildings. AISC Committee on Specifications; Chicago, IL, USA: 2016. [Google Scholar]
- 41.Eurocode 4: Design of Composite Steel and Concrete Structures Part 1-1: General rules for buildings: EN 1994-1-1:2004. European Committee for Standardization; Brussels, Belgium: 2004. [Google Scholar]
- 42.JGJ138-2016 . Code for Design of Composite Structures. Architecture and Building Press; Beijing, China: 2016. [Google Scholar]
- 43.GB/T228-2010 . Chinese Standard for Metallic Materials-Tensile Testing at Ambient Temperature. Architecture and Building Press; Beijing, China: 2010. [Google Scholar]
- 44.GB/T50152-2012 . Standard for Test Methods of Concrete Structures. Architecture and Building Press; Beijing, China: 2012. [Google Scholar]
- 45.Duarte A.P.C., Silva B.A., Silvestre N., de Brito J., Júlio E., Castro J.M. Experimental study on short rubberized concrete-filled steel tubes under cyclic loading. Compos. Struct. 2016;136:394–404. doi: 10.1016/j.compstruct.2015.10.015. [DOI] [Google Scholar]
- 46.Jiuru T. Seismic Resistance of Joints in Reinforced Concrete Frames. Southeast University Press; Nanjing, China: 1989. [Google Scholar]
- 47.Eurocode 3: Design of steel structures-Part 1-1: General Rules and Rules for Buildings: EN 1993-1-1:2005. European Committee for Standardization; Brussels, Belgium: 2005. [Google Scholar]
- 48.Shengping C., Liang N., Yingfa L., Xiao T. Experimental study on the effect of steel fiber on the axial compressive properties of concrete. J. Hubei Univ. Technol. 2020;35:97–101. [Google Scholar]
- 49.Liang N. Research on Uniaxial Compression Performance and Constitutive Relationship of Steel Fiber Reinforced Concrete. Hubei University of Technology; Wuhan, China: 2020. [Google Scholar]
- 50.Xiaofei W., Xiaohu Z., Pingyang W., Licheng Wu Jing L. Numerical Modeling Method of Steel Fiber Reactive Powder Concrete. J. Build. Struct. 2015;36:340–345. [Google Scholar]
- 51.Ehab E., Ben Y. Numerical simulation of concrete encased steel composite columns. J. Constr. Steel Res. 2011;67:211–222. [Google Scholar]
- 52.Mander J.B., Priestley M. Theoretical Stress-Strain Model for Confined Concrete. J. Struct. Eng. 1988;114:1804–1826. doi: 10.1061/(ASCE)0733-9445(1988)114:8(1804). [DOI] [Google Scholar]
- 53.Xianzhong Z., Fuping W. Theoretical Study on Confinement Mechanism and Stress-strain Model for Steel Confined Concrete in SRC Columns. Eng. Plast. Appl. 2018;35:36–46. [Google Scholar]
- 54.Chengchih C., Nanjiao L. Analytical model for predicting axial capacity and behavior of concrete encased steel composite stub columns. J. Constr. Steel Res. 2006;62:424–433. [Google Scholar]
- 55.Junjie F., Guansheng Y. Uniaxial compressive behavior of hook-end steel and macro-polypropylene hybrid fibers reinforced recycled aggregate concrete. Constr. Build. Mater. 2021;304:124559. [Google Scholar]
- 56.Langfei G., Jianlan Z., Yaliang C. Study on Axial Compression Stress-strain Full Curves of High Strength Steel Fiber Reinforced Concrete. J. Fuzhou Univ. Nat. Sci. Ed. 2005;4:501–503. [Google Scholar]
- 57.Xuming G. Research on the Performance of UHPC with Steel Fiber. HuNan University; Changsha, China: 2013. [Google Scholar]
- 58.Seongcheol L., Jounghwan O. Compressive Behavior of Fiber-Reinforced Concrete with End-Hooked Steel Fibers. Materials. 2015;8:1442–1458. doi: 10.3390/ma8041442. [DOI] [PMC free article] [PubMed] [Google Scholar]
- 59.Shunbo Z., Mingshuang Z., Xiaoyan Z., Zhenjing P., Tinghua H. Study on Complete Stress-strain Curves of Steel Fiber Reinforced Lightwight Aggregate Concrete under Uniaxial Compression. J. Build. Struct. 2019;40:181–190. [Google Scholar]
- 60.Guojie X., Chuanlin W., Jiamiao Z., Zeping L., Tengteng Z., Yuxuan Z. Influence of Steel Fiber Shape on the Performance of High-performance Concrete. Acta Mater. Composit. Sin. 2021;38:4313–4324. doi: 10.13801/j.cnki.fhclxb.20210210.003. [DOI] [Google Scholar]
Associated Data
This section collects any data citations, data availability statements, or supplementary materials included in this article.
Data Availability Statement
The data presented in this study are available on request from the corresponding author.


