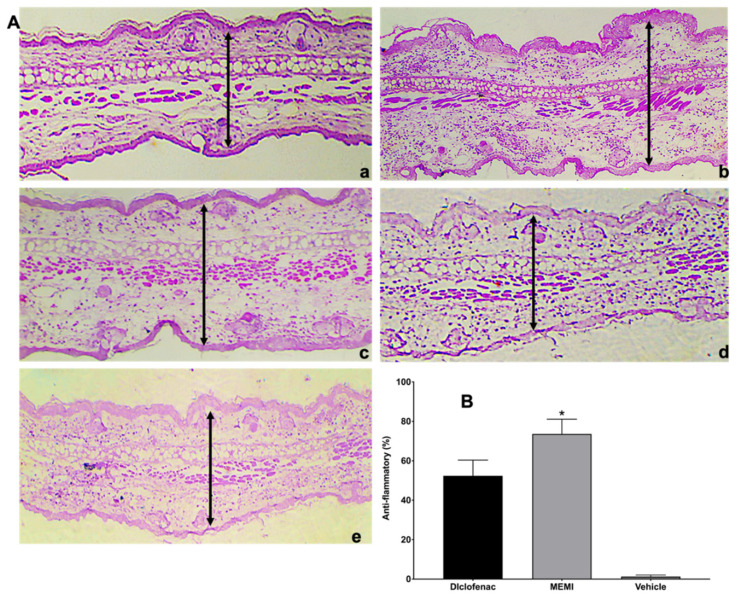
Figure 8.
Histological analysis of MEMI. (A) Auricular edema histological sections (10×). (a) Control group (left ear), normal sample tissue. (b) Treated group with only TPA; it is noted that there is too much edema and leucocitary infiltrate. (c) Diclofenac-treated group presents moderate inflammatory infiltrate cells and edema. (d) group treated with MEMI 10%; moderate leucocitary infiltrate and less edema is noted. (e) Vehicle-treated group showed edema and moderate leucocitary infiltrate. The simples were dyed with H&E, and the black arrows indicate the measurement of the inflammatory thickness of the ears of the mice. (B) Anti-inflammatory percentage of the TPA model. There are no significant differences among MEMI and diclofenac groups. The results were expressed as the median ± S.D.M. Two-way analysis of variance was followed by the Tukey test. * p < 0.05 compared to the diclofenac and vehicle groups.

