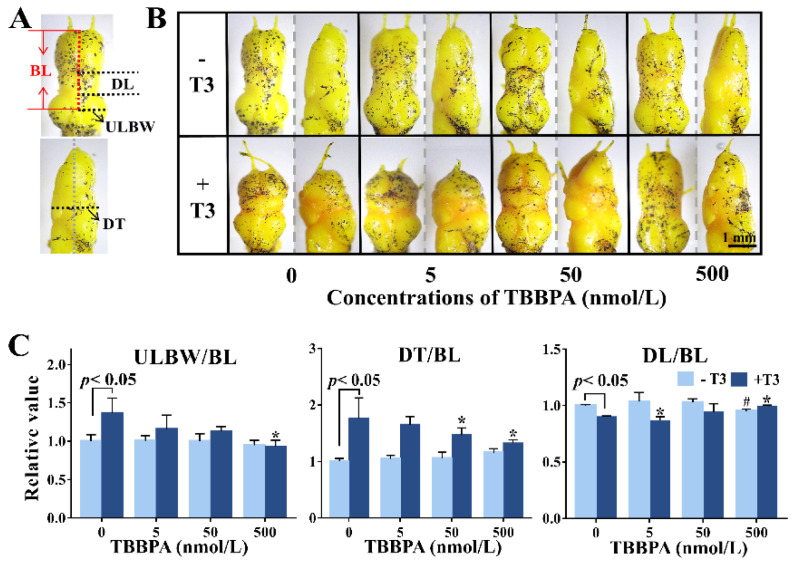
Figure 3.
Brain morphological changes of premetamorphic Xenopus laevis following four-day exposure to tetrabromobisphenol A (TBBPA) in the absence or presence of 1 nmol/L T3. (A) Schematic description of measurement parameters. DL for diencephalon length, ULBW for unilateral brain width, BL for brain length, and DT for diencephalon thickness. (B) Representative morphology of the elevation view and side view of the brain. (C) Quantitative analysis result of brain parameters. Each parameter was normalized by the mean value of the solvent control tadpoles. Data are shown as mean ± SD. # indicates significant differences between TBBPA treatment and solvent control treatment (p < 0.05). * indicates significant differences between TBBPA + T3 treatment and T3 treatment (p < 0.05).

